Analysing Poverty Workshop: Basic Concepts by Channing Arndt
34
ANTECENDENTES E CONCEITOS BASICOS Curso sobre Análise de Pobreza Maputo, 6-10 Julho 2015 REPÚBLICA DE MOÇAMBIQUE MINISTÉRIO DA ECONOMIA E FINANÇAS DIRECÇÃO NACIONAL DE ESTUDOS E ANÁLISE DE POLÍTICAS
-
Upload
united-nations-university-world-institute-for-development-economics-research -
Category
Economy & Finance
-
view
15 -
download
0
Transcript of Analysing Poverty Workshop: Basic Concepts by Channing Arndt

ANTECENDENTES E CONCEITOS BASICOS
Curso sobre Análise de PobrezaMaputo, 6-10 Julho 2015
REPÚBLICA DE MOÇAMBIQUEMINISTÉRIO DA ECONOMIA E FINANÇAS
DIRECÇÃO NACIONAL DE ESTUDOS E ANÁLISE DE POLÍTICAS
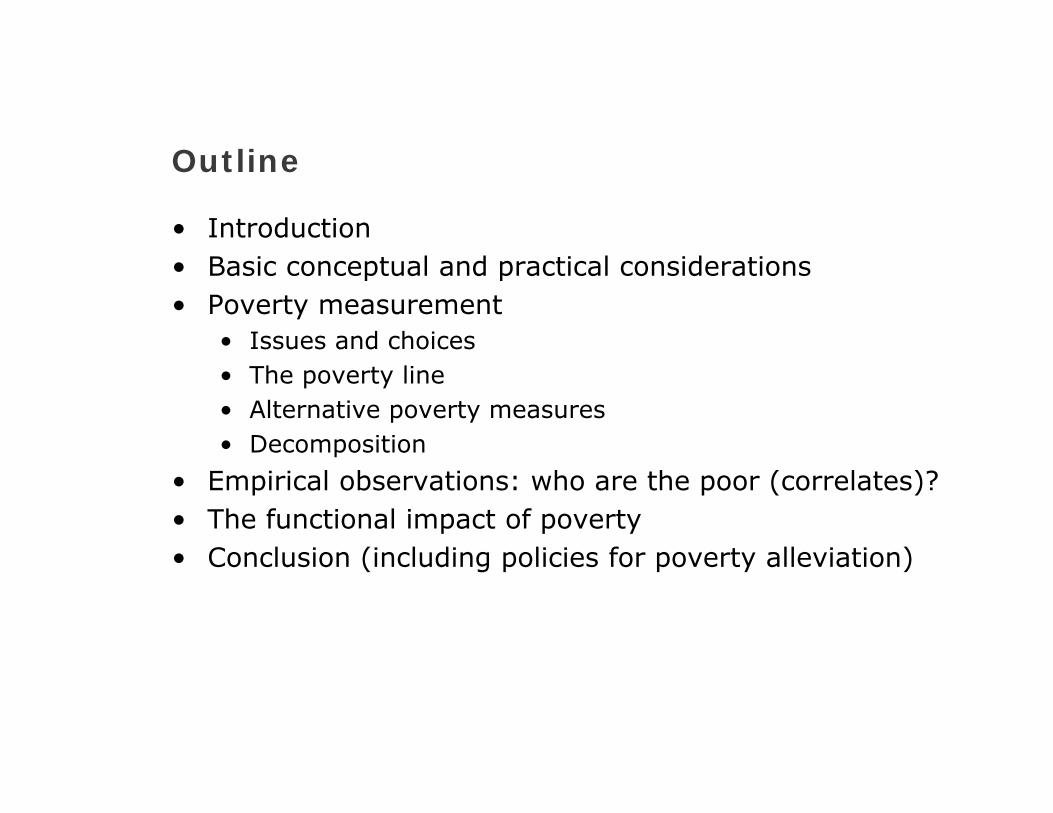
Outline
• Introduction• Basic conceptual and practical considerations• Poverty measurement
• Issues and choices• The poverty line• Alternative poverty measures• Decomposition
• Empirical observations: who are the poor (correlates)? • The functional impact of poverty• Conclusion (including policies for poverty alleviation)

Introduction
• Why focus on poverty? Ethical (normative) considerations (basic human right) Functional (positive) considerations Coming to grips with the nature of the development process:
No guarantee for trickle-down to poor groups – is growth pro-poor?
The growth-poverty-inequality triangle• Global poverty headcount
1990: HC > 1 billion individuals – and it continues high … even if considerable global progress can be noted over the last two decades (the MDGs)
Expectations versus reality (at global and at national levels)• In the economic definition of poverty there is typically an
emphasis on income or consumption, but…

The experience of poverty is multidimensional
When one is poor, she has no say in public, she feels inferior. She has no food, so there is famine in her house; no clothing, and no progress in her family.
WOMAN IN UGANDA
When food was in abundance relatives used to share it. These days of hunger, however, not even relatives would help you by giving you some food
- YOUNG MAN IN ZAMBIA
When my husband died, my in-laws told me to get out. So I came to town and slept on the pavement.
- MIDDLE-AGED WIDOW IN KENYA
Source: World Bank: Voices of the poor 2002

So poverty in reality also refers to …
• Housing• Personal security• Vulnerability to external shocks• Absence of morbidity• Opportunities to learn• Access to social life, markets and politics • Freedom from discrimination and dependence• Etc.
Poverty is in reality inherently subjective in nature: Still, a core problem(at least in poorer countries) is lack of income and assets which can give access – but note access is broader!

Dimension Component Indicators
Economic Consumption and income
Head count index (poverty lines) Poverty gap
Social Nutrition Calorie intake to requirement and anthropometric measures
Sanitation and water
Access to sanitation and potable water
Health Access to primary health care, family planning, and immunisation
Education Primary school enrolment rate and literacy rates
Enabling Means of production
Access to land, access to employment
environment Natural endowments
Agro-climatic conditions
Geographic infrastructure
Access to service providers and to markets
A variety of measures – just to illustrate

Conceptual and practical issues surrounding poverty measurement
• Poverty line at the core• Income-/expenditure-data vs. consumption-data• Absolute vs. relative poverty• Temporary vs. chronic poverty• Household vs. individual poverty• National and international poverty lines – an example
These points to be discussed one by one in what follows

The poverty line: the foundation for poverty measurement
Definition of poverty line “Represents a minimum level of “acceptable” economic
participation in a given society at a given point in time” The global poverty line of 1 US$ (one dollar a day) (revised)
Definition of poverty Income/expenditure below poverty line (0-1)
A standard measurement methodNutrition-based minimum expenditure need (to achieve 2,150
calories/day) -> the cost of basic human needs (CBN) bundle (food and non-food)
Remember:• Just above or just below may be equally bad. Global number of
poor more than doubles if poverty line is raised to 2 US$ (revised)
• Differences across countries - the PPP adjustment• Differences within countries (urban versus rural and over time)

Income/expenditure-data vs. consumption-data
Is a person poor when the actual, observed consumption basket falls below a threshold or when the total income/expenditure falls below the minimum required to achieve this threshold?
Not the same: an example the ascetic rich, and nutrition levels may not rise with rising income
Total consumption-dataWillingness to consume
Total income/expenditure-dataCapacity to consume

Absolute vs. relative poverty Absolute (fundamental) needs
Food/nutrition (calories, vitamins, etc.) (inherently relative to many things) (even if there exists biological imperatives, but…)
And clothing? And shelter? ”Acceptable level of participation” not so clear
Relative (fundamental) needs Radio/television Bicycle
Poverty lineDetermined relative to socioeconomic standards (food-non-
food) Yet, remains absolute (income/expenditure) measure: items
must fulfill some absolute notion of the ability to function in society)
How not to define the poverty line: poverty = % with less than half of average income (confuses poverty and inequality)
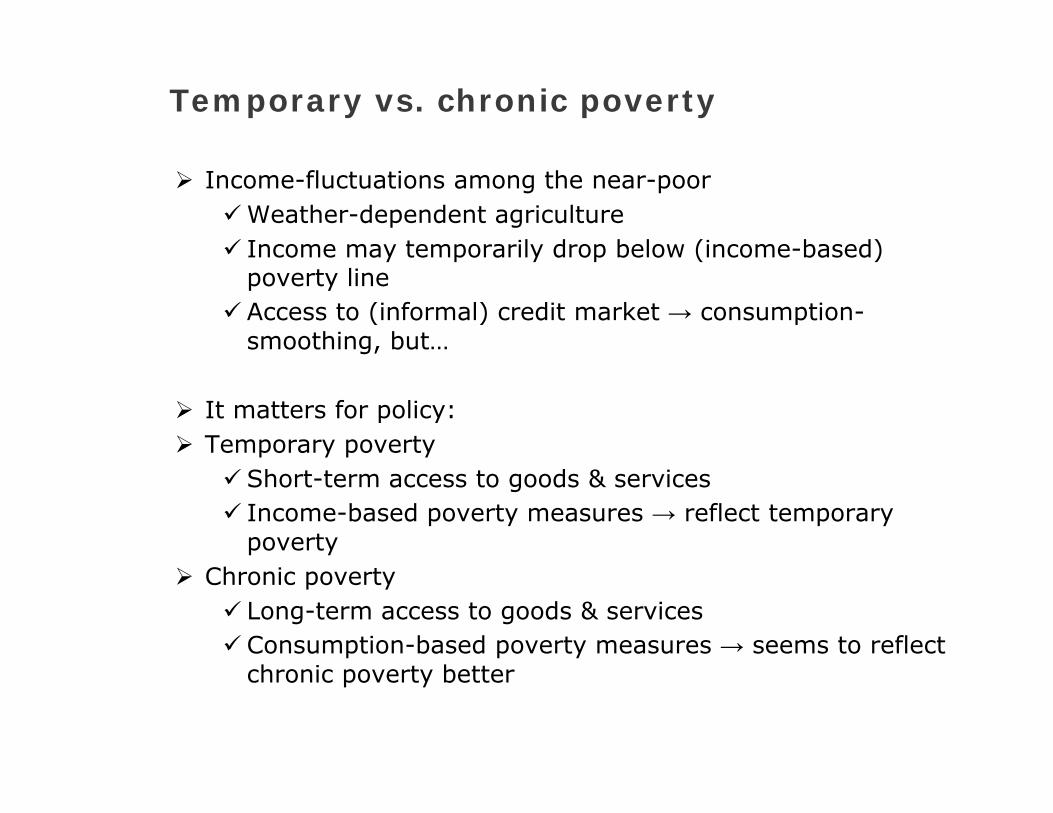
Temporary vs. chronic poverty
Income-fluctuations among the near-poorWeather-dependent agriculture Income may temporarily drop below (income-based)
poverty line Access to (informal) credit market → consumption-
smoothing, but…
It matters for policy: Temporary poverty
Short-term access to goods & services Income-based poverty measures → reflect temporary
poverty Chronic poverty
Long-term access to goods & services Consumption-based poverty measures → seems to reflect
chronic poverty better

Household vs. individual poverty
Expenditure/consumption data only available at household level
Intra-household allocationSkewed against females/elderly (why?)Need for complementary micro-studies
Adult equivalence scalesLow consumption needs of children
Fixed costs/IRTS in running familyPoor families with many children → overstatement of
poverty
12

International vs. National Poverty lines? A Warning
11% 12%9%
7% 6%
28%32%
29%
17%17%
1987 1990 1993 1996 1999
$1/day poverty line National poverty line
China: percentage of the population below the poverty line

Measurement is difficult
Which measure
Measurement error
Poverty line: focus on extreme poor or poor?
Aggregation and substitution, and how to go from nominal to real?
Robustness
Political objectives and norms

Note!
• Poverty lines are always approximations to a threshold that is fuzzy
• Especially when we recall that poverty effects are often felt at a later stage
• Quantitative estimates are not to be memorized and taken as nothing but approximations: don’t do 5 decimals!!!! And remember confidence intervals.

Poverty measures
Headcount Ratio (HCR) HC = ∑i=1,n1(yi<p)
HCR = HC/n (n = population size) Focus: Relative incidence of poverty – no attention to depth of
poverty or inequality among the poor Poverty Gap Ratio (PGR)
PG = ∑i=1,n(p-yi)1(yi<p)
PGR = PG/(m*n) (where m = mean income) Focus: Relative amount of resources required to eradicate poverty
(may look small in unequal societies) Income Gap Ratio (IGR)
IGR = PG/(HC*p) Focus: relative amount of resources to eradicate poverty (where
relative is measured relative to total income needed to make poverty go away) -> depth of poverty
Discuss the policy dilemma of targetting HCR only (policy bias) What about minimizing the PGR or IGR?
16

Examples• Example 1:• Poverty line 1000 Mt/month -> 200 people are poor• Poor group 1: 100 people with 500 Mt/month• Poor group 2: 100 people with 900 Mt/month• Budget available: 20,000 • Who should be targeted if you target the poor and forget poverty line?• What if President what HC to go down as much as possible
• Example 2:• Minimize the PGR or the IGR• Not susceptible to policy distortion as in example 1 – but only capture per
capita intensity of poverty• Show both measures (and they both ignore relative deprivation among the poor
=inequality among the poor)
• Example 3:• 200 poor – the 100 poorest now transfer 50 to less poor -> 450 and 950• HCR and PGR the same

Visualising the poverty gap
Poverty line
10050
Annual income
Percentage of population
Poverty line
10050
Annual income
Percentage of population

Analysing poverty measuresAmartya Sen proposed an axiomatic approach to defining a poverty measure
A poverty measure should have the following desirable properties:1. If the number of the poor increases, the measure should rise2. If the poor get poorer, the measure should go up3. If the distribution of income among the poor becomes more
unequal, the measure should go up
The Head Count ratio rates satisfy the first, but not the other two –incidence of poverty
The Poverty Gap Ratio satisfies the second, but need not satisfy the other two – depth of poverty
The Foster-Greer-Thorbecke (1984) FGT measure (more advanced) (poverty head count, poverty gap, squared poverty gap) – an overview plus show the Squared Poverty Gap - severity

FGT General Math Form
• Onde: n é a população, y é o consumo per capita, z é a linha de pobreza, e é um parâmetro não negativo.
0,11
zy z
yn
P

FGT notes
• By far the most common poverty measure employed.
• Typically use for = 0, 1, 2• =0: Headcount (incidence)• =1: Poverty gap (depth)• =2: Squared poverty gap (severity)
Note that the headcount is implicitly a part of all three measures

Another exampleZ = 3
A= (1, 2, 3, 4) -> HCR = 0.75 = 3/4PGR = 0.25 = ((3-1) + (3-2) + (3-3))/4*3
B= (2, 2, 2, 4) -> HCR = 0.75 =3/4PGR = 3(3-2)/3*4 = 0.25
Same HC and PGR – but in A the poorest only get half of what the poorest in B gets - > need for squared poverty gap
SPG (A) = 0.14 = (5/9)/4 and SPG (B) = 0.08 = (3/9)/4

Decomposing poverty – a poverty profile
Poverty profiles are decompositions of an aggregate poverty measure by sub groups (for example regions)
Consider two regions A og B with population shares nA and nB
The aggregated poverty measure is P n P n PA A B B

Poverty – empirical observations
• Recall there are large numbers of poor• Characteristics of the poor (who are the
poor?)• Demographic features • Rural and urban poverty• Assets• Nutrition• Etc etc – and now just a couple of
examples

Demographic features
Poor households tend to be:• Large• High dependency ratios (a cause and an
effect of poverty)• But exercise care in assessing the
correlation using per capita figures• Children may consume less• Economies of scale

The rural – urban divide
Region and Country % of Urban Population under Nat. Poverty Line
% of Rural Population under Nat. Poverty Line
Sub-Saharan AfricaLesotho (1993) 27.8 53.9
Nigeria (1993) 30.4 36.4
Zambia (1991) 46 88
AsiaIndia (1994) 30.5 36.7
Philippines (1991) 39 71
Vietnam (1993) 25.9 57.2
Latin AmericaBrazil (1990) 13.1 32.6
Nicaragua (1993) 31.9 76.1
Peru (1991) 50.3 68
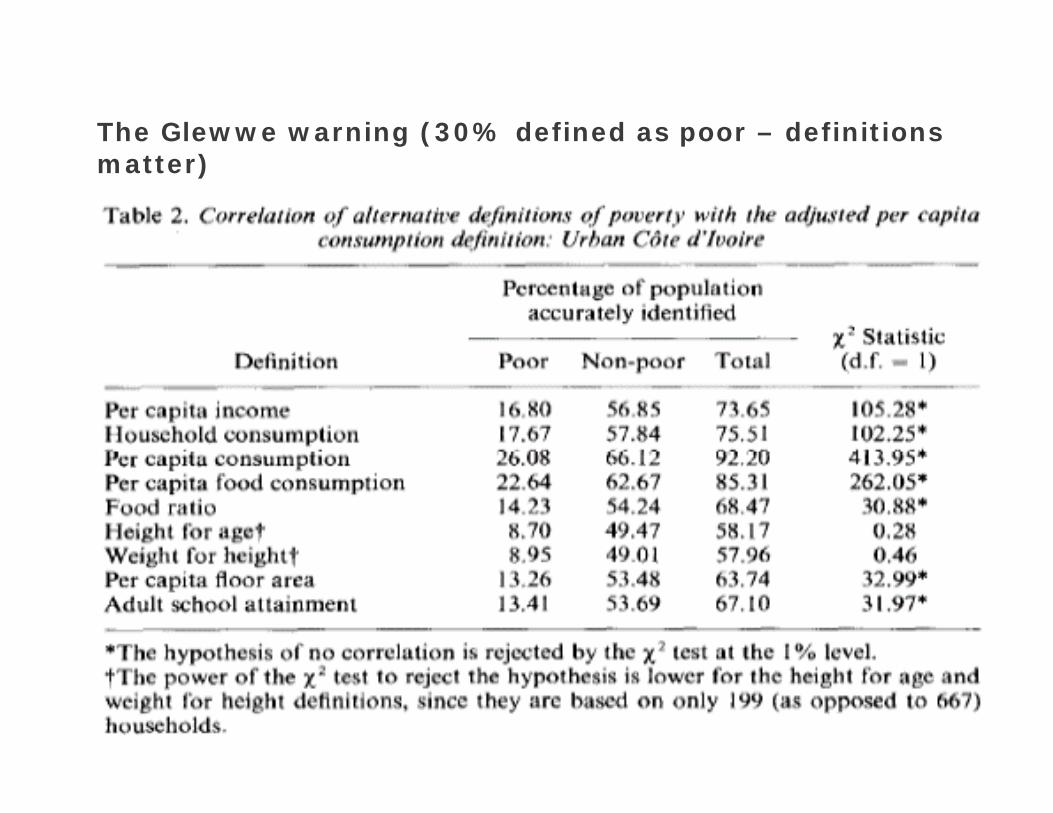
The Glewwe warning (30% defined as poor – definitions matter)
28
The functional impact of poverty: poverty, credit and insurance
• Poverty affects access to markets• Credit
• Lack of collateral• Incentives for poor to repay may be
limited (utility loss of repayment) – see next slide (market fails due to different incentives)

29
Functional impact of poverty – credit failure
30
Poverty, nutrition and the poverty trap
• The human energy balance• Energy input• Resting metabolism• Energy required for work• Storage and borrowing
• Nutrition affects the body’s capacity to perform work –so poverty bad nutrition low work capacity low earnings poverty (a poverty trap)
• The work capacity curve -> tends to promote unequal allocations within the household (the lifeboat ethic –unequal allocations create greater household work capacity)

31
The work capacity curve

32
Poverty and the household – the unequal sharing of poverty (a two person family, first in Y* and then in Y)

33
Poverty is not shared equally within household – gender inequality
• Education and empowerment of women• Ratio women/men
• Developed countries 105• India 93• Saudi Arabia 82
• Discrimination or ”lifeboat ethic”?

34
Conclusions• Poverty: intrinsic and functional aspects• Poverty is multidimensional• Standard poverty measurement
• The poverty line• Complementary measures
• Poverty correlates – different indicators do not identify the same people as poor
• Policy objectives, indicators and policy formulation (it is easy to get it ”wrong” – type 1 and type 2 statistical errors)
• Poverty, under nutrition and work capacity• The poverty trap• The intra household allocation problem and discrimination
• Discussion about policy and policy priorities