
Analysing hedge fund strategies through the use of an ... · Analysing hedge fund strategies...
26
Analysing hedge fund strategies through the use of an option based approach. Santiago Camarero Aguilera 1 Joaquín López-Pascual 2 Current Version: November 2011 1 CUNEF y Bankia. [email protected] 2 CUNEF. [email protected]
Transcript of Analysing hedge fund strategies through the use of an ... · Analysing hedge fund strategies...
Analysing hedge fund strategies through the use of an option based approach.
Santiago Camarero Aguilera1
Joaquín López-Pascual
2
Current Version: November 2011
1 CUNEF y Bankia. [email protected] 2 CUNEF. [email protected]

Analysing hedge fund strategies through the use of an option based approach.
Resumen
La industria de los hedge funds se ha convertido en el paradigma de la inversión alternativa. Una de las formas más comunes de clasificar a los hedge funds es en función de la estrategia de inversión que utilizan, las cuales generan diferentes niveles de rentabilidad y riesgo. Analizaremos las rentabilidades históricas, importante fuente de información sobre los comportamientos de estas estrategias, y demostraremos que los métodos tradicionales de análisis, basados en los primeros momentos de las distribuciones, no son apropiados en esta industria debido a su no normalidad, a la tendencia a sobreestimar la eficiencia y a no considerar información sobre el ciclo económico.
Demostraremos que usando el perfil de pago de opciones financieras podemos asimilar las rentabilidades históricas de las diferentes estrategias de hedge funds, conseguir niveles absolutos de rentabilidad similares y distribuciones más eficientes. Los resultados de este ejercicio nos permitirán evaluar si la actual estructura de comisiones de los hedge funds está justificada por la generación de rentabilidades ajustadas a riesgo superiores.
Abstract
High level of interest has been concentrated on the hedge fund industry as a paradigm of alternative investments, however the hedge fund industry is a heterogeneous group. One way to classify hedge funds is according to the investment strategy used, each offering a different degree of return and risk. Their historical return distributions provide key information in order to understand the strategies behaviour. We will study these return distributions and show that traditional mean variance based methods are not an appropriate approach for studying them due to their; non normality, tendency to overestimate efficiency and for not taking in consideration the economic cycle.
We will show that assimilating the strategies historical returns to options pay-offs we can get, through a low intensive trading, very similar long term returns and more efficient return distributions. These results will enable us to analyse whether, current hedge funds fee structures are justified by superior risk-reward performance.

1. Introduction
The search for superior, and uncorrelated, returns leads investors to seek “alternative” investments. This term is certainly not precise but a high level of interest has been concentrated on the hedge fund industry as a paradigm of alternative investments; however this asset class is a heterogeneous group.
One way to classify hedge funds is according to the investment strategies employed. The historical return analysis provides an important source of information for evaluating and understanding hedge fund investment styles. Through explicit or implicit analysis we can try to explain the funds performances and to classify investment styles.
In addition, comparing the time series returns of a hedge fund against the returns of its peer group, will allow us to assess the investment skills of the manager.
However it is important to note that the strategies perform differently according to the economic cycle, each offering a different degree of return and risk. Therefore performance, generated in a specific part of an economic cycle, that seems to have achieved consistent high excess returns could underperform systematically once that the economic cycle changes. This led us to the logical questions; do hedge fund managers really have superior skills and are they able to generate superior performance.
Several studies have analyzed hedge fund performance and many of them stated that hedge funds generate superior returns (Fung and Hsieh (1997); Brown, Goetzmann and Ibbotson (1999)). However new studies have started to raise doubts about these supposedly superior managerial skills. Fung, Hsieh, Naik, Ramadorai (2006) noted that the inflow of new capital has led to erosion of superior performance over time, even for high ability funds. Kat and Miffre (2006) argue that most of the previous analysis on hedge fund performance ignored the non normality of the returns, thereby suggesting superior performance where there actually may be none. Malkiel and Saha´s(2005) study arrives to similar conclusions, arguing that hedge funds are riskier and provide lower returns than is commonly supposed. This paper contributes to the studies on the non normality of the hedge funds returns by assimilating hedge fund strategies through the use of a, low intensive in trading, option based approach, easy to implement from a practitioner´s point of view. It contributes to studies done in this field by Agarwal and Naik (2000), Mitchell and Pulvino (2001) and Kat and Miffre (2006) that try to replicate the non normality of the returns through a conditional multifactor model. Thanks to our models we will also be able to contribute to the debate on whether hedge fund performance generates excess returns by comparing our model returns with some benchmark hedge fund indexes. In the section 2 of this paper, we will describe the data taken for our analysis, provided by Hedge Fund Research (HFR). In section 3, we will show inherent characteristics of different hedge fund strategies and illustrate how popular analysis tools such as; Sharpe ratio, Sortino ratio or other techniques, that take high moments as inputs, systematically overestimate or underestimate the risks of certain strategies. This supports our point that manager selection has to be contextualized according to the strategy employed. In Section 4, we will assimilate the historical returns of each investment strategy taking long or short positions in plain vanilla options. In this way we can

assimilate the non linearity of the hedge funds returns. In section 5, we will also compare the hedge funds strategies historical returns with the assimilating portfolios returns. Finally, we provide our conclusions, the results confirm that we can achieve; very similar long term returns and more efficient return distributions, with a low intensive trading approach. This takes us to question if the, current and generally-established, hedge funds fees charged are justified.
2. Investment strategies and indexes.
There is no consensus regarding the number of investment strategies used by hedge funds. Financial technology evolves and the universe of investment assets is constantly growing. Therefore new investment strategies are continually developing to exploit market opportunities.
Some data vendors have tried to classify these strategies and have built performance hedge fund indexes, as well as sub indexes according to the fund strategy.
Some of these data providers are;
• Hedge Fund Research (HFR) • Zurich Capital Markets • CSFB Tremont • Hennesse • Tuna • Barclays
We will use some of the HFR sub indexes as proxies for hedge fund strategies performance.
HFR has developed a series of benchmark indexes designed to reflect hedge fund industry performance by constructing equally weighted composites of constituent funds. The indexes are produced from their database feed for more than 17,000 funds. The funds selected in each index are filtered through manager’s due diligence and other qualitative requirements. The classification is done through statistical analysis, cluster analysis, correlation analysis, optimization and Monte Carlo simulations. This information is available on the HFR web site.
One of the main problems with the hedge fund indexes is the survivorship bias. Many hedge funds that were included at some point in the indexes might now not comply with the index requirements or might be defunct. HFR minimizes this problem by trying to receive a fund's performance until the point of the final liquidation of the fund.
HFR has created the following index classification.

Table 1. Hedge Fund Strategy Classification
Source: www.hedgefundresearch.com
Based on these indexes we will show inherent characteristics of some of the most relevant hedge fund strategies and we will assimilate the historical returns of each investment strategy taking a long or short positions in plain vanilla options.
3. Return Distributions and Ratios
Most of the strategies, except Short Bias, show common characteristics as negative skewness, positive excess kurtosis and serial correlation.
<< Insert table 1 around here >>
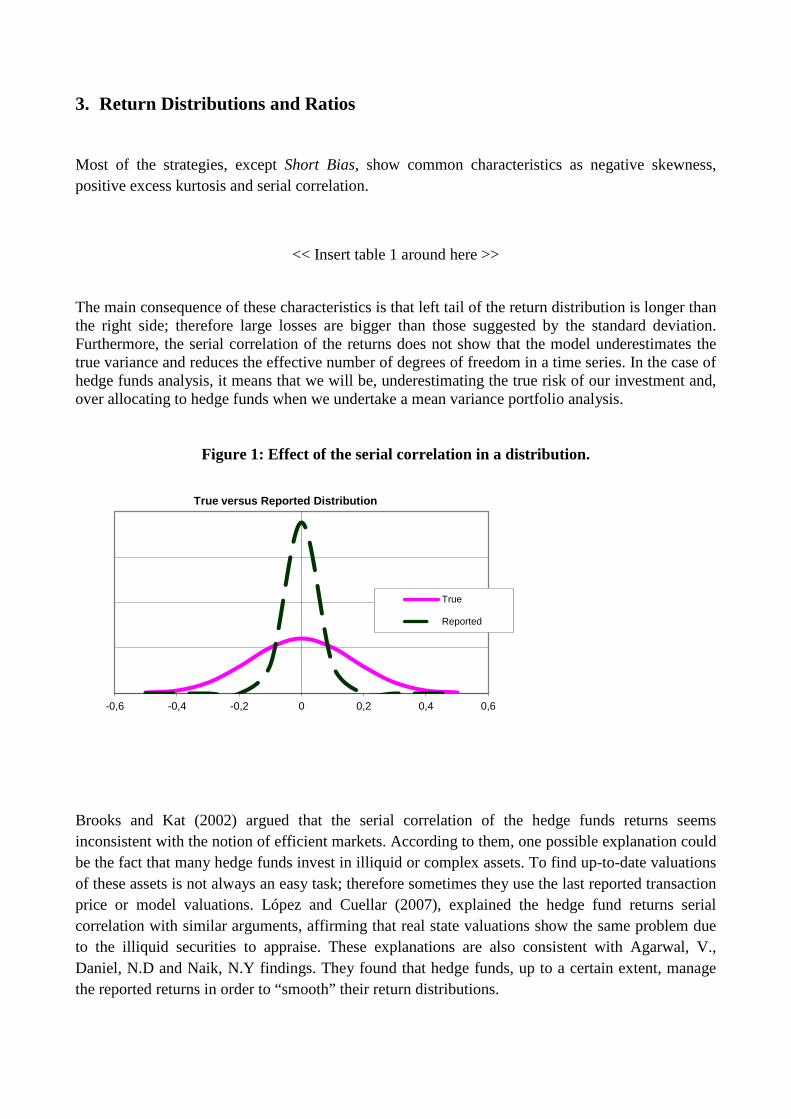
The main consequence of these characteristics is that left tail of the return distribution is longer than the right side; therefore large losses are bigger than those suggested by the standard deviation. Furthermore, the serial correlation of the returns does not show that the model underestimates the true variance and reduces the effective number of degrees of freedom in a time series. In the case of hedge funds analysis, it means that we will be, underestimating the true risk of our investment and, over allocating to hedge funds when we undertake a mean variance portfolio analysis.
Figure 1: Effect of the serial correlation in a distribution.
Brooks and Kat (2002) argued that the serial correlation of the hedge funds returns seems inconsistent with the notion of efficient markets. According to them, one possible explanation could be the fact that many hedge funds invest in illiquid or complex assets. To find up-to-date valuations of these assets is not always an easy task; therefore sometimes they use the last reported transaction price or model valuations. López and Cuellar (2007), explained the hedge fund returns serial correlation with similar arguments, affirming that real state valuations show the same problem due to the illiquid securities to appraise. These explanations are also consistent with Agarwal, V., Daniel, N.D and Naik, N.Y findings. They found that hedge funds, up to a certain extent, manage the reported returns in order to “smooth” their return distributions.
-0,6 -0,4 -0,2 0 0,2 0,4 0,6
True versus Reported Distribution
True
Reported

Ratios
The analysis of hedge funds performances through ratios is an easy and intuitive way to measure the efficiency of an investment. López de Prado (2008) appoints that the Sharpe ratio has become the ‘gold standard’ of performance evaluation. Although many researchers, Sharpe himself, study the deficiencies and limitations of the ratio, rating agencies and institutional investors include this ratio in their performance and risk measurements as put forward by López and Cuellar (2007).
The two most commonly used ratios are; Sharpe and Sortino, both measure the excess returns of an investment per unit of risk. In the case of the Sharpe ratio, the unit of risk is calculated as the standard deviation of the investment returns. For the Sortino ratio, the unit of risk is measured as the standard deviation of the negative returns. In other words, a measure of excess return against downward price volatility.
The statistical characteristics of the hedge funds returns, that we have described in the previous section, result in overestimated Sharpe or Sortino ratios, therefore these ratios tend to overvalue the efficiency of hedge funds and lead to over allocation in this asset class. This technology has limitations therefore the results have to be understood in the context of the selected strategy and the inherent risks. In this direction, López and Cuellar (2010) propose a complementary system for evaluating the inherent risks of each hedge fund through a radar visualization of strategy exposure.
4. Assimilating hedge fund strategies through plain vanilla options.
The first approach, in order to understand or even replicate hedge fund performance, would be to use a linear model. Through explicit or implicit analysis we can try to explain the funds performances and to classify investment styles.
• Explicit analysis. The aim is to identify and measure the sensitivity of real factors that explain the historical returns. An example could be to model the returns as a linear function of various macro economic factors or indexes.
• Implicit analysis. The idea is to identify certain statistical factors that explain the historical returns. One of the most commonly used methods is the principal component analysis (PCA). The PCA ranks explanatory factors with the highest possible variance with the constraint that each one has to be orthogonal to the previous components.
Linear analysis is a powerful tool to study hedge fund returns. The obvious limitation is that hedge fund returns are not linear.
Some studies have been done in order to replicate the non normality of the returns. Kat and Miffre (2006) highlighted the importance of non-normality risks and developed an extent analysis trying to replicate the non normality of the returns through a conditional multifactor model.
The aim of our study is not to replicate hedge fund returns. We propose that through the purchase and sale of plain vanilla options, we can assimilate and explain the returns of different hedge fund strategies. This will allow us to classify strategies and provide an intuitive explanation of the risk factors behaviour.
Our study starts by analyzing the risk profile of the different investment strategies to the upward and to the downward movements of the equity market. The proxies taken for the investment strategies returns are the monthly performance of the HFRI Indexes from June 2007 to March 2011. For the equity market we have taken the monthly performance of the S&P 500 index. All the data has been downloaded from the Bloomberg database.
1. Arbitrage strategies. The replication of these strategies resembles the selling of options, so the arbitrageurs funds seem to be net sellers of volatility. These hedge funds invest by exploiting relative mispricing in certain securities, looking for negative correlation in the returns of the selected securities. However in times of market stress the correlation in the markets tend to increase. Therefore these funds are not only consistently short volatility (vega and gamma), they are also short correlation. Consequently we would expect for an arbitrage hedge fund to achieve consistent small positive returns, with low volatility; however in times of stress it would suffer large losses, larger than predicted by their historical volatility of the returns.
We will analyse some of these strategies in further detail.
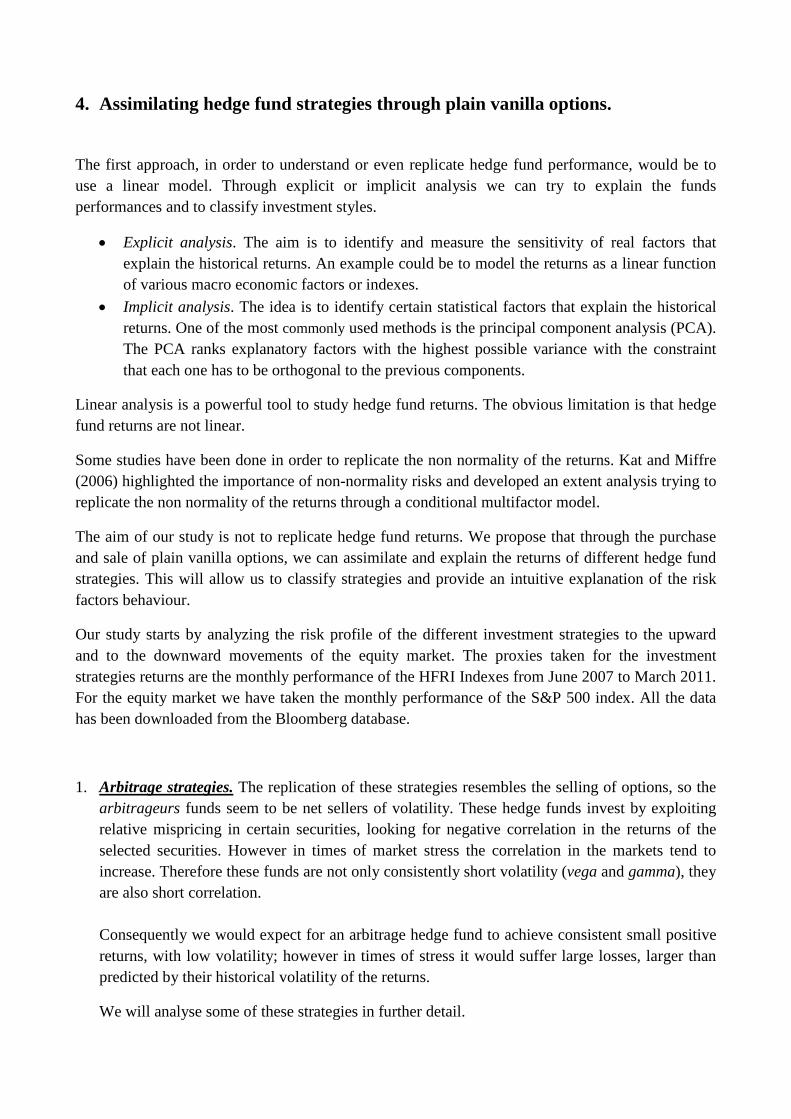
• Volatility strategy. These funds trade volatility as an asset class through both listed and unlisted instruments. The instruments used are mainly derivatives or other types of assets with embedded derivatives. The price of these instruments depends on the volatility level; therefore hedging other risk factors, it is possible to isolate the exposure to the volatility. We observe that the strategy returns assimilates to the selling of a series of straddles3
equity market returns, with the strikes set around 0%. This means that the HF managers generate the biggest returns when the equity market barely moves. When large equity market movements occurred to either side, their returns decreases.
, on the
Figure 2: Volatility Driven index.
3 We will show in the next chapter that the “assimilated” options strategy, of the Volatility Driven Index, is the selling of a combination of straddles (strike 0%) and strangles with strikes set a proximally at -4% / 4%, plus the purchase of certain amount of very out the money put options, in order to limit large negative returns.
-005%
-003%
-001%
001%
003%
005%
-010% -008% -006% -004% -002% 000% 002% 004% 006% 008% 010%
Vol
atili
ty D
riven
S&P 500 returns
Source Bloomberg
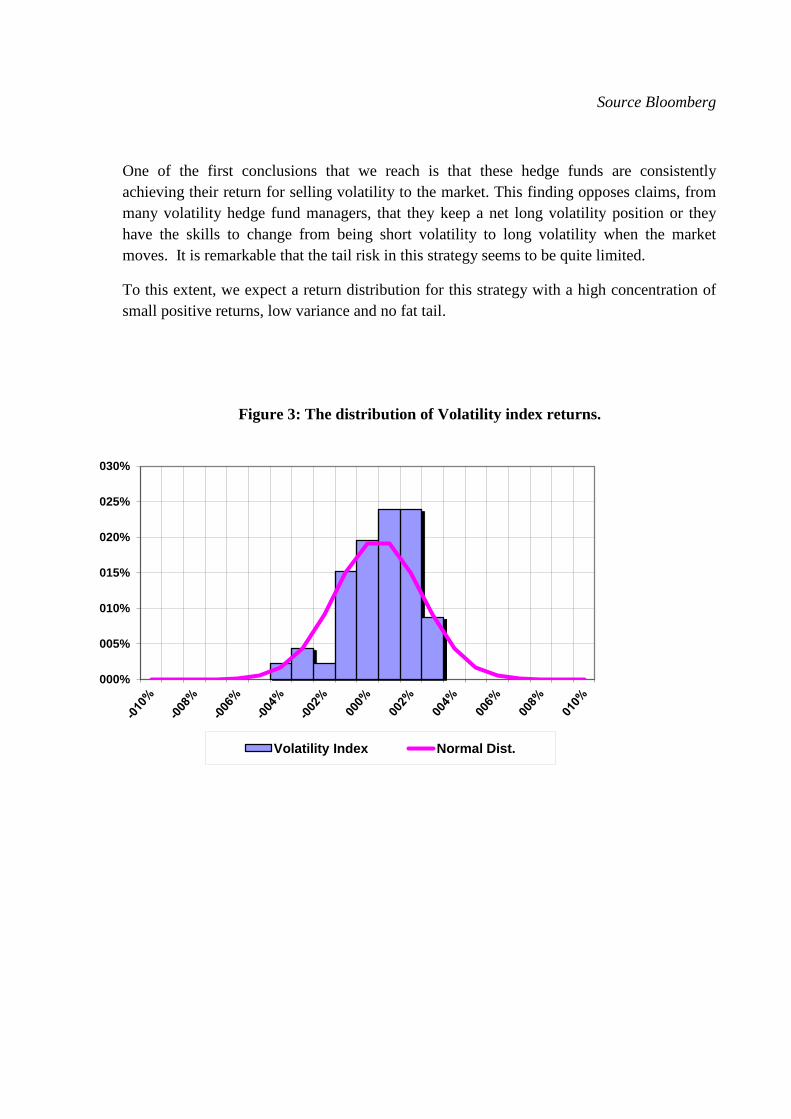
One of the first conclusions that we reach is that these hedge funds are consistently achieving their return for selling volatility to the market. This finding opposes claims, from many volatility hedge fund managers, that they keep a net long volatility position or they have the skills to change from being short volatility to long volatility when the market moves. It is remarkable that the tail risk in this strategy seems to be quite limited.
To this extent, we expect a return distribution for this strategy with a high concentration of small positive returns, low variance and no fat tail.
Figure 3: The distribution of Volatility index returns.
000%
005%
010%
015%
020%
025%
030%
Volatility Index Normal Dist.
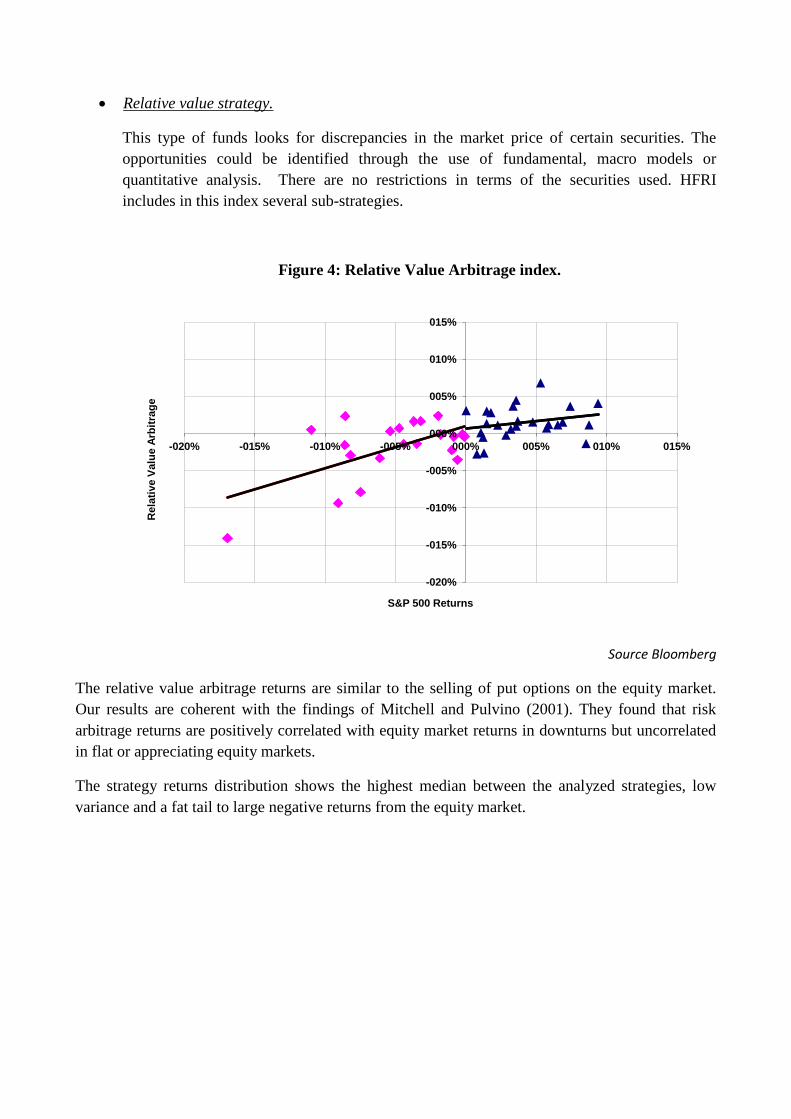
• Relative value strategy.
This type of funds looks for discrepancies in the market price of certain securities. The opportunities could be identified through the use of fundamental, macro models or quantitative analysis. There are no restrictions in terms of the securities used. HFRI includes in this index several sub-strategies.
Figure 4: Relative Value Arbitrage index.
Source Bloomberg
The relative value arbitrage returns are similar to the selling of put options on the equity market. Our results are coherent with the findings of Mitchell and Pulvino (2001). They found that risk arbitrage returns are positively correlated with equity market returns in downturns but uncorrelated in flat or appreciating equity markets.
The strategy returns distribution shows the highest median between the analyzed strategies, low variance and a fat tail to large negative returns from the equity market.
-020%
-015%
-010%
-005%
000%
005%
010%
015%
-020% -015% -010% -005% 000% 005% 010% 015%
Rel
ativ
e Va
lue
Arbi
trag
e
S&P 500 Returns

Figure 5: The distribution of Relative Value Arbitrage returns.
2. Equity hedge strategies. This group concentrates the largest number of hedge funds. Their strategy is to take long and short positions in the equity market. The analysis could be performed through quantitative or fundamental analysis. Some of these funds, in addition to equities, use other market securities as; derivatives, Exchange-Traded Funds or Contracts For Differences.
• Equity market neutral strategy. The aim of these strategies is to be market neutral in dollar or beta terms trough the purchase and sale of securities, usually their net equity market exposure is not greater than 10% long or short. According to HFRI information, they include Factor-based and Statistical/Trading strategies. Factor-based techniques consist of finding factors that have a common effect between securities. Statistical strategies usually apply some type of mean reversion approach between sectors or securities.
000%
005%
010%
015%
020%
025%
030%
Relative value arbitrage index Normal Dist.
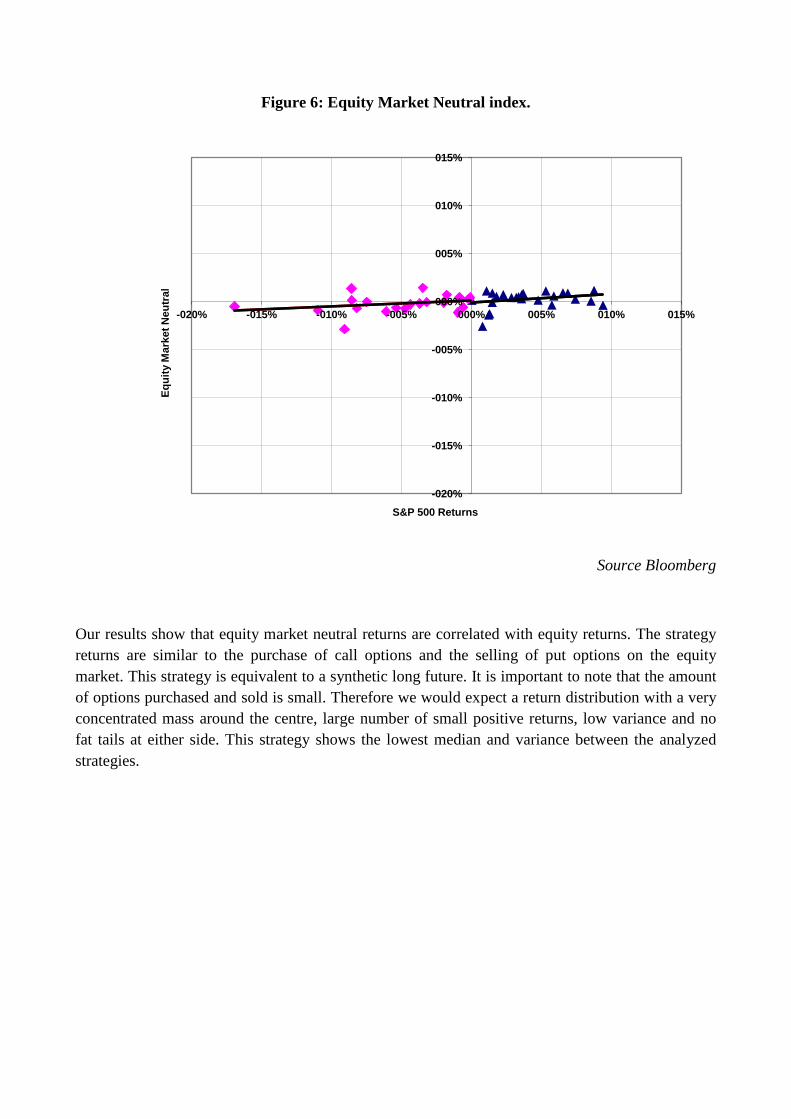
Figure 6: Equity Market Neutral index.
Source Bloomberg
Our results show that equity market neutral returns are correlated with equity returns. The strategy returns are similar to the purchase of call options and the selling of put options on the equity market. This strategy is equivalent to a synthetic long future. It is important to note that the amount of options purchased and sold is small. Therefore we would expect a return distribution with a very concentrated mass around the centre, large number of small positive returns, low variance and no fat tails at either side. This strategy shows the lowest median and variance between the analyzed strategies.
-020%
-015%
-010%
-005%
000%
005%
010%
015%
-020% -015% -010% -005% 000% 005% 010% 015%
Equi
ty M
arke
t Neu
tral
S&P 500 Returns

Figure 7: The distribution of Equity Market Neutral returns.
• Short bias strategy. These funds have the common characteristic of being net short equity exposure through the selling of overvalued securities. The level of short exposure varies between funds. The aim of the managers is to outperform in a declining equity market and not to suffer in a bullish equity market.
Figure 8: Short Bias index.
Source Bloomberg
000%
005%
010%
015%
020%
025%
030%
035%
040%
045%
050%
Equity Market Neutral Normal Dist.
-020%
-015%
-010%
-005%
000%
005%
010%
015%
-020% -015% -010% -005% 000% 005% 010% 015%
Shor
t B
ias
S&P 500 Returns

The returns of the short bias strategies resemble the purchase of put options and the selling of call options on the equity market with similar strikes. This strategy replicates the selling of synthetic futures. A more precise analysis indicates that the purchase of puts could be changed to the purchase of put options spreads.
The returns do not seem concentrated around any point of the distribution, we would expect high variance and high fat tails on both sides; therefore we would expect a departure from a normal distribution.
Figure 9: The distribution of Short Bias returns.
000%
005%
010%
015%
020%
025%
Short bias index Normal Dist.
5. Hedge Funds Indexes returns versus Options Portfolios.
Taking the options profiles defined in the previous section, we are going to build a dataset of Options Portfolios on a monthly basis that we will compare with the original strategies returns. In order to build the different Options Portfolios, we have split the portfolios in two parts; options and cash.
Options are derivative instruments and therefore unfunded, only premiums are paid or received, usually at the inception of the trade. However margins are demanded, to the option sellers, in order to minimize potential future credit risk exposure. We have assumed; a level of 15% of the option notional is demanded in concept of margins, the rest of the hedge fund cash will be invested in government bonds or lent as deposits. For our purposes we have assumed that the cash is lent at the 3 month Libor rate. This maturity is consistent with the liquidity redemption window of most hedge funds. However, note that many hedge funds invest in illiquid assets, and they are compensated for providing liquidity to the market. This will be equivalent to assuming that part of the cash of our portfolio is invested in long term bonds. The obvious problem is that the funds will have maturity mismatch between their assets and liabilities. Our experience indicates that this situation is very common; this is one of the reasons why many hedge funds have to restrict investors’ redemptions in periods of large outflows.
In our portfolios we have calibrated the notional equivalent of each option, consistent with the strategies returns and risks, as a function of the AUM (assets under management). We have used 3 month maturity options in all the portfolios. We have taken as inputs the implied volatility levels for 3 months options and the dividend returns published by Bloomberg. The final Options Portfolio returns are adjusted and corrected with the typical level of commission paid to hedge funds; 2% of management fee over the assets under management and 20% of success fees over the profits with high water mark. However, our models have an important limitation, option prices are assumed to be executed to a mid theoretical price, not taking into consideration the bid/offer spreads. Due to the low intensive trading proposed, the high liquidity of the options market on the S&P 500 and the fact that we have not considered extra compensation for the asset liability maturity mismatch. We consider our results as conservative and good proxies of real market returns.
• Volatility strategy.
We have created the Options Portfolio selling 104%/96% strangles, each leg with an equivalent notional of 0,6 of the total fund AUM, plus the purchase of 85% put options that will hedge the tail risk to large negative equity moves, the equivalent notional of these options is 0,3 of the total fund AUM.
The results, adjusted by commissions, show that the Options Portfolio achieves higher returns and a more efficient return distribution (higher mean, lower volatility and less negative Skew) than the

Volatility Index. Although, the number of months with positive returns are lower than in the Volatility Index, the size of the monthly losses are smaller and the size of the profits bigger.
Volatility Index Options Strategy
Mean 0,040% 0,051% Median 0,652% 0,103% Stand. Dev. 1,704% 1,312% Skew - 0,860 - 0,205 Kurtosis 0,494 3,290 Min. -4,53% -4,42% Max. 2,76% 4,04% N. of positive 56,52% 50,00% N. of negative 43,48% 50,00%
<< Insert table 3 around here >>
• Relative value strategy.
In this case our Options Portfolio has been built selling ATM put options, the options notional is equivalent to the total AUM level.
The first and second order moments defined in both distributions are very similar; however the Options Portfolio shows less negative skew and excess of kurtosis. The result is that the number of months with positive returns is higher in the Options Portfolio.
Relative Value Arbitrage Options Portfolio
Mean -0,043% -0,040% Median 0,650% 0,656% Desv. Stand 3,592% 3,674% Skew - 1,760 - 1,242 Kurtosis 5,135 2,825 Min. -14,11% -13,57% Max. 6,81% 5,83% N. of positive 58,70% 60,87% N. of negative 41,30% 39,13%
<< Insert table 4 around here >>

• Equity market neutral strategy.
We have built this Options Portfolio buying ATM calls and selling ATM put options. The notional equivalent of each option is 0.3 of the total AUM level. This is consistent with a low leverage. The results of the Options Portfolio shows lower returns that in the Equity Market Neutral Index, however we achieve lower volatility, less negative skew and lower excess kurtosis.
Equity Market Neutral
Options Strategy
Mean 0,024% -0,059% Median 0,160% 0,079% Desv. Stand 0,923% 0,829% Skew - 1,106 - 0,686 Kurtosis 1,731 0,222 Min. -2,87% -2,44% Max. 1,45% 1,33% N. of positive 56,52% 52,17% N. of negative 43,48% 47,83%
<< Insert table 5 around here >>
• Short bias strategy.
In this case the Options Portfolio is built buying ATM puts and selling ATM calls. The options notional of each leg is equivalent to 0.75 of the total AUM.
The results show two nearly identical distributions.
Short Bias Options Strategy
Mean -0,241% -0,239% Median -0,659% -0,545% Desv. Stand 4,282% 3,972% Skew 0,024 0,311 Kurtosis - 0,521 - 0,413 Min. -10,09% -7,39% Max. 9,58% 9,70% N. of positive 41,30% 41,30% N. of negative 58,70% 58,70%
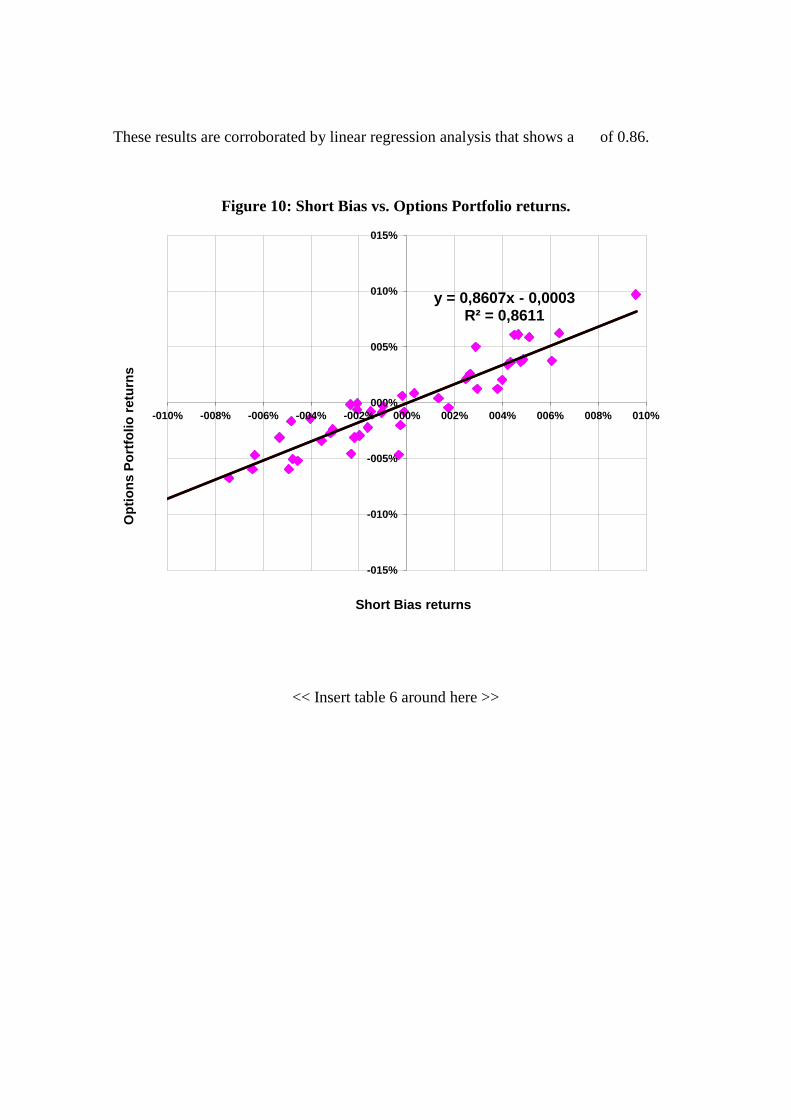
These results are corroborated by linear regression analysis that shows a of 0.86.
Figure 10: Short Bias vs. Options Portfolio returns.
<< Insert table 6 around here >>
y = 0,8607x - 0,0003 R² = 0,8611
-015%
-010%
-005%
000%
005%
010%
015%
-010% -008% -006% -004% -002% 000% 002% 004% 006% 008% 010%
Opt
ions
Por
tfolio
retu
rns
Short Bias returns

6. Conclusions
Understanding the statistical behaviour of hedge fund strategies is a key factor in order to select hedge fund investments. Study of their historical returns will provide us with a lot of information; however it is important to understand the limitations of the technology used. Performances generated in a specific part of an economic cycle, that seem to have achieved consistent high excess returns could underperform systematically once the economic cycle changes, therefore the returns generated by a hedge fund have to be understood in the context of the strategy used and the economic cycle.
We have provided a statistical analysis of some hedge funds strategies, and proposed a complementary and easy form of explaining and assimilating their returns distributions, through the purchase and sale of plain vanilla options over the equity market. This technology has allowed us to account for the non linearity of these returns and to identify relevant risk factors that explain a strategy’s returns and risk. Trying to explain strategies return with a linear model might systematically lead us to mistaken conclusions.
Applying our findings we have built a series of Options Portfolios that we have compared with the original strategies. Our results show that with low intensive trading strategies we are able to achieve similar returns and more efficient returns distributions in most cases. All our Options Portfolios tested will clearly outperform the hedge funds returns strategies if we assume lower commissions. Therefore we see no reason to justify the large fees charged across most parts of the hedge fund industry.
Our conclusion is reached for the hedge fund industry as a whole; this conclusion is not in conflict with the fact that many hedge fund managers consistently attain returns for their investors that amply justify the fees charged.
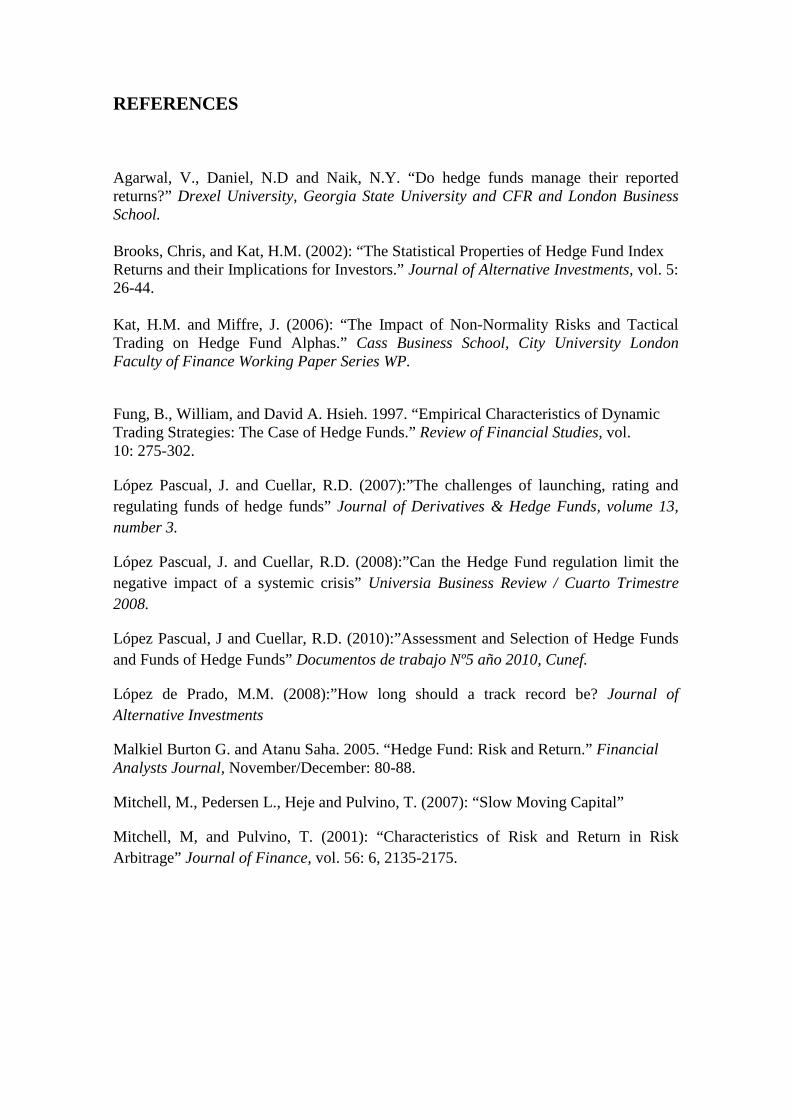
REFERENCES
Agarwal, V., Daniel, N.D and Naik, N.Y. “Do hedge funds manage their reported returns?” Drexel University, Georgia State University and CFR and London Business School. Brooks, Chris, and Kat, H.M. (2002): “The Statistical Properties of Hedge Fund Index Returns and their Implications for Investors.” Journal of Alternative Investments, vol. 5: 26-44. Kat, H.M. and Miffre, J. (2006): “The Impact of Non-Normality Risks and Tactical Trading on Hedge Fund Alphas.” Cass Business School, City University London Faculty of Finance Working Paper Series WP.
Fung, B., William, and David A. Hsieh. 1997. “Empirical Characteristics of Dynamic Trading Strategies: The Case of Hedge Funds.” Review of Financial Studies, vol. 10: 275-302.
López Pascual, J. and Cuellar, R.D. (2007):”The challenges of launching, rating and regulating funds of hedge funds” Journal of Derivatives & Hedge Funds, volume 13, number 3.
López Pascual, J. and Cuellar, R.D. (2008):”Can the Hedge Fund regulation limit the negative impact of a systemic crisis” Universia Business Review / Cuarto Trimestre 2008.
López Pascual, J and Cuellar, R.D. (2010):”Assessment and Selection of Hedge Funds and Funds of Hedge Funds” Documentos de trabajo Nº5 año 2010, Cunef.
López de Prado, M.M. (2008):”How long should a track record be? Journal of Alternative Investments
Malkiel Burton G. and Atanu Saha. 2005. “Hedge Fund: Risk and Return.” Financial Analysts Journal, November/December: 80-88.
Mitchell, M., Pedersen L., Heje and Pulvino, T. (2007): “Slow Moving Capital”
Mitchell, M, and Pulvino, T. (2001): “Characteristics of Risk and Return in Risk Arbitrage” Journal of Finance, vol. 56: 6, 2135-2175.
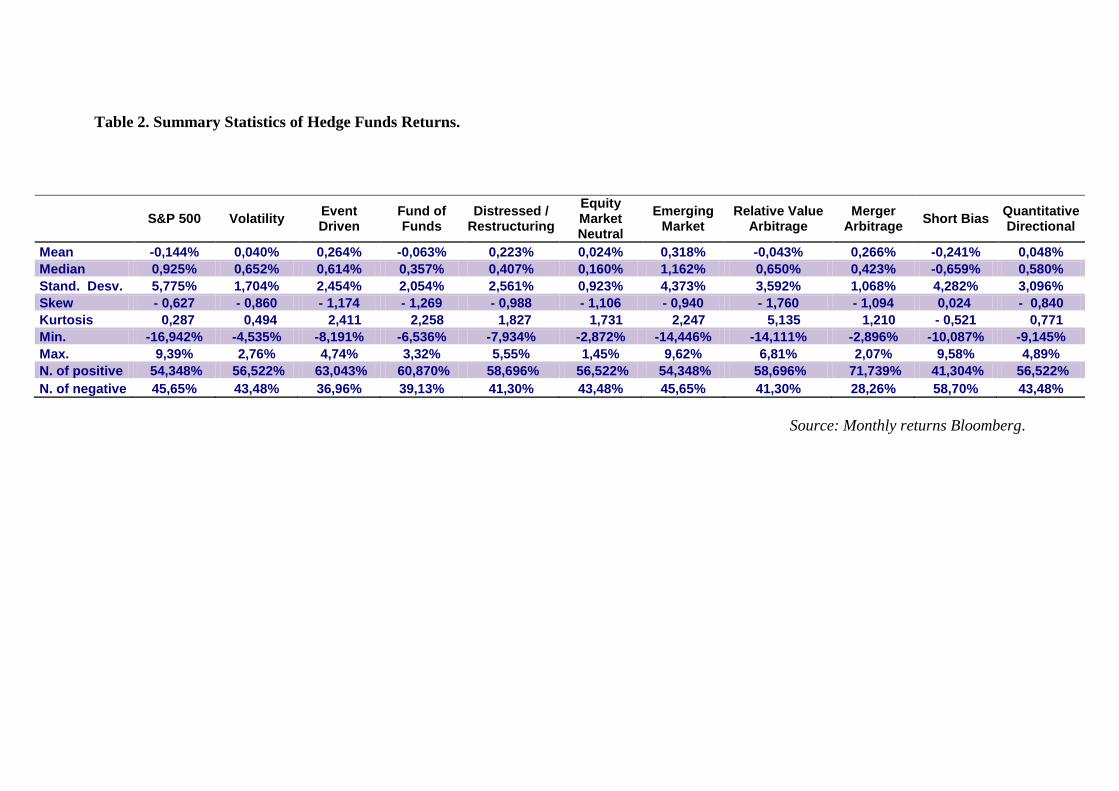
Table 2. Summary Statistics of Hedge Funds Returns.
Source: Monthly returns Bloomberg.
S&P 500 Volatility Event Driven
Fund of Funds
Distressed / Restructuring
Equity Market Neutral
Emerging Market
Relative Value Arbitrage
Merger Arbitrage Short Bias Quantitative
Directional
Mean -0,144% 0,040% 0,264% -0,063% 0,223% 0,024% 0,318% -0,043% 0,266% -0,241% 0,048% Median 0,925% 0,652% 0,614% 0,357% 0,407% 0,160% 1,162% 0,650% 0,423% -0,659% 0,580% Stand. Desv. 5,775% 1,704% 2,454% 2,054% 2,561% 0,923% 4,373% 3,592% 1,068% 4,282% 3,096% Skew - 0,627 - 0,860 - 1,174 - 1,269 - 0,988 - 1,106 - 0,940 - 1,760 - 1,094 0,024 - 0,840 Kurtosis 0,287 0,494 2,411 2,258 1,827 1,731 2,247 5,135 1,210 - 0,521 0,771 Min. -16,942% -4,535% -8,191% -6,536% -7,934% -2,872% -14,446% -14,111% -2,896% -10,087% -9,145% Max. 9,39% 2,76% 4,74% 3,32% 5,55% 1,45% 9,62% 6,81% 2,07% 9,58% 4,89% N. of positive 54,348% 56,522% 63,043% 60,870% 58,696% 56,522% 54,348% 58,696% 71,739% 41,304% 56,522% N. of negative 45,65% 43,48% 36,96% 39,13% 41,30% 43,48% 45,65% 41,30% 28,26% 58,70% 43,48%
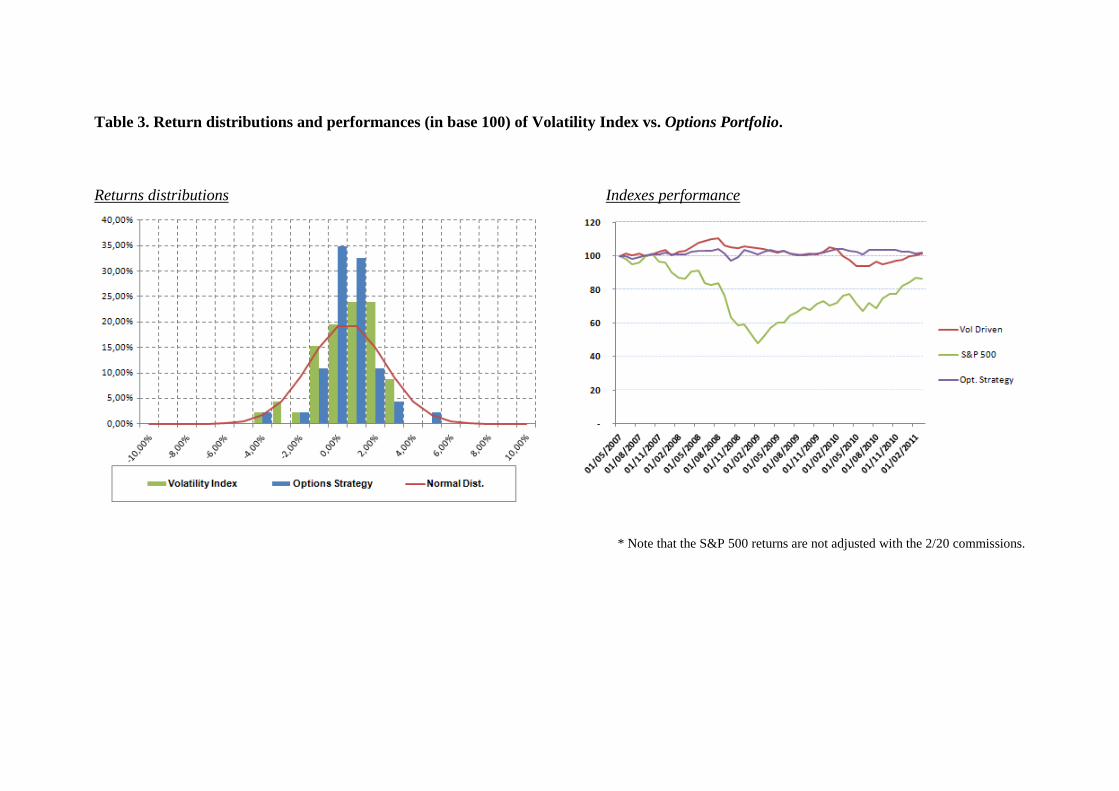
Table 3. Return distributions and performances (in base 100) of Volatility Index vs. Options Portfolio. Returns distributions
Indexes performance
* Note that the S&P 500 returns are not adjusted with the 2/20 commissions.
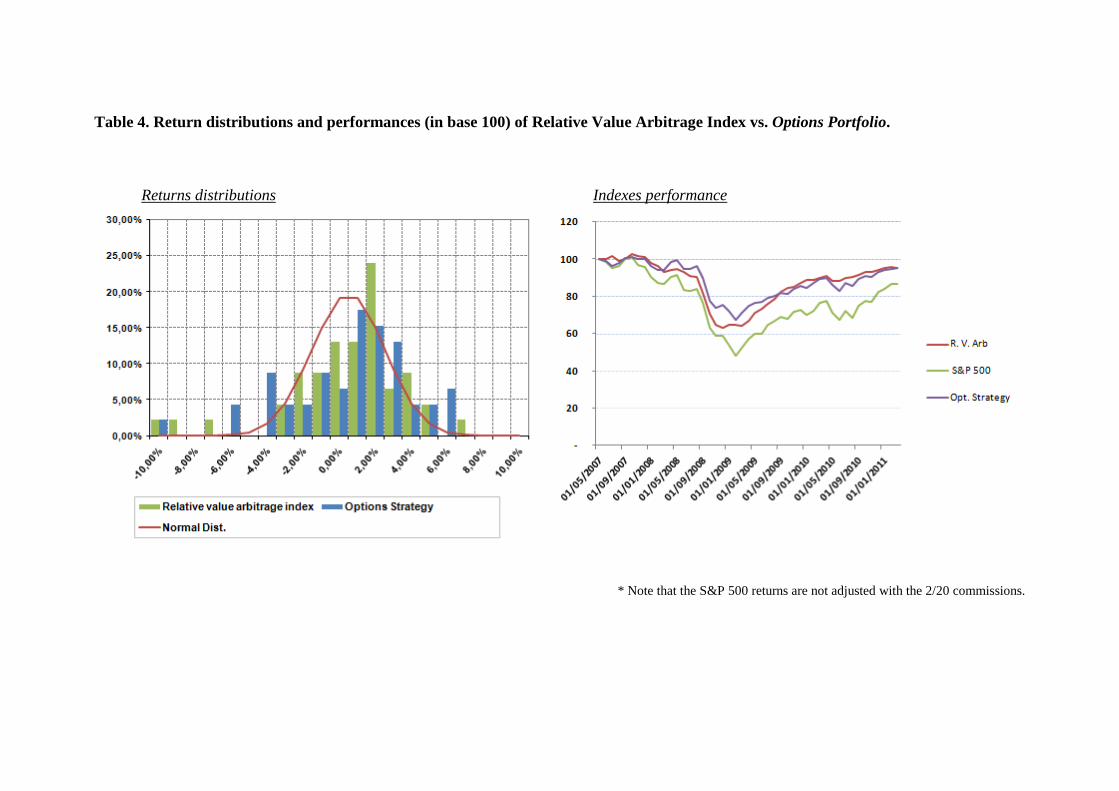
Table 4. Return distributions and performances (in base 100) of Relative Value Arbitrage Index vs. Options Portfolio. Returns distributions
Indexes performance
* Note that the S&P 500 returns are not adjusted with the 2/20 commissions.
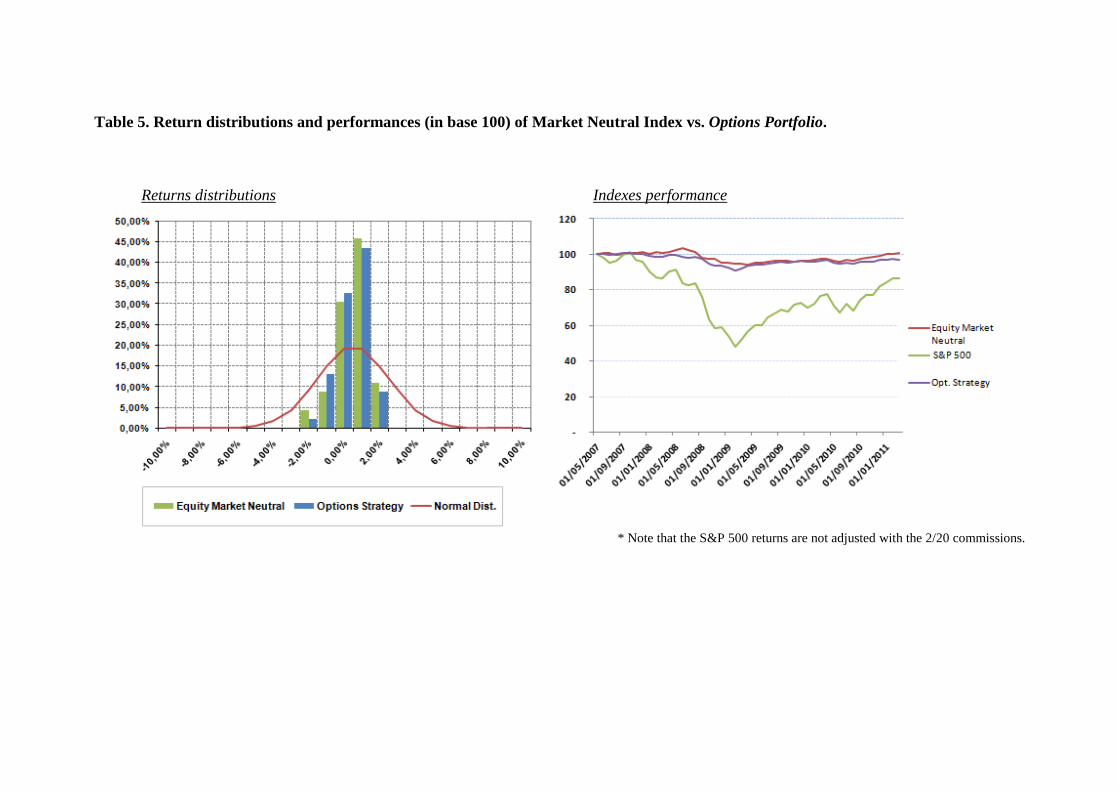
Table 5. Return distributions and performances (in base 100) of Market Neutral Index vs. Options Portfolio. Returns distributions
Indexes performance
* Note that the S&P 500 returns are not adjusted with the 2/20 commissions.

Table 6. Return distributions and performances (in base 100) of Short Bias Index vs. Options Portfolio. Returns distributions
Indexes performance
* Note that the S&P 500 returns are not adjusted with the 2/20 commissions.