AN OVERVIEW OF ALPACA AND WOOL'S FIBRE SCALE …
22
alp & wool scale height © C Holt jan 2018 1 AN OVERVIEW OF ALPACA AND WOOL'S FIBRE SCALE HEIGHTS A Report to: The Australian Alpaca Association Ltd AWTA (Wool Division) AWTA (Textile Division) Textile Manufacturing Ass Members BY Cameron. M. Holt © C Holt JANUARY 2018
Transcript of AN OVERVIEW OF ALPACA AND WOOL'S FIBRE SCALE …

alp & wool scale height © C Holt jan 2018
1
AN OVERVIEW OF ALPACA AND WOOL'S FIBRE SCALE HEIGHTS
A Report to:
The Australian Alpaca Association Ltd AWTA (Wool Division)
AWTA (Textile Division) Textile Manufacturing Ass Members
BY Cameron. M. Holt
© C Holt JANUARY 2018
alp & wool scale height © C Holt jan 2018
2
AN OVERVIEW OF ALPACA AND WOOL'S FIBRE SCALE HEIGHTS RATIONALE Today, leaders in the manufacturing of textiles are asking for scientific evidence of authenticity from the raw product they are producing (specifications). The wool industry is well versed and experienced in supplying specifications on greasy wool and wool tops for the fashion products. Today, even makers of carpets, duvets (doonas) want guarantees of the contents of the product they are using. Alpaca is used in all these areas. Over the last two years there have been press releases on "alpaca" being mislabelled (blended with wool or other fibres) that are, not identified in the correct content on the labelling. Blending is widely used during textile manufacture and it is not illegal, but undisclosed substitution is. It is difficult to detect once the fibre is blended and spun. Note; Controlled blending has many advantages not only as an aid for alpaca in processing but for special affect in finished garments. Fibre Identification is important in the textile industry, as substitutions can take place to cheapen the final product. For example: Superfine wool is sometimes substituted with cashmere. The superfine wool being cheaper than the cashmere and is difficult to detect once the fibre is blended and spun. Microscope examination is the only way to detect this deception.
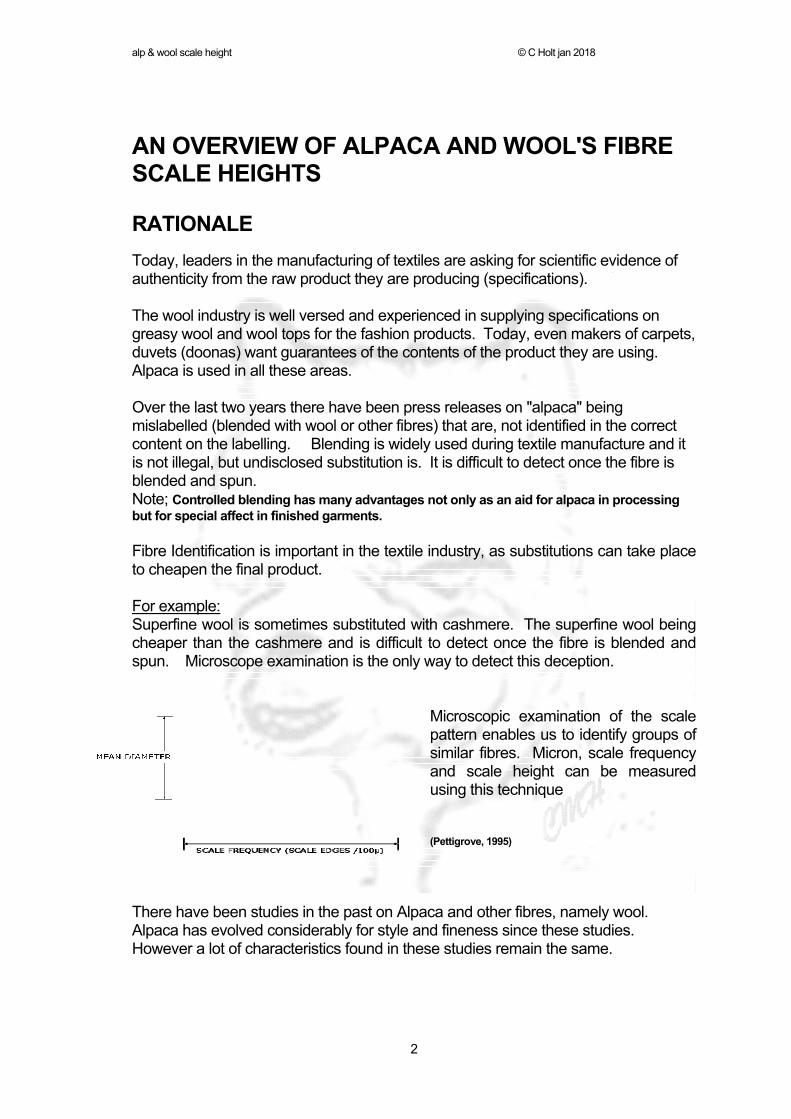
Microscopic examination of the scale pattern enables us to identify groups of similar fibres. Micron, scale frequency and scale height can be measured using this technique (Pettigrove, 1995)
There have been studies in the past on Alpaca and other fibres, namely wool. Alpaca has evolved considerably for style and fineness since these studies. However a lot of characteristics found in these studies remain the same.

alp & wool scale height © C Holt jan 2018
3
Phan, K-H., Wortmann, F-J., Wortmann, G., & Arns, W.
Characterisation of Speciality Fibres by Scanning Electron Microscopy., First Inter. Symp. on Speciality Animal Fibres, (1987).
Villarroel, J., A Study of Alpaca Fibre, Msc Thesis, University of NSW (1959) Wildman, A. The Microscopy of Animal Textile Fibres, Wool Industries Research Ass, Leeds (1954) Tillman, A SURFACE SCANING ELECTRON MICROSCOPY OF SURI ALPACA
FIBER Alpacas Magazine USA 2006 In this study I have chosen alpaca (Huacaya) with wool (Merino & Crossbred). Note; Suri alpaca although similar in many attributes to Huacaya is more akin to kid Mohair in its internal structure and production. Scale height and scale frequency of Suri has been widely covered by Tillman and Davitt (2006). Recently I was involved in helping identify the specifications for pure alpaca. This stemmed from having paperwork which said that the product was pure alpaca and a test which was carried out on this product was showing that some fibres were identified as wool.
Alpaca fibre finer than 20 microns is mostly a solid fibre and if you were using medullation in alpaca to separate the difference these fine alpaca fibres would not show that. Note; fine solid alpaca fibres All these fibres are Alpaca (C Holt 1993)
Note: At each change of new owner in the chain of production, a substitution can take place. So how do we identify the difference? The answer is scale height on the individual fibres. Little is written on this area but this knowledge is understood in the textile laboratories.

alp & wool scale height © C Holt jan 2018
4
STUDY
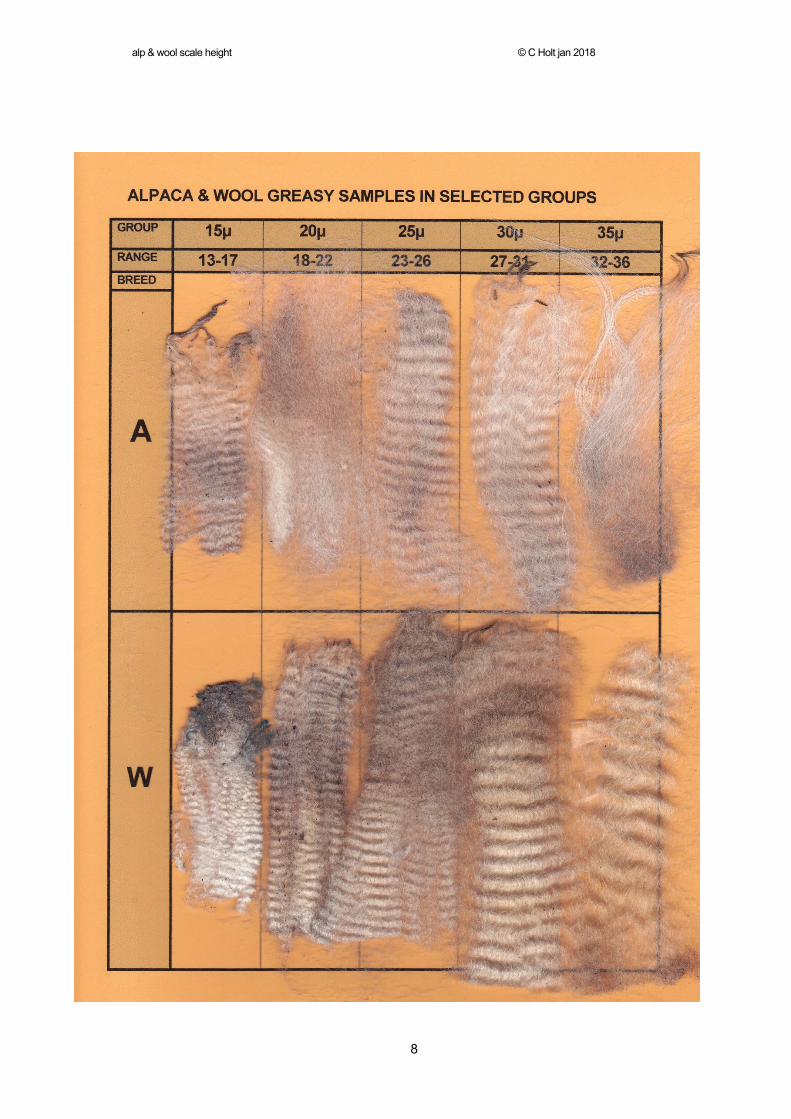
OBJECTIVE 1. Identify suitable alpaca and wool of various types for assessment. 2. Machines to be used in this study; - IWTO Wool certified testing machine for micron "OFDA2000 in snippet mode" (also called 100 mode) NEFT, Walcha NSW - Scanning electron microscope (SEM) 3 GREASY SAMPLES 5 greasy samples of each fibre type, Alpaca and Wool. They are to be divided visually into 5 groups; 15µ (13-17), 20µ (18-22), 25µ (23-26), 30µ (27-31), 35µ (32-36).
MATERIALS AND METHODS ---- Sampling and Measurement SAMPLE PREPARATION Each sample was washed in a detergent and rinsed at least 5 times. It was then allowed to dry in an oven at approximately 50 C. Some of the wool still has some wax on it in spite of the cleaning. The samples were then mounted on sample holders and coated with ~ 2 nm of Pt/Pd to provide conductivity. TAKING THE SCALE HEIGHT MEASURMENT The procedure measured the gap from the overlapping scale to the under (lower) scale and measured at "right angles". Note; THE SLOPE OF THE SCALE MUST NOT BE MEASURED. This will result in a higher reading.

alp & wool scale height © C Holt jan 2018
5
TAKING THE FIBRE ESTMATED MICRON MEASURMENT The procedure measured the distance (at right angles) from the outside of the overlapping scale one side to the outside of the overlapping scale on the other and measured at "right angles".
TAKING THE ESTMATED SCALE FREQUENCY MEASURMENT The procedure measured the number of scales over a distance of 100µ per individual fibre in the slide being examined (Visual fibres). Can be expressed as Mean Scale Frequency (MSF)

alp & wool scale height © C Holt jan 2018
6
MEASUREMENT There are 6 images of each fibre type, Alpaca and Wool. Starting at 500 x showing scale patterns, one at 1000 x, showing a scale edge and the balance showing more photos of the fibres at various x MAG. Each image has the fibre type (W or A) and the diameter on it, as well as the magnification and the micron scale marker. Due to the complexity of selection of fibres for tip height, slide 1 of both breeds was used. A visual estimation of an average fibre of the population in each group was selected as a representation of the total fibres present to measure for this characteristic. Imaging was done using a scanning electron microscope with an accelerating voltage of 2 kV, objective aperture 4 and condenser lens 12. Working distance was nominally 10 mm. In both the15µ groups a number of scale heights were measured to try and see the variation between fibres. NOTE; This requires a lot more time and measurements to get a definitive answer.
SUMMARY OF RESULTS BACKGROUND INFORMATION Before detailing the findings, a little background information on "Alpaca fibre Histology" (A Definitive Guide to Alpaca fibre C Holt 2014). FIBRE STRUCTURE A complex protein called Keratin forms the composition of the wool fibre. Keratin is composed of the elements, carbon, oxygen, hydrogen, nitrogen and sulphur. The fibre itself is a complex assembly made up of an innumerable number of cells. Basic cellular structure INSIDE (CORTICAL). The fibre consists entirely of rounded elongated and spindle shaped cells, thick in the middle and tapering away to a point at each end. The OUTER CELLS (CUTICLE) are hard flattened scale-like cells, which do not fit evenly together. (Pettigrove, 1995)
The edges, of these cells protrude from the fibre shaft giving the fibre a serrated edge (SERRATIONS). Serrations are an aid during processing as they help the fibre grip together to form a strong yarn. They are lower in Alpaca than in Wool. Pettigrove, 1995)

alp & wool scale height © C Holt jan 2018
7
INTRODUCTION To get a good average value for scale height you would have to measure a lot of scales from different diameter fibres within the given sample. The scale height (and other properties) can vary along fibre length, across the sample and within the animals total fleece. Note the variances in scale height on this one Alpaca fibre.
In sheep, it is known that you could have as much variation for micron across one staple could be as varied as that across a sheep – it just depends from where you take your sample from. (Alpaca fibre micron histogram)
In measuring fibre micron, a Laserscan or OFDA machine, designed to objectively measure the diameter and CV of diameter of fibres, would make thousands of measurements per sample in minutes to get its data. To get reasonable accurate statistics for scale heights per sample you would probably have to measure at least 500/1000 scale edge heights to begin to get near a true average value. I am not aware of any automated system to do this and doing it manually with an SEM would be exorbitantly expensive. Based on rough calculations, at commercial rates, around $ 8000/15000 per sample!! I have chosen to look at five samples of ALPACA and five samples of WOOL. The five individual breed groups will be classified with similar microns at various levels. GREASY SAMPLES There are 5 greasy samples of each fibre type, Alpaca and Wool. They are divided visually into 5 groups; 15µ (13-17), 20µ (18-22), 25µ (23-26), 30µ (27-31), 35µ (32-36).
alp & wool scale height © C Holt jan 2018
8

alp & wool scale height © C Holt jan 2018
9
ALPACA & WOOL SCALE HEIGHT ESTIMATED MEASUREMENT IN SELECTED GROUPS (Shown in photos)
MIC range
MIC AVE
ALPACA µ
WOOL µ
13/17
15 µ
0.36 0.79 *
18/22
20 µ
0.35 0.78 *
23/26
25 µ
0.43 0.92 *
27/31
30 µ
0.30 1.27 #
32/36
35 µ
0.33 1.35 #
RANGE
0.30 - 0.43
A ave 0.35
0.78 - 1.35 *M ave 0.83 #C ave 1.31
* Merino wool # Crossbred wool No obvious pattern in the Alpaca between "micron and scale height". However some height increase is seen in wool with increase in micron. More data needed to make any real conclusion.
AN INDICATION OF ALPACA & WOOL SCALE HEIGHT VARIENCE IN THE 15µ GROUP (Shown in RAW DATA)
MIC Group
ALPACA WOOL
15µ
0.25 0.33 0.36 0.47
0.79 0.83 0.96 1.01

alp & wool scale height © C Holt jan 2018
10

alp & wool scale height © C Holt jan 2018
11

alp & wool scale height © C Holt jan 2018
12
ALPACA & WOOL SCALE PATTERN IN SELECTED GROUPS (Shown in photos above) In the above microscopic photos the scale height between the Alpaca and Wool samples is different at all levels of micron. The microns in each group type appear to be similar for their nominated categories. At this magnification (X.500 & scale 100) the scales on the Alpaca are harder to identify to an untrained eye. Also note in the 35µ "Alpaca" group the mixture of microns, compared to the Wool example. All samples had been tested for average micron at some stage, using IWTO standards.
In these two microscope photos of 25µ fibres taken x1.0 k 50µ scale of "Alpaca and the Wool" the differentiation can be seen very clearly in the scale height between the two slides. The Alpaca scale did not noticeably protrude from the shaft of the fibre
The clarity of the Wool scale height is more obvious at this magnification than seen in the previous groups at x 0.500k 100µ. This makes a visual identification between the two breeds relatively easy. The Wool scale protruded approximately twice that of the Alpaca Scales per 100µ for micron in this 25µ group were around 8 for both Alpaca and Wool in this study.
alp & wool scale height © C Holt jan 2018
13
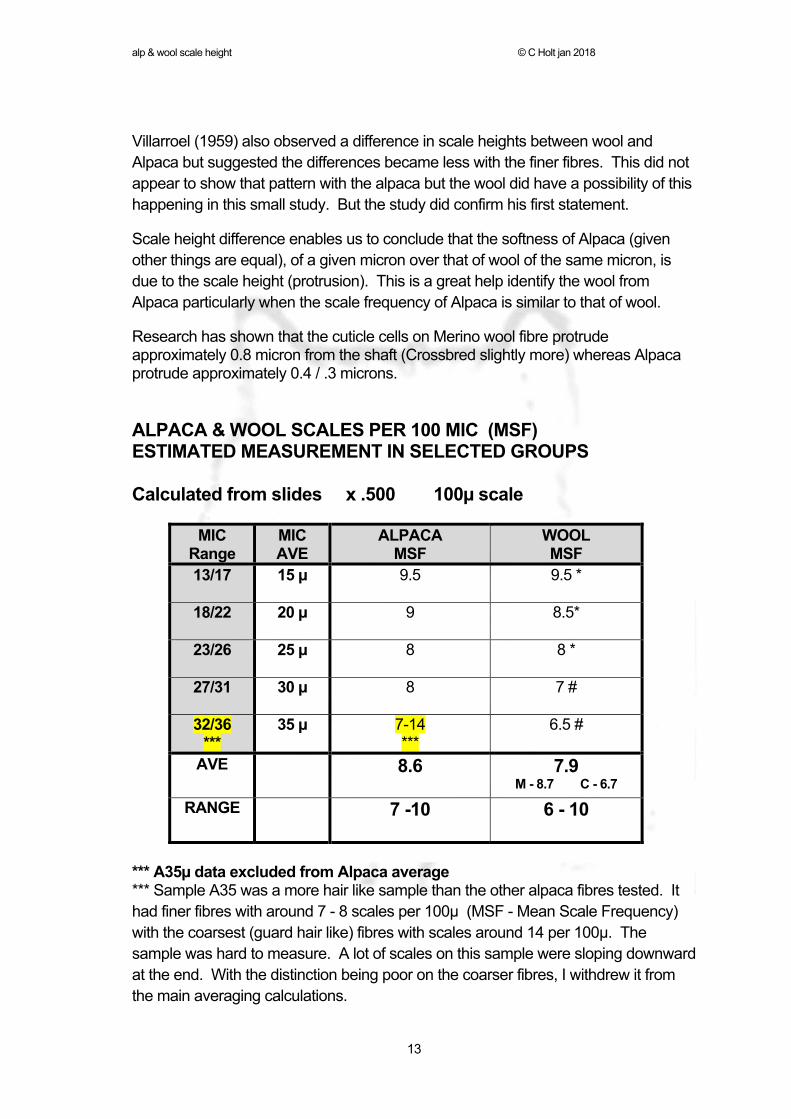
Villarroel (1959) also observed a difference in scale heights between wool and Alpaca but suggested the differences became less with the finer fibres. This did not appear to show that pattern with the alpaca but the wool did have a possibility of this happening in this small study. But the study did confirm his first statement.
Scale height difference enables us to conclude that the softness of Alpaca (given other things are equal), of a given micron over that of wool of the same micron, is due to the scale height (protrusion). This is a great help identify the wool from Alpaca particularly when the scale frequency of Alpaca is similar to that of wool.
Research has shown that the cuticle cells on Merino wool fibre protrude approximately 0.8 micron from the shaft (Crossbred slightly more) whereas Alpaca protrude approximately 0.4 / .3 microns.
ALPACA & WOOL SCALES PER 100 MIC (MSF) ESTIMATED MEASUREMENT IN SELECTED GROUPS Calculated from slides x .500 100µ scale
MIC
Range MIC AVE
ALPACA MSF
WOOL MSF
13/17
15 µ
9.5 9.5 *
18/22
20 µ
9 8.5*
23/26
25 µ
8 8 *
27/31
30 µ
8 7 #
32/36 ***
35 µ
7-14 ***
6.5 #
AVE
8.6 7.9 M - 8.7 C - 6.7
RANGE
7 -10 6 - 10
*** A35µ data excluded from Alpaca average *** Sample A35 was a more hair like sample than the other alpaca fibres tested. It had finer fibres with around 7 - 8 scales per 100µ (MSF - Mean Scale Frequency) with the coarsest (guard hair like) fibres with scales around 14 per 100µ. The sample was hard to measure. A lot of scales on this sample were sloping downward at the end. With the distinction being poor on the coarser fibres, I withdrew it from the main averaging calculations.

alp & wool scale height © C Holt jan 2018
14
Tillman/Davit (2006) found that the mean scale frequency for Huacaya has a mean frequency around 9 - 11 (per 100 microns) The scale edge angle for huacaya was 70 degrees. The scale pattern on the guard hair like fibres was similar to that found by Tillman-Davitt (14-18 MSF)
FIBRE SCALE LENGTH Per 100 um
SCALE HEIGHT
HUACAYA 9 - 11 .3-4
MERINO WOOL 10 - 12 .7-8
***35µ similar to Alpaca sample in study above (Holt 2018)
Tillman/Davitt (2006) Photos show "mean scale frequency, (MSF)", also referred to as "scale length" for Huacaya fibre and alpaca guardhair You will notice the numbers of scales along the shaft of the guard hair are completely different to alpaca huacaya fibre AVERAGE MICRON Microns were measured by the "OFDA 2000" -( snippet/100 mode) and also manually from the prepared SEM slides. This was done to confirm that the fibres fell within a given range to improve confidence with the results found. I should point out that some 2000 fibres were measured with the OFDA 2000 and only a small number up to 20 fibres in the slides (100µ scale). The accuracy obviously of the OFDA result would be more exacting due to volume measured than the "ball park" figure of the SEM slide. It was however pleasing to see how close these measurements were. This would suggest a reasonable estimation was obtained in this study.

alp & wool scale height © C Holt jan 2018
15
AVERAGE ALPACA & WOOL (MANUAL MEASURED) MICRON & RANGE IN SELECTED GROUPS (FROM "SEM" TEST SLIDES) Calculated from slides x .500 100µ scale
MIC Range
MIC AVE Group
ALPACA WOOL Ave Range Ave Range
13/17
15 µ
13.3 10 -15 14.5 10 - 20
18/22
20 µ
19.2 16-22 17.4 12 - 20
23/26
25 µ
24.3 20 - 28 26.1 20 - 30
27/31
30 µ
26.6 20 -31 33.2 26 - 40
32/36
35 µ
29.0** 18 - 40 35.4 28 - 41
AVE MIC
22.48 25.32
** Variation between fibres for this sample can be seen in the photo, group 35µ; Alpaca & Wool Scale Pattern. The magnification is (X.500 & scale 100µ)
ALPACA & WOOL MACHINE TESTED AVERAGE MICRON IN SELECTED GROUPS (IWTO Standard)
MIC Range
MIC AVE group
ALPACA WOOL Ave Range Ave Range
13/17
15 µ
14 6 - 43 14.4 7 - 39
18/22
20 µ
19.9 6 - 70 19.3 6 - 62
23/26
25 µ
24.8 6 - 69 25.3 7 - 55
27/31
30 µ
26.9 6 - 66 28.9 7 - 58
32/36
35 µ
28.9** 6 - 68 CV% 32.35
SD 9.35
32.9 6 - 57
Ave Micron
22.9 CV%22.7/25.9
A5 OUT - SEE ABOVE
24.2 CV% 23.3/25.9
** Hairy sample mixed.. Guardhair with finer alpaca fibre

alp & wool scale height © C Holt jan 2018
16
SUMMARY Alpaca and wool fibre can be clearly identified. The Wool scale protrudes approximately twice that of the Alpaca (Huacaya). A fair estimate to compare would be Alpaca, Huacaya, 0.30 - 0.45 µ (other research indicates Suri alpaca are slightly lower than Huacaya), to wool showing around 0.75 - 1.30 µ. It appears that at the X 500k 100µ scale, the trained eye should be able to identify the finer solid alpaca fibres from wool fibre based on scale protrusion (height). If there is a doubt the next level (X 1.0 k 50µ scale) is very clear. Failing that, measure the scale heights. Alpaca and Wool scale lengths are similar. However the "Guard hair" found in the alpaca has a different pattern and scale frequency. Few "guard hairs" were found except in the Alpaca 35µ group. The patterns and frequency were similar to the findings of Tillman & Davitt-2006. This study found similar results to other recent findings on this subject. AUTHORS COMMENTS Not all blending is bad, however substitution is. All goods made in the textile industry are created from set specifications. These specifications are determined most times at the top making point in production (although they can be pre scoured). Blending of different fibres is used often to help the performance of fibre through its various stages of production but mostly is used because it is required to meet the specifications for the end product. BREEDERS It is important for the alpaca breeders to make sure that their fleece preparation is carried out according to their industry laid down standards and quality assurance programs. Special care should be carried out at shearing time particularly when other animal fibres are shorn in the same shearing shed to avoid cross contamination of the fibres. PROCESSORS At all levels of production processors should have quality assurance programs in place to maintain the integrity of the fibre that they are processing at any given time. This should avoid any cross contamination or substitution which is unintended. Unfortunately contamination does occur and when it is not detected it is usually picked up at various stages of testing from the top through to the finished product. It is suggested that with new suppliers, measurement of the product purchased, wether raw or processed be carried out prior to production of their product.

alp & wool scale height © C Holt jan 2018
17
FURTHER READING & REFERENCES Antonini, M et al Cuticular cell frequency in different types of fleece of Domestic South American Camelids (1996) International Wool Textile Organization (IWTO) DTM-XX-97 Holt, C. A Definitive Guide To Alpaca Fibre, (2014) Holt, C. & Stapleton Dr I., A survey of ALPACA FLEECE CHARAC- TERISTICS, 1993 for AAA., Report Melbourne College of Textiles & LaTrobe University. Tillman, A Davitt SURFACE SCANING ELECTRON MICROSCOPY OF SURI
ALPACA FIBER Alpacas Magazine USA 2006 Phan, K-H., Wortmann, F-J., Wortmann, G., & Arns, W.
Characterisation of Speciality Fibres by Scanning Electron Microscopy., First Inter. Symp. on Speciality Animal Fibres, (1987).
Phan, K.H. Characteristics of Specialty fibres by Scanning Electron Microscopy (1988) Villarroel, J., A Study of Alpaca Fibre, Msc Thesis, University of NSW (1959) Wildman, A. The Microscopy of Animal Textile Fibres, Wool Industries Research Ass, Leeds (1954) Special thanks to my Industry Colleagues, without their help this study would not have been possible. New England Fibre Testing, for the supply of test results calculated from the wool and alpaca greasy fibre. The Supply of greasy samples from NEFT. Jemalong Wool, ISF and The House of Alpaca. Thanks also to the International Fibre and Textile testing laboratories for help and their advice on the measuring, calculating and analysing of the results of this study.
NOTE The study remains the intellectual property of Cameron Holt.
alp & wool scale height © C Holt jan 2018
18
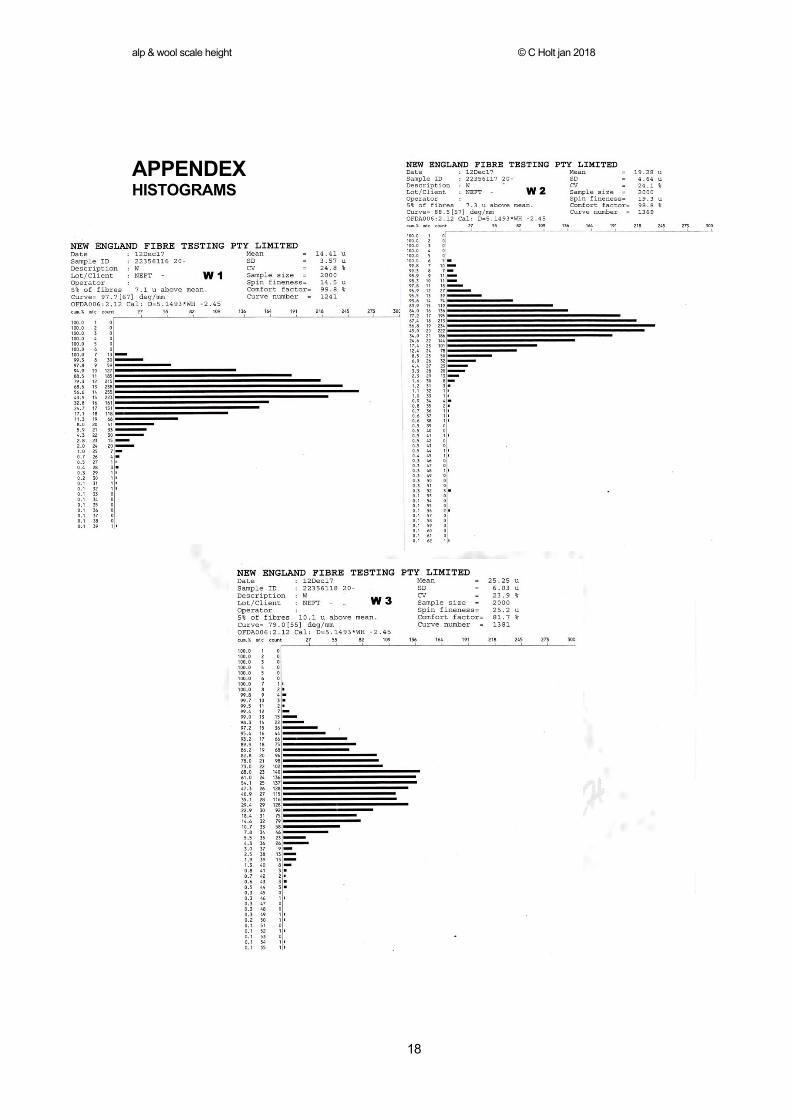
APPENDEX HISTOGRAMS

alp & wool scale height © C Holt jan 2018
19

alp & wool scale height © C Holt jan 2018
20

alp & wool scale height © C Holt jan 2018
21

alp & wool scale height © C Holt jan 2018
22