Performance Excellence Initiative 2010 Facts & Figures: Benchmark Data

A n I n t r o d u c t i o n t o t h e :
INSURANCE EXCELLENCE BENCHMARK

I n s u r a n c e E x c e l l e n c e B e n c h m a r k | A n I n t r o d u c t i o n I n s u r a n c e E x c e l l e n c e B e n c h m a r k | A n I n t r o d u c t i o n 32
What is the Insurance Excellence Benchmark? Why benchmark your operational efficiency now?
BCG’s Insurance Excellence Benchmark is a powerful tool that enables companies to assess their performance on a set of strategic priorities related to operational efficiency—and compare it with that of relevant competitors in the market, tailored peer groups, and best-in-class companies. Armed with insights gained from the tool, companies can identify performance gaps and close them with targeted change initiatives that sharpen their competitive edge.
This comprehensive tool - built with extensive performance data from a wide array of insurance companies - covers different strategic priorities, offered as modules, from which companies can pick and choose for a personalized approach.
• Business profile—performance on metrics such as gross written premiums; operating expenses; and sales-channel mix for life, health, and non-life insurance in all lines of business, including drill-downs by personal and commercial line and subcategory (such as motor, property, liability, and casualty)
• FTE efficiency—in activities including business lines’ core operations and claims, input management, business support functions, marketing and distribution, and use of outsourcing
• IT efficiency—on indicators such as IT costs per business line, IT applications used, and IT service- level agreements in place
• Digital readiness—indicated by the existence of a digital roadmap for the overall company, digital offerings, specialized resources dedicated to digital, automation levels, and share of IT budget devoted to digital
• Degree of customer-centricity—revealed through business lines’ performance on metrics such as Net Promoter Score (NPS), call-center efficiency, and comparison of turnaround times for key customer journeys such as claims processing
Key facts about the Insurance Excellence Benchmark
Powerful forces are reshaping the insurance industry—stiffer competition; challenging capital markets; digital disruption; a more complex regulatory environment; and customers demanding better service, more products, and deeper experience. All this has made it more vital than ever for insurance companies to maximize efficiency in their operations in order to boost productivity, safeguard profitability, and maintain market share.
Meanwhile, digital mastery has become the new imperative—driven by customers’ changing expectations. Today, customers want the same levels of service speed, quality, and transparency from their insurance providers that they’ve been getting from digital-native giants like Amazon, Google, and Apple.
How do insurance companies survive--or even thrive--in this environment? They do it by achieving unprecedented levels of efficiency in their operations. Cost-saving efficiency frees up cash that companies can channel back into the business. They can invest as needed to achieve digital mastery. And that, in turn, helps them wow customers with sophisticated innovations that exceed customers’ ever-shifting expectations.
BCG’s Insurance Excellence Benchmark helps companies determine where they stand now on the triple imperatives of efficiency, digital mastery, and customer demands—and where they need to be.
150+ 10+ 30+ DataBenchmarked processes
Years of data Participating insurance groups worladwide with 90+ risk carriers
Updated regularly to reflect new requirements/regulatory changes
Armed with insights gained from the tool, companies can reconfigure their operating model and sharpen their competitive edge.

I n s u r a n c e E x c e l l e n c e B e n c h m a r k | A n I n t r o d u c t i o n I n s u r a n c e E x c e l l e n c e B e n c h m a r k | A n I n t r o d u c t i o n 54
Our benchmarking tool is unique in many ways—providing insurance companies with data, analyses, and insights they can’t get anywhere else.
What makes us differentBCG’s Insurance Excellence Benchmark is:
• Comprehensive—It covers the full range of processes and performance metrics essential for insurance businesses to achieve and sustain success in the industry, rather than focusing on specific functions such as sales or operations. What’s more, the diversity of participating companies provides a comprehensive picture of the insurance market.
• Precise—Our detailed, clear, and consistent definitions of the most important processes in this industry result in a degree of precision that’s unmatched by any other insurance benchmarking tool.
• Flexible—Companies can choose the modules that interest them most and calibrate the tool to the defining characteristics of their local markets.
• Fast—Data collection, analysis, and generation of results reports take just weeks, so companies can swiftly craft and execute the right improvement projects.
• Battle-proven—The benchmark is based on BCG’s time-tested, standardized methodology and is part of a suite of benchmarks developed by our Technology Advantage group.
How we support youOur industry and knowledge experts work closely with clients to support them through the benchmarking process, including collecting data and customizing results reports.
We also help clients analyze their results and generate ideas for improvement initiatives, drawing on time-tested BCG solutions to help them reach and exceed their goals.
Clients receive detailed, comprehensive reports tailored to their objectives for using the benchmark and their choices regarding what to focus on. They also receive a high-level management summary of the most important insights from their benchmarking results, which they can use to craft action plans for change. Consider these examples (which show illustrative data only):
INS BM | Summary
Benchmark client against relevant competitors
Create transparency into keyoperating-model inefficiencies
Source: BCG Insurance Benchmark 2.0, 2016.
Identify important gaps
Build hypotheses for enhancing efficiency, productivity, and competitive advantage
Use established BCG solutionsto address identified issues–
Digital LeanEnd-to-End Digital JourneyPure Digital Product
GAIN INSIGHTS
IDENTIFY ISSUES
ADDRESS ISSUES
Client
BCG
A closer look at the Insurance Excellence Benchmark What you’ll receive

I n s u r a n c e E x c e l l e n c e B e n c h m a r k | A n I n t r o d u c t i o n I n s u r a n c e E x c e l l e n c e B e n c h m a r k | A n I n t r o d u c t i o n 76
What you’ll receive
INS BM | Business Profile
INS BM | FTE Efficiency
INS BM | IT Efficiency
INS BM | Digital
I n s u r a n c e E x c e l l e n c e B e n c h m a r k | A n I n t r o d u c t i o n I n s u r a n c e E x c e l l e n c e B e n c h m a r k | A n I n t r o d u c t i o n 98
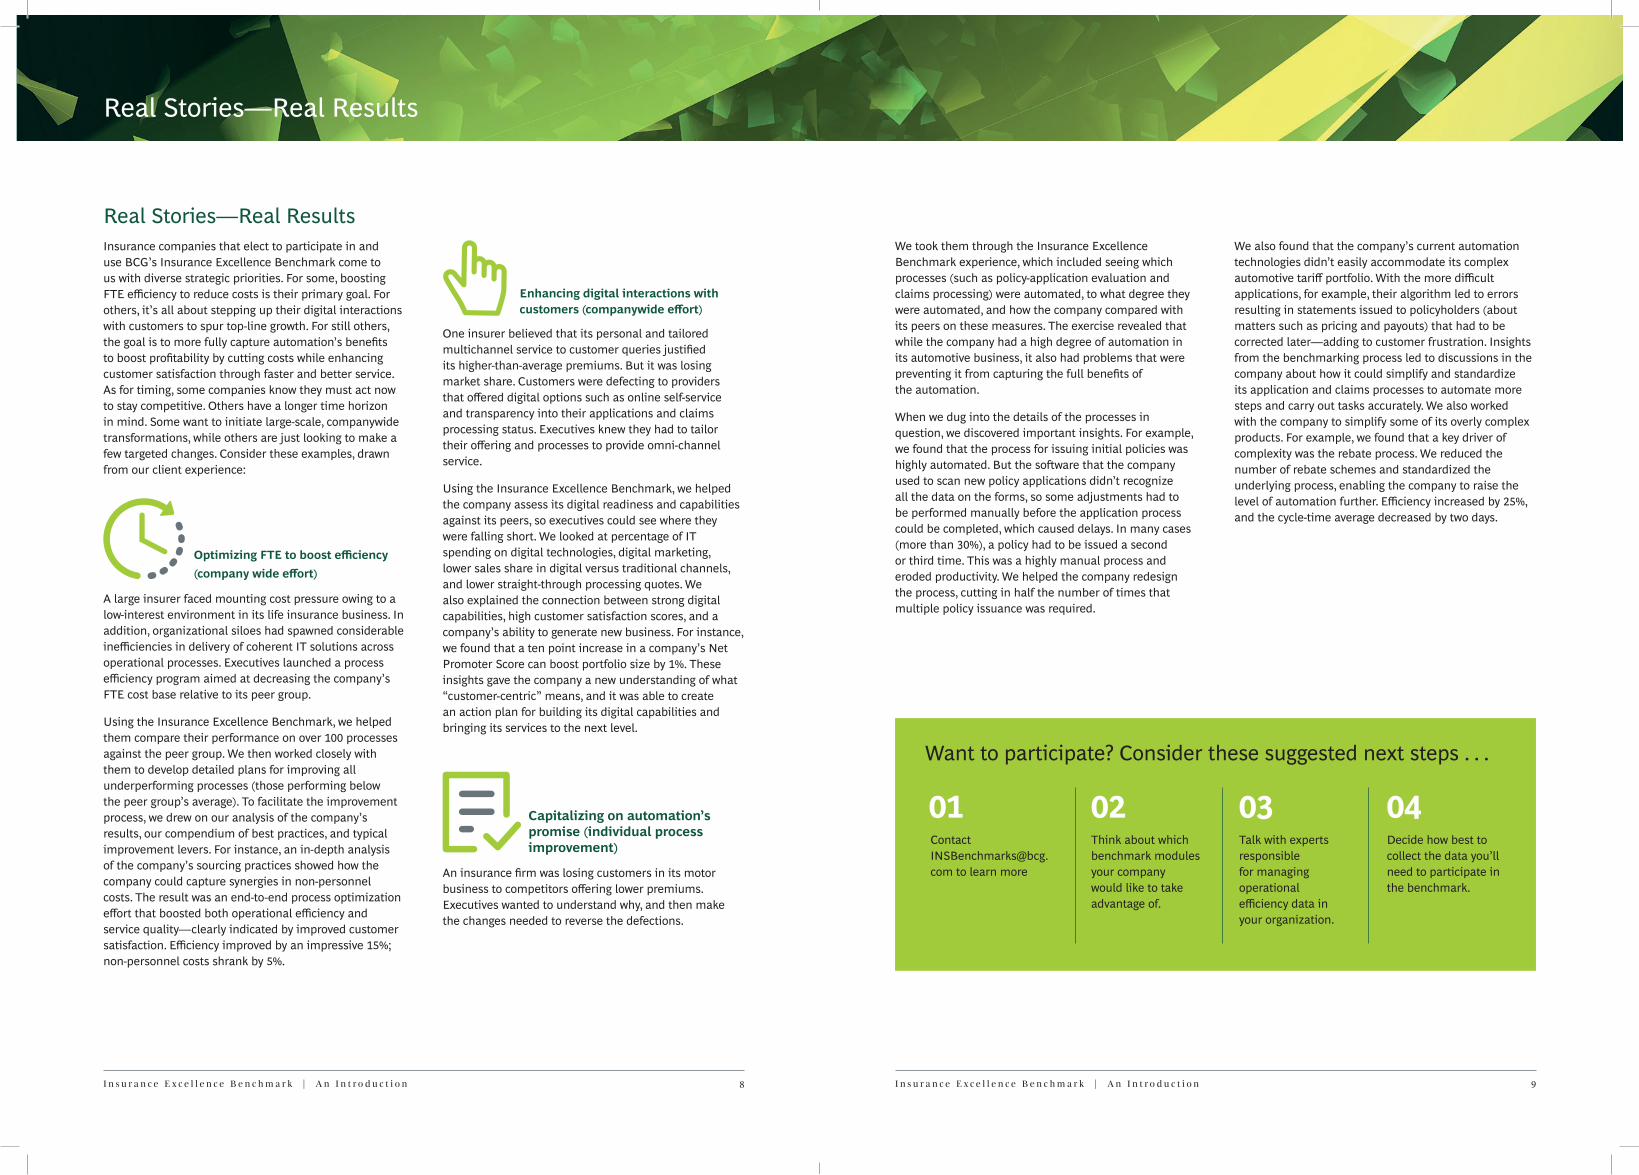
Real Stories—Real ResultsInsurance companies that elect to participate in and use BCG’s Insurance Excellence Benchmark come to us with diverse strategic priorities. For some, boosting FTE efficiency to reduce costs is their primary goal. For others, it’s all about stepping up their digital interactions with customers to spur top-line growth. For still others, the goal is to more fully capture automation’s benefits to boost profitability by cutting costs while enhancing customer satisfaction through faster and better service. As for timing, some companies know they must act now to stay competitive. Others have a longer time horizon in mind. Some want to initiate large-scale, companywide transformations, while others are just looking to make a few targeted changes. Consider these examples, drawn from our client experience:
A large insurer faced mounting cost pressure owing to a low-interest environment in its life insurance business. In addition, organizational siloes had spawned considerable inefficiencies in delivery of coherent IT solutions across operational processes. Executives launched a process efficiency program aimed at decreasing the company’s FTE cost base relative to its peer group.
Using the Insurance Excellence Benchmark, we helped them compare their performance on over 100 processes against the peer group. We then worked closely with them to develop detailed plans for improving all underperforming processes (those performing below the peer group’s average). To facilitate the improvement process, we drew on our analysis of the company’s results, our compendium of best practices, and typical improvement levers. For instance, an in-depth analysis of the company’s sourcing practices showed how the company could capture synergies in non-personnel costs. The result was an end-to-end process optimization effort that boosted both operational efficiency and service quality—clearly indicated by improved customer satisfaction. Efficiency improved by an impressive 15%; non-personnel costs shrank by 5%.
One insurer believed that its personal and tailored multichannel service to customer queries justified its higher-than-average premiums. But it was losing market share. Customers were defecting to providers that offered digital options such as online self-service and transparency into their applications and claims processing status. Executives knew they had to tailor their offering and processes to provide omni-channel service.
Using the Insurance Excellence Benchmark, we helped the company assess its digital readiness and capabilities against its peers, so executives could see where they were falling short. We looked at percentage of IT spending on digital technologies, digital marketing, lower sales share in digital versus traditional channels, and lower straight-through processing quotes. We also explained the connection between strong digital capabilities, high customer satisfaction scores, and a company’s ability to generate new business. For instance, we found that a ten point increase in a company’s Net Promoter Score can boost portfolio size by 1%. These insights gave the company a new understanding of what “customer-centric” means, and it was able to create an action plan for building its digital capabilities and bringing its services to the next level.
An insurance firm was losing customers in its motor business to competitors offering lower premiums. Executives wanted to understand why, and then make the changes needed to reverse the defections.
We took them through the Insurance Excellence Benchmark experience, which included seeing which processes (such as policy-application evaluation and claims processing) were automated, to what degree they were automated, and how the company compared with its peers on these measures. The exercise revealed that while the company had a high degree of automation in its automotive business, it also had problems that were preventing it from capturing the full benefits of the automation.
When we dug into the details of the processes in question, we discovered important insights. For example, we found that the process for issuing initial policies was highly automated. But the software that the company used to scan new policy applications didn’t recognize all the data on the forms, so some adjustments had to be performed manually before the application process could be completed, which caused delays. In many cases (more than 30%), a policy had to be issued a second or third time. This was a highly manual process and eroded productivity. We helped the company redesign the process, cutting in half the number of times that multiple policy issuance was required.
We also found that the company’s current automation technologies didn’t easily accommodate its complex automotive tariff portfolio. With the more difficult applications, for example, their algorithm led to errors resulting in statements issued to policyholders (about matters such as pricing and payouts) that had to be corrected later—adding to customer frustration. Insights from the benchmarking process led to discussions in the company about how it could simplify and standardize its application and claims processes to automate more steps and carry out tasks accurately. We also worked with the company to simplify some of its overly complex products. For example, we found that a key driver of complexity was the rebate process. We reduced the number of rebate schemes and standardized the underlying process, enabling the company to raise the level of automation further. Efficiency increased by 25%, and the cycle-time average decreased by two days.
Real Stories—Real Results
Want to participate? Consider these suggested next steps . . .
01 02 03 04Contact [email protected] to learn more
Think about which benchmark modules your company would like to take advantage of.
Talk with experts responsible for managing operational efficiency data in your organization.
Decide how best to collect the data you’ll need to participate in the benchmark.
Optimizing FTE to boost efficiency (company wide effort)
Capitalizing on automation’s promise (individual process improvement)
Enhancing digital interactions with customers (companywide effort)

I n s u r a n c e E x c e l l e n c e B e n c h m a r k | A n I n t r o d u c t i o n I n s u r a n c e E x c e l l e n c e B e n c h m a r k | A n I n t r o d u c t i o n 1110
For further information, please contact: [email protected]