An Introduction to Landscape Irrigation Simplified...
9
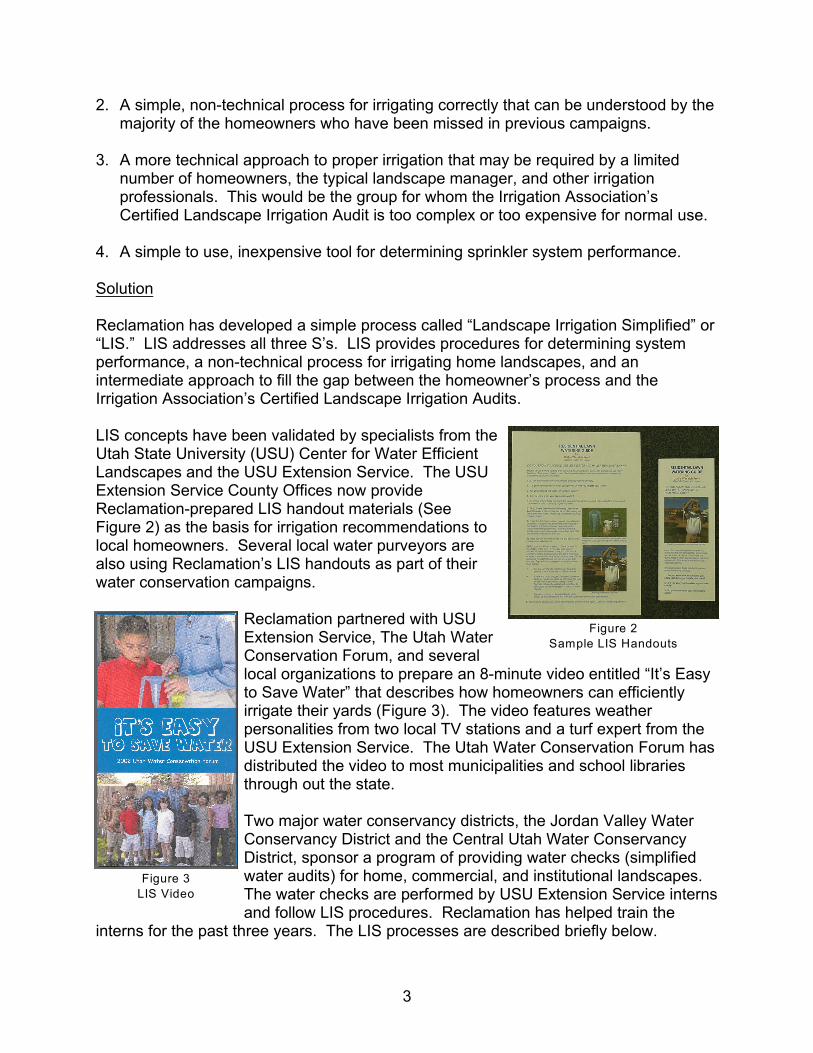
Figure 1 Typical Over-Irrigation of a Landscape An Introduction to Landscape Irrigation Simplified Michael D. Stuver, P.E. Frederick S. Liljegren, ASLA Problem Over-irrigation of landscapes is common where lush, green landscapes are sustained by irrigation. Estimates of the amount of water used for landscape irrigation typically range from 50 to 70 percent of the water used for urban purposes. In the state of Utah, nearly two thirds of residential water is used to maintain landscapes. Preliminary 1 results of numerous water audits conducted by Utah State University Extension in several metropolitan areas of Utah suggest that the typical homeowner applies about twice as much water as is needed each growing season. On many commercial or institutional 2 landscapes, three or four times as much water is applied as is needed. Nearly one third of the urban water supply is wasted by over-irrigating landscapes. Anecdotal 3 information suggests that this problem is relatively typical in many areas where landscapes are sustained by irrigation. Consequences of over-irrigation can have far-reaching effects. Existing urban water supplies are being depleted sooner than expected. Existing distribution system capacity is or will be over-taxed during the summer irrigation season resulting in possible system failure. As a result, new water supplies and/or increased system capacity will be expensive to obtain. Over-irrigation can also contribute to groundwater and surface water contamination as excessive runoff and deep percolation carry fertilizers, pesticides, and other chemicals into these water supplies. Prolonged runoff from over- irrigation can weaken the foundation materials supporting concrete and asphalt pavement resulting in expensive repairs. Further, many plant problems can be linked to improper irrigation. Experience shows the major factors that, individually or in combination, result in over- irrigating landscapes include: 1. Irrigation systems that are poorly designed, maintained, and inefficient with sprinklers improperly placed, out of adjustment, or in need of repair; 2. Irrigations that run off or soak past the depth of the plant roots;
Transcript of An Introduction to Landscape Irrigation Simplified...
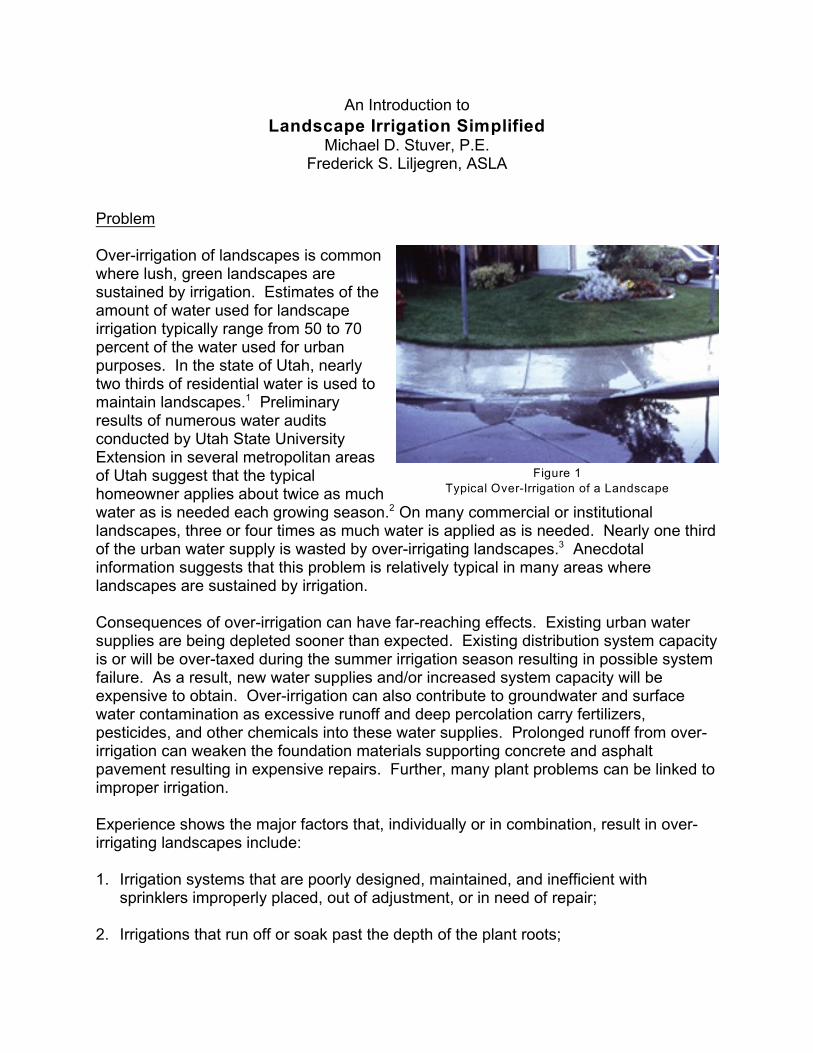
Figure 1
Typical Over-Irrigation of a Landscape
An Introduction to
Landscape Irrigation SimplifiedMichael D. Stuver, P.E.
Frederick S. Liljegren, ASLA
Problem
Over-irrigation of landscapes is commonwhere lush, green landscapes aresustained by irrigation. Estimates of theamount of water used for landscapeirrigation typically range from 50 to 70percent of the water used for urbanpurposes. In the state of Utah, nearlytwo thirds of residential water is used tomaintain landscapes. Preliminary1
results of numerous water auditsconducted by Utah State UniversityExtension in several metropolitan areasof Utah suggest that the typicalhomeowner applies about twice as muchwater as is needed each growing season. On many commercial or institutional2
landscapes, three or four times as much water is applied as is needed. Nearly one thirdof the urban water supply is wasted by over-irrigating landscapes. Anecdotal3
information suggests that this problem is relatively typical in many areas wherelandscapes are sustained by irrigation.
Consequences of over-irrigation can have far-reaching effects. Existing urban watersupplies are being depleted sooner than expected. Existing distribution system capacityis or will be over-taxed during the summer irrigation season resulting in possible systemfailure. As a result, new water supplies and/or increased system capacity will beexpensive to obtain. Over-irrigation can also contribute to groundwater and surfacewater contamination as excessive runoff and deep percolation carry fertilizers,pesticides, and other chemicals into these water supplies. Prolonged runoff from over-irrigation can weaken the foundation materials supporting concrete and asphaltpavement resulting in expensive repairs. Further, many plant problems can be linked toimproper irrigation.
Experience shows the major factors that, individually or in combination, result in over-irrigating landscapes include:
1. Irrigation systems that are poorly designed, maintained, and inefficient withsprinklers improperly placed, out of adjustment, or in need of repair;
2. Irrigations that run off or soak past the depth of the plant roots;
2
3. Irrigations that occur more frequently than required by the landscape.
Informal surveys of homeowners and landscape managers participating in the Bureau ofReclamation’s landscape irrigation workshops suggest that only about 10 percent ofthose in attendance know how much water is being applied by their irrigation systems. These informal observations have since been validated by a survey conducted for theUtah Division of Water Resources. The survey found that about 96 percent of theindividuals surveyed lacked adequate information to irrigate their landscapes correctly.
Many homeowners think all sprinklers apply the same amount of water. Most know howlong the system runs but not how much water is applied. Further, the lack ofunderstanding the concept of uniform application results in the homeowner increasingrun times rather than properly addressing the causes of dry spots in the turf. Bywatering to the needs of the dry spots, the rest of the turf is over watered.
Need
In evaluating the problems and causes of over-irrigation, three requirements, referred toas the “Three S’s,” have been identified for achieving efficient landscape irrigation. These requirements are:
1. The System must apply water as evenly to the landscape as is practical.
2. The Setting of the irrigation run time should allow the sprinkler to eliminate runoffwhile applying the correct amount of water.
3. The Schedule of each irrigation should meet actual plant water needs throughout thegrowing season.
Unless all three S’s are satisfied to the greatest degree practical, inefficient irrigationswill continue. Contemporary efforts to promote more efficient landscape irrigation haveusually only focused on one or two of the S’s. Further, much of the water conservationadvice provided has missed its intended audience. As mentioned above, only about 10percent of the homeowners and landscape managers know how much water theirirrigation systems are applying. For the other 90 percent, recommendations like “waterdeeper less frequently” and “apply 1 inch of water every 4 days” have little or nomeaning. Thus, a different approach is needed to promote more efficient landscapeirrigation.
The Bureau of Reclamation (Reclamation), an agency of the U.S. Department of theInterior that supplies water to farmers and communities throughout the West, iscommitted to making sure scarce water resources are used as efficiently as possible. The Upper Colorado Region of the Bureau of Reclamation recognized the need formore tools and techniques to improve landscape irrigation efficiency in the major urbanareas served by its projects. Reclamation identified four basic needs:
1. A simple process to determine the irrigation system performance.
3
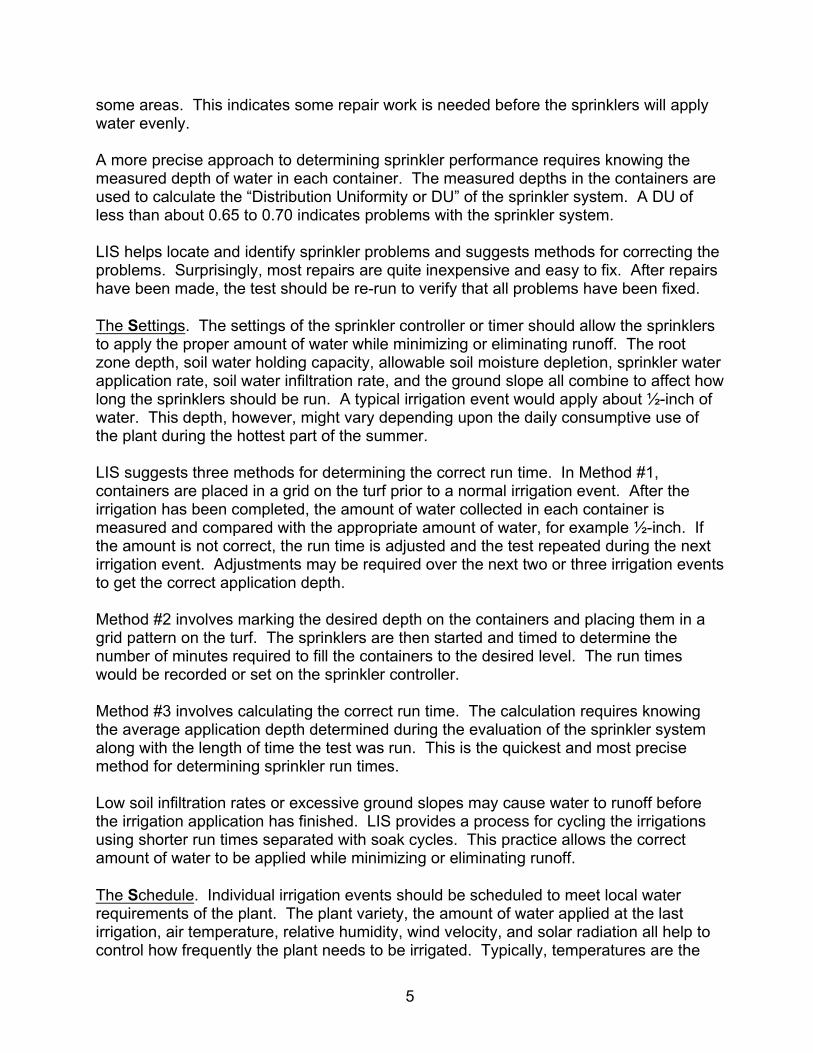
Figure 2
Sample LIS Handouts
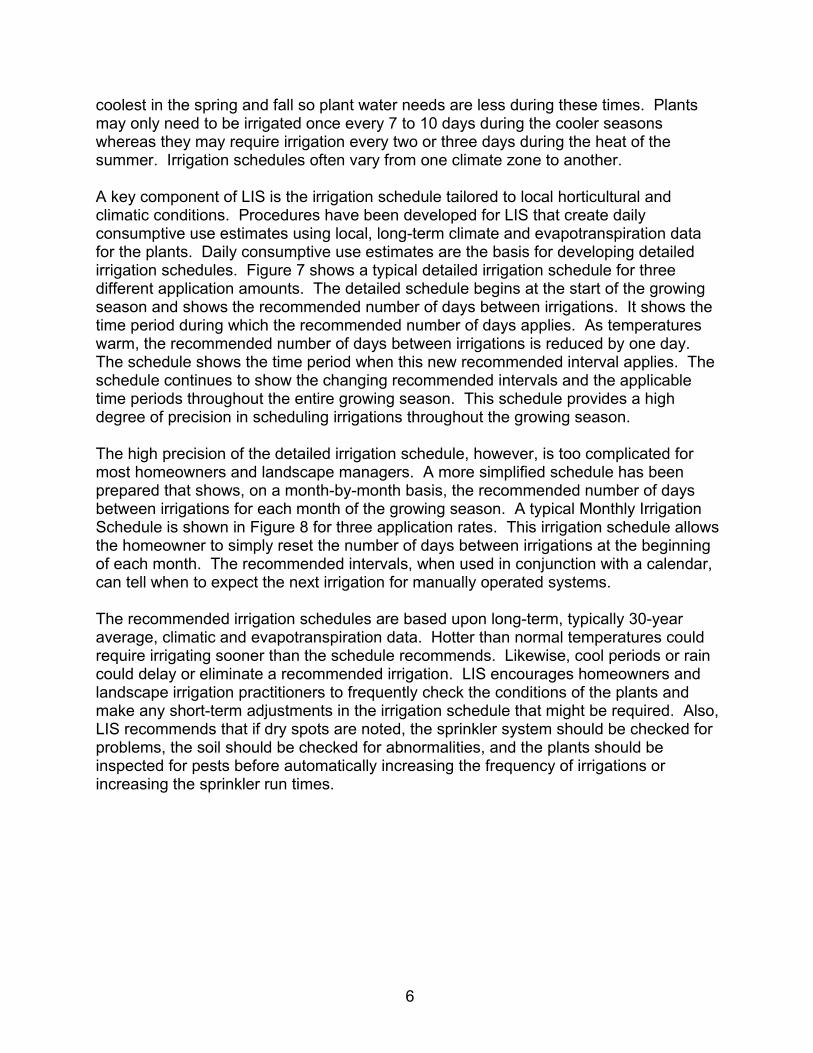
Figure 3
LIS Video
2. A simple, non-technical process for irrigating correctly that can be understood by themajority of the homeowners who have been missed in previous campaigns.
3. A more technical approach to proper irrigation that may be required by a limitednumber of homeowners, the typical landscape manager, and other irrigationprofessionals. This would be the group for whom the Irrigation Association’sCertified Landscape Irrigation Audit is too complex or too expensive for normal use.
4. A simple to use, inexpensive tool for determining sprinkler system performance.
Solution
Reclamation has developed a simple process called “Landscape Irrigation Simplified” or“LIS.” LIS addresses all three S’s. LIS provides procedures for determining systemperformance, a non-technical process for irrigating home landscapes, and anintermediate approach to fill the gap between the homeowner’s process and theIrrigation Association’s Certified Landscape Irrigation Audits.
LIS concepts have been validated by specialists from theUtah State University (USU) Center for Water EfficientLandscapes and the USU Extension Service. The USUExtension Service County Offices now provideReclamation-prepared LIS handout materials (SeeFigure 2) as the basis for irrigation recommendations tolocal homeowners. Several local water purveyors arealso using Reclamation’s LIS handouts as part of theirwater conservation campaigns.
Reclamation partnered with USUExtension Service, The Utah WaterConservation Forum, and severallocal organizations to prepare an 8-minute video entitled “It’s Easyto Save Water” that describes how homeowners can efficientlyirrigate their yards (Figure 3). The video features weatherpersonalities from two local TV stations and a turf expert from theUSU Extension Service. The Utah Water Conservation Forum hasdistributed the video to most municipalities and school librariesthrough out the state.
Two major water conservancy districts, the Jordan Valley WaterConservancy District and the Central Utah Water ConservancyDistrict, sponsor a program of providing water checks (simplifiedwater audits) for home, commercial, and institutional landscapes. The water checks are performed by USU Extension Service internsand follow LIS procedures. Reclamation has helped train the
interns for the past three years. The LIS processes are described briefly below.

4
Figure 6
Sprinkler system performance test in progress
The System. As previously mentioned, thesprinkler system, whether permanentlyinstalled or hand moved, must apply thewater as evenly as practical. The design,installation, and maintenance of thesprinkler system all affect how evenly thesprinklers apply water. Sprinklers oftenappear to be applying water evenly butlooks can be deceiving. The frequentlyappearing dry spots illustrate this problem. Figure 4 shows an example of this problem. A sprinkler system with typical uniformityapplied the desired seasonal application of30-inches but some areas only received 12-inches of water while other areas received42-inches of water.
The typical “correction” for the problem is torepeatedly increase the sprinkler run time untilthe dry spots disappear. Figure 5 shows thatwith the same sprinkler system, the dry spotreceived the desired 30-inches of water butsome areas received as much as 105-inchesof water. The average application jumpedfrom 30-inches to over 75-inches. The onlyway to know if the sprinkler is performingproperly is to measure its performance.
LIS provides a process for determiningsprinkler performance. Containers areplaced in a grid pattern on the turf. Thecontainers should be at least 3-feet from anysprinkler. The sprinklers are run for a knownamount of time. A typical sprinklerperformance test is shown in Figure 6. Thesprinkler run time may be just a few minutesor for the duration of the entire irrigationevent, depending upon the containers used. After the test, the depth of water in eachcontainer is observed. Significantdifferences in depth of water indicates eithertoo much or too little water was applied in
Figure 4
Distribution pattern for a sprinkler system
applying an annual application averaging 30-
inches in depth.
Figure 5
Distribution pattern for a typical sprinkler
system applying 30-inches to the “dry” spot.
5
some areas. This indicates some repair work is needed before the sprinklers will applywater evenly.
A more precise approach to determining sprinkler performance requires knowing themeasured depth of water in each container. The measured depths in the containers areused to calculate the “Distribution Uniformity or DU” of the sprinkler system. A DU ofless than about 0.65 to 0.70 indicates problems with the sprinkler system.
LIS helps locate and identify sprinkler problems and suggests methods for correcting theproblems. Surprisingly, most repairs are quite inexpensive and easy to fix. After repairshave been made, the test should be re-run to verify that all problems have been fixed.
The Settings. The settings of the sprinkler controller or timer should allow the sprinklersto apply the proper amount of water while minimizing or eliminating runoff. The rootzone depth, soil water holding capacity, allowable soil moisture depletion, sprinkler waterapplication rate, soil water infiltration rate, and the ground slope all combine to affect howlong the sprinklers should be run. A typical irrigation event would apply about ½-inch ofwater. This depth, however, might vary depending upon the daily consumptive use ofthe plant during the hottest part of the summer.
LIS suggests three methods for determining the correct run time. In Method #1,containers are placed in a grid on the turf prior to a normal irrigation event. After theirrigation has been completed, the amount of water collected in each container ismeasured and compared with the appropriate amount of water, for example ½-inch. Ifthe amount is not correct, the run time is adjusted and the test repeated during the nextirrigation event. Adjustments may be required over the next two or three irrigation eventsto get the correct application depth.
Method #2 involves marking the desired depth on the containers and placing them in agrid pattern on the turf. The sprinklers are then started and timed to determine thenumber of minutes required to fill the containers to the desired level. The run timeswould be recorded or set on the sprinkler controller.
Method #3 involves calculating the correct run time. The calculation requires knowingthe average application depth determined during the evaluation of the sprinkler systemalong with the length of time the test was run. This is the quickest and most precisemethod for determining sprinkler run times.
Low soil infiltration rates or excessive ground slopes may cause water to runoff beforethe irrigation application has finished. LIS provides a process for cycling the irrigationsusing shorter run times separated with soak cycles. This practice allows the correctamount of water to be applied while minimizing or eliminating runoff.
The Schedule. Individual irrigation events should be scheduled to meet local waterrequirements of the plant. The plant variety, the amount of water applied at the lastirrigation, air temperature, relative humidity, wind velocity, and solar radiation all help tocontrol how frequently the plant needs to be irrigated. Typically, temperatures are the
6
coolest in the spring and fall so plant water needs are less during these times. Plantsmay only need to be irrigated once every 7 to 10 days during the cooler seasonswhereas they may require irrigation every two or three days during the heat of thesummer. Irrigation schedules often vary from one climate zone to another.
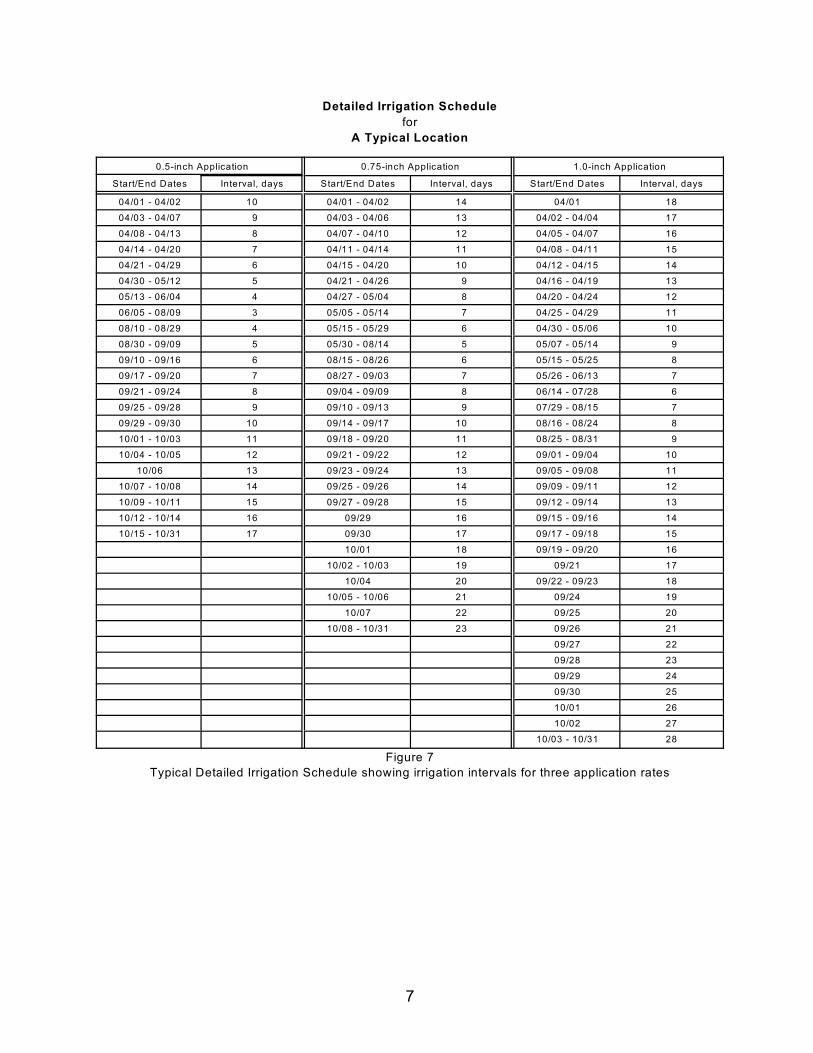
A key component of LIS is the irrigation schedule tailored to local horticultural andclimatic conditions. Procedures have been developed for LIS that create dailyconsumptive use estimates using local, long-term climate and evapotranspiration datafor the plants. Daily consumptive use estimates are the basis for developing detailedirrigation schedules. Figure 7 shows a typical detailed irrigation schedule for threedifferent application amounts. The detailed schedule begins at the start of the growingseason and shows the recommended number of days between irrigations. It shows thetime period during which the recommended number of days applies. As temperatureswarm, the recommended number of days between irrigations is reduced by one day. The schedule shows the time period when this new recommended interval applies. Theschedule continues to show the changing recommended intervals and the applicabletime periods throughout the entire growing season. This schedule provides a highdegree of precision in scheduling irrigations throughout the growing season.
The high precision of the detailed irrigation schedule, however, is too complicated formost homeowners and landscape managers. A more simplified schedule has beenprepared that shows, on a month-by-month basis, the recommended number of daysbetween irrigations for each month of the growing season. A typical Monthly IrrigationSchedule is shown in Figure 8 for three application rates. This irrigation schedule allowsthe homeowner to simply reset the number of days between irrigations at the beginningof each month. The recommended intervals, when used in conjunction with a calendar,can tell when to expect the next irrigation for manually operated systems.
The recommended irrigation schedules are based upon long-term, typically 30-yearaverage, climatic and evapotranspiration data. Hotter than normal temperatures couldrequire irrigating sooner than the schedule recommends. Likewise, cool periods or raincould delay or eliminate a recommended irrigation. LIS encourages homeowners andlandscape irrigation practitioners to frequently check the conditions of the plants andmake any short-term adjustments in the irrigation schedule that might be required. Also,LIS recommends that if dry spots are noted, the sprinkler system should be checked forproblems, the soil should be checked for abnormalities, and the plants should beinspected for pests before automatically increasing the frequency of irrigations orincreasing the sprinkler run times.
7
Detailed Irrigation Schedule
for
A Typical Location
0.5-inch Application 0.75-inch Application 1.0-inch Application
Start/End Dates Interval, days Start/End Dates Interval, days Start/End Dates Interval, days
04/01 - 04/02 10 04/01 - 04/02 14 04/01 18
04/03 - 04/07 9 04/03 - 04/06 13 04/02 - 04/04 17
04/08 - 04/13 8 04/07 - 04/10 12 04/05 - 04/07 16
04/14 - 04/20 7 04/11 - 04/14 11 04/08 - 04/11 15
04/21 - 04/29 6 04/15 - 04/20 10 04/12 - 04/15 14
04/30 - 05/12 5 04/21 - 04/26 9 04/16 - 04/19 13
05/13 - 06/04 4 04/27 - 05/04 8 04/20 - 04/24 12
06/05 - 08/09 3 05/05 - 05/14 7 04/25 - 04/29 11
08/10 - 08/29 4 05/15 - 05/29 6 04/30 - 05/06 10
08/30 - 09/09 5 05/30 - 08/14 5 05/07 - 05/14 9
09/10 - 09/16 6 08/15 - 08/26 6 05/15 - 05/25 8
09/17 - 09/20 7 08/27 - 09/03 7 05/26 - 06/13 7
09/21 - 09/24 8 09/04 - 09/09 8 06/14 - 07/28 6
09/25 - 09/28 9 09/10 - 09/13 9 07/29 - 08/15 7
09/29 - 09/30 10 09/14 - 09/17 10 08/16 - 08/24 8
10/01 - 10/03 11 09/18 - 09/20 11 08/25 - 08/31 9
10/04 - 10/05 12 09/21 - 09/22 12 09/01 - 09/04 10
10/06 13 09/23 - 09/24 13 09/05 - 09/08 11
10/07 - 10/08 14 09/25 - 09/26 14 09/09 - 09/11 12
10/09 - 10/11 15 09/27 - 09/28 15 09/12 - 09/14 13
10/12 - 10/14 16 09/29 16 09/15 - 09/16 14
10/15 - 10/31 17 09/30 17 09/17 - 09/18 15
10/01 18 09/19 - 09/20 16
10/02 - 10/03 19 09/21 17
10/04 20 09/22 - 09/23 18
10/05 - 10/06 21 09/24 19
10/07 22 09/25 20
10/08 - 10/31 23 09/26 21
09/27 22
09/28 23
09/29 24
09/30 25
10/01 26
10/02 27
10/03 - 10/31 28
Figure 7
Typical Detailed Irrigation Schedule showing irrigation intervals for three application rates

8
Figure 7
Performance evaluation cups - Professional Model
and Institutional/Homeowners Model, L-R.
Monthly Irrigation Schedule for A Typical Location
Month
Irrigation Intervals
1/2" Application 3/4" Application 1" Application
March --- --- ---
April Once every 6 days Once every 8 days Once every 11 days
May Once every 4 days Once every 6 days Once every 8 days
June Once every 3 days Once every 5 days Once every 6 days
July Once every 3 days Once every 5 days Once every 6 days
August Once every 3 days Once every 5 days Once every 7 days
September Once every 6 days Once every 8 days Once every 10 days
October Once every 10 days Once every 18 days Once every 26 days
Figure 8
Typical Monthly Turf Irrigation Schedule for Three Application Rates
Performance Evaluation Cups. The mostdifficult part of applying good landscapeirrigation practices has been getting goodsprinkler system performance information. The Bureau of Reclamation has designed(U.S. Patent No. 6,779,399) two self standing,direct reading, water measuring cups formeasuring sprinkler system performance. The cups, made of durable, clarifiedpolypropylene plastic, are designed tosimplify the process of assessing sprinklersystem performance. Both cups are self-stacking to ease transport and storage of thecups. The self-standing feature provided bythe three attached legs simplify deploymentand retrieval of the cups during a sprinklerevaluation test. The direct reading of application depths eliminates most of thecalculations associated with other measuring devices used to assess sprinkler systemperformance.
The Professional Model is 6 3/4-inches tall with a 4 1/4-inch diameter opening. It hasthree attached legs that flare outward to form a 6 1/2-inch diameter base. Ten cups forma stack 12 3/4-inches tall. Each additional cup adds 9/16-inch to the stack. This cupmeasures sprinkler application depth in inches or centimeters and volume in milliliters. Itis a low volume cup with high resolution measuring scales used primarily by landscapeirrigation professionals for short duration tests. The three measuring scalesaccommodate world-wide use of the cups.
9
The smaller cup (the Institutional/Homeowners Model) is 5-inches tall with a 3-inchopening. Its three attached legs flare out to form a 5-inch diameter base. A stack of tencups is 9-inches high. Each additional cup adds 1/2-inch to the stack. This cup is ahigher volume, lower resolution cup than the Professional Model. However, there is verylittle practical difference in the resolution of the two cups. This smaller cup is used formeasuring the application of a full irrigation event. This cup only reads application depthin inches. It is the choice of the institutional landscape practitioner who is restricted tochecking the performance of the sprinkler system during normally scheduled irrigationevents and of the homeowner.
Contacts
Michael D. Stuver, P.E.US Bureau of Reclamation125 South State Street, Room 6103Salt Lake City, Utah 84138-1147(801) [email protected]
Frederick S. Liljegren, ASLAUS Bureau of Reclamation125 South State Street, Room 6103Salt Lake City, Utah 84138-1147(801) [email protected]
References
Utah Division of Water Resources. “Utah’s Water Resources: Planning for the1
Future,” Utah State Water Plan, 2001.
Jackson, Prof. Earl K. Utah State University Cooperative Extension Service. 2
Personal Contact, 2000.
Jackson, Prof. Earl K. and Sarah A. Gedge. Water Audit Summary 2000. Utah State3
University Cooperative Extension Service for Salt Lake County. 2001.
Utah Agricultural Experiment Station. Consumptive Use of Irrigated Crops in Utah,4
Research Report 145. Utah State University. Logan, Utah. 1994 & 1998.