An innovative methodology for the automated morphometric ...
12
Summary. The management of liver steatosis, due to its potential evolution towards severe diseases, requires accurate diagnosis. Fatty infiltration in liver diseases is commonly assessed histologically by semi-quantitative methods, which can be subjective. Automated computerized procedures using commercial software for image analysis have also been recently employed. The aim of the study was to develop an innovative automated computerized procedure to accurately evaluate both the morphometry and degree of lipid accumulation in liver. Fatty infiltration was assessed in paraffin- and resin- embedded samples of steatotic livers from rats undergoing 0, 3, 7, 14, and 30-day choline-deficient diet, and from liver biopsy of a morbidly obese patient undergoing bariatric surgery. Specific software was developed, which works with a morphological operator, in addition to a chromatic one to select lipid droplets. The choline-deficient diet induced steatosis with a gradual shift from micro- to macro-vesicular. In paraffin sections, the macrovesicles-to-microvesicles ratio and the degree of steatosis, when using only the chromatic operator, produced overestimates. Results were consistent in both rat and human samples. An improvement of topographic, morphometric and quantitative estimation of fatty liver infiltration is obtained with our software, working with a morphological operator and using semi-thin sections from resin-embedded samples. This innovative procedure may be applied to human liver samples, offering promising diagnostic and prognostic perspectives. Key words: Liver steatosis, Steatohepatitis, Image analysis, Choline deficient diet, Microscopy Introduction Liver steatosis comprises abnormal accumulation of triglycerides in hepatocytes in response to metabolic, toxic, and viral conditions (Portincasa et al., 2006; Calamita and Portincasa, 2007). The most frequent form, namely the non-alcoholic fatty liver disease (NAFLD) was firstly described as a form of chronic liver disease, resembling the histological changes of alcoholic liver disease but found in subjects who do not abuse alcohol (Ludwig et al., 1980). Patients, instead, are often carriers of metabolic conditions, such as insulin resistance or diabetes, overweight, obesity, and dyslipidemia and are not affected by autoimmune, viral, neoplastic or rarer liver diseases. Histology of NAFLD, however, is indistinguishable from that of alcoholic hepatitis (Ludwig et al., 1980). The fatty liver is typically discovered in the clinical setting during routine abdominal ultrasonography, showing a "bright liver". From an epidemiological point of view, NAFLD can be considered an example of a “mass disease”, with a prevalence ranging between 20 and 40% in the adult population in Western countries (Neuschwander-Tetri and Bacon, 1996; Loguercio et al., 2001, 2004). The prevalence of NAFLD is growing worldwide due to the increasing prevalence of obesity, diabetes and the metabolic syndrome. This latter condition is a constellation of variables associated with insulin resistance that puts subjects at high risk for cardiovascular morbidity and mortality (Marchesini et al., 2003; Loguercio et al., 2004; Kahn et al., 2005). NAFLD is currently deemed as the most common cause An innovative methodology for the automated morphometric and quantitative estimation of liver steatosis Giuseppa Esterina Liquori 1 , Giuseppe Calamita 2 , Davide Cascella 3 , Maria Mastrodonato 1 , Piero Portincasa 4 and Domenico Ferri 1 1 Department of Zoology, Laboratory of Histology and Comparative Anatomy, University of Bari, Bari, Italy, 2 Department of General and Environmental Physiology, University of Bari, Bari, Italy, 3 Department of Electrotechnics and Electronics, Politecnico of Bari, Bari, Italy and 4 Department of Internal and Public Medicine, Section of Internal Medicine, University of Bari, Bari, Italy Histol Histopathol (2009) 24: 49-60 Offprint requests to: Prof. Domenico Ferri, Dipartimento di Zoologia, Laboratorio di Istologia e Anatomia comparata, Via Orabona, 4 I-70125 BariI, Italy. e-mail: [email protected] http://www.hh.um.es Histology and Histopathology Cellular and Molecular Biology
Transcript of An innovative methodology for the automated morphometric ...

Summary. The management of liver steatosis, due to itspotential evolution towards severe diseases, requiresaccurate diagnosis. Fatty infiltration in liver diseases iscommonly assessed histologically by semi-quantitativemethods, which can be subjective. Automatedcomputerized procedures using commercial software forimage analysis have also been recently employed. Theaim of the study was to develop an innovative automatedcomputerized procedure to accurately evaluate both themorphometry and degree of lipid accumulation in liver.Fatty infiltration was assessed in paraffin- and resin-embedded samples of steatotic livers from ratsundergoing 0, 3, 7, 14, and 30-day choline-deficient diet,and from liver biopsy of a morbidly obese patientundergoing bariatric surgery. Specific software wasdeveloped, which works with a morphological operator,in addition to a chromatic one to select lipid droplets.The choline-deficient diet induced steatosis with agradual shift from micro- to macro-vesicular. In paraffinsections, the macrovesicles-to-microvesicles ratio andthe degree of steatosis, when using only the chromaticoperator, produced overestimates. Results wereconsistent in both rat and human samples. Animprovement of topographic, morphometric andquantitative estimation of fatty liver infiltration isobtained with our software, working with amorphological operator and using semi-thin sectionsfrom resin-embedded samples. This innovativeprocedure may be applied to human liver samples,offering promising diagnostic and prognosticperspectives.
Key words: Liver steatosis, Steatohepatitis, Imageanalysis, Choline deficient diet, Microscopy
Introduction
Liver steatosis comprises abnormal accumulation oftriglycerides in hepatocytes in response to metabolic,toxic, and viral conditions (Portincasa et al., 2006;Calamita and Portincasa, 2007). The most frequent form,namely the non-alcoholic fatty liver disease (NAFLD)was firstly described as a form of chronic liver disease,resembling the histological changes of alcoholic liverdisease but found in subjects who do not abuse alcohol(Ludwig et al., 1980). Patients, instead, are often carriersof metabolic conditions, such as insulin resistance ordiabetes, overweight, obesity, and dyslipidemia and arenot affected by autoimmune, viral, neoplastic or rarerliver diseases. Histology of NAFLD, however, isindistinguishable from that of alcoholic hepatitis(Ludwig et al., 1980). The fatty liver is typicallydiscovered in the clinical setting during routineabdominal ultrasonography, showing a "bright liver".From an epidemiological point of view, NAFLD can beconsidered an example of a “mass disease”, with aprevalence ranging between 20 and 40% in the adultpopulation in Western countries (Neuschwander-Tetriand Bacon, 1996; Loguercio et al., 2001, 2004). Theprevalence of NAFLD is growing worldwide due to theincreasing prevalence of obesity, diabetes and themetabolic syndrome. This latter condition is aconstellation of variables associated with insulinresistance that puts subjects at high risk forcardiovascular morbidity and mortality (Marchesini etal., 2003; Loguercio et al., 2004; Kahn et al., 2005).NAFLD is currently deemed as the most common cause
An innovative methodology for the automated morphometric and quantitative estimation of liver steatosisGiuseppa Esterina Liquori1, Giuseppe Calamita2, Davide Cascella3, Maria Mastrodonato1, Piero Portincasa4 and Domenico Ferri11Department of Zoology, Laboratory of Histology and Comparative Anatomy, University of Bari, Bari, Italy, 2Department of General
and Environmental Physiology, University of Bari, Bari, Italy, 3Department of Electrotechnics and Electronics, Politecnico of Bari, Bari,
Italy and 4Department of Internal and Public Medicine, Section of Internal Medicine, University of Bari, Bari, Italy
Histol Histopathol (2009) 24: 49-60
Offprint requests to: Prof. Domenico Ferri, Dipartimento di Zoologia,Laboratorio di Istologia e Anatomia comparata, Via Orabona, 4 I-70125BariI, Italy. e-mail: [email protected]
http://www.hh.um.es
Histology andHistopathology
Cellular and Molecular Biology

of chronic liver disease in humans (Portincasa et al.,2005) with potential harmful evolution towards thenecro-inflammatory form of non-alcoholic steato-hepatitis (NASH) in 10-15% of the cases (Matteoni etal., 1999) and liver cirrhosis in 20% of NASH patients,and a cumulative payload associated with NAFLDestimated to account for 30-40% of all deaths from liverdiseases (Poonawala et al., 2000). Although imagingtechniques, including hepatic ultrasonography, computedtomography and nuclear magnetic resonance have highsensitivity and specificity (>90%) for the diagnosis ofliver steatosis itself, the ultimate diagnosis ofNAFLD/NASH requires invasive liver biopsy, followedby histology, to quantify the true degree of steatosis,fibrosis and necroinflammatory changes (Brunt et al.,1999). Morphologically, liver steatosis is classified aseither macrovesicular or microvesicular in type (Burt etal., 1998; Fong et al., 2000). Microvesicular steatosis ischaracterised by the presence within the hepatocytes ofnumerous small lipid vesicles, having a mean diameterof less than 15 µm (Zaitoun et al., 2001), or less than themean diameter of the hepatocyte nucleus (Marsman etal., 2004). In contrast, macrovesicular steatosis ischaracterised by the presence of a large fat globule thatdisplaces the nucleus within hepatocytes. Microvesicularsteatosis is generally a more severe disease thanmacrovesicular, and occurs in a variety of conditionswith defective fatty acid ß-oxidation (Burt et al., 1998;Reddy an Mannaerts, 1994; Sherlock, 1995).Macrovesicular steatosis is generally deemed as a benigncondition, being associated with changes to the lipidmetabolism, and potentially reversible in most instances.Depending on liver diseases, fat globules may berestricted to centrilobular or periportal hepatocytes, orwidely diffused throughout the hepatic lobule(panlobular steatosis). A correct histological typing andevaluation of the degree of steatosis are obviouslyimportant for both prognostic and diagnostic purposes.The determination of micro- and macrovesicularsteatosis in donor livers is also crucial within the livertransplantation program (Urena et al., 1998). Fatty liverinfiltration is commonly assessed by opticalsemiquantitative methods (Nagore and Scheuer, 1988).However, methods are inaccurate and can be highlysubjective; computerized procedures using commerciallyavailable automated analysis softwares have also beentested on human liver biopsy specimens (Auger et al.,1986; Zaitoun et al., 2001; Marsman et al., 2004) and onrat models of liver steatosis obtained by choline-deficient diet (Marsman et al., 2004). In all cases, imageanalyses were performed on haematoxylin and eosin(H&E)-stained slides prepared from liver samplesembedded in paraffin wax. The aims of this study wereto (i) innovate an automated computerized methodologyto assess the morphological and quantitative profile offat liver accumulation, and (ii) provide novel insightsinto the clinico-pathological estimation of human liversteatosis. Automated analysis was set up with fatty liversobtained from rats undergoing a choline-deficient diet,
and applied also to liver samples from a morbidly obesesubject undergoing bariatric surgery.
Materials and methods
Adult male Wistar rats (weighting 250-350g; Harlan,S. Pietro al Natisone, Italy) were maintained on astandard diet and water ad libitum, kept in individualcages under controlled conditions of temperature andhumidity and a constant 12-hour light/dark cycle,according to the Guide for the Care and Use ofLaboratory Animals (National Institutes of Health).Animals had access to standard rat chow and tap waterfor the whole study period. Induction of fatty liver in theabsence of necro-inflamatory and body weight changeswas obtained by feeding rats with the choline-deficientdiet (Dyets Inc., Bethlem, PA), as previously publishedby our group (Grattagliano et al., 2000, 2003) and others(Kulinski et al., 2004). This diet increases livertriglyceride content in the rodent model (Raubenheimeret al., 2006). The control group consisted of rats fedadequate levels of choline. Three rats from each group(i.e. choline-deficient diet and control diet) were killedafter 0, 3, 7, 14 and 30 days of diet. Animals wereanesthetized and their livers quickly removed. The studywas approved by the State Committee on animalexperimentation.
Human liver sections were obtained from the liverbiopsy of a morbidly obese patient undergoing bariatricsurgery after obtaining informed written consent. Theprocedure was part of a routine histological examinationof a macroscopically-evident fatty liver.
Histological studies
Either rat or human liver samples were fixed in 10%formalin solution and processed for paraffin-waxembedding. Other samples were fixed in 4%glutaraldehyde and processed for embedding in EpoxyResin-Araldite (M) CY212 (TAAB, Aldermaston,England). Sections (5 µm thick) from paraffin-embeddedspecimens were routinely stained with haematoxylin-eosin (H&E) and with periodic acid-Schiff (PAS). Semi-thin sections (2 µm thick) from epoxy resin embeddedspecimens, obtained using a Ultratome IIIultramicrotome (LKB, Bromma, Sweden), weresequentially stained with Toluidine blue-PAS (PAS-TB).For quantitative histological analyses, at least 6 digitalpictures (original magnification: 400x) were taken foreach sample using a Nikon Eclipse 600 photomicroscopeequipped with a Nikon DMX 1200 camera (NikonInstruments SpA, Calenzano, FI, Italy).
Image analysis
The image analysis software was developed with theMathWorks Matlab 2007b. Histologically, lipid dropletsare characterised by chromatic uniformity and circularshape. These features were used as discrimination
50
Automated assessment of liver steatosis
criteria in developing algorithms for the automatedimage-processing software. The software operates thefollowing three algorithms: image conditioning (datapre-processing), chromatic and morphologic analysis(pattern recognition), and classification and outputgeneration (interpreting results). Image conditioning isnecessary to correct the spatial chromatic gradientswhich typically occur when the image is captured withnon-uniform lighting. To select the lipid areas, chromaticand morphological analysis follows four steps (Fig. 1).Starting from an initial chromatic reference (algorithminitialization), the algorithm selects a blob mask (set ofsegmented regions) containing all the lipids but alsofalse positive cases. As a second step, the blob mask isprocessed by an erosion filter (Haralick and Shapiro,1992). This morphological operator reduces all theselected blobs and consequently discards any very smallblobs caused by the chromatic noise in the imagebackground. In the third step, a dilation filter extends theblobs to their original size (van den Boomgard and VanBalen, 1992). In the fourth step, the eccentricity filterfurther reduces the number of selected blobs by checkingtheir shape (Matlab 2007b, The MathWorks, Natick, MAUS). A statistical analysis, carried out on a sample of500 lipid droplets, revealed that in 95% of cases theireccentricity index was less than 0.1. Hence, blobs withan eccentricity index greater than 0.1 are excluded. Falsepositive cases are discarded, e.g. a sinusoid with thesame colour and size as the lipids may pass the firstthree steps, but not the fourth because of their shape (farfrom a circle). Finally, the sets of blobs corresponding tolipids are finally divided into microvesicles, with a meandiameter of less than 15 µm, and macrovesicles with amean diameter equal or larger than 15 µm, according toZaitoun and co-workers (Zaitoun et al., 2001). Finally,the software generates the output report containing all
relevant data.
Statistical analysis
Data are reported as means±standard error (SEM).For each experimental condition, data obtained fromparaffin embedded specimens were compared to thoseobtained from resin embedded samples by the Student'st-test. A two-tailed P value of less than 0.05 wasconsidered significant. All calculations were performedwith the NCSS2007 statistical software (Kaysville, UT,USA) (Armitage and Berry, 1994; Dawson and Trapp,2001).
Results
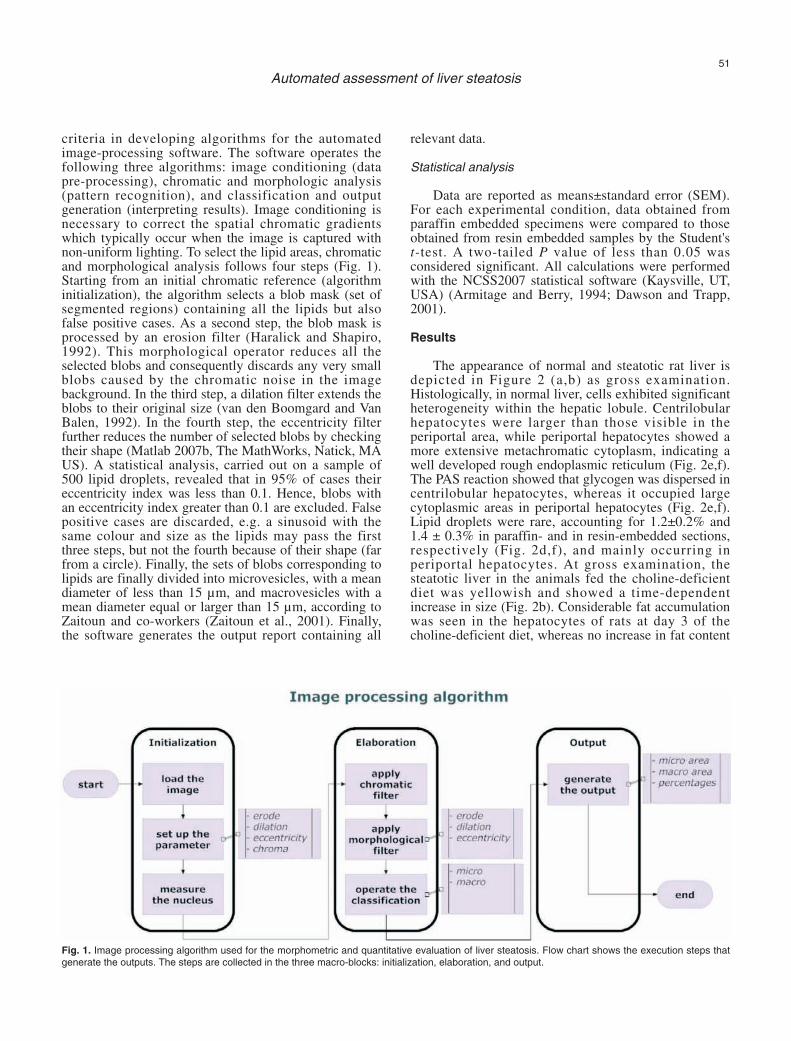
The appearance of normal and steatotic rat liver isdepicted in Figure 2 (a,b) as gross examination.Histologically, in normal liver, cells exhibited significantheterogeneity within the hepatic lobule. Centrilobularhepatocytes were larger than those visible in theperiportal area, while periportal hepatocytes showed amore extensive metachromatic cytoplasm, indicating awell developed rough endoplasmic reticulum (Fig. 2e,f).The PAS reaction showed that glycogen was dispersed incentrilobular hepatocytes, whereas it occupied largecytoplasmic areas in periportal hepatocytes (Fig. 2e,f).Lipid droplets were rare, accounting for 1.2±0.2% and1.4 ± 0.3% in paraffin- and in resin-embedded sections,respectively (Fig. 2d,f), and mainly occurring inperiportal hepatocytes. At gross examination, thesteatotic liver in the animals fed the choline-deficientdiet was yellowish and showed a time-dependentincrease in size (Fig. 2b). Considerable fat accumulationwas seen in the hepatocytes of rats at day 3 of thecholine-deficient diet, whereas no increase in fat content
51
Automated assessment of liver steatosis
Fig. 1. Image processing algorithm used for the morphometric and quantitative evaluation of liver steatosis. Flow chart shows the execution steps thatgenerate the outputs. The steps are collected in the three macro-blocks: initialization, elaboration, and output.
52
Automated assessment of liver steatosis
Fig. 2. Gross anatomy of control rat liver (a) and liver with steatosis experimentally induced by a 30-day choline deficient diet (b). The fatty liver isclearly increased in mass and has a yellowish appearance. c-f. Lipid contents in hepatocytes of control rats. c, d. Section of liver samples embedded inparaffin wax stained with H&E, showing rare lipid droplets; insets, magnification of dashed rings. d. Selection (green spots) of lipid areas by automatedcomputerised method; red rings, unspecific selection of sinusoids as lipid droplets. e, f. Semi-thin section of liver samples embedded in epoxy resinstained with PAS-TB. f. Selection (green spots) of lipid areas by automated computerised method. Bars: a, b, 1 cm; c, d, e, f, 90 µm.
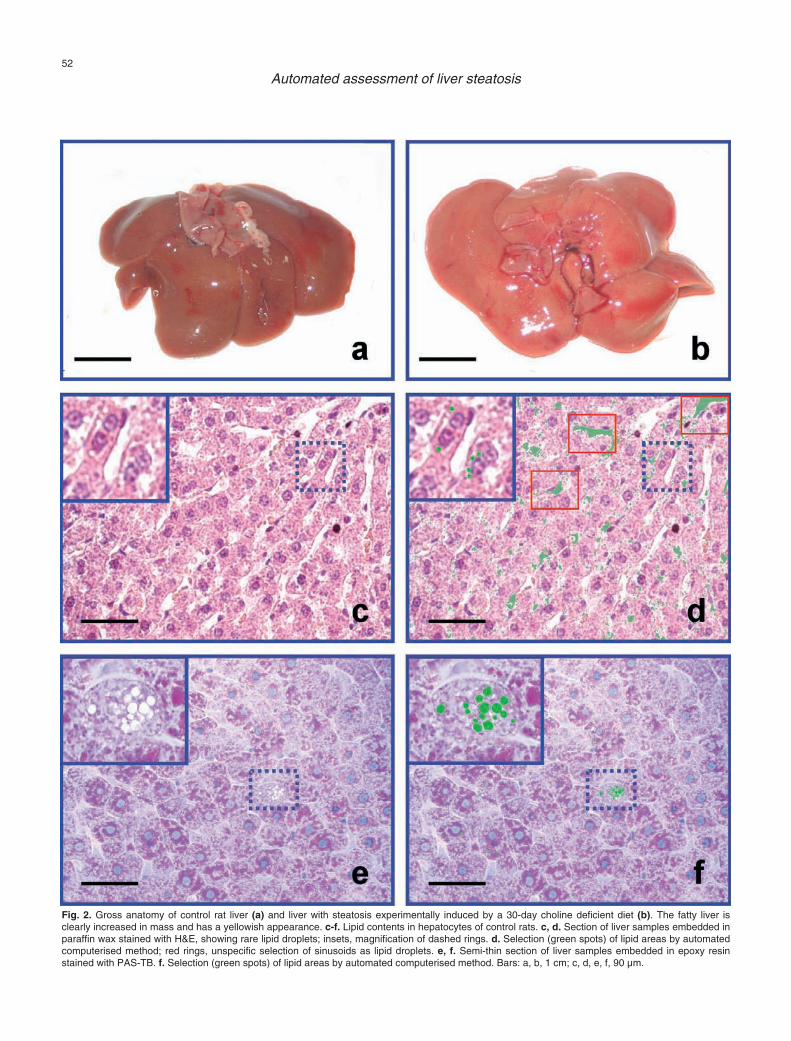
was observed in the control counterparts. Steatosis wasmostly microvesicular and mostly in the periportal area.Glycogen stores appeared moderately reduced, andsinusoids were scarcely dilated (Fig. 3a). Table 1 showsthe percentages of fat content obtained from paraffin andepoxy resin sections, respectively, at 0, 3, 7, 14 and 30days of diet. Data presented are based on the use of allmorphological operators, including the eccentricity filter.Table 2 summarizes the percentages of total lipidsmeasured as microvesicles. When H&E slides preparedfrom the paraffin-embedded samples were analyzed by asoftware based only on chromatic-based criteria for lipidselection, unspecific selection of sinusoids as lipid areaswas observed (Fig. 3b, red rings). The thickness of theparaffin sections, moreover, caused the overlapping of
53
Automated assessment of liver steatosis
Fig. 3. Fat infiltration in rat liver parenchyma after 3 days of choline-deficient diet. a, b. Section of liver samples embedded in paraffin wax stained withH&E. b. Selection (green spots) of lipid areas by automated computerised method. Red rings: sinusoids erroneously selected as lipid droplets. c, d. Semi-thin section of liver samples embedded in epoxy resin stained with PAS-TB. d. Selection (green spots) of lipid areas by automatedcomputerised method. Bars: 90 µm.
Table 1. Automated software analysis of fat content in the liver of ratsfed a choline-deficient diet.
Time (days) Paraffin Epoxy resin p *embedded sections embedded sections
0 1.2±0.2 1.4±0.3 0.087 (NS) 3 18.8±1.1 10.8±0.9 <0.01 7 40.3±2.2 24.5±1.8 <0.01
14 44.5±1.7 30.5±2.4 <0.01 30 62.1±2.5 60±1.8 0.052 (NS)
Data, expressed in percentage, are mean±SE; * Student's t -testbetween each group at each time-point; NS, not significant.

individual microvesicles and this was biased since theywere computed as macrovesicles. The distribution ofmacro- and microvesicles was better documented withsemi-thin sections obtained from resin-embeddedsamples (Fig. 3c). Image analysis of paraffin sectionsshowed that the liver parenchymal fat content in choline-deficient fed rats after three days was 18.8±1.1% (70%as microvesicles), whereas the fat content measured withthe resin sections was of a lower extent (10.8±0.9%;93% as microvesicles) (Fig. 3d). At day 7 of the choline-deficient diet, hepatocyte steatosis was still mainlymicrovesicular. Nevertheless, the number of vesicles washigher than at day 3, leading to the apparent coalescenceof microvesicles to form macrovesicles. The cytoplasmwas still relatively abundant (Fig. 4a). Automatic
54
Automated assessment of liver steatosis
Fig. 4. Fat infiltration in rat liver parenchyma after 7 days of choline-deficient diet. a, b. Section of liver samples embedded in paraffin wax stained withH&E. b. Selection (green spots) of lipid areas by automated computerised method. Red rings: sinusoids erroneously selected as lipid droplets. c, d. Semi-thin section of liver samples embedded in epoxy resin stained with PAS-TB. d. Selection (green spots) of lipid areas by automatedcomputerised method. Bars: 90 µm.
Table 2. Automated software analysis of percent fat microvesicles in theliver of rats fed a choline-deficient diet.
Percent microvesicles vs. total lipids
Days Paraffin embedded sections Epoxy resin embedded sections
0 98 100 3 70 93 7 30 57
14 15 35 30 5 13

55
Automated assessment of liver steatosis
Fig. 5. Fat infiltration in rat liver parenchyma after 14 days of choline-deficient diet. a-e. Section of liver samples embedded in paraffin wax stained withH&E. b. Selection (green spots) of lipid areas by automated computerised method. c. Detail of Fig 3a showing some sinusoids (arrowheads) interposedbetween adjacent hepatocytes. d. Unspecific selection of the same sinusoids as lipid areas (arrowheads) resulting from image analysis performedexclusively with a chromatic filter. e. Unspecific selection of the sinusoids (arrowheads) was eliminated by introducing a morphological operator whichcontemplates the shape factor in addition to the chromatic one for the selection of lipid areas. f, g. Semi-thin section of liver samples embedded inepoxy resin stained with PAS-TB. g. Selection (green spots) of lipid areas by automated computerised method. Bars: a, b, f, g, 90 µm; c, d, e, 45 µm.
selection of lipid areas based only on chromatic criteriashowed notable background, sometimes associated withnon-specific sinusoid selection as lipid areas (Fig. 4b).The mean percentage value of fat content obtained fromimage analysis of paraffin sections (35.4±2.2%; 30% asmicrovesicles) was significantly higher (P<0.01) than inthe resin sections (24.5±1.8%, 57% as microvesicles)(Fig. 4c,d). After 14 days of choline-deficient diet,steatosis became a microvesicular-macrovesicular type(Fig. 5a), with a remarkable prevalence of macrovesiclesin the periportal area. Unspecific selection of sinusoidswas seen with sections analysed solely with a chromaticfilter (Fig. 5b-d). The use of a morphological operatorfor the selection of lipid areas either eliminated, orstrongly reduced, both background and unspecific
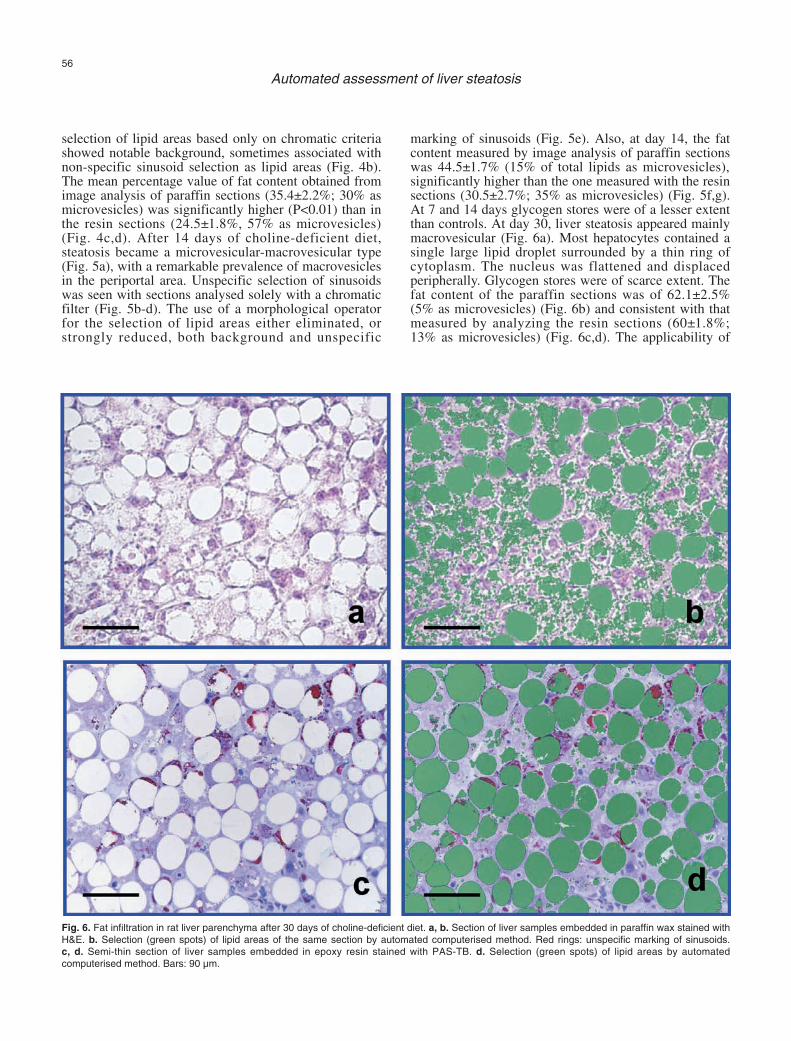
marking of sinusoids (Fig. 5e). Also, at day 14, the fatcontent measured by image analysis of paraffin sectionswas 44.5±1.7% (15% of total lipids as microvesicles),significantly higher than the one measured with the resinsections (30.5±2.7%; 35% as microvesicles) (Fig. 5f,g).At 7 and 14 days glycogen stores were of a lesser extentthan controls. At day 30, liver steatosis appeared mainlymacrovesicular (Fig. 6a). Most hepatocytes contained asingle large lipid droplet surrounded by a thin ring ofcytoplasm. The nucleus was flattened and displacedperipherally. Glycogen stores were of scarce extent. Thefat content of the paraffin sections was of 62.1±2.5%(5% as microvesicles) (Fig. 6b) and consistent with thatmeasured by analyzing the resin sections (60±1.8%;13% as microvesicles) (Fig. 6c,d). The applicability of
56
Automated assessment of liver steatosis
Fig. 6. Fat infiltration in rat liver parenchyma after 30 days of choline-deficient diet. a, b. Section of liver samples embedded in paraffin wax stained withH&E. b. Selection (green spots) of lipid areas of the same section by automated computerised method. Red rings: unspecific marking of sinusoids. c, d. Semi-thin section of liver samples embedded in epoxy resin stained with PAS-TB. d. Selection (green spots) of lipid areas by automatedcomputerised method. Bars: 90 µm.
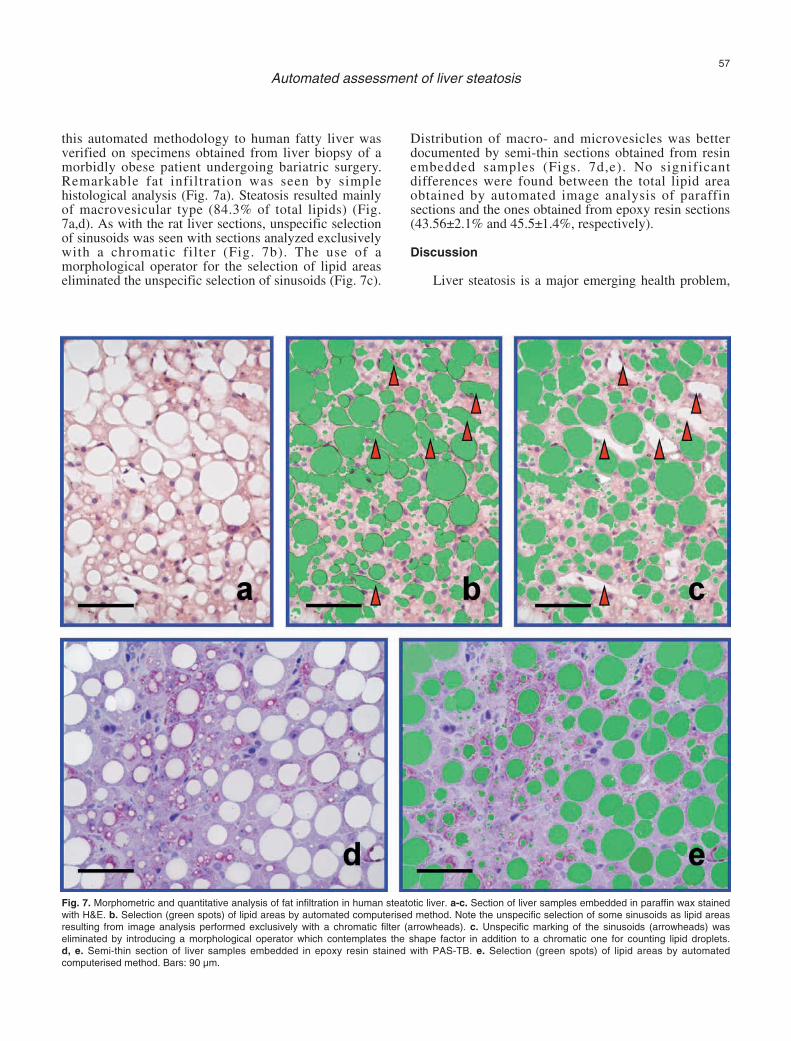
this automated methodology to human fatty liver wasverified on specimens obtained from liver biopsy of amorbidly obese patient undergoing bariatric surgery.Remarkable fat infiltration was seen by simplehistological analysis (Fig. 7a). Steatosis resulted mainlyof macrovesicular type (84.3% of total lipids) (Fig.7a,d). As with the rat liver sections, unspecific selectionof sinusoids was seen with sections analyzed exclusivelywith a chromatic filter (Fig. 7b). The use of amorphological operator for the selection of lipid areaseliminated the unspecific selection of sinusoids (Fig. 7c).
Distribution of macro- and microvesicles was betterdocumented by semi-thin sections obtained from resinembedded samples (Figs. 7d,e). No significantdifferences were found between the total lipid areaobtained by automated image analysis of paraffinsections and the ones obtained from epoxy resin sections(43.56±2.1% and 45.5±1.4%, respectively).
Discussion
Liver steatosis is a major emerging health problem,
57
Automated assessment of liver steatosis
Fig. 7. Morphometric and quantitative analysis of fat infiltration in human steatotic liver. a-c. Section of liver samples embedded in paraffin wax stainedwith H&E. b. Selection (green spots) of lipid areas by automated computerised method. Note the unspecific selection of some sinusoids as lipid areasresulting from image analysis performed exclusively with a chromatic filter (arrowheads). c. Unspecific marking of the sinusoids (arrowheads) waseliminated by introducing a morphological operator which contemplates the shape factor in addition to a chromatic one for counting lipid droplets. d, e. Semi-thin section of liver samples embedded in epoxy resin stained with PAS-TB. e. Selection (green spots) of lipid areas by automatedcomputerised method. Bars: 90 µm.
often associated with metabolic disorders, alcoholic liverdisease, and chronic viral hepatitis (Calamita andPortincasa, 2007). Even a simple fatty liver may have anunfavorable clinical outcome, with potential evolutiontoward cirrhosis and hepatocellular carcinoma, as in thecase of the NAFLD/NASH sequence (Saito et al., 2007).Thus, accurate morphometric and quantitative evaluationof the degree of steatosis, together with a number ofother features, including necroinflammatory and fibroticchanges, plays a key role when assessing the fatty liver(Brunt et al., 1999; Matteoni et al., 1999; Kleiner et al.,2005; Saito et al., 2007). As reported for NASH,however, sampling error of liver biopsy can result insubstantial misdiagnosis and staging inaccuracies(Ratziu et al., 2005; Merriman et al., 2006). We used acholine-deficient diet (Grattagliano et al., 2000, 2003)that reliably induces fatty liver in rodents due totriglyceride accumulation, which is not associated withweight loss or significant steatohepatitis (Kulinski et al.,2004). Observations on fatty liver changes were alsoextended to human liver. The degree of lipid infiltrationin liver disease is commonly assessed on histologicalsections by semi-quantitative scoring systems (Nagoreand Scheuer, 1988). Recently, automated computerizedmethods have been also introduced (Auger et al., 1986;Zaitoun et al., 2001; Marsman et al., 2004), havingrecourse to liver embedded paraffin sections stained withH&E and, for the image analysis, to commonly availablecommercial software. Since the results of image analysisare highly dependent on the quality of the histologicalspecimens, we aimed to markedly improve the currentlyavailable automated computerized methods by (i) usingsemi-thin histological sections (2 µm) obtained fromepoxy resin embedded samples, (ii) staining the sectionswith PAS-TB to label all cytoplasm areas not occupiedby lipid droplets and (iii) using a specific softwaresupplied with a morphological operator in addition to achromatic one to select lipid droplets. This approach hasthe advantage of providing well defined histologicalimages, with better delimitation of microvesicles, evenwhen small in size. Also, any errors that may occurwhen the automated lipid selection is based only onchromatic criteria are avoided, because the programconsiders both shape and color as factors for selectingthe areas of lipid infiltration. To check the validity of ourmethod, the automated evaluation of paraffin-embeddedsections was compared with that using the epoxy resinsections in a well validated rodent model of fatty liver.The choline-deficient diet induced steatotic changesstarting in the periportal zone, as previously described(Rushmore et al., 1987; Nieto and Rojkind, 2007).During the 30 days of diet, we observed a full range ofsteatotic changes: microvesicular (early stage), micro-and macrovesicular (intermediate stage) and mainlymacrovesicular (late stage at 30 days of diet).
However, we noticed that underestimation of lipidmicrovesicles occurs when steatotic livers are analyzedas paraffin-embedded sections. This is an exceedinglyimportant aspect when evaluating the clinical and
prognostic profile of patients with liver diseases. Ofnote, lipid underestimation is strongly reduced whenlivers are embedded in epoxy resin (Table 2). Whencomparing the percentages of lipid microvesicles andmacrovesicles in rat steatotic livers, the greatestdifference is observed at the microvesicular stage (day 3in our experimental model), a critical time in thepathogenesis of steatosis. Another critical parameter inanalyzing liver steatosis regards the operator used toselect the areas of lipid infiltration within hepaticparenchyma. In paraffin sections stained with H&E, thedegree of steatosis appears to be overestimated whenusing only the chromatic operator as a criterion forselecting the areas of lipid accumulation. This is likelydue to the fact that the automatic selection includes non-lipid areas with the same histological colour as the lipidareas. False positive areas may relate to sinusoidalspaces or glycogen stores and REL areas withinhepatocyte. These drawbacks are considerably reducedby using semi-thin sections stained with PAS-TB, wherethe definition of the lipid droplets is of a satisfactorylevel for a careful chromatic distinction between true andsome of the false positive areas of lipid infiltration.Besides, background or unspecific selection of sinusoidswas drastically reduced with our image analysis softwarewhen working with a morphological operator in additionto a chromatic one. This sophistication led to theexclusion of false positive areas with the same colour asthe lipid droplets but of irregular shape (circular or ovoidareas were considered as true lipid ones). Themacrovesicles-to-microvesicles ratio producesoverestimates when the intermediate stage (micro- andmacrovesicular stage) is analysed using paraffinsections. Indeed, due to the thickness of the sections,overlapping microvesicles are read as macrovesicles bythe computerized system. Overestimation of this ratio isa recurrent (and still unsolved) problem threatening liverpathologists, as demonstrated by a previous comparativestudy of automated image analysis and semi-quantitativeestimations of alcoholic liver steatosis (Auger et al.,1986).
At the macrovesicular stage of steatosis (day 30 inour rat model) no significant differences are foundbetween data obtained from paraffin and epoxy resinsections. This is reasonably explained by the fact that atsuch an advanced stage of steatosis microvesiclescoalesce, forming single (or few) lipid dropletsoccupying most of the cytoplasm, a situation that iscorrectly counted by the image analysis software.Moreover, background is scarce and errors due tounspecific staining of sinusoids are of negligible extentsince their lumen is reduced due to the dilation to whichhepatocytes undergo in steatosis (Rao et al., 2001). Animportant issue in this work is that the automatedcomputerized methods may be usefully employed in themorphometric and quantitative estimation of fatinfiltration in samples of human liver biopsies or surgeryresections. In conclusion, our automated image analysistechnique applied to semi-thin sections prepared from
58
Automated assessment of liver steatosis
liver samples embedded in epoxy resin and stained withPAS-TB considerably improves the topographic,morphometric and quantitative evaluation of liversteatosis. This becomes particularly valuable when fatinfiltration is of microvesicular type, which is generallya more severe disease than the macrovesicular form.Microvesicular steatosis of the liver, has been describedin association with a number of clinical features,including acute fatty liver of pregnancy, congenitaldefects of fatty acid beta oxidation, Reye’s syndrome,toxicity of several drugs, defects of urea cycle enzymes,cholesterol ester storage disease (Hautekeete et al.,1990).
Of note, the procedure seems to have the requisitesto be applied to human liver samples, offering promisingdiagnostic and prognostic perspectives.
References
Armitage P. and Berry G. (1994). Statistical methods in medicalresearch. Blackwell Science Ltd. Oxford.
Auger J., Schoevaert D. and Martin E.D. (1986). Comparative study ofautomated morphometric and semiquantitative estimations ofalcoholic liver steatosis. Anal. Quant. Cytol. Histol. 8, 56-62.
Brunt E.M., Janney C.G., Di Bisceglie A.M., Neuschwander-Tetri B.A.and Bacon B.R. (1999). Nonalcoholic steatohepatitis: a proposal forgrading and staging the histological lesions. Am. J.Gastroenterology 94, 2467-2474.
Burt A.D., Mutton A. and Day C.P. (1998). Diagnosis and interpretationof steatosis and steatohepatitis. Semin. Diagn. Pathol. 15, 246-258.
Calamita G. and Portincasa P. (2007). Present and future therapeuticstrategies in non-alcoholic fatty liver disease. Export. Opin. Ther.Targets 11, 1231-1249.
Dawson B. and Trapp R. G. (2001). Basic & Clinical Biostatistics.McGraw-Hill. New York.
Fong D.G., Nehra V., Lindor K.D. and Buchman A.L. (2000). Metabolicand nutritional considerations in nonalcoholic fatty liver. Hepatology32, 3-10.
Grattagliano I., Caraceni P., Portincasa P., Domenicali M., PalmieriV.O., Trevisani F., Bernardi M. and Palasciano G. (2003).Adaptation of subcellular glutathione detoxification system to stressconditions in choline-deficient diet induced rat fatty liver. Cell. Biol.Toxicol. 19, 355-366.
Grattagliano I., Vendemiale G., Caraceni P., Domenicali M., Nardo B.,Cavallari A., Trevisani F., Bernardi M. and Altomare E.. (2000).Starvation impairs antioxidant defense in fatty livers of rats fed acholine-deficient diet. J. Nutr. 130, 2131-2136.
Haralick R.M. and Shapiro L. G. (1992). Computer and Robot Vision.Addison-Wesley. New York. pp. 158-205.
Hautekeete M.L., Degott C. and Benhamou J.P. (1990). Microvesicularsteatosis of the liver. Acta Clin. Belg. 45, 311-26.
Kahn R., Buse J., Ferrannini E. and Stern M. (2005). The metabolicsyndrome: time for a critical appraisal. Joint statement from theAmerican Diabetes Association and the European Association forthe Study of Diabetes. Diabetologia 48, 1684-1699.
Kleiner D.E., Brunt E.M., Van Natta M., Behling C., Contos M.J.,Cummings O.W., Ferrell L.D., Liu Y.C., Torbenson M.S., Unalp-Arida A., Yeh M., McCullough A.J. and Sanyal A.J. (2005). Design
and validation of a histological scoring system for nonalcoholic fattyliver disease. Hepatology 41, 1313-1321.
Kulinski A., Vance D.E. and Vance J.E. (2004). A choline-deficient dietin mice inhibits neither the CDP-choline pathway forphosphatidylcholine synthesis in hepatocytes nor apolipoprotein Bsecretion. J. Biol. Chem. 279, 23916-23924.
Loguercio C., De Girolamo V., De Sio I., Tuccillo C., Ascione A., BaldiF., Budillon G., Cimino L., Di Carlo A., Di Marino M.P., Morisco F.,Picciotto F., Terracciano L., Vecchione R., Verde V. and DelVecchio B.C. (2001). Non-alcoholic fatty liver disease in an area ofsouthern Italy: main clinical, histological, and pathophysiologicalaspects. J. Hepatol. 35, 568-574.
Loguercio C., De Simone T., D'Auria M.V., De Sio I, Federico A.,Tuccillo C., Abbatecola A.M., Del Vecchio B.C. and the AISF Group.(2004). Non-alcoholic fatty liver disease: a multicentre clinical studyby the Italian Association for the Study of the Liver. Dig. Liver Dis.36, 398-405.
Ludwig J., Viggiano T.R., McGill D.B. and Oh B.J. (1980). Nonalcoholicsteatohepatitis: Mayo Clinic experiences with a hitherto unnameddisease. Mayo Clin. Proc. 55, 434-438.
Marchesini G., Bugianesi E., Forlani G., Cerrelli F., Lenzi M., Manini R.,Natale S., Vanni E., Villanova N., Melchionda N. and Pizzetto M.(2003). Nonalcoholic fatty liver, steatohepatitis, and the metabolicsyndrome. Hepatology 37, 917-923.
Marsman H., Matsushita T., Dierkhising R., Kremers W., Rosen C.,Burgart L. and Nyberg S.L. (2004). Assessment of donor liversteatosis: pathologist or automated software? Hum. Pathol. 35, 430-435.
Matteoni C.A., Younossi Z.M., Gramlich T., Boparai N., Liu Y.C. andMcCullough A.J. (1999). Nonalcoholic fatty liver disease: a spectrumof clinical and pathological severity. Gastroenterology 116, 1413-1419.
Merriman R.B., Ferrell L.D., Patti M.G., Weston S.R., Pabst M.S.,Aouizerat B.E. and Bass N.M. (2006). Correlation of paired liverbiopsies in morbidly obese patients with suspected nonalcoholicfatty liver disease. Hepatology 44, 874-880.
Nagore N. and Scheuer P.J. (1988). The pathology of diabetic hepatitis.J. Pathol. 156, 155-160.
Neuschwander-Tetri B.A. and Bacon B.R. (1996). Nonalcoholicsteatohepatitis. Med. Clin. North Am. 80, 1147-1166.
Nieto N. and Rojkind M. (2007). Repeated whiskey binges promote liverinjury in rats fed a choline-deficient diet. J. Hepatol. 46, 330-339.
Poonawala A., Nair S.P. and Thuluvath P.J. (2000). Prevalence ofobesity and diabetes in patients with cryptogenic cirrhosis: a case-control study. Hepatology 32, 689-692.
Portincasa P., Grattagliano I., Palmieri V.O. and Palasciano G. (2006).Current pharmacological treatment of nonalcoholic fatty liver. Curr.Med. Chem. 13, 2889-2900.
Portincasa P., Grattagliano I., Palmieri V.O. and Palasciano G. (2005).Nonalcoholic steatohepatitis: recent advances from experimentalmodels to clinical management. Clin. Biochem. 38, 203-217.
Rao M.S., Papreddy K., Abecassis M. and Hashimoto T. (2001).Regeneration of liver with marked fatty change following partialhepatectomy in rats. Dig. Dis. Sci. 46,1821-1826.
Ratziu V., Charlotte F., Heurtier A., Gombert S., Giral P., Bruckert E.,Grimaldi A., Capron F. and Poynard T. (2005). Sampling variabilityof liver biopsy in nonalcoholic fatty liver disease. Gastroenterology128, 1898-1906.
Raubenheimer P.J., Nyirenda M.J. and Walker B.R. (2006). A choline-
59
Automated assessment of liver steatosis
deficient diet exacerbates fatty liver but attenuates insulin resistanceand glucose intolerance in mice fed a high-fat diet. Diabetes 55,2015-2020.
Reddy J.K. and Mannaerts G.P. (1994). Peroxisomal lipid metabolism.Annu. Rev. Nutr. 14, 343-370.
Rushmore T.H., Ghazarian D.M., Subrahmanyan V., Farber E. andGhoshal A.K. (1987). Probable free radical effects on rat liver nucleiduring early hepatocarcinogenesis with a choline-devoid lowmethionine diet. Cancer Res. 47, 6731-6740.
Saito T., Misawa K. and Kawata S. (2007). 1. Fatty liver and non-alcoholic steatohepatitis. Intern. Med. 46, 101-103.
Sherlock S. (1995). Alcoholic liver disease. Lancet 345, 227-229. Urena M.A., Ruiz-Delgado F.C., Gonzalez E.M., Segurola C.L., Romero
C.J., Garcia I.G., Gonzalez-Pinto I. and Gomez S.R. (1998).Assessing risk of the use of livers with macro and microsteatosis in aliver transplant program. Transplant Proc. 30, 3288-3291.
Van den Boomgard R. and van Balen R. (1992). Methods for fastmorphological image transforms using bitmapped images. ComputerVision, Graphics, and Image Processing: Graphical Models andImage Processing 54: 252-254.
Zaitoun A.M., Al M.H., Awad S., Ukabam S., Makadisi S. and RecordC.O. (2001). Quantitative assessment of fibrosis and steatosis inliver biopsies from patients with chronic hepatitis C. J. Clin. Pathol.54, 461-465.
Accepted July 25, 2008
60
Automated assessment of liver steatosis