AN EXPERIMENTAL STUDY ON STEAM DISTILLATION OF HEAVY...
138
AN EXPERIMENTAL STUDY ON STEAM DISTILLATION OF HEAVY OILS DURING THERMAL RECOVERY A THESIS SUBMITTED TO THE GRADUATE SCHOOL OF NATURAL AND APPLIED SCIENCES OF MIDDLE EAST TECHNICAL UNIVERSITY BY YASHAR TAVAKKOLI OSGOUEI IN PARTIAL FULFILLMENT OF THE REQUIREMENTS FOR THE DEGREE OF MASTER OF SCIENCE IN PETROLEUM AND NATURAL GAS ENGINEERING FEBRUARY 2013
Transcript of AN EXPERIMENTAL STUDY ON STEAM DISTILLATION OF HEAVY...

AN EXPERIMENTAL STUDY ON STEAM DISTILLATION OF HEAVY OILS DURING THERMAL RECOVERY
A THESIS SUBMITTED TO
THE GRADUATE SCHOOL OF NATURAL AND APPLIED SCIENCES OF
MIDDLE EAST TECHNICAL UNIVERSITY
BY
YASHAR TAVAKKOLI OSGOUEI
IN PARTIAL FULFILLMENT OF THE REQUIREMENTS FOR
THE DEGREE OF MASTER OF SCIENCE
IN PETROLEUM AND NATURAL GAS ENGINEERING
FEBRUARY 2013


Approval of the thesis:
AN EXPERIMENTAL STUDY ON STEAM DISTILLATION OF HEAVY OILS DURING THERMAL RECOVERY
submitted by YASHAR TAVAKKOLI OSGOUEI in partial fulfillment of the requirements for
the degree of Master of Science in Petroleum and Natural Gas Engineering Department, Middle East Technical University by,
Prof. Dr. Canan Özgen ______________
Dean, Graduate School of Natural and Applied Sciences
Prof. Dr. Mahmut Parlaktuna ______________ Head of Department, Petroleum and Natural Gas Engineering.
Prof. Dr. Mahmut Parlaktuna ______________ Supervisor, Petroleum and Natural Gas Engineering Dept., METU
Examining Committee Members:
Prof. Dr. Ender Okandan ______________
Petroleum and Natural Gas Engineering Dept., METU
Prof. Dr. Mahmut Parlaktuna ______________
Petroleum and Natural Gas Engineering Dept., METU
Prof. Dr. Tanju Mehmetoğlu ______________ Petroleum and Natural Gas Engineering Dept., METU
Prof. Dr. Nurkan Karahanoğlu ______________ Geological Engineering Dept., METU
Asst. Prof. Dr. Çağlar Sinayuç ______________
Petroleum and Natural Gas Engineering Dept., METU
Date: 01.02.2013

iv
I hereby declare that all information in this document has been obtained and
presented in accordance with academic rules and ethical conduct. I also declare that, as required by these rules and conduct, I have fully cited and referenced all
material and results that are not original to this work.
Name, Last name : YASHAR TAVAKKOLI OSGOUEI
Signature :

v
ABSTRACT
AN EXPERIMENTAL STUDY ON STEAM DISTILLATION OF HEAVY OILS DURING THERMAL RECOVERY
Tavakkoli Osgouei, Yashar M.Sc., Department of Petroleum and Natural Gas Engineering
Supervisor: Prof. Dr. Mahmut Parlaktuna February 2013, 120 pages
Thermal recovery methods are frequently used to enhance the production of heavy crude
oils. Steam-based processes are the most economically popular and effective methods for
heavy oil recovery for several decades. In general, there are various mechanisms over steam
injection to enhance and have additional oil recovery. However, among these mechanisms,
steam distillation plays pivotal role in the recovery of crude oil during thermal recovery
process.
In this study, an experimental investigation was carried out to investigate the role of various
minerals present in both sandstone and carbonate formations as well as the effect of steam
temperature on steam distillation process. Two different types of dead-heavy crude oils were tested in a batch autoclave reactor with 30 % water and the content of the reactor
(crude oil, 10 % rock and mineral). The results were compared as the changes in the density, viscosity and chemical composition (SARA and TPH analyses) of heavy crude oil.
Five different mineral types (bentonite, sepiolite, kaolinite, illite and zeolite) were added into
the original crude oil and reservoir rocks to observe their effects on the rheological and compositional changes during steam distillation process.
Analysis of the results of experiments with Camurlu and Bati Raman heavy crude oils in the
presence of different minerals such as Bentonite, Zeolite, Illite, Sepiolite, and Kaolinite in
both sandstone and limestone reservoir rocks indicate that steam distillation produces light
end condensates which can be considered as solvent or condensate bank during steam
flooding operation. It was also illustrated that minerals in reservoir formations perform the
function of producing distilled light oil compounds, resulting in enhancement of heavy crude
oils recovery in steam flooding. Measurements showed that the remaining oil after steam
distillation has higher viscosity and density. On the other hand, the effect of steam
distillation is more pronounced in limestone reservoirs compared to sandstone reservoirs for
the given heavy crude oil and steam temperature. Among the five different minerals tested,
kaolinite found to be the most effective mineral in terms of steam distillation.
Keywords: Thermal recovery, Steam distillation, Heavy crude oil, Rheology, Reservoir
geochemistry, Mineral, Clay catalytic effect

vi
ÖZ
AĞIR PETROLLERİN ISISAL KURTARIMI SÜRECİNDE BUHAR DAMITMASI
ÜZERİNE DENEYSEL BİR ÇALIŞMA
Tavakkoli Osgouei, Yashar
Yüksek Lisans, Petrol ve Dogal Gaz Mühendisliği Bölümü Tez Yöneticisi: Prof. Dr. Mahmut Parlaktuna
Şubat 2013, 120 sayfa
Isısal kurtarım yöntemleri ağır petrollerin üretiminin arttırılmasında sıklıkla kullanılmaktadır.
Buhar bazlı süreçler ağır petrollerin kullanımında yıllardır en ekonomik ve en yaygın olarak
kullanılan yöntemlerdir. Genelde, buhar basımı ile petrol kurtarımının arttırılması ve ilave petrolün üretilmesi sürecinde farklı mekanizmalar mevcuttur. Ancak, bu mekazizmalar içinde
buhar damıtması temel rolü oynamaktadır.
Bu çalışmada, kumtaşı ve karbonat formasyonlarında mevcut farklı mineraller ile buhar
sıcaklığının buhar damıtma sürecine olan etkisinin incelendiği deneysel bir araştırma yapılmıştır. İki farklı ölü-ağır petrol örneği içinde % 30 su ve % 10 kayaç ve mineral bulunan
otoklav reaktörde teste edilmişlerdir. Sonuçlar, ağır petrollerin yoğunluk, akmazlık ve kimyasal kompozisyon değişimleri (SARA ve TPH analizleri) ile karşılaştırılmıştır. Rezervuar
kayaç ve orijinal petrol karışımlarını beş farklı mineral (bentonit, sepiolit, kaolen, illit ve zeolit) eklenmiş ve bu minerallerin ağır petrollerin buhar damıtma sürecinde neden
olabileceği reolojik ve kompozisyon değişimleri gözlenmiştir.
Kumtaşı ve kalker rezervuar kayaçlarının varlığı ve farklı kil minerallerinin eklenmesi ile, iki
farklı ağır petrol türünün kullanıldığı deneysel çalışmanın sonuçlarının irdelenmesiyle buhar damıtma sürecinin hafif uçlu kondensatlar ürettiği ve bu ürünün buhar öteleme operasyonu
içinde çözücü veya kondensat cephesi olarak değerlendirilebileceği sonucuna varılmıştır. Aynı
zamanda, farklı kil minerallerinin hafif uçlu damıtma ürünlerinin üretilmesinde etken olduğu ve ağır petrollerin buhar ötelemesi ile kurtarımına katkısı olacağı gösterilmiştir. Ölçümler,
geride kalan ham petrolün yoğunluk ve akmazlık değerlerinin arttığını göstermektedir. Öte yandan, aynı türden ham petrol ve buhar basıncı koşullarında uygulanan buhar
damıtmasının, kalker rezervuar kayacında kumtaşı kayaca göre daha etken olduğu sonucuna
varılmıştır. Test edilen beş farklı kil minerali içinde en etken olan kil minerali kaolen olarak bulunmuştur.
Anahtar sözcükler: Isısal kurtarım, buhar damıtma, ağır ham petrol, reoloji, rezervuar
jeokimyası, mineral, kil katalizör etkisi

vii
To
My Family
and
My Niece “Elina Oskouei”

viii
ACKNOWLEDGEMENTS
I would like to express my sincere gratitude to my supervisor Prof. Dr. Mahmut
PARLAKTUNA for his scientific and academic guidance, suggestions, supports
encouragement and helps throughout the study. I cannot thank him enough for his patience, kindly attitude, and for this enlightening period during which I had the chance to
work with him.
I am also indebted to invaluable and scientific comments of Prof. Dr. Şahinde Demirci from
Department of Chemistry and I would like to appreciate it.
I also would like thank Prof. Dr. Ender OKANDAN, Prof. Dr. Mahmut PARLAKTUNA, Prof. Dr. Hakki GUCUYENER, Prof. Dr. Mustafa Verşan KÖK, Prof. Dr. Serhat AKIN, Can BAKILER, and
Asst. Prof. Çağlar SINAYUÇ in Department of Petroleum and Natural Gas Engineering for their invaluable helps, supports, and guidance at all steps of the study. My special thanks go
to my thesis committee members for their constructive comments regarding the
improvement of my thesis too.
I would like to thank Gülsün BEHLULGIL, Abdullah ÇAL, Naci DOGRU, Hatice BOLATA, Nurgül AKGÜL, and Sevim GÜLYÜZ for their helps during my experimental study.
My special thanks go to Hale ÜÇKARDEŞ, İlknur ÖZTÜRK, Didem Nur SAĞLAM, Mehmet KÜÇÜKÇAL, Mevhibe ERCİHAN, Mevlüde ÖZCAN, Kemal FIRAT, and Dr. Sevtaç BÜLBÜL from
Petroleum Research Center (PAL) and XRF and ICP Laboratories in Central Laboratory at Middle East Technical University for their endless helps on different stages of my
experiments and analyses.
I express my deepest thanks to Prof. Dr. Asuman G. TÜRKMENOĞLU from Department of
Geological Engineering for her kindly helps on XRD analysis and mineralogical information.
Y. AKIN KÖKSAL et al. from TEKNOTES Company are also deeply acknowledged for their technical contributions and supports in the construction of the experimental setup.
I am also thankful to Esra EREN et al. from Geochemistry Research Center of Turkish Petroleum Corporation (TPAO) for their kindly helps on SARA analysis.
Thanks are not enough to my friends Reza Monesi Rad, Mozhgan Mirbaghery, Aslan
Massahi, Mohammad Ahmadi, Ali Etemadi and Mehran Ghasabeh for their moral
contributions during my study.
Last but not least, I owe my loving thanks to my family, especially, my parents Hassan and Mahin Oskouei for their supports all the way not only through my academic studies but also
through my life. The words are not enough to express my appreciation to them for their dedication and support.

ix
TABLE OF CONTENTS
ABSTRACT ...................................................................................................................... v
ÖZ ................................................................................................................................. vi
ACKNOWLEDGEMENTS .................................................................................................. viii
TABLE OF CONTENTS ...................................................................................................... ix
LIST OF TABLES............................................................................................................. xii
LIST OF FIGURES .......................................................................................................... xiii
LIST OF SYMBOLS AND ABBREVIATIONS ...................................................................... xvii
CHAPTERS
1.INTRODUCTION ....................................................................................................... 1
2.LITERATURE REVIEW ............................................................................................... 3
2.1 Heavy Crude Oil .......................................................................................... 3
2.2 Origin and Occurrence of Heavy Oil .............................................................. 3
2.3 Heavy Oil Distribution .................................................................................. 6
2.4 Reservoir Geochemistry and Lithology .......................................................... 8
2.5 Heavy Oil Properties .................................................................................... 9
2.5.1 Chemical Composition ...........................................................................10
2.5.2 Physical Properties ................................................................................10
2.5.2.1 Density and Specific Gravity ............................................................10
2.5.2.2 Viscosity ........................................................................................10
2.5.2.3 Liquefaction and Solidification .........................................................10
2.5.2.4 Solubility ........................................................................................11
2.5.3 Thermal Properties ...............................................................................11
2.5.3.1 Carbon Residue ..............................................................................11
2.5.3.2 Specific Heat ..................................................................................11
2.5.3.3 Combustion Heat ............................................................................12
2.5.3.4 Volatility.........................................................................................12
2.6 Heavy Oil Recovery ....................................................................................12
2.6.1 Steam Based Recovery .........................................................................13
2.6.2 Steam Assisted Gravity Drainage (SAGD) ...............................................15
2.7 Steam flood ...............................................................................................16
2.7.1 Steam flood Zones ................................................................................16
2.7.2 Steam flood Mechanisms.......................................................................18
3.STATEMENT OF THE PROBLEM ................................................................................21

x
4.THEORY ................................................................................................................. 23
4.1 Steam Distillation ...................................................................................... 23
4.2 Steam Distillation Importance and Role in Heavy Crude Oils Recovery .......... 24
4.3 Steam Distillation Optimization ................................................................... 25
4.3.1 Steam flood Phases ............................................................................. 26
4.3.2 Chemical Interaction in Steam flood ...................................................... 27
4.4 Laboratory Measurements on Heavy Oils .................................................... 29
4.5 Rheological Properties of Fluid ................................................................... 31
4.5.1 Rheology ............................................................................................. 31
4.5.2 Rheological Parameters ........................................................................ 31
4.5.2.1 Shear Stress .................................................................................. 32
4.5.2.2 Shear Rate .................................................................................... 32
4.5.2.3 Viscosity ........................................................................................ 32
4.5.3 Properties and behavior of Fluids .......................................................... 33
4.5.3.1 Newtonian Fluid ............................................................................. 33
4.5.3.2 Non-Newtonian Fluid ..................................................................... 35
4.5.3.2.1 Shear Thinning ........................................................................ 35
4.5.3.2.2 Shear Thickening ..................................................................... 36
5.MATERIALS AND METHODS .................................................................................... 37
5.1 Heavy Crude Oil Samples ........................................................................... 37
5.2 Preparation of Rock Samples ...................................................................... 37
5.3 The minerals Used .................................................................................... 38
5.4 Experimental Setup and Procedure ............................................................. 39
5.4.1 Steam Distillation Experiments.............................................................. 39
5.4.2 Centrifugal Separation ......................................................................... 41
5.4.3 Viscosity Measurements ....................................................................... 42
5.4.4 Density Measurements ......................................................................... 43
5.4.5 Chemical Analysis of Oil Samples .......................................................... 44
6.RESULTS AND DISCUSSION .................................................................................... 45
6.1 Properties of materials ............................................................................... 45
6.2 Steam Distillation Experiments ................................................................... 47
6.2.1 The Effect of Steam Temperature ......................................................... 49
6.2.1.1 Changes in Density of Oil Samples with Steam Temperature ............ 49
6.2.1.2 Changes in Viscosity of Oil Samples with Steam Temperature ........... 51
6.2.2 The Effect of Minerals .......................................................................... 53
6.2.2.1 Changes in Density of Oil Samples with Minerals ............................. 53
6.2.2.2 Changes in Viscosity of Oil Samples with Minerals ............................ 56
6.2.2.3 The effect of minerals on composition of remaining oil samples ........ 58

xi
6.2.2.4 TPH Analysis of Distillates ...............................................................63
7.CONCLUSIONS ........................................................................................................69
REFERENCES .................................................................................................................71
APPENDIES
A.RHEOLOGICAL MEASUREMENTS OF OIL SAMPLES ....................................................75
B.RAW DATA OF DENSITY AND VISCOSITY MEASUREMENTS .......................................95
C.XRD MEASUREMENTS..............................................................................................99
D.TPH MEASUREMENTS ........................................................................................... 109

xii
LIST OF TABLES
TABLES
Table 6.1 Physical properties of heavy crude oil samples ....................................... 45
Table 6.2 The hydrocarbon composition of heavy crude oil samples ...................... 46
Table 6.3a XRF analysis results of rock samples (%) .............................................. 46
Table 6.3b ICP-OES analysis results of rock samples .............................................. 47
Table 6.4 XRD analysis results of rock samples ..................................................... 47
Table 6.5 List of experiments .............................................................................. 48
Table B.1 Density of Camurlu oil samples ............................................................. 95
Table B.2 Density of Bati Raman oil samples ........................................................ 96
Table B.3 Viscosity of Camurlu oil samples ........................................................... 97
Table B.4 Viscosity of Bati Raman oil samples ...................................................... 98
Table B.5 SARA Analysis results ........................................................................... 98

xiii
LIST OF FIGURES
FIGURES
Figure 2.1 Range of geological age of Middle East heavy oil limestone reservoirs. ..... 5
Figure 2.2 Heavy oil limestone formation types by percentage. ................................ 5
Figure 2.3 Total world oil distribution. ..................................................................... 6
Figure 2.4 Comparative distributions of Conventional and unconventional oil............. 7
Figure 2.5 Location of heavy oil limestone fields in the Middle East. .......................... 7
Figure 2.6 Heavy crude oil fields in Turkey. ............................................................. 8
Figure 2.7 Viscous Heavy Crude Oil. ......................................................................11
Figure 2.8 Crude oil viscosity changes with temperature at different API gravity. ......12
Figure 2.9 Cyclic Steam stimulation process (CSS). .................................................13
Figure 2.10 Stimulation treatment mechanisms. .......................................................14
Figure 2.11 Steam flood process. .............................................................................14
Figure 2.12 Steam flood schematic mechanism. ........................................................15
Figure 2.13 Steam Assisted Gravity Drainage (SAGD) Process....................................15
Figure 2.14 Thermal distribution in SAGD process. ....................................................16
Figure 2.15 Schematic plot of steam flood zones. .....................................................17
Figure 2.16 Temperature distribution in steam flood zones. .......................................17
Figure 2.17 Oil saturation distribution in steam flood zones. ......................................18
Figure 2.18 Theoretical sections of 2-D steam flood ..................................................18
Figure 2.19 Schematic illustration of the in-situ solvent generation. ...........................19
Figure 4.1 Steam distillation process. .....................................................................23
Figure 4.2 Steam distillation mechanisms in heavy oil reservoirs. .............................25
Figure 4.3 Steam distillation system .......................................................................26
Figure 4.4 Oil - Mineral matrix system....................................................................27
Figure 4.5 Schematic steam- oil interaction system in steam flood ...........................29
Figure 4.6 General chemical composition of heavy oil. ............................................30
Figure 4.7 Relationship between resin and asphaltene compositions and API gravity
……………………………………………………………………………………………………….30
Figure 4.8 Comparative illustration of various stresses. ...........................................31
Figure 4. 9 Shear Stress - Shear rate in a deformation process. ................................32
Figure 4.10 Newtonian fluids rheogram. ...................................................................33
Figure 4.11 Viscosity vs. Shear rate in Newtonian fluids. ...........................................34
Figure 4.12 Non-Newtonian fluids rheogram. ............................................................35

xiv
Figure 4.13 Viscosity Vs. Shear rate in non- Newtonian fluids ................................... 36
Figure 5.1 Rock samples preparation process ........................................................ 38
Figure 5.2 Different minerals used in experiments ................................................. 38
Figure 5.3 Batch autoclave reactor........................................................................ 40
Figure 5.4 Steam distillation process setup ............................................................ 40
Figure 5.5 Recorded data during steam distillation ................................................. 41
Figure 5.6 Centrifugal separation of oil, water and rock mixture ............................. 42
Figure 5.7 Haake Rotovisco RV20 ......................................................................... 42
Figure 5.8 Density meter used in experiments ....................................................... 43
Figure 5.9 Condensed steam and distillate in syringe for TPH analysis .................... 44
Figure 6.1 Density of remaining oils at different temperatures for Camurlu ............. 50
Figure 6.2 Density of remaining oils at different temperatures for Bati Raman ......... 50
Figure 6.3 Viscosity of remaining oils at different temperatures for Camurlu ............ 51
Figure 6.4 Viscosity of remaining oils at different temperatures for Bati Raman ....... 52
Figure 6.5 Density of remaining oils after 250 C steam treatment .......................... 52
Figure 6.6 Viscosity of remaining oils after 250 C steam treatment ........................ 53
Figure 6.7 Density of remaining Camurlu oil with carbonate + different minerals ..... 54
Figure 6.8 Density of remaining Bati Raman oil with carbonate + different minerals 54
Figure 6.9 Density of remaining Camurlu oil with sandstone + different minerals..... 55
Figure 6.10 Density of remaining Bati Raman oil with sandstone + different minerals..
………………………………………………………………………………………………………55
Figure 6.11 Viscosity of remaining Camurlu oil with carbonate + different clay
minerals ............................................................................................. 56
Figure 6.12 Viscosity of remaining Bati Raman oil with carbonate + different clay
minerals ............................................................................................. 57
Figure 6.13 Viscosity of remaining Camurlu oil with sandstone + different clay
minerals ............................................................................................. 57
Figure 6.14 Viscosity of remaining Bati Raman oil with sandstone + different clay
minerals ............................................................................................. 58
Figure 6.15 SARA analysis of Camurlu tests (Saturate) ............................................ 59
Figure 6.16 SARA analysis of Bati Raman tests (Saturate) ....................................... 60
Figure 6.17 SARA analysis of Camurlu tests (Aromatic) ........................................... 60
Figure 6.18 SARA analysis of Bati Raman tests (Aromatic) ....................................... 61
Figure 6.19 SARA analysis of Camurlu tests (Polar) ................................................. 61
Figure 6.20 SARA analysis of Bati Raman tests (Polar) ............................................ 62

xv
Figure 6.21 SARA analysis of Camurlu tests (Asphaltene) ......................................62
Figure 6.22 SARA analysis of Bati Raman tests (Asphaltene) .................................63
Figure 6.23a TPH Analysis for Camurlu oil distillates ...............................................64
Figure 6.23b TPH Analysis for Camurlu oil distillates (Cont.) ....................................64
Figure 6.24a TPH Analysis for Bati Raman distillates ...............................................65
Figure 6.24b TPH Analysis for Bati Raman distillates (Cont.)....................................66
Figure 6.25 TPH Analysis of Camurlu and Bati Raman crude oils ............................67
Figure A.1 Camurlu crude oil ..............................................................................76
Figure A.2 Camurlu, 250 C ................................................................................76
Figure A.3 Camurlu+10% CBF, 150 ⁰C ................................................................77
Figure A.4 Camurlu+10% SSF, 150 ⁰C ................................................................77
Figure A.5 Camurlu+10% CBF, 200 ⁰C ................................................................78
Figure A.6 Camurlu+10% SSF, 200 ⁰C ................................................................78
Figure A.7 Camurlu+10% CBF, 250 ⁰C ................................................................79
Figure A.8 Camurlu+10% SSF, 250 ⁰C ................................................................79
Figure A.9 Camurlu+8% CBF+2% BNT, 250 ⁰C ...................................................80
Figure A.10 Camurlu+8% SSF+2% BNT, 250 ⁰C ...................................................80
Figure A.11 Camurlu+8% CBF+2% ZOL, 250 ⁰C ...................................................81
Figure A.12 Camurlu+8% SSF+2% ZOL, 250 ⁰C ...................................................81
Figure A.13 Camurlu+8% CBF+2% ILI, 250 ⁰C ....................................................82
Figure A.14 Camurlu+8% SSF+2% ILI, 250 ⁰C .....................................................82
Figure A.15 Camurlu+8% CBF+2% SPT, 250 ⁰C ...................................................83
Figure A.16 Camurlu+8% SSF+2% SPT, 250 ⁰C ...................................................83
Figure A.17 Camurlu+8% CBF+2% KOL, 250 ⁰C...................................................84
Figure A.18 Camurlu+8% SSF+2% KOL, 250 ⁰C ...................................................84
Figure A.19 Bati Raman crude oil .........................................................................85
Figure A.20 Bati Raman, 250 ⁰C ...........................................................................85
Figure A.21 Bati Raman+10% CBF, 150 ⁰C ...........................................................86
Figure A.22 Bati Raman+10% SSF, 150 ⁰C ...........................................................86
Figure A.23 Bati Raman+10% CBF, 200 ⁰C ...........................................................87
Figure A.24 Bati Raman+10% SSF, 200 ⁰C ...........................................................87
Figure A.25 Bati Raman+10% CBF, 250 ⁰C ...........................................................88
Figure A.26 Bati Raman+10% SSF, 250 ⁰C ...........................................................88
Figure A.27 Bati Raman+8% CBF+2% BNT, 250 ⁰C ..............................................89
Figure A.28 Bati Raman+8% SSF+2% BNT, 250 ⁰C ..............................................89

xvi
Figure A.29 Bati Raman+8% CBF+2% ZOL, 250 ⁰C ............................................. 90
Figure A.30 Bati Raman+8% SSF+2% ZOL, 250 ⁰C ............................................. 90
Figure A.31 Bati Raman+8% CBF+2% ILI, 250 ⁰C ............................................... 91
Figure A.32 Bati Raman+8% SSF+2% ILI, 250 ⁰C ............................................... 91
Figure A.33 Bati Raman+8% CBF+2% SPT, 250 ⁰C ............................................. 92
Figure A.34 Bati Raman+8% SSF+2% SPT, 250 ⁰C .............................................. 92
Figure A.35 Bati Raman+8% CBF+2% KOL, 250 ⁰C ............................................. 93
Figure A.36 Bati Raman+8% SSF+2% KOL, 250 ⁰C ............................................. 93
Figure C.1 XRD measurement for carbonate rock (Bulk sample) .......................... 99
Figure C.2 XRD measurement for carbonate rock (Air dried) ............................... 100
Figure C.3 XRD measurement for carbonate rock (Ethylene glycolated) ................ 101
Figure C.4 XRD measurement for carbonate rock (Heated at 300 ⁰C) ................... 102
Figure C.5 XRD measurement for carbonate rock (Heated at 550 ⁰C) ................... 103
Figure C.6 XRD measurement for sandstone rock (Bulk sample) .......................... 104
Figure C.7 XRD measurement for sandstone rock (Air dried) ............................... 105
Figure C.8 XRD measurement for sandstone rock (Ethylene glycolated) ............... 106
Figure C.9 XRD measurement for sandstone rock (Heated at 300 ⁰C) .................. 107
Figure C.10 XRD measurement for sandstone rock (Heated at 550 ⁰C) ................... 108
Figure D.1 TPH measurement for Camurlu+8% CBF+2%KOL, 250 C ................... 109
Figure D.2 TPH measurement for Camurlu+8% SSF+2%KOL, 250 C ................... 111
Figure D.3 TPH measurement for Bati Raman+8% CBF+2%KOL, 250 C .............. 113
Figure D.4 TPH measurement for Bati Raman+8% SSF+2%KOL, 250 C ................ 115
Figure D.5 TPH measurement for Camurlu, 250 C ................................................ 117
Figure D.6 TPH measurement for Bati Raman, 250 C ........................................... 119

xvii
LIST OF SYMBOLS AND ABBREVIATIONS
A Area
A Shear stress factor
API American Petroleum Institute
BNT Bentonite
CBF Limestone (carbonate) rock
cP Centipoise
CSS Cyclic Steam Stimulation
EOR Enhanced Oil Recovery
F Force
H Height
ICP-OES Inductively Coupled Plasma- Optical Emission Spectrometer
ILI Illite
KOL Kaolinite
M Shear rate factor
Pa Pascal
S Second
SAGD Steam Assisted Gravity Drainage
SARA Saturate Aromatic Resin Asphaltene
Sp.Gr. Specific Gravity
SPT Sepiolite
SSF Sandstone rock
TPH Total Petroleum Hydrocarbon
V Velocity
XRD X-Ray Diffraction
XRF X-Ray Fluorescence
ZOL Zeolite
ρ Density

xviii
η Viscosity
τ Shear stress
% τ Displayed shear stress
ϒ Shear rate
%ϒ Displayed shear rate

1
CHAPTER 1
INTRODUCTION
Nowadays along with advance in technology, energy plays an essential role in the world.
Since high quality and conventional crude oil reserves are depleting, the provision of energy resources and feedstock of petrochemical industries will be faced with serious problems.
This is why new resources apart from conventional ones will affect industrial developments.
The unconventional resources will find their places in the world energy balances. With consideration of this point that unconventional hydrocarbon resources such heavy oils and
bitumen, with accounting for 70% of the total quantity of petroleum (5-6 trillions of barrels) in the world can be potential and suitable alternatives in the future [1].
The Middle East, consisting substantial light oil reserves, is not considered as a significant
area of unconventional hydrocarbon resources. Nevertheless, to compensate conventional oil
depletion in the future study of heavy oil potential to secure energy resources in Middle East is essential [1].
Turkey’s energy requirement is provided by domestic production of oil and natural gas by 3
to 10 percent. Therefore, major portion of required crude oil is imported, which accounts for
approximately 90 percent. On one hand, increased need for petroleum and high rate of crude oil import contribute unconventional oil reserves to become economically reasonable.
Heavy crude oil is one of current forms of Turkey’s unconventional hydrocarbon resources [2].
Heavy crude oil is a viscous type of petroleum that contains higher level of hetero-atoms than conventional petroleum. It has relatively low proportions of volatile compounds with
low- molecular weights, and quite high proportions of high molecular weight compounds. However, the high contents of hetero-atoms such as sulfur, nitrogen, oxygen and metals, as
well as the high viscosity and solidification of the heavy crude oils make its production, transportation, and utilization more challengeable [3].
Steam distillation process involves vaporizing lighter components of crude oil by steam related thermal energy. The produced vapor of light hydrocarbons and water in steam
distillation contributes to highly efficient recovery of heavy crude oil through both steam drive and in-situ solvent drive by 5 to 10%. In fact, there are several phases involved in
steam injection. Among them, rock matrix can be considered as significant and effective
factor in efficiency of crude oil recovery by means of steam distillation process [4].
According to geochemistry theories, mineralogical composition and structure of crude oil bearing reservoir formation are effective in recovery mechanisms over applications of
thermal recovery methods. The matrix of reservoir minerals, consisting of clay and non-clay minerals, provides a suitable place for interaction between steam and components of crude
oil in presence of high temperature and high pressure water. Therefore, the minerals
naturally present in reservoir formation change the reaction equilibrium during steam distillation [1, 3]. With considering the pivotal role of heavy oils and bitumen in the future of
oil industry, studies on improvement of rheological properties of heavy oils through microscopic investigations on “Steam distillation” process are becoming an essential issue.

2
Thus, in this study, an experimental investigation was carried out to investigate the role of
various minerals present in both sandstone and carbonate formations as well as the effect of steam temperature on steam distillation process. Two different types of heavy crude oil
were used in a batch autoclave reactor with a 30 % water and the content of the reactor (crude oil, 10 % rock and mineral) were kept under steam pressure for a period of 40
hours, and the results were compared as the changes in the density, viscosity and chemical
composition (SARA and TPH analyses) of heavy crude oil. Five different mineral types (bentonite, sepiolite, kaolinite, illite and zeolite) were added into the original crude oil and
reservoir rocks to observe their effects on the rheological and compositional changes during steam distillation process. The results of this experimental study investigating the effect of
clay types and steam temperature (150, 200 and 250 ⁰C) on both sandstone and carbonate
reservoir formations were presented and compared.
A major and significant objective of this study is to investigate improvement and enhancement of heavy crude oils recovery by steam distillation through optimization of
catalytic effect of reservoir minerals in both carbonate and sandstone formations on
interaction between high temperature and high pressure water and ingredients of heavy crude oils to generate distilled light hydrocarbons. The experimental studies illustrate that
minerals in reservoir formations improve the production of distilled light oil compounds, resulting in enhancement of heavy crude oils recovery in steam flooding.

3
CHAPTER 2
LITERATURE REVIEW
2.1 Heavy Crude Oil
Petroleum is an extremely complex mixture of hydrocarbon compounds, with minor amounts of nitrogen, oxygen, and sulfur- containing compounds as well as trace amounts of
metal- containing compounds from chemical point of view. Nowadays petroleum is considered as the most important substance consumed in current modern society. It
provides not only feed stock for the petrochemical products, but also fuel for energy, industry, heating, and transportation.
Crude oil occurs in many different forms throughout the world. Rheological characteristics of crude oil play an important role in quality and quantity of hydrocarbon production. Density
and viscosity affect and determine the rheological properties of fluids. Therefore, lighter crude oil typically can be produced more easily and at lower costs than heavier crude oil. In
order to meet the demand for fuels, and petrochemical products, heavy crude oils and other
unconventional hydrocarbon resources can be other alternatives to the depleting of conventional hydrocarbon resources.
Heavy crude oils, including higher level of sulfur than conventional crude oil, have relatively
low proportions of light compounds with low- molecular weights, and quite high proportions
of high molecular weight compounds. The high- molecular weight constituents of heavy oils are made up of compounds with high melting points, and high pour points that considerably
contribute to the inappropriate rheological properties of heavy oil, and so to decrease mobility compared to conventional petroleum. In summary, the heaviness of heavy oil is
primarily the result of an internal balance between a relatively high proportion of complex, high- molecular weight, non-paraffinic compounds and a low proportion of volatile, lower-
molecular weight compounds. The problems of producing heavy oil from the reservoir are
typically as a result of disturbing the internal balance, which, in turn, influences the mobility of the oil and the deposition of asphaltene constituents.
Understanding the fluid properties of the reservoir, which requires geological knowledge,
helps to deal with well heavy oil. Because chemical differences between heavy oil and
conventional oil affect their viscosity.
Thermal recovery methods constitute a significant proportion among several production processes that are used to enhance the production of heavy crude oils. These methods are
used to decrease viscous resistance of heavy oil to flow at reservoir conditions [3].
2.2 Origin and Occurrence of Heavy Oil
There are two theories on the origin of petroleum that involve the origin of heavy oil as well. They are the abiogenic theory and the biogenic theory. According to biogenic theory,
in general, heavy oil was originally conventional oil that formed in deep formations, but
migrated from deep source rocks or deep reservoirs to near the surface, where the oil was biologically degraded by bacteria and weathered by water. Bacteria feeding on the migrated

4
conventional oil removed hydrogen and produced the denser, more viscous heavy oil. Heavy
oil, extra- heavy oil, and bitumen are deficient in hydrogen. By contrast, they have high carbon, sulfur, and heavy- metal content. On the other hand, abiogenic theory states that
petroleum might originate from carbon-bearing deposits without biological reactivity.
Several processes are involved in forming and occurring heavy oil. There is general
agreement that immature oils account for a small percentage of the heavy oil. As opposed to conventional oils, which may be expelled from its source rock as immature oil, most
heavy oil and natural bitumen are thought to be expelled from source rocks as light or medium oil that subsequently migrates to a trap in which they are exposed to degradation
parameters. Finally, conventional oil is converted to heavy oil as a result of exposure in the
trap into an oxidizing zone by several processes. These processes include water washing, bacterial degradation (aerobic biodegradation), and evaporation. A third proposal is that
biodegradation can also occur at depth in subsurface reservoirs.
Heavy oil deposits may also contain water, clay, and minerals containing sulfur, titanium and heavy metals such as nickel, vanadium and molybdenum. Heavy oil deposits typically
occur in geologically young reservoirs (from the Cretaceous), and they are usually shallow,
generally no deeper than two or three thousand feet, and often lie within feet of the surface. Therefore, they have less effective seals and are thus exposed to conditions that
result in the formation of heavy oils [3].
The lithology of most current heavy oil reservoirs is quartzite sandstone formations, with
high permeability and porosity. High permeability may compensate for inappropriate rheological properties of heavy crude oils, resulting in high well productivities. There are
unconsolidated heavy oil deposits (i.e. the bitumen holds the quartzite grains together rather than cementation) in Alberta and Saskatchewan provinces in Canada, in California, in
Northern Mexico, and in Venezuela.
However, heavy oil also exists in limestone (carbonate) formations that are much more
complex than sandstone formations, and often have extensive fracturing and vugs, in addition to inter granular porosity. Iran, Oman, and Mexico have extensive carbonate heavy
oil deposits that are being developed and produced, they are just not as successful as the sandstones and appropriate technology needs to be developed to increase recovery in these
formations.
The geological studies indicate that the majority of present oil in the Middle East is in
limestone reservoirs. These limestone reservoirs were generally situated in a shallow-water bearing zones. They range in age from the Aptian stage of the Cretaceous to the Late
Miocene Epoch of the Tertiary period. Figure 2.1 shows the range of geological age of
Middle East heavy oil in limestone formations.

5
Figure 2.1 Range of geological age of Middle East heavy oil limestone reservoirs [1].
Heavy crude oil limestone reservoirs in the Middle East range from unmixed limestone to
highly dolomitized rock. The majority of limestone formations can be found as form of
unchanged limestone by 62% (Figure 2.2) [1].
Figure 2.2 Heavy oil limestone formation types by percentage [1].

6
2.3 Heavy Oil Distribution
Petroleum is mostly found in sedimentary rocks throughout the world. The total world oil resources have been estimated to approximately 9 to 13×1012 (9 to 13 trillion) barrels.
Figure 2.3 illustrates that conventional oil accounts for about 30% of that amount, while the unconventional oils, which are composed of heavy oils, and tar sand bitumen, make up 70%
of the total world oil.
Figure 2.3 Total world oil distribution [5].
According to widely acknowledged estimations, remaining worldwide recoverable conventional crude oil amounts roughly 1trillion barrels, whereas International Energy
Agency (IEA) estimates that there are about 5 to 6 trillion (5 to 6×10¹²) barrels of heavy oils and bitumen in place worldwide. In fact, four-fifths of these deposits are in the Western
Hemisphere, with 2.5 trillion barrels in western Canada (Athabasca and Cold Lake deposits of Alberta (Cretaceous reservoirs)), 1.5 trillion barrels in Eastern Venezuela (Orinoco Heavy
Oil Belt (Tertiary/Cretaceous reservoirs)). In generally speaking, these two countries include
more than 80% of the world's heavy oil reserves. Thereafter, 1 trillion barrels in Russia, and 100 to 180×109 (billion) barrels in United State. Most of these resources are currently
untapped.
Heavy oil is also located and being produced in Indonesia, China, Mexico, Brazil, Trinidad,
Argentina, Ecuador, Colombia, Oman, Kuwait, Egypt, Saudi Arabia, Turkey, India, Nigeria, Angola, Eastern Europe, the North Sea, Romania, Australia, Iran, and Italy [6].

7
Figure 2.4 Comparative distributions of Conventional and unconventional oil [6].
In spite of vast light oil reserves in Middle East, heavy oils can be a potential alternative for
replacing or rising oil production to satisfy future prospect of energy source due to tightening worldwide light oil supplies. Figure 2.5 indicates the location of significant heavy
oil limestone reservoirs in the Middle East. Fracture- assisted production and steam flood are used to recover heavy oils [1].
Figure 2.5 Location of heavy oil limestone fields in the Middle East [1].

8
There are a few heavy oil resources in Turkey that make up approximately 80% of total
national oil production. These hydrocarbon reservoirs are commonly situated in southeast of country with lithology, in general, limestone (carbonate) or dolomitic limestone. The most
well-known heavy oil reservoirs of Turkey are Camurlu, Bati Raman and Ikiztepe fields (Figure 2.6) [7].
Figure 2.6 Heavy crude oil fields in Turkey [7].
2.4 Reservoir Geochemistry and Lithology
Reservoir geochemistry can be defined as the study of fluids within a petroleum reservoir, their origin and interaction with the reservoir formation. Many features of reservoir
geochemistry are not new but were applied in both theoretical and practical aspects from
the early 1990’s.
In the past geochemistry was applied for indirect measurement of the two main traits of reservoir rock such porosity and permeability to characterize hydrocarbon resources.
Recently, however, it provides a set of acceptable data about particular rock –fluid
interactions in reservoir formation that influence the fluid distribution, macroscopic flow properties, and future reservoir performance [8].
Reservoir geochemistry is related to provide a variety of chemical variables of fluids and
phases in oil and gas reservoirs. The main objective of these variations is to study and analyze the fluid properties. Moreover, the pivotal applications of this data are to identify the
effects of in situ processes such chemical interactions and diffusive and convective mixing in
phases of oil and gas reservoirs [9]. That is why geochemistry can play an important role in evaluation of recovery mechanisms and other processes affecting oil and gas production rate
especially in unconventional hydrocarbon resources.

9
There are two kinds of lithologies which commonly construct hydrocarbon reservoir
formations. These two sedimentary rocks such as sandstone and carbonate (limestone) have different chemical compositions and physical properties [9].
Sandstone formation is compositionally formed through inorganic and clastic processes. The clastic materials are related to each other in the rock by cement, generally silica. Sandstone
accounts for suitable hydrocarbon reservoir rocks due to their high porosity and permeability. At the same time, tight sands refer to sandstone reservoirs with low
permeability. Thus, a number of wells must be drilled into the reservoirs to recover the hydrocarbons. In general, the best sandstone reservoirs are those that are primarily made of
quartz grains of sand size, silica cement, with minimal fragmented particles.
The quality of the original sandstone reservoir depends on the source of the materials, the
depositional process, and the environment in which the deposition happened. They range in age from the oldest being Cambrian (in Algeria) to the youngest being Pliocene (Caspian
region in Ukraine). In the USA, two-thirds of the sandstone reservoirs are Cenozoic in age.
Limestone is the other current lithology that forms hydrocarbon reservoirs. This type of
formation is mainly composed of the calcite mineral (CaCO3). Another mineral is the dolomite with chemical formula of CaMg(CO3)2 . It occurs in large concentrations and it
forms rock called dolomite. Not only, is dolomite due to direct precipitation in sea water, but
it is also formed by replacement of pre-existing deposits of calcite. Consequently, carbonate reservoir rocks consist of limestone and dolomite minerals. Early they were regarded as
organic rocks [9, 10].
Porosity and permeability are considerably reduced in old carbonate reservoir rocks due to
compaction and cementation processes. But porosity tends to increase owing to secondary processes of leaching and dolomitization of the limestone that occurs after the carbonate
rock was formed. Even though new carbonate sediments have higher porosity values, sedimentation and compaction processes cause a reduction in the rate of porosity. At the
same time, carbonate reservoirs are more productive and sustainable in production than sandstone reservoirs. In addition, artificial fractures contribute to more production of oil and
gas in carbonate formations [11].
Geological studies indicate that sandstones, carbonate formations, and dolomites are current
hydrocarbon bearing reservoir rocks. Approximately 50% of all producing source rocks are sandstones. Dolomites have different operational properties from limestones. Since the
volume of dolomite is less than that of calcite, the replacement of calcite by dolomite
increases the pore space by 13%. In addition, dolomites similar to limestone are vulnerable to be highly fractured providing more recoverable hydrocarbon reservoirs.
Minerals such as quartz, kaolinite, and calcite are present in many different forms of porous
media, including reservoir rocks. In general, reservoir rock composition includes several
types of clay minerals besides quartz and other metallic components [10].
2.5 Heavy Oil Properties
The main characteristic properties of heavy oil are high specific gravity, low hydrogen to carbon ratios, high carbon residues, and high contents of asphaltenes, heavy metal, sulfur,
and nitrogen. Heavy oil is an oil resource that is characterized by high viscosities and high densities compared to conventional oil.

10
2.5.1 Chemical Composition
The chemical composition of heavy oil determines most its physical characteristics, and it is
an appropriate indicator of heavy oil behavior. The first method in order to examine and evaluate the general nature of heavy oil is its chemical analysis on the basis of the
percentages of carbon, hydrogen, nitrogen, oxygen, and sulfur. The atomic ratios of the various elements to carbon (i.e., H/C, N/C, O/C, and S/C) are frequently used for indications
of the overall character of the heavy oil.
Moreover, the chemical analysis on heavy oil is usually used to determine the amounts of
trace elements, such as vanadium and nickel. Heavy crude oil includes relatively high proportions of metals (particularly vanadium and nickel), either in the form of salts or as
organometallic constituents in comparison with conventional crude oil. The metallic constituents may actually volatilize under thermal recovery operations and appear in the
reservoir or in the production lines. Hetero-atoms (nitrogen, oxygen, sulfur, and metals)
account for crude oils. Thus, their concentrations have to be reduced to convert the oil to high quality one. In addition, metals have counter-productive effect on upgrading processes.
Unfavorable catalysts in treatment processes result in deposits over combustion. The levels of metals such as nickel and vanadium in heavy oil should be determined by the geochemist
when the origins of heavy oil are considered. Because these compounds poison catalysts used for sulfur and nitrogen removal as well as catalytic cracking [3, 12].
2.5.2 Physical Properties
2.5.2.1 Density and Specific Gravity
Specific gravity like other physical properties is influenced by chemical composition, but
quantitative correlation is difficult to establish. Studies reveal heavy oil density rises with increase in amounts of aromatic compounds, while an increase in saturated compounds
contributes to a decrease in density.
In particular, heavy oils with a high content of asphaltenes and resins (low kerosene) and
poor mobility at ambient temperature and pressure may have a specific gravity (density) of about 0.95, that is, they have API gravity between10 to 22.
2.5.2.2 Viscosity
The viscosity of heavy oil is a critical property in predicting oil recovery. Heavy oils have been considered to be those crude oils with a viscosity of 100-1000 cP (Figure 2.7).
2.5.2.3 Liquefaction and Solidification
These properties can effect on handling of heavy oil, both at the well head and in the
refinery. Liquefaction and solidification of heavy oil may cause problems during normal use or storage. These properties for heavy crude oils are typically characterized by measuring
melting point, softening point, pour pint, and cloud point.

11
2.5.2.4 Solubility
The separation of solid (asphaltene) and Liquid (maltene) phases can occur during thermal recovery of heavy oils depending on the solubility parameter. This parameter is significant
for petroleum constituents, especially, for asphaltene fractions.
Thermal recovery results in the removal of alkyl side chains from the asphaltenes, decreases
the hydrogen to carbon atomic ratio, and increases the solubility parameter. The deposited reacted material is usually a product of the action of the highest-molecular weight and/or
the highest-polarity constituents in the asphaltene and resin fractions.
The more polar compounds (e.g. the amphoteric constituents) of the asphaltene and resin
fractions are more thermally labile than the lower-polarity constituents (e.g. the neutral polar constituents). As a result, products from the amphoteric compounds involve high
solubility parameter, separating easily and quickly from crude oil.
Figure 2.7 Viscous Heavy Crude Oil [12].
2.5.3 Thermal Properties
2.5.3.1 Carbon Residue
Carbon residue may be used to evaluate the carbonaceous depositing characteristics of
heavy oil during thermal recovery.
2.5.3.2 Specific Heat
Specific heat is an extremely important engineering quantity in practice and is used in all
calculations on heating and cooling heavy oil.

12
2.5.3.3 Combustion Heat
Higher combustion heat corresponds to highly aromatic heavy oil.
2.5.3.4 Volatility
There must be an evaluation about the ability of heavy oil constituents to distill, or steam
distill, from the oil during thermal methods of enhanced oil recovery.
2.6 Heavy Oil Recovery
Enhanced oil recovery methods as tertiary oil recovery have focused on recovering the remaining oil from a reservoir that has been depleted of energy during the application of
primary and secondary recovery methods.
Thermal recovery methods, which are tertiary oil recovery methods, have been designed to
raise reservoir temperature in order to improve crude oil rheological properties and mobility through viscosity reduction, thermal expansion and steam distillation mechanisms [13].
Many properties of crude oils, such as viscosity, heat capacity, thermal conductivity, density
etc, are dependent on temperature. The crucial variable for thermal methods is oil viscosity.
It decreases exponentially with rising temperature. The changes trend is different for various API gravities. Since oil viscosity is also a function of temperature and API gravity. It can be
observed that the viscosity of oil increases with its density at a specific temperature. In other words, the higher the viscosity the greater the viscosity reduction for a given
temperature increase. These viscosity reductions are more considerable for heavy crude oils (Figure 2.8) [14].
Figure 2.8 Crude oil viscosity changes with temperature at different API gravity [14].

13
Therefore, thermal recovery methods are mostly used when the oil in the reservoir has a
high viscosity. Thermal enhanced oil recovery processes add heat to the reservoir to reduce oil viscosity and/or to vaporize the oil. In both cases, the oil is made more mobile so that it
can be more effectively driven to producing wells. In addition to adding heat, these processes provide a driving force (pressure) to move oil to producing wells. These methods
can be categorized into cyclic steam injection (Huff & Puff), steam flooding, in situ
combustion, hot water drive and electromagnetic [4].
2.6.1 Steam Based Recovery
The steam-based processes are the most common form of thermal and enhanced oil
recovery methods. They are most often applied in reservoirs containing viscous oils and tars as well. Commercial application of steam processes has been considered since the early
1960s. Primarily, steam injection can be used for dual purposes. First for stimulation treatments usually called as cyclic steam injection, and second for flooding generally called
as steam flood [14].
The main objective of cyclic steam injection is oil viscosity reduction and cleaning effects
around the wellbore. The process also known as steam soak, or Huff and Puff, is a single-well method that is composed of injection, soaking, and production stages for heating the
well vicinity and improving production rate by natural drive forces. Over this process, first, high-temperature, high-pressure steam is injected into a well for a certain amount of time to
heat the oil in the surrounding reservoir to a temperature at which it flows. Second, the
formation is allowed to “soak” by injected steam for some time to allow the heat to diffuse and lower the heavy oil viscosity. Finally, heavy oil is produced out of the same well, at first
by natural flow due to increased the reservoir pressure by steam injection. Application of cyclic conditions depends on the reservoir characteristics, flow rates and financial return.
The method obtains recovery factors around 30% (Figure 2.9 and 2.10) [13].
Figure 2.9 Cyclic Steam stimulation process (CSS) [4].

14
Figure 2.10 Stimulation treatment mechanisms [14].
By contrast, during steam flood, the wet steam is injected constantly into a number of
injection wells, thereafter, the formed steam zone is expanded toward production wells.
Temperature inside this steam zone is approximately equal to the injected fluid. In the front of the steam chamber, condensate water is formed with temperature gradient between
steam and original reservoir temperatures (Figure 2.11 and 2.12) [14].
Figure 2.11 Steam flood process [12].
15
Figure 2.12 Steam flood schematic mechanism [14].
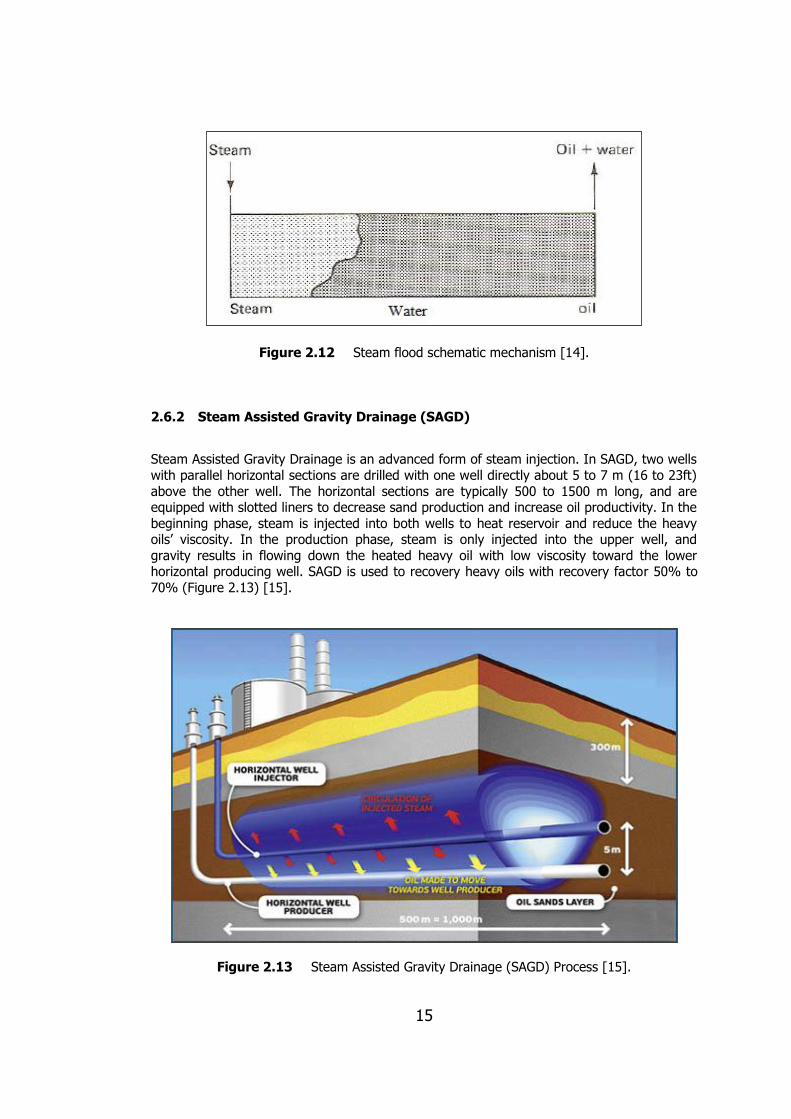
2.6.2 Steam Assisted Gravity Drainage (SAGD)
Steam Assisted Gravity Drainage is an advanced form of steam injection. In SAGD, two wells
with parallel horizontal sections are drilled with one well directly about 5 to 7 m (16 to 23ft)
above the other well. The horizontal sections are typically 500 to 1500 m long, and are equipped with slotted liners to decrease sand production and increase oil productivity. In the
beginning phase, steam is injected into both wells to heat reservoir and reduce the heavy oils’ viscosity. In the production phase, steam is only injected into the upper well, and
gravity results in flowing down the heated heavy oil with low viscosity toward the lower horizontal producing well. SAGD is used to recovery heavy oils with recovery factor 50% to
70% (Figure 2.13) [15].
Figure 2.13 Steam Assisted Gravity Drainage (SAGD) Process [15].

16
The basis of the SAGD process is that the injected steam forms a “steam chamber” above
the injection well that grows vertically and horizontally in the formation. Heat transferred by convection of the steam to the edge of the steam chamber, where the steam releases its
heat to the heavy oil, and then condenses into water. The heated oil and hot water drain into the producing well. Gravity induces the driving force rather than steam pressure (Figure
2.14) [15].
Figure 2.14 Thermal distribution in SAGD process [15].
2.7 Steam flood
The thermal and temperature effects on the reservoir rock and fluid properties are evident
consequences of steam injection through steam flood. Some of these effects are:
1) Increasing the reservoir rock and fluid temperature by heat convection and
conduction.
2) Viscosity reduction of fluid.
3) Volume rise of rock and fluid.
4) Vaporizing the light components of crude oil.
5) The decrease of interfacial forces.
6) Changing the permeability of oil and water [16].
Owing to synchronous transfer of heat, mass and fluid, steam flooding process is a
complicated oil recovery technique. Thus, it is essential that steam flood mechanism and performance impressing oil displacement from the reservoir are of great interest and
significant for application. In spite of the fact that steam is injected as gas state, it
condenses while it progresses through the formation [17].
2.7.1 Steam flood Zones
Because the steam spreads in reservoir over continuous steam injection, it undergoes
condensation when it moves forward through the reservoir formation due to heat losses, forming various regions with different characteristics. Thus, the oil bearing formation can be
classified into five sections on the basis of the possible temperature distribution and fluid
flow properties (Figure 2.15): 1) Steam zone

17
2) Solvent bank
3) Hot water bank
4) Oil bank
5) Initial zone
Figure 2.15 Schematic plot of steam flood zones [16].
In addition, the compositional changes in various zones result in a temperature distribution
and oil saturation distribution when thermal recovery methods are applied (Figures 2.16 and 2.17).
Figure 2.16 Temperature distribution in steam flood zones [4].
18
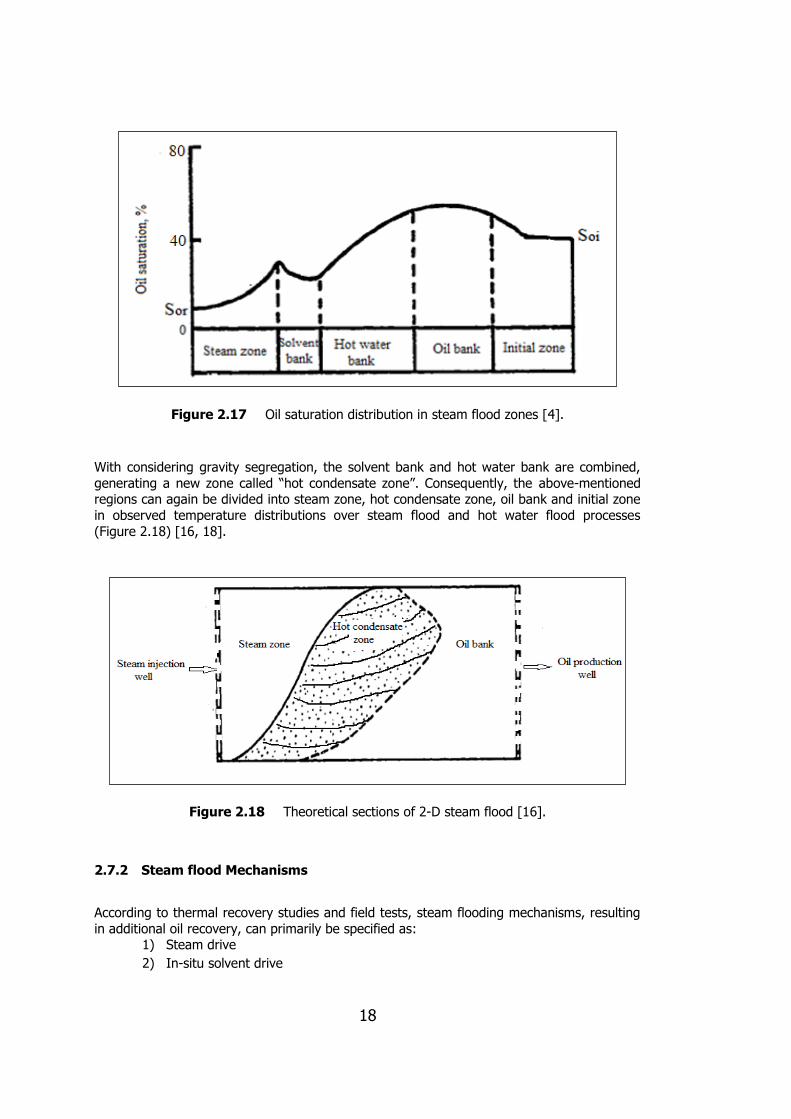
Figure 2.17 Oil saturation distribution in steam flood zones [4].
With considering gravity segregation, the solvent bank and hot water bank are combined,
generating a new zone called “hot condensate zone”. Consequently, the above-mentioned regions can again be divided into steam zone, hot condensate zone, oil bank and initial zone
in observed temperature distributions over steam flood and hot water flood processes
(Figure 2.18) [16, 18].
Figure 2.18 Theoretical sections of 2-D steam flood [16].
2.7.2 Steam flood Mechanisms
According to thermal recovery studies and field tests, steam flooding mechanisms, resulting
in additional oil recovery, can primarily be specified as: 1) Steam drive
2) In-situ solvent drive

19
3) Viscosity reduction
4) Thermal permeability and capillary pressure variations
5) Thermal expansion
6) Gravity segregation
7) Solution gas drive
8) Emulsion drive
These phenomena may take place in each, between, or over several of possible
temperature- fluid flow regions. However, the major mechanisms in steam zone are steam
drive and gravity segregation. Controlling mechanisms in hot condensate zone are viscosity reduction, thermal permeability variation, thermal expansion, gravity segregation, and in-situ
solvent drive [16].
The produced solvent (light fractions of crude oil) over condensation process in the hot
condensate zone due to decrease in temperature by heat loss should partially mix with the in-place oil, forming a solvent drive. Figure 2.19 schematically shows solvent generation,
recycling and accumulation in the steam zone and hot condensate zone as the steam front progresses downstream. The efficiency of in-situ solvent drive depends on the solvent slug
size and properties, and the properties of reservoir rocks [18].
Figure 2.19 Schematic illustration of the in-situ solvent generation [16].
The produced in-situ solvent over steam flood has a significant effect on the residual oil
saturation and gravity segregation in the steam zone. Moreover, the solvent drive influences the viscosity reduction and the heavy fraction concentration reduction in the oil. In addition
to solvent drive, the steam drive on the diluted oil subsequently provides low residual oil
saturation in the steam zone during steam flood operation. As a result, steam drive and in-situ solvent drive may perform the function of low residual oil saturations by less than 8 to
10% on the basis of field steam flood operations [16].

20

21
CHAPTER 3
STATEMENT OF THE PROBLEM
Based on International Energy Agency (IEA) reports, unconventional oil resources comprise
approximately 70% of total oil resources in the world. Both the marked increases in worldwide demand for energy due to global growth in population and development in
technology and the reduction in conventional oil resources encourage the authorities for
research in unconventional oils recovery field to promote the oil production rate and to compensate the deficiencies in energy demands.
The major reason for low production rate in unconventional oils recovery is their high
viscosity. To overcome this challengeable issue, steam flooding, as one of popular thermal recovery methods, is commercially applied. There are many mechanisms in steam flooding
contributing to high efficiency in heavy crude oils recovery. Steam distillation is directly and
indirectly responsible mechanism for heavy oils recovery during steam flooding, so both optimization of various parameters affecting steam distillation process to obtain high and
desirable efficiency of oil recovery and basic understanding of the effects of different parameters should assist petroleum engineering in the design, analysis, and evaluation of
steam flood operation and mathematical simulation.
Steam temperature plays an important role in increasing the vaporization rate of light
components of heavy oils. This phenomenon can promote the recovery efficiency. Over steam flooding steam temperature does not only affect steam distillation through the
vaporization of light components of heavy crude oil, but also through steam-oil interaction. Thus, physical properties of remaining oil after steam distillation can be used to quantify the
effectiveness of steam distillation at different conditions.
Geochemical studies indicate that steam makes clay and non-clay minerals matrix more
active for steam–oil chemical interactions. Theoretically, these reactions can affect the quantity of steam distillation. Therefore, the investigation of the role of reservoir
geochemistry and mineralogy in thermal recovery is the main goals of this experimental
study.
An experimental study aiming to observe the effect of steam temperature as well as mineral content of rock matrix will be carried out to investigate their effects on steam distillation.

22

23
CHAPTER 4
THEORY
4.1 Steam Distillation
In general, steam distillation is a separation operation for purification of liquid materials
through adding water (steam) to reduce the boiling points of the compounds [19].
Steam distillation in petroleum reservoirs is defined as a process of the separation of lighter
ingredients through vaporization from crude oil by steam injection [16].
Figure 4.1 Steam distillation process [20].
Steam flooding is commercially applied for heavy oils recovery over several decades. Understanding and utilizing the basic steam flooding mechanisms are helpful to enhance the
effectiveness of oil production [21].
Two immiscible water/oil liquid phases with their own specific vapor pressure in the system
can reduce the boiling point of a water/oil mixture below the boiling point of the individual components. Thus, the presence of steam, hot water and oil provide conditions for steam
distillation, as steam is not fully condensed in the reservoir.
Steam distillation of crude oil in porous media has been identified as a main process to
perform function of the reduction of residual oil saturation behind the hot water front over a steam flood process. As residual oil saturation basically depends on composition at a certain

24
steam injection pressure or temperature, the residual oil in the steam zone has a high
content of heavy fractions [22].
Steam can transfer a high proportion of light hydrocarbon in the steam distillation phenomenon. As a matter of fact, it must be investigated the generated vapors of steam
flood to optimize steam distillation for achievement high efficiency of oil recovery. As a
result, quantification of heavy crude oils recovery during steam injection requires understanding of fundamental phenomena related to the steam distillation process.
4.2 Steam Distillation Importance and Role in Heavy Crude Oils Recovery
While the significance of the steam distillation has been confirmed, its impressions on heavy
oils recovery by steam flood are not easily evident. Several experimental studies indicated that steam flood due to steam distillation process results in a more considerable oil recovery
than flooding with hot water at the same temperature. As opposed to 60% of light oils that
are recovered, steam distillation is responsible for heavy oils recovery by approximately 5 to 10% in steam flood process [4].
Laboratory experiments and field tests showed that steam distillation mechanism at thermal
recovery is extremely helpful in heavy crude oil recovery [23]. Steam distillation is a major
mechanism in thermal recovery of oil through the generation of in-situ solvent drive [17].
In steam flooding, injected steam establishes a steam zone by means of heating the reservoir formation. The size of steam zone is grown with continued steam injection process.
In steam zone the pressure and temperature gradients are little. The presence of the steam
in the steam zone with liquid phases of heated heavy crude oil and hot water induces water and light components of heavy oil in the steam zone to be vaporized into the steam phase
based on vapor pressures of the hydrocarbon constituents of crude oil, finally, forming hydrocarbon- laden steam. At a given steam distillation temperature:
Total pressure=steam injection pressure + partial distillated hydrocarbon pressure (4-1)
The steam including lighter hydrocarbons and water vapor are displaced forward, transporting through the steam zone by the flowing steam drive. A portion of the
hydrocarbon-contained steam condenses in the steam zone because of heat losses to the formation. The present hydrocarbons in the condensed steam are redeposited in the steam
zone. However, other portion of the hydrocarbon-laden steam reaches the steam front. Both
water and hydrocarbon (light components of heavy oil) vapors in flowing steam condense at the steam front to form a hot condensate zone (the mixture of a solvent (light fractions)
bank and a hot water bank) as a result of steam distillation.
At the steam front and in the bottom of the hot condensate zone the hydrocarbon vapor condenses due to the temperature drop across the hot condensate zone. The liquefied
hydrocarbons drive a head of the steam zone into the hot condensate zone. These
condensed hydrocarbons comprise the recoverable oil of steam zone (Figure 4.2) [17, 22, 23].

25
Figure 4.2 Steam distillation mechanisms in heavy oil reservoirs [20].
During steam distillation process the rapid vaporization of oil and water results in “chipping
effect”. This effect makes a portion of oil in the pores possible to disturb and redistribute. The combination of steam flood and “chipping effect” provides a more productive oil
recovery technique for heavy crude oils than conventional oils [4].
Steam distillation extracts light components of the initial crude oil. Thus, the residuum must become heavier than the initial oil. The mixing of the distilled light components with the
original oil results in improvement of oil recovery efficiency through dilution of original crude
oil [22].
Consequently, the liquefied hydrocarbons in steam distillation play a pivotal role in recovery of heavy crude oils through both providing a driving force that pushes original oil forward to
oil production well and viscosity reduction by dilution which results from the dissolving of
condensed light fractions (solvent) in original viscous heavy oil.
4.3 Steam Distillation Optimization
A basic insight into the importance of optimization of steam distillation process, which is
directly and indirectly responsible for oil displacement to lower residual oil saturation, makes it essential to recognize and investigate different phases of steam distillation system to
obtain high and desirable efficiency of oil recovery over steam flood.
In order to obtain high efficiency of heavy crude oils displacement and recovery, increasing
the amount of steam including distillate to dilute and push oil towards production well is impressive. Thus, the recovery efficiency does not depend on the total steam injected. On
the contrary, it relies on the amount of steam including water and hydrocarbon vapors in the
front of steam zone [17].
In other words, steam distillation that is consequence of thermal enhanced oil recovery process causes a hot condensate zone in between steam zone and original oil bank. The size
of condensate bank is dependent on the rate of steam distillation. Namely, as steam front moves, condensate bank size increases. This bank including light hydrocarbons (solvent)
that are distilled from oil remaining in the steam zone induces more considerable recovery
26
efficiency through both driving force forward and viscosity reduction by the action of
dilution.
Some experimental studies indicate that the amount of steam distillation does not depend on steam injection rate, porous media, and initial oil volume. Furthermore, changing the
saturated steam pressure and temperature had a trivial effect on steam distillation, but
superheating the steam ranging from 244 to 316 C significantly increased the steam
distillation rate, especially, for some heavy crude oils. In contrast, the original crude oil composition and chemical interaction between oil components and high pressure and high
temperature water are controlling and productive factors in the amount steam distillation [23].
4.3.1 Steam flood Phases
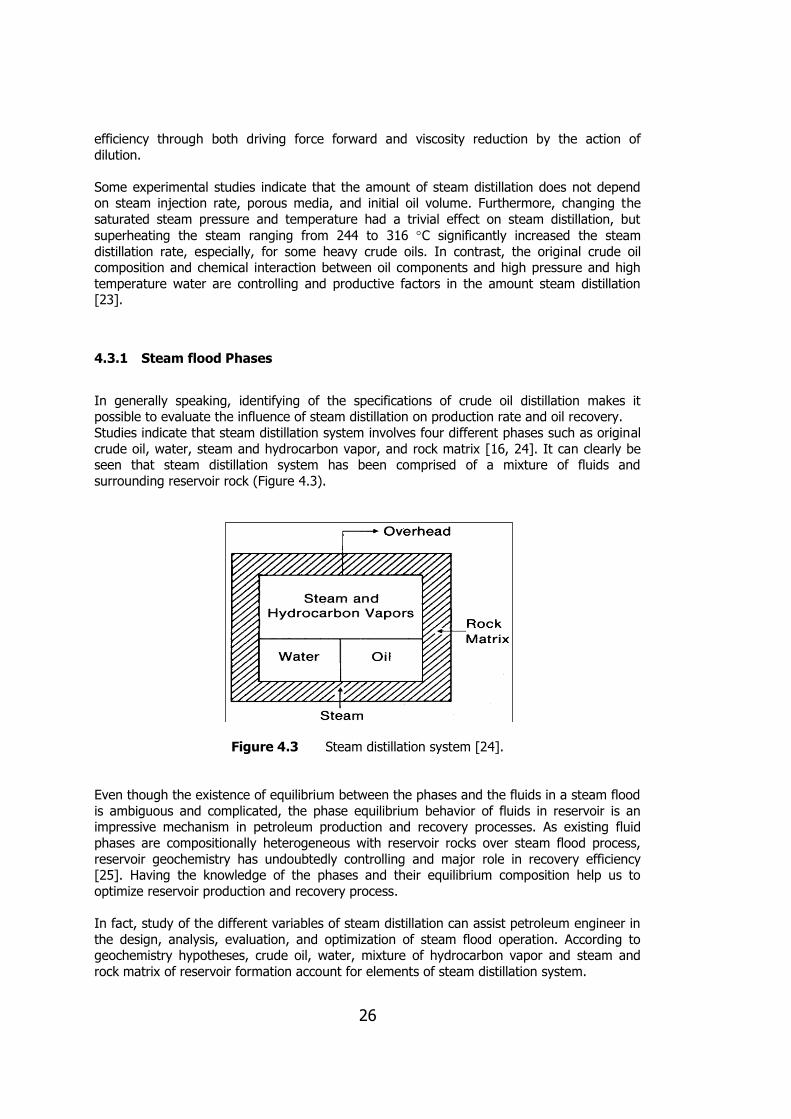
In generally speaking, identifying of the specifications of crude oil distillation makes it possible to evaluate the influence of steam distillation on production rate and oil recovery.
Studies indicate that steam distillation system involves four different phases such as original
crude oil, water, steam and hydrocarbon vapor, and rock matrix [16, 24]. It can clearly be seen that steam distillation system has been comprised of a mixture of fluids and
surrounding reservoir rock (Figure 4.3).
Figure 4.3 Steam distillation system [24].
Even though the existence of equilibrium between the phases and the fluids in a steam flood
is ambiguous and complicated, the phase equilibrium behavior of fluids in reservoir is an impressive mechanism in petroleum production and recovery processes. As existing fluid
phases are compositionally heterogeneous with reservoir rocks over steam flood process,
reservoir geochemistry has undoubtedly controlling and major role in recovery efficiency [25]. Having the knowledge of the phases and their equilibrium composition help us to
optimize reservoir production and recovery process.
In fact, study of the different variables of steam distillation can assist petroleum engineer in
the design, analysis, evaluation, and optimization of steam flood operation. According to geochemistry hypotheses, crude oil, water, mixture of hydrocarbon vapor and steam and
rock matrix of reservoir formation account for elements of steam distillation system.
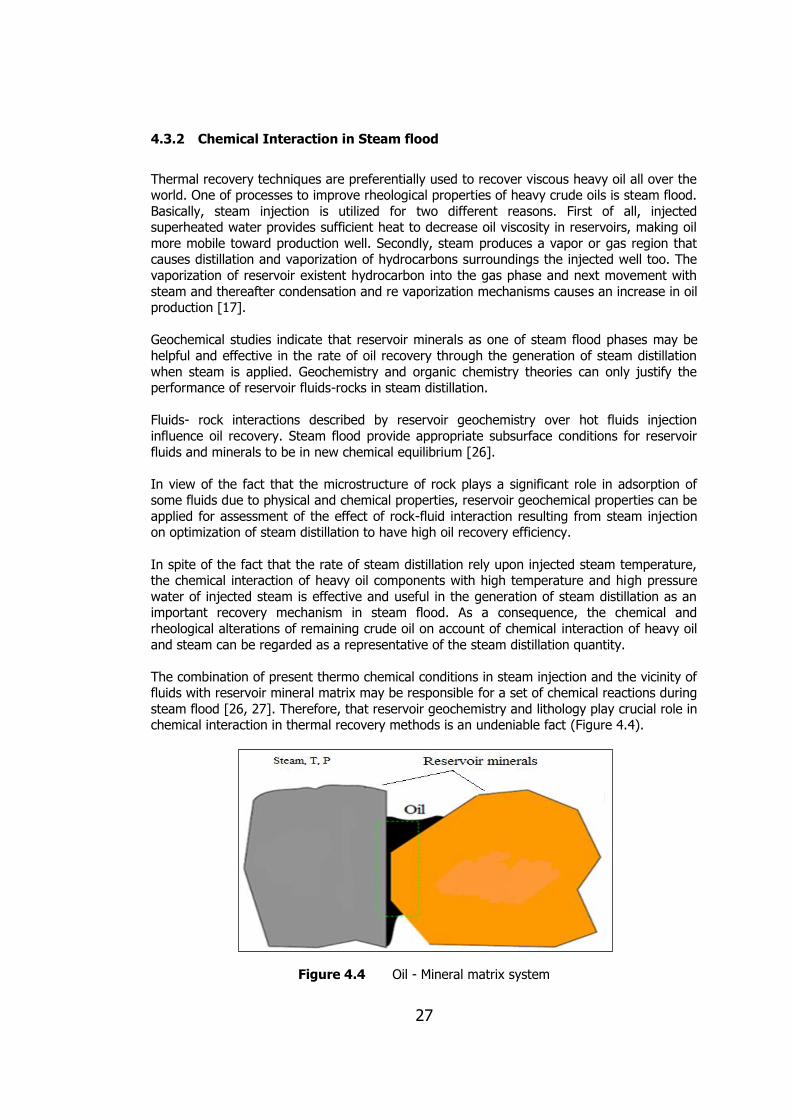
27
4.3.2 Chemical Interaction in Steam flood
Thermal recovery techniques are preferentially used to recover viscous heavy oil all over the world. One of processes to improve rheological properties of heavy crude oils is steam flood.
Basically, steam injection is utilized for two different reasons. First of all, injected superheated water provides sufficient heat to decrease oil viscosity in reservoirs, making oil
more mobile toward production well. Secondly, steam produces a vapor or gas region that causes distillation and vaporization of hydrocarbons surroundings the injected well too. The
vaporization of reservoir existent hydrocarbon into the gas phase and next movement with
steam and thereafter condensation and re vaporization mechanisms causes an increase in oil production [17].
Geochemical studies indicate that reservoir minerals as one of steam flood phases may be
helpful and effective in the rate of oil recovery through the generation of steam distillation
when steam is applied. Geochemistry and organic chemistry theories can only justify the performance of reservoir fluids-rocks in steam distillation.
Fluids- rock interactions described by reservoir geochemistry over hot fluids injection
influence oil recovery. Steam flood provide appropriate subsurface conditions for reservoir
fluids and minerals to be in new chemical equilibrium [26].
In view of the fact that the microstructure of rock plays a significant role in adsorption of some fluids due to physical and chemical properties, reservoir geochemical properties can be
applied for assessment of the effect of rock-fluid interaction resulting from steam injection on optimization of steam distillation to have high oil recovery efficiency.
In spite of the fact that the rate of steam distillation rely upon injected steam temperature, the chemical interaction of heavy oil components with high temperature and high pressure
water of injected steam is effective and useful in the generation of steam distillation as an important recovery mechanism in steam flood. As a consequence, the chemical and
rheological alterations of remaining crude oil on account of chemical interaction of heavy oil
and steam can be regarded as a representative of the steam distillation quantity.
The combination of present thermo chemical conditions in steam injection and the vicinity of fluids with reservoir mineral matrix may be responsible for a set of chemical reactions during
steam flood [26, 27]. Therefore, that reservoir geochemistry and lithology play crucial role in chemical interaction in thermal recovery methods is an undeniable fact (Figure 4.4).
Figure 4.4 Oil - Mineral matrix system
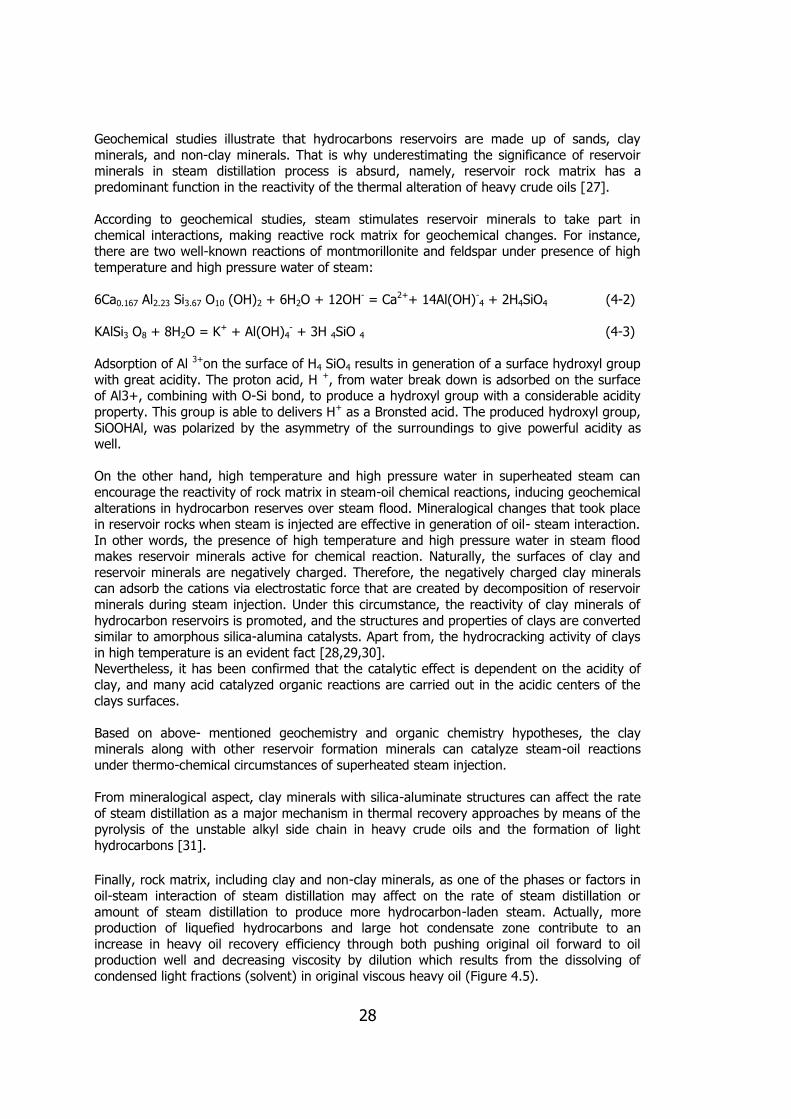
28
Geochemical studies illustrate that hydrocarbons reservoirs are made up of sands, clay
minerals, and non-clay minerals. That is why underestimating the significance of reservoir minerals in steam distillation process is absurd, namely, reservoir rock matrix has a
predominant function in the reactivity of the thermal alteration of heavy crude oils [27].
According to geochemical studies, steam stimulates reservoir minerals to take part in
chemical interactions, making reactive rock matrix for geochemical changes. For instance, there are two well-known reactions of montmorillonite and feldspar under presence of high
temperature and high pressure water of steam:
6Ca0.167 Al2.23 Si3.67 O10 (OH)2 + 6H2O + 12OH- = Ca2++ 14Al(OH)-4 + 2H4SiO4 (4-2)
KAlSi3 O8 + 8H2O = K+ + Al(OH)4
- + 3H 4SiO 4 (4-3)
Adsorption of Al 3+on the surface of H4 SiO4 results in generation of a surface hydroxyl group
with great acidity. The proton acid, H +, from water break down is adsorbed on the surface of Al3+, combining with O-Si bond, to produce a hydroxyl group with a considerable acidity
property. This group is able to delivers H+ as a Bronsted acid. The produced hydroxyl group,
SiOOHAl, was polarized by the asymmetry of the surroundings to give powerful acidity as well.
On the other hand, high temperature and high pressure water in superheated steam can
encourage the reactivity of rock matrix in steam-oil chemical reactions, inducing geochemical
alterations in hydrocarbon reserves over steam flood. Mineralogical changes that took place in reservoir rocks when steam is injected are effective in generation of oil- steam interaction.
In other words, the presence of high temperature and high pressure water in steam flood makes reservoir minerals active for chemical reaction. Naturally, the surfaces of clay and
reservoir minerals are negatively charged. Therefore, the negatively charged clay minerals can adsorb the cations via electrostatic force that are created by decomposition of reservoir
minerals during steam injection. Under this circumstance, the reactivity of clay minerals of
hydrocarbon reservoirs is promoted, and the structures and properties of clays are converted similar to amorphous silica-alumina catalysts. Apart from, the hydrocracking activity of clays
in high temperature is an evident fact [28,29,30]. Nevertheless, it has been confirmed that the catalytic effect is dependent on the acidity of
clay, and many acid catalyzed organic reactions are carried out in the acidic centers of the
clays surfaces.
Based on above- mentioned geochemistry and organic chemistry hypotheses, the clay minerals along with other reservoir formation minerals can catalyze steam-oil reactions
under thermo-chemical circumstances of superheated steam injection.
From mineralogical aspect, clay minerals with silica-aluminate structures can affect the rate
of steam distillation as a major mechanism in thermal recovery approaches by means of the pyrolysis of the unstable alkyl side chain in heavy crude oils and the formation of light
hydrocarbons [31].
Finally, rock matrix, including clay and non-clay minerals, as one of the phases or factors in
oil-steam interaction of steam distillation may affect on the rate of steam distillation or
amount of steam distillation to produce more hydrocarbon-laden steam. Actually, more production of liquefied hydrocarbons and large hot condensate zone contribute to an
increase in heavy oil recovery efficiency through both pushing original oil forward to oil production well and decreasing viscosity by dilution which results from the dissolving of
condensed light fractions (solvent) in original viscous heavy oil (Figure 4.5).
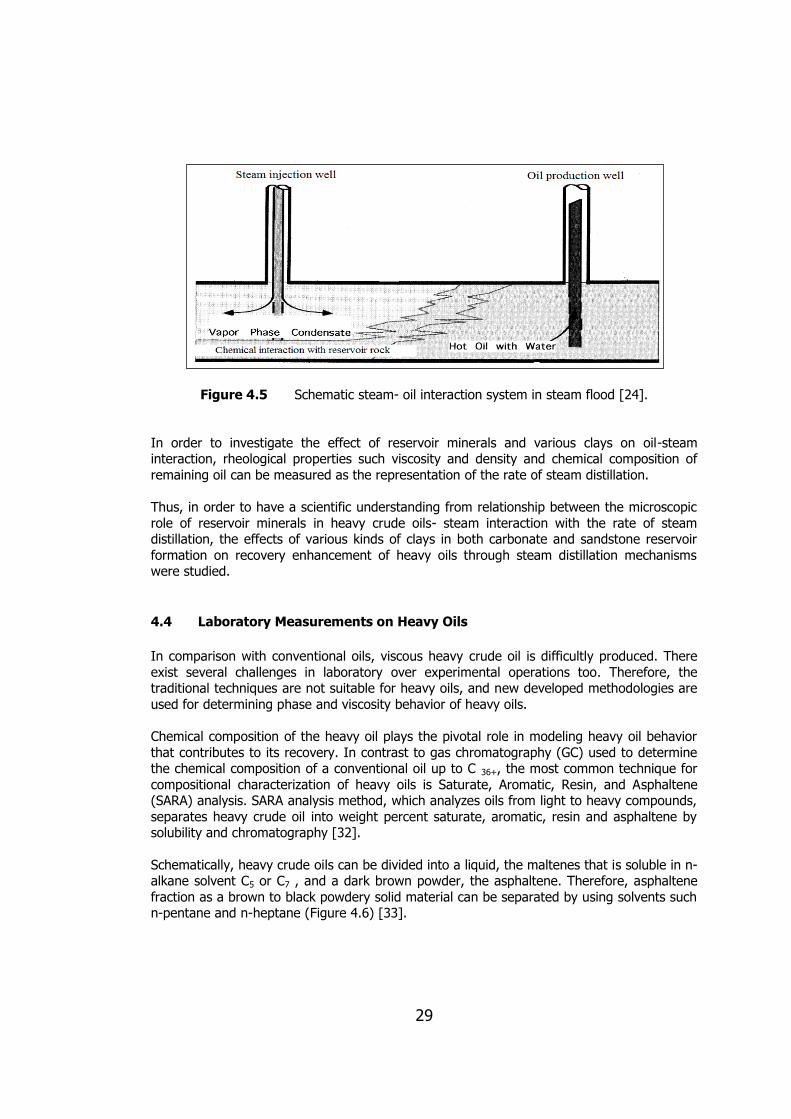
29
Figure 4.5 Schematic steam- oil interaction system in steam flood [24].
In order to investigate the effect of reservoir minerals and various clays on oil-steam interaction, rheological properties such viscosity and density and chemical composition of
remaining oil can be measured as the representation of the rate of steam distillation.
Thus, in order to have a scientific understanding from relationship between the microscopic
role of reservoir minerals in heavy crude oils- steam interaction with the rate of steam distillation, the effects of various kinds of clays in both carbonate and sandstone reservoir
formation on recovery enhancement of heavy oils through steam distillation mechanisms were studied.
4.4 Laboratory Measurements on Heavy Oils
In comparison with conventional oils, viscous heavy crude oil is difficultly produced. There
exist several challenges in laboratory over experimental operations too. Therefore, the traditional techniques are not suitable for heavy oils, and new developed methodologies are
used for determining phase and viscosity behavior of heavy oils.
Chemical composition of the heavy oil plays the pivotal role in modeling heavy oil behavior
that contributes to its recovery. In contrast to gas chromatography (GC) used to determine the chemical composition of a conventional oil up to C 36+, the most common technique for
compositional characterization of heavy oils is Saturate, Aromatic, Resin, and Asphaltene (SARA) analysis. SARA analysis method, which analyzes oils from light to heavy compounds,
separates heavy crude oil into weight percent saturate, aromatic, resin and asphaltene by solubility and chromatography [32].
Schematically, heavy crude oils can be divided into a liquid, the maltenes that is soluble in n-alkane solvent C5 or C7 , and a dark brown powder, the asphaltene. Therefore, asphaltene
fraction as a brown to black powdery solid material can be separated by using solvents such n-pentane and n-heptane (Figure 4.6) [33].

30
Figure 4.6 General chemical composition of heavy oil [33].
SARA analysis confirms that API gravity of heavy oils decreases with increase in resin and
asphaltene constituents (Figure 4.7).
Figure 4.7 Relationship between resin and asphaltene compositions and API gravity [5]
Another required important measurement with regard to oils is phase behavior, known as
PVT behavior. The modified techniques have been developed to accurately determine heavy oil fluid properties as functions of pressure, temperature, and composition. Laboratory

31
measurements are carried out to monitor rheology and solubility changes on heavy oils with
changes in pressure and temperature [5].
4.5 Rheological Properties of Fluid
Fluid can be identified by variables such as pressure, temperature, and rheological properties. Rheological properties practically include viscosity and density. Rheological
properties provide useful behavioral and predictive data about the effect of processing,
compositional changes, aging phenomena, etc.
Rheological measurements are indirect indexes of production constancy and quality and direct parameters to evaluate and design processes. In addition, they are the most practical
approaches to characterize materials, to monitor and control a process, to study of chemical, mechanical, and thermal treatments, and the effects of additives, and to predict the
performance and material behavior [34].
4.5.1 Rheology
Rheology can be defined as the study of the change in form and the flow of matter under
controlled stress. It is related to the flow of fluid and the deformation of solid. The major objective of rheology is to generate the relationship between flow or other deformations and
stresses [34].
4.5.2 Rheological Parameters
Primarily, the major element to study of rheology is stress. Stress is a force applied for a
matter that causes deformation, or strain, it is usually described in terms of quantity per unit of area. In generally speaking, stress results from the force vector component perpendicular
or non-parallel to the cross section of materials [34, 35].
Figure 4.8 Comparative illustration of various stresses [35].

32
4.5.2.1 Shear Stress
Shear stress, denoted is defined as the force vector component alongside with the cross section of material per unit area that results in deformation in a specific direction. Namely,
shear stress is the stress component parallel to a given surface. Its unit of measure is called Pascal (pa). It can be represented by:
Shear Stress = τ = aSurfaceAre
ShearForce=
A
F (4-4)
4.5.2.2 Shear Rate Shear rate can be expressed as the velocity gradient which is a measurement of the change
in speed at which the layers of fluid move with respect to each other, describing the rate of
change in angle between lines that were initially perpendicular. Its unit of measure is called the reciprocal second (sec -1). It can be depicted by:
Shear Rate = ϒ = HeightSeparation
Velocity=
H
V ≈
dH
dV (4-5)
Figure 4. 9 Shear Stress - Shear rate in a deformation process [35].
4.5.2.3 Viscosity
Viscosity illustrates the internal resistance of fluid to flow by various form of stresses, and it
may be concept of as a measure of fluid friction. In a simple term, the less viscous the fluid

33
is the greater movement (fluidity). The most common units of viscosity are Pa.s and
centipoises (cP) (1 cP = 10-3 Pa.s or 1 mPa.s).
4.5.3 Properties and behavior of Fluids
With consideration to above-mentioned concepts, fluids can be classified with respect to
rheological parameters into Newtonian and non- Newtonian fluids.
4.5.3.1 Newtonian Fluid
The Newtonian fluid is the principle for classical fluid mechanics. This means that there is a
linear relationship between shear stress and shear rate, that is, when shear stress is plotted against shear rate at a specific temperature, the graph indicates a straight line with a
constant slope that is independent of shear rate. This slope is called the viscosity of the fluid
(Figure 4.10). An unchangeable viscosity for a specific temperature is the most common trait of Newtonian fluids. All gases and water are samples of Newtonian fluids (Figure 4.11).
Figure 4.10 Newtonian fluids rheogram [36].

34
Figure 4.11 Viscosity vs. Shear rate in Newtonian fluids [36].
The applied force is proportional to the area and velocity gradient in the fluid and indirectly proportional to the separation height. Thus, these three relations can be correlated as a
form of [35, 37]:
F η A H
V (4-6)
where η is a constant coefficient called viscosity. This equation can be expressed in terms of
shear stress:
τ= A
F (4-7)
τ= ηH
V (4-8)
for Newtonian fluid shear stress, τ, can be expressed as following correlation:
τ= η ϒ (4-9)
So, viscosity of Newtonian fluids can be calculated through
η =
(Pa.s) (4-10)

35
4.5.3.2 Non-Newtonian Fluid
Generally, non-Newtonian fluids can be contrasted with Newtonians ones with respect to
flow properties. Any fluids, in which there is not a linear relationship between shear stress and shear rate, are characterized as non- Newtonian fluids.
As opposed to Newtonian fluids, the slope of shear stress versus shear rate graph is not fixed in non-Newtonian fluids, changing in different shear rates. Therefore, a constant
coefficient of viscosity cannot be calculated. Nevertheless, non-Newtonian fluids display a more complex relationship between shear stress and shear rate (Figure 4.12).
Because the viscosity of non-Newtonian fluids is variable in various shear rate, the science of rheology is used for identification of non- Newtonian fluids [34, 37].
Figure 4.12 Non-Newtonian fluids rheogram [36].
Based on the viscosity changes in terms of shear rate, non-Newtonian fluids are divided into
shear thinning and shear thickening. The shear thinning behavior is more common than the shear thickening history [37].
4.5.3.2.1 Shear Thinning
In this type of fluids the viscosity has an inversely relationship with shear rate. In fact, the viscosity of a fluid decreases with increasing shear rate, the fluid is called shear thinning.
Another name for a shear thinning fluids is a pseudoplastic [35].

36
4.5.3.2.2 Shear Thickening
A dilatant (also termed shear thickening) fluid is one kind of non- Newtonian fluids. Unlike shear thinning fluids, the viscosity increases as the fluid is subjected to a high shear rate in
shear thickening (Figure 4.13) [35].
Figure 4.13 Viscosity Vs. Shear rate in non- Newtonian fluids [36].

37
CHAPTER 5
MATERIALS AND METHODS
In this work, two different heavy crude oils (in form of dead oil), namely Camurlu and Bati
Raman from southeast Turkey, were examined to determine the effects of various minerals such as bentonite, kaolinite, illite, zeolite, and sepiolite, in steam distillation of heavy crude
oils accompanied with two rock matrices (sandstone and limestone). The rock matrix, one of
the main components during steam distillation, was simulated by two different crushed rock (core) samples, sandstone and limestone (carbonate). In steam distillation runs heavy oil
samples, rock samples, and water were put into a batch autoclave, and in-situ steam was generated by heating of the system. Chemical and rheological properties of oil samples
before and after steam treatment were determined using suitable analytical methods to find the possible changes as a result of steam distillation.
The present experimental study includes preparation of materials, their characterization, experimental setup and procedure carried out.
5.1 Heavy Crude Oil Samples
In this experimental study, heavy crude oil samples from Camurlu and Bati Raman fields in
southeast of Turkey (Figure 2.6) were used. The rheological and chemical characteristics of oil samples before and after steam treatment were determined by obtaining viscosity,
density, and API gravity values and the amount of Saturate, Aromatic, Resin, and Asphaltene (SARA) components and Total Petroleum Hydrocarbon (TPH).
5.2 Preparation of Rock Samples
In this experimental study, two rock (core) samples, namely, sandstone and limestone were
selected to represent reservoir rocks of heavy crude oils in southeast of Turkey. The core
samples were obtained from department of Petroleum and Natural Gas Engineering (Figure 5.1). Before experiments, selected core samples were separately crushed by hummer and
grinded in a jar mill roller (MAHWAH - Model NJ 07430) until they were milled in form of particles with the size as small as possible. In the case of sandstone, particles are of medium
size (< 140 Mesh or 105 Microns), in the case of limestone, they are fine particles (< 230
Mesh or 63 Microns). This difference may come from the fact that sandstone is harder than limestone due to the existence of Quartz mineral in sandstone rock (Figure 5.1).

38
Figure 5.1 Rock samples preparation process
In order to identify, mineralogical composition of the core samples X- Ray Diffraction (XRD)
analysis was carried out. The instrument used was Rigaku MiniflexII-Cu Kα radiation present
in Geological Engineering Department of METU.
Moreover, elemental composition of the samples was examined using various analytical
techniques such as X-Ray Fluorescence (XRF) with Rigaku ZSX PrimusII XRF instrument and Inductively Coupled Plasma Optical Emission Spectrometry (ICP-OES) with ICP-OES
instrument of Perkin Elmer Optima 4300DV present in Central Laboratory of METU.
5.3 The minerals Used
In order to examine the catalytic effect of minerals on the amount of steam distillation, five different types of minerals (Bentonite, Kaolinite, Illite , Sepiolite, and Zeolite) were used
(Figure 5.2).
Figure 5.2 Different minerals used in experiments

39
5.4 Experimental Setup and Procedure
After obtaining raw materials, the experimental setup for steam distillation study was
established. The following subsections include the explanations of experimental setup for steam distillation as well as the procedures followed during the experimental runs.
5.4.1 Steam Distillation Experiments
The steam distillation setup is made up of four main components (Figures 5.3, 5.4):
Batch autoclave reactor,
Heating mantle,
Temperature controlling system and
Data recording system.
Batch autoclave reactor is made of stainless steel having inner volume of 650 ml. It is rated
to a pressure of 200 bar at a temperature of 300 C (Figures 5.3, 5.4). The lid of the reactor
is equipped with a thermowell to place a thermocouple to measure the cell temperature and
a connection for pressure transducer for pressure measurement. Autoclave is placed in a constant temperature bath to be able to keep the temperature constant during the
experiments. The autoclave is surrounded with a heating mantle to raise the temperature of
the cell as well as to keep it at the desired temperature (Figures 5.3, 5.4). The heating
mantle is controlled by a temperature controlling unit within ± 2C. Temperature and
pressure within the cell are recorded as function of time through a data recording system at
every 5 seconds (Figure 5.5).
One of the following mixtures of different components was used during a steam distillation
experiment:
100 g heavy crude oil and 30 g tap water
100 g heavy crude oil, 30 g tap water, and 10 g rock sample (limestone or
sandstone) 100 g heavy crude oil, 30 g tap water, 8 g rock sample (limestone or sandstone),
and 2 g mineral (Bentonite, Kaolinite, Illite , Sepiolite, and Zeolite)
The mixture was put into the autoclave then; the system was heated to the determined
temperatures (150, 200, and 250 C) by means of heating mantle and kept at those
temperatures through temperature controlling system for 40 hours.
At the end of the steam distillation process the distilled hydrocarbons in steam phase was taken out and analyzed for Total Petroleum Hydrocarbon (TPH) analysis (given in 5.4.5).
Finally the heating was stopped, allowing the system to cool down to room temperature.
Afterwards the remaining mixture (oil, water and rock) was removed for separation. Separation was carried out by centrifuge.

40
Figure 5.3 Batch autoclave reactor
Figure 5.4 Steam distillation process setup
Constant temperature oven
Thermocouple
Temperature controlling system
Data recording system
Pressure transducer
Autoclave Heating mantle
Thermowell for Thermo couple Pressure
transducer port
Autoclave
Heating mantle

41
Figure 5.5 Recorded data during steam distillation
5.4.2 Centrifugal Separation
The available method for the separation of oil, water and rock mixture after steam distillation was centrifugal separation. Centrifugal force is an effective method to separate
the heterogeneous mixture including different materials with various specific gravity. This process was carried out in a centrifuge (STANHOPE-SETA Model 90000-2p) with rotor speed
1774 rpm at 60 C for 2 hours to obtain the separated pure oil from rock and water (Figure
5.6).
Three components of the mixture were separated based on their specific gravities; the rock
was settled to the bottom in the centrifuge tube owing to the highest specific gravity among three components. Oil stays at the top and water is located between oil and rock
components (Figure 5.6).
In order to characterize rheological and chemical properties of remaining oil samples
viscosity (in 5.4.3) and density (in 5.4.4) measurements and chemical analyses (in 5.4.5) were carried out as indicators of the quantity of steam distillation.
Heating p
eriod
Steam distillation

42
Figure 5.6 Centrifugal separation of oil, water and rock mixture
5.4.3 Viscosity Measurements
Viscosity measurements were carried out by a rotary viscometer (Haake Rotovisco, Model
RV20).The Haake Viscometer is a combined system consisting of three distinct parts: Heating fluid circulation system, Measuring system, and Control panel. Oil circulation system
is used to heat measuring system and control operational temperature by digital system.
The measuring system of this viscometer comprises the temperature vessel and stand and the sensor system. Oil viscosity is determined with different sensors MV, NV, and SV. Sensor
system with coaxial cylinder structure provides a narrow space between inside of the cup and outside of the rotor to shear oil sample (Figure 5.7).
Figure 5.7 Haake Rotovisco RV20
Rock
Water
Oil
Measuring system
Heating fluid
circulation system
Control panel

43
Owing to high viscosity of oil samples, the sensor system SV2 was found to be suitable for
rheological studies of oil samples. Approximately 3.5 g of oil sample was put in sample cup,
leaving for a few minutes to reach the desired operational temperature (40, 50, and 60 C).
Afterwards, shear stresses were recorded at different shear rates ranging from 4.45(1/s) to
445(1/s). Rheograms of oil samples and the correlations for oil samples rheological study
and viscosity calculation in different conditions of experiments are given in Appendix A.
5.4.4 Density Measurements
Density is an important property to characterize heavy oils and other petroleum products. The density of oil samples can be an indicator of rheological property. Density, specific
gravity, and API measurements were carried out at automatic densitometer (Anton Paar, Model DMA 4500) by the Petroleum Research Center of METU (Figure 5.8). The main
principle to measure density through this apparatus is the change in oscillating frequency due to the change in the mass of the tube. This instrument is commonly used to measure
density and American Petroleum Institute (API) gravity. To measure density, approximately
1 ml of oil sample was injected into an oscillating sample tube, the change in the mass of
tube is used in conjunction with calibration data to determine density at 15 C. Due to high
viscosity of oil samples, the preheating to 50 C is essential before density measurements at
15 C. The relation between common density (ρ) and API gravity is as follow:
5.131..
5.141
GrSpAPIgravity (5.1)
base
sampleGrSp
.. (5.2)
Figure 5.8 Density meter used in experiments

44
5.4.5 Chemical Analysis of Oil Samples
To determine the chemical changes in oil samples before and after steam distillation
process, they were divided into their SARA components through thin layer chromatography (TLC) in Geochemistry Division of the Research Center of Turkish Petroleum Corporation
(TPAO).
In addition, Total Petroleum Hydrocarbon (TPH) analyses were performed at the Petroleum
Research Center laboratories (PAL) of METU to determine the composition of distilled hydrocarbons in steam phase. At the end of steam distillation process, a sample of steam
phase containing distilled light hydrocarbons was taken at the top of autoclave reactor by a
syringe for Total Petroleum Hydrocarbon analysis with Gas Chromatography (Agilent Technologies, Model 7890) to determine the quantity of C6-C35 distilled hydrocarbons.
(Figure 5.9)
Figure 5.9 Condensed steam and distillate in syringe for TPH analysis
Distillate
Condensed steam

45
CHAPTER 6
RESULTS AND DISCUSSION
Results and discussions are given in three subsections, namely, properties of materials,
steam distillation experiments, and overall interpretation of the results.
An experimental study was carried out to investigate the effect of different types of minerals
on the efficiency of steam distillation during steam flooding of two different heavy oils. In that respect the experimental set-up and procedure described in Chapter 5 were applied.
Prior to carry out the steam distillation experiments, heavy oils and reservoir rock formations were chemically and physically characterized.
6.1 Properties of materials
Heavy crude oils come from two locations, Bati Raman and Camurlu reservoirs, core samples
for rock representation to simulate rock of oil locations two types of core samples, sandstone and limestone, and to simulate possible reservoir minerals, four clay minerals, Bentonite,
Kaolinite, Illite, and Sepiolite and one silicate, Zeolite,
Density and viscosity of oil samples have been determined as physical properties. The
results are given in Table 6.1:
Table 6.1 Physical properties of heavy crude oil samples
As it is seen from Table 6.1, Bati Raman heavy crude has lower oil density and viscosity than
those of the Camurlu. This difference may come from the difference in SARA composition of two crude oils. As given in Table 6.2 the percentage of saturate in Camurlu is smaller
whereas percentage of asphaltene is greater than that of Bati Raman crude oil.
According to viscosity and density of two crude oils, Bati Raman and Camurlu crude oils are
classified as heavy oils [32].
Chemical compositions of two heavy crude oils and two rock samples have been determined. The results are given in Tables 6.2, 6.3a, 6.3b:
Type Viscosity (cP) at (ϒ= 56.96, 60 C)
Density (g/cm3)
at 15 C
API Gravity
at 15 C
Camurlu 1134.4 1.00615 9.5
Bati Raman 800.9 0.98635 12.6

46
Table 6.2 The hydrocarbon composition of heavy crude oil samples
As can clearly be seen in Table 6.2 Camurlu crude oil has smaller amount of saturate, greater amounts of aromatic and asphaltene relative to Bati Raman crude oil. The
hydrocarbon composition can also be seen in Figure 6.15 to Figure 6.22 as references.
XRF and ICP-OES analyses of sandstone and limestone seem to be consistent with their
characteristics (Tables 6.3a and 6.3b). The percentage of SiO2 in sandstone rock is about 42 %. This may come from higher amount of quartz relative to Plagioclase and Potassic
feldspar. Presence of magnesium (Mg), iron (Fe), potassium (K), and sodium (Na) in considerable amounts approve the presence of Plagioclase and Potassic feldspar. In
addition, analyses results show that limestone rock sample is highly pure; its CaO value is
about 58%.
Table 6.3a XRF analysis results of rock samples (%)
Type % (by weight)
Saturate Aromatic Asphaltene Polar(Resin)
Camurlu 9.89 53.62 26.06 10.44
Bati Raman 11.75 51.72 24.56 11.97
Element Sandstone
rock (SSF)
Carbonate
rock (CBF)
CO2 14.1 41.1
Al2O3 12.0 0.0997
SiO2 41.8 0.167
CaO 16.6 58.4
Fe2O3 6.33 0.0408
MgO 3.41 0.152
SO3 0.0486 0.0191
Na2O 1.35 -
K2O 3.05 -
P2O5 0.138 -
TiO2 0.863 -
MnO 0.137 -
Cr2O3 0.0284 -
SrO 0.0453 0.0124
BaO 0.0803 -

47
Table 6.3b ICP-OES analysis results of rock samples
Mineralogical compositions of sandstone and limestone rock samples have been carried out by XRD analysis. The results are given in Table 6.4
Table 6.4 XRD analysis results of rock samples
Sandstone Rock (SSF) Limestone Rock (CBF)
Clay
wt % Mineral
Clay
wt % Mineral
Smectite < 5 Kaolinite
Chlorite
3 Chlorite
Illite
Kaolinite
Non-clay
Quartz
Non-clay
95 Calcite
97 Calcite
Trace Quartz
Plagioclase Plagioclase
K-feldspar
The evaluation of XRD traces of rock samples showed that clay composition of them is
rather low, namely, 3% in sandstone rock and less than 5 % in limestone rock. Clay
minerals identified are smectite, chlorite, illite, and kaolinite in sandstone rock, while kaolinite and chlorite in limestone. The main mineral identified in limestone rock is calcite.
6.2 Steam Distillation Experiments
Steam distillation is one of the effective mechanisms in thermal recovery and optimization of
different parameters involved in steam distillation can modify the recovery efficiency. The changes in rheological and chemical properties of crude oil before and after steam distillation
process are proportional to the effectiveness of steam distillation. In that respect, an experimental study was carried out to investigate the influence of different mineral types in
both sandstone and limestone rocks on steam distillation. 34 experiments were carried out
throughout the study with the experimental conditions listed in Table 6.5.
Element (%)
Sandstone rock (SSF)
Carbonate rock (CBF)
Si 25.6±0.2 0.038±0.001
Ca 7.14±0.12 40.4±0.2
Al 5.75±0.10 0.026±0.001
Fe 4.56±0.03 0.022±0.002
K 2.41±0.06 -
Na 1.16±0.03 -
Mg 1.15±0.02 0.104±0.001
Ti 0.433±0.01 -

48
Table 6.5 List of experiments
Crude oil Lithology T (°C) Mineral Type
Camurlu
SSF
150 None
200
250
None
Bentonite
Zeolite
Illite
Sepiolite
Kaolinite
CBF
150 None
200
250
None
Bentonite
Zeolite
Illite
Sepiolite
Kaolinite
None 250 None
Bati Raman
SSF
150 None
200
250
None
Bentonite
Zeolite
Illite
Sepiolite
Kaolinite
CBF
150 None
200
250
None
Bentonite
Zeolite
Illite
Sepiolite
Kaolinite
None 250 None

49
6.2.1 The Effect of Steam Temperature
Steam temperature plays an important role in increasing the degree of vaporization of light components of heavy oils. This phenomenon can promote the recovery efficiency. In this
present study, steam temperature is changed from 150 C to 250 C, because the maximum
temperature of steam is around 250 C in field applications [15].
Over steam flooding, steam temperature does not only affect steam distillation through the
vaporization of light components of heavy crude oil, but also through steam-oil interaction
[22]. Thus, physical properties of remaining oil after steam distillation can be used to quantify the effectiveness of steam distillation at different conditions.
6.2.1.1 Changes in Density of Oil Samples with Steam Temperature
There are 16 experiments that can be used to quantify the effect of steam temperature on
the density change of remaining oil during steam distillation. Figure 6.1 and 6.2 show the change in remaining oil after steam distillation of Camurlu and Bati Raman crude oils with
addition of reservoir rock only (no additional mineral). In these figures there are two
reference values, one of them is the density of Camurlu and Bati Raman crude oils as they received (without any treatment) (black bars in Figure 6.1 and Figure 6.2) and the other
reference is the density of remaining oil after steam distillation process in which there was no any addition except for water (only crude oil and water) (purple bars in Figure 6.1 and
Figure 6.2).
It is clearly seen from Figure 6.1 and 6.2 that the highest change in density of remaining oil
occurred in steam distillation experiments where no reservoir rock was used. This means that existence of reservoir rock hinders the distillation effect of steam. This observation
shows the importance of studying the effect of reservoir rock and its lithology on steam distillation process. On the other hand, there exists considerable increase in the density of
remaining oil at 200 C compared to original sample density. Although the density of
remaining crude oil increased at 150 C compared to original sample, the highest change
took place at the temperature interval of 150 to 200 C. This observation is valid for both
crude oil type and reservoir rock combinations. The reason of this observation could be the
abundance of distillable components which may be saturates and aromatics at this temperature interval.

50
Figure 6.1 Density of remaining oils at different temperatures for Camurlu
Figure 6.2 Density of remaining oils at different temperatures for Bati Raman

51
6.2.1.2 Changes in Viscosity of Oil Samples with Steam Temperature
Viscosity is the other physical parameter that can be affected by the amount of vaporization
of light constituents of heavy oils. Figure 6.3 and Figure 6.4 indicate the viscosity alteration of remaining oils of steam distillation at three different steam distillation temperatures and
two reservoir rock types. Similar to density, the highest change in viscosity for both crude
oils took place for the experiments with no reservoir rock. On the other hand, the viscosity
measurement of two oils after treatment at 150 C for both crude oils with sandstone
reservoir rock unexpectedly resulted with lower viscosity than the original crude oil. The
reason for this event is not known.
Unlike density, the higher the steam temperature resulted with higher viscosity of remaining
oil which can be interpreted as the increase in steam distillation quantity with temperature. This observation led us to continue the further study with highest temperature that was
tested, 250 C. One more outcome of this analysis is to decide to carry out other
experiments mainly with limestone rock at 250 C since steam treatment within limestone
rock resulted with higher density and higher viscosity of remaining crude oil compared to
sandstone rock (Figures 6.5 and 6.6). This actually fits with the fact that majority of heavy oil reservoirs in the Middle East lie in limestone (carbonate) reservoir rocks.
Figure 6.3 Viscosity of remaining oils at different temperatures for Camurlu
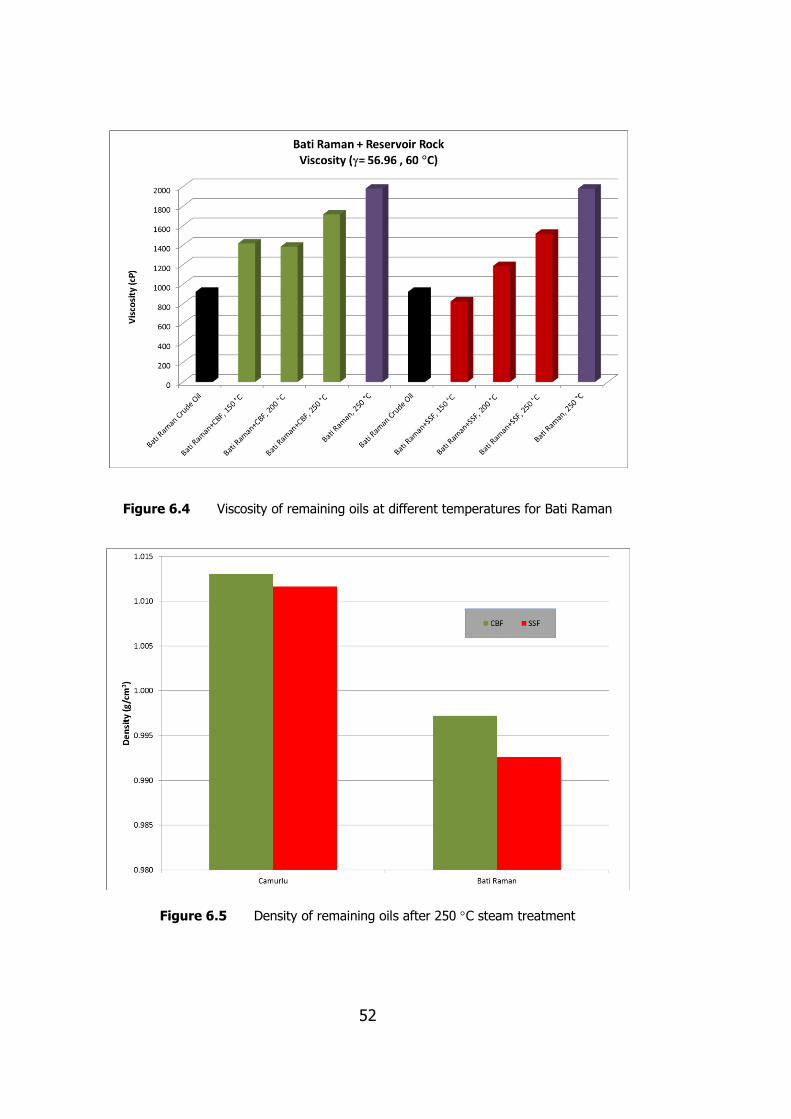
52
Figure 6.4 Viscosity of remaining oils at different temperatures for Bati Raman
Figure 6.5 Density of remaining oils after 250 C steam treatment
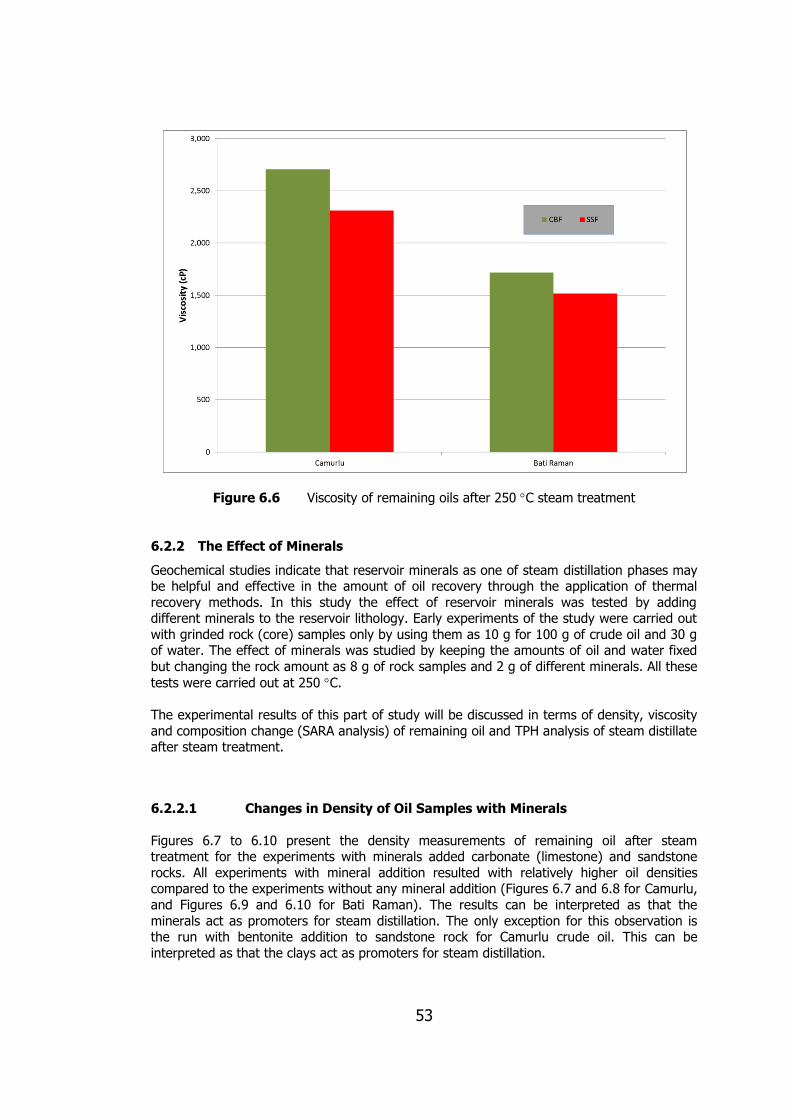
53
Figure 6.6 Viscosity of remaining oils after 250 C steam treatment
6.2.2 The Effect of Minerals
Geochemical studies indicate that reservoir minerals as one of steam distillation phases may be helpful and effective in the amount of oil recovery through the application of thermal
recovery methods. In this study the effect of reservoir minerals was tested by adding different minerals to the reservoir lithology. Early experiments of the study were carried out
with grinded rock (core) samples only by using them as 10 g for 100 g of crude oil and 30 g of water. The effect of minerals was studied by keeping the amounts of oil and water fixed
but changing the rock amount as 8 g of rock samples and 2 g of different minerals. All these
tests were carried out at 250 C.
The experimental results of this part of study will be discussed in terms of density, viscosity
and composition change (SARA analysis) of remaining oil and TPH analysis of steam distillate after steam treatment.
6.2.2.1 Changes in Density of Oil Samples with Minerals
Figures 6.7 to 6.10 present the density measurements of remaining oil after steam treatment for the experiments with minerals added carbonate (limestone) and sandstone
rocks. All experiments with mineral addition resulted with relatively higher oil densities compared to the experiments without any mineral addition (Figures 6.7 and 6.8 for Camurlu,
and Figures 6.9 and 6.10 for Bati Raman). The results can be interpreted as that the
minerals act as promoters for steam distillation. The only exception for this observation is the run with bentonite addition to sandstone rock for Camurlu crude oil. This can be
interpreted as that the clays act as promoters for steam distillation.

54
On the other hand, addition of kaolinite as clay mineral resulted with the highest difference
of density for all combinations making it as a good candidate for the promotion of steam distillation. Interpretation of other parameters should support this observation for solid
conclusion.
Figure 6.7 Density of remaining Camurlu oil with carbonate + different minerals
Figure 6.8 Density of remaining Bati Raman oil with carbonate + different minerals
0.990
0.995
1.000
1.005
1.010
1.015
1.020
1.025
1.030
1.035
De
nsi
ty (g
/cm
3 )
Camurlu + Carbonate + ClayDensity at 15 C
0.975
0.980
0.985
0.990
0.995
1.000
1.005
De
nsi
ty (g
/cm
3)
Bati Raman + Carbonate + ClayDensity at 15 C

55
Figure 6.9 Density of remaining Camurlu oil with sandstone + different minerals
Figure 6.10 Density of remaining Bati Raman oil with sandstone + different minerals

56
6.2.2.2 Changes in Viscosity of Oil Samples with Minerals
Viscosity changes (Figure 6.11 to Figure 6.14) do not follow a regular trend. Nevertheless,
kaolinite still causes the highest change in viscosity (except for Camurlu with sandstone reservoir rock).
Limestone having Camurlu viscosity change with addition of minerals is not so significant, however, changes with Zeolite and kaolinite still higher than other (Figure 6.11).
Figure 6.11 Viscosity of remaining Camurlu oil with carbonate + different clay
minerals
In the case of Bati Raman oil having limestone rock increase in viscosity is observed with bentonite, zeolite and kaolinite additions whereas presence of illite and sepiolite cause
lowering in viscosity. This might be related with relative position of particles in system which prevents oil to vaporize (Figure 6.12).

57
Figure 6.12 Viscosity of remaining Bati Raman oil with carbonate + different clay minerals
In case of sandstone having Camurlu oil viscosity changes with minerals addition is not significant again, although viscosity values with zeolite, illite, and sepiolite greater than those
bentonite and kaolinite (Figure 6.13).
Figure 6.13 Viscosity of remaining Camurlu oil with sandstone + different clay minerals

58
In case of sandstone having Bati Raman oil viscosity changes with minerals addition is
significant, although bentonite addition decreases viscosity again, as mentioned above (Figure 6.14).
Figure 6.14 Viscosity of remaining Bati Raman oil with sandstone + different clay
minerals
6.2.2.3 The effect of minerals on composition of remaining oil samples
Composition of oil samples have been determined by SARA analysis (analysis for saturate, aromatic, resin, and asphaltene components). Results of SARA analysis are presented in
Figures 6.15 to 6.22.
It is expected that the heaviest components of crude oil (asphaltene) is concentrated as the
result of steam distillation. On the other hand, the amount of polar compounds (resin) of crude oil (hetero atoms such as sulphur, oxygen, nitrogen containing components) could be
less in remaining oils after steam distillation [32].
SARA analyses results of Camurlu and Bati Raman oils with respect to saturate component
are different (Figures 6.15 and 6.16). The amount of saturate fractions of Camurlu crude oil and Camurlu remaining oil after distillation in absence of any addition are the same.

59
Figure 6.15 SARA analysis of Camurlu tests (Saturate)
SARA analysis results of Bati Raman crude oil and Bati Raman remaining oil after distillation
at 250 C indicate that the percentage of saturate components increases after steam
distillation. The addition of limestone rock also gives higher saturate components than the original one. This trend is also valid for addition of zeolite and kaolinite in limestone having
oil. This may be due to conversion of some heavier components to saturate fractions by means of catalytic effect of limestone and minerals. This may be explained as follow, during
steam injection some other components of oil are converted into saturate form, but those
are not able to vaporize under these circumstances. This may be because of the existence of higher molecular weight components and hydrogen bonds occurred between molecules
(Figure 6.16).

60
Figure 6.16 SARA analysis of Bati Raman tests (Saturate)
In the case of aromatic components, there is no general trend to be discussed as the effect
of steam distillation and mineral addition (Figure 6.17 and 6.18). In some cases, the aromatic content of the crude oil increased with respect to original crude oil but in other
cases decreased and the cases are not the same for Camurlu and Bati Raman crude oil samples. This is attributed to the different chemical compositions of crude oils which were
affected differently by steam distillation with mineral addition. Further studies should be
carried out to analyze the cause of these different responses to steam distillation.
Figure 6.17 SARA analysis of Camurlu tests (Aromatic)

61
Figure 6.18 SARA analysis of Bati Raman tests (Aromatic)
As was expected polar components (resin) in remaining Camurlu and Bati Raman oils are
less than original samples during steam treatment at 250 C. In reservoir conditions the
presence of limestone with zeolite and kaolinite additions promotes the vaporization of polar components (Figures 6.19 and 6.20).
Figure 6.19 SARA analysis of Camurlu tests (Polar)

62
Figure 6.20 SARA analysis of Bati Raman tests (Polar)
Change in asphaltene content due to steam distillation and mineral addition is the most
obvious observation in terms of compositional analysis. In all experiments the asphaltene content of remaining oil after steam distillation is higher compared to original crude oil
samples for both Camurlu and Bati Raman. Among the different minerals Zeolite and Kaolinite addition resulted with the highest change for Camurlu and Kaolinite showed the
highest change for Bati Raman (from 24.56% to 32.11%) (Figures 6.21 and 6.22).
Figure 6.21 SARA analysis of Camurlu tests (Asphaltene)

63
Figure 6.22 SARA analysis of Bati Raman tests (Asphaltene)
6.2.2.4 TPH Analysis of Distillates
Results from density, viscosity and SARA analysis encouraged to carry out composition analysis of steam distillate from kaolinite added tests. That is why the following sub-chapter
will discuss the TPH (total petroleum hydrocarbon) analysis of eight samples (2 crude oils, 2
distillates from crude oil treated with steam at 250 C and 4 distillates from kaolinite added
tests).
In order to determine the amount of saturate hydrocarbons in distillates as a function of carbon number of molecules Total Petroleum Hydrocarbon (TPH) analysis of samples has
been done. The results are given in Figures 6.23 and 6.24. Although the TPH analyzer of
Petroleum Research Center of METU is capable of analyzing between C8 to C35, two runs with crude oil and steam only did not report the components heavier than C23, therefore the
analysis were limited by C23.
In case of Camurlu distillate at 250 C the highest amount of saturate having carbon number
10 to 13 (8300- 5900 mg/l) is observed. The amount of saturates decreases with increasing
carbon number. For example, the molecules having C22 and C23 have concentrations of 100 mg/l and 65 mg/l respectively.
In case of limestone and Kaolinite having Camurlu distillate at 250 C the highest amount of
saturate having carbon number 10 to 13 is observed (4800- 2700 mg/l). The amount of
saturates decreases with increasing carbon number. For example, the molecule having C23 is
about 30 mg/l. The similar trend can be seen in case of sandstone and kaolinite having Camurlu.

64
Figure 6.23a TPH Analysis for Camurlu oil distillates
Figure 6.23b TPH Analysis for Camurlu oil distillates (Cont.)
In case of Bati Raman distillate at 250 C the highest amount of saturate having carbon
number 10 to 13 can be seen (6200- 3100 mg/l). The amount of saturates decreases with
increasing carbon number. For example, the molecule having C23 has concentrations of 50
mg/l.
In case of limestone and Kaolinite having Bati Raman distillate at 250 C the highest amount
of saturate having carbon number 10 to 11 is observed (4200- 3500 mg/l). The amount of

65
saturates decreases with increasing carbon number. For example, the molecule having C23 is
about 50 mg/l.
Distillate of Bati Raman having sandstone and kaolinite shows similar variation with increasing carbon number as observed in limestone and kaolinite having Bati Raman oil.
However, the values corresponding to highest amount are different (5900- 6500). The
lowest value was observed with molecule having C23 which has concentration of approximately 50 mg/l.
Figure 6.24a TPH Analysis for Bati Raman distillates

66
Figure 6.24b TPH Analysis for Bati Raman distillates (Cont.)
To compare the composition of distillates by original crude oil the TPH analysis of Bati Raman and Camurlu crude oils were also done and the results are presented in Figure 6.25.
As it is seen from Figure 6.25 that the concentration of saturated hydrocarbons in original
crude oils is in the order of tens mg/l (5 to 25 mg/l range) while the concentration of the
same components in the distillate is in the order of hundreds to thousands mg /l. This clearly indicates that steam distillation removes the lighter components of the crude oil causing
heavier and most probably viscous oil as remaining.
Other outcome from TPH analysis of original crude oils is that Bati Raman has relatively
higher concentration of lighter components compared to Camurlu. That is why Camurlu is denser and viscous crude oil compared to Bati Raman (Figure 6.25).

67
Figure 6.25 TPH Analysis of Camurlu and Bati Raman crude oils

68

69
CHAPTER 7
CONCLUSIONS
In this experimental study, the effect of steam on reactivity of reservoir clay and non-clay minerals in catalyzing steam-oil chemical interactions for generation of steam distillation was
investigated. These experiments were carried out for thermal recovery of Camurlu and Bati Raman heavy crude oils through generation of in situ steam in a batch autoclave reactor.
The following conclusions were withdrawn from the analysis of the experimental study on the effect of different minerals during steam distillation process:
- Higher steam temperature resulted with the highest steam distillate from heavy
crude oils, and higher viscosity and density of remaining oil after steam distillation,
as expected.
- Steam distillation results with a distillate having higher concentrations of lighter components which can be considered as solvent or condensate bank of a steam
flooding application.
- Mineral content of reservoir rocks plays an important role in thermal recovery
process of heavy crude oils through catalyzing oil-steam interactions. Among the five
different minerals tested, kaolinite found to be the most effective mineral in terms of
steam distillation.
- The effect of steam distillation is more pronounced in limestone reservoirs compared
to sandstone ones for the given heavy crude oil and steam temperature due to the
existing Kaolinite in limestone core sample.

70

71
REFERENCES
[1] J. W. Buza, "An Overview of Heavy and Extra Heavy Oil Carbonate Reservoir in
the Middle East," in International Petroleum Technology Conference, Kuala
Lumpur, Malaysia, 2008.
[2] "Turkish Energy Industry Report", Republic of Turkey Prime Ministry, August,
2010.
[3] J. G. Speight, "Enhanced Recovery Methods for Heavy Oil and Tar Sands",
Houston, Tx, U.S.: TIPS Technical Publishing, Inc., 2009.
[4] C. H. Wu and A. Brown, "A Laboratory Study on Steam Distillation in Porous
Media," in 50th Annual Fall Meeting of the Society of Petroleum Engineering of
AIME, Dallas, Texas, 1975.
[5] H. Alboudwarej, J. Felix, S. Taylor and e. al., "Highlight Heavy Oil," Oilfield
Review, 2006.
[6] Report by UTAH Heavy Oil Program, "A Thechnical, Economic, and Legal
Assessment of North American Heavy Oil, Oil Sands, and Oil shale Resources,"
The unversity of UTAH, 2007.
[7] B. Hascakir, "Investigation of productivity of Heavy Oil Carbonate Reservoirs
and Oil Shales Using Electrical Heating Methods", Middle East Technical
University, Ankara, Turkey: Ph.D Thesis, 2008.
[8] H. V. Martín F. Cevallos, "Geochemical Characterization of Heavy Oil
Accumulations on the Northeastern Margin of the Neuquén Basin, Argentina,"
Frontiers + Innovation – CSPG CSEG CWLS Convention, Calgary, Canada,
2009.
[9] F. K. NORTH, "Petroleum Geology", Winchester, MA.: Allen & Unwin, Inc., pp.
607, 1985.
[10] M. J. R. DOTT, "Source Book for Petroleum Geology", Am. Assoc. Petrol.
Geol., Mem. No. 5, pp. 471 , 1969.
[11] A. J. BATES, "Glossary of Geology", American Geological Institute, Falls
Church, VA., 2nd Ed., 749 pp. , 1980.
[12] "TOPIC PAPER #22, Heavy Oil", Working Document of the NPC Global Oil &
Gas Study, The National Petroleum Council (NPC), 2007.
[13] D. N. Dietz, "Review of Thermal Recovery Methods", in 50th Annual Fall
Meeting of the Society of Petroleum Engineers of AIME, Dallas, Texas, 1975.
[14] L.I.B. Gonçalves et al., "Heavy Oil Recovery by Steam Injection – Numerical
Simulation on Production Strategy," in 20th International Congress of
Mechanical Engineering, Gramado, RS, Brazil, 2009.
[15] S. J. P. Oskouei,"Post SAGD In-Situ Combustion Hybrid Recovery Method for
Oil-Sands Reservoirs", University of Calgary, Calgary, Canada: Ph.D Thesis,

72
2011.
[16] C. H. Wu, "A Critical Review of Steamflood Mechanisms," in 47th Annual
California Regional Meeting of the Society of Petroleum Engineers of AIME,
Bakersfield, California, 1977.
[17] F. S. Johnson, C. J. Walker and A. F. Bayazeed, "Oil Vaporization During
Steamflooding," JOURNAL OF PETROLEUM TECHNOLOGY, Vols. SPE-
2977, pp. 731-742, 1971.
[18] A. Farouq and J. M. S., "Practical Considerations in steamflooding",
Procedures Monthly, pp. 13-16, Januarry 1968.
[19] "http://chemistry.about.com/od/chemistryglossary/g/Steam-Distillation
Definition.htm, Last visited on 23 December,2012".
[20] M. T. Vafaei, R. Eslamloueyan, L. Enfeali and S. Ayatollahi, "Analysis and
Simulation of Steam Distillation Mechanism during the Steam Injection
Process," Energy & Fuels, vol. 23, p. 327–333, 2009.
[21] C. H. Wu and R. B. Elder, "Correlation of Crude Oil Steam Distillation Yields
With Basic Crude Oil Properties," SOCIETY OF PETROLEUM ENGINEERS
JOURNAL, pp. 937-945, 1983.
[22] K. T. Lim, H. J. Ramey and W. E. Brigham, "Steam Distillation and Oil Quality
Change During Thermal Oil Recovery," in The Second Latin American
Petroleum Engineering Conference, II LAPEC, of the Society of Petroleum
Engineers, Caracas, Venezuela,, 1992.
[23] J. H. Duerksen and L. Hsueh, "Steam Distillation of Crude Oils," SOCIETY OF
PETROLEUM ENGINEERS JOURNAL, pp. 265-271, 1983.
[24] J. A. Langhoff and C. H. Wu, "Calculation of High-Temperature Crude-
Oil/Water/Vapor Separations Using Simulated Distillation Data," in SPE
Annual Technical Conference & Exhibition, Houston,U.S, 1986.
[25] W. C. Richardson, M. K. Beladi and C. H. Wu, "Steam Distillation Studies for
the Kern River Field," SPE Reservoir Eval. & Eng., vol. 3 (1), No. 1094-, pp.
13-22, 2000.
[26] J. C. Monln and A. Audlbert, "Thermal Cracking of Heavy-Oil/ Mineral Matrix
Systems," in SPE IntI. Symposium on Oilfield Chemistry, San Antonio,, 1988.
[27] D. C. Keith, W. J. Harrison and R. F. Wendlandt, "Mineralogical responses of
siliciclastic carbonate-cemented reservoirs to steam flood enhanced oil
recovery," Applied Geochemistry, Vols. Vol. 13, No. 4,pp. 491-507, 1998.
[28] S. K. Maity, J. Ancheyta and G. Marroquı´n, "Catalytic Aquathermolysis Used
for Viscosity Reduction of Heavy Crude Oils: A Review," Energy& Fuels, vol.
24,pp. 2809-2816, 2010.
[29] Y. Zhang,Y. Lin, H. Fan, "The catalytic effects of minerals on aquathermolysis
of heavy oils," Fuel, vol. 83, pp. 2036-2039, 2004.
[30] H. FAN, "The Effects of Reservoir Minerals on the Composition Changes of
Heavy Oil During Steam Stimulation," Journal of Canadian Petroleum
Technology, Vols. 42, No. 3, pp. 11-14, 2003.
73
[31] Y.J. Liu,L.G. Zhong, H. F. Fan, "Studies on the Synergetic Effects of Mineral
and Steam on the Composition Changes of Heavy Oils," Energy & Fuels, vol.
15, pp. 1475-1479, 2001.
[32] J. G. Speight, "The Chemistry and Technology of Petroleum", Newyork: Marcel
DekkerInc., 1991.
[33] C. Pierre, L. Barré, A. Pina and M. Moan, "Composition and Heavy Oil
Rheology," Oil&gas Science and Technology, Vols. 59, No. 5, pp. 489-501,
2004.
[34] B. R. Munson, D. F. Young and T. H. Oskiishi, "Fundamentals of Fluid
Mechanics", Newyork: Wiely, 1998.
[35] "http://www.rheologyschool.com, Last visted on 12 December,2012".
[36] K. Sangho, "A Study of Non-Newtonian Viscosityand Yield Stress of Blood in
a Scanning Capillary-Tube Rheometer", Philadelphia: Ph.D Thesis, 2002.
[37] S. Middleman, "The Flow of High polymers, Newyork": Interscience, 1968.

74

75
APPENDIX A
RHEOLOGICAL MEASUREMENTS OF OIL SAMPLES
As heavy oils are categorized into non-Newtonian fluids, they are characterized by
rheological measurement. Generally, rheology is used for identification of non- Newtonian
fluids. In these kinds of fluids, shear flows are practically easier to study.
Basically, viscosity of non-Newtonian fluids is dependent on shear rate (relative velocity of flow), that is, there are various viscosities in different shear rate. Thus, comparison of
rheological properties of different oil samples is done in the same shear rate.
In current experimental study, rheological measurements were carried out by Haake
Rotoviscometer RV20. The given calculation factors such M, shear rate factor, and A, shear
stress factor, for each sensor system in viscometer manual as well as %ϒ , displayed shear
rate, and % τ, displayed shear stress, read from viscometer, are used in calculation of shear
rate and shear stress. At the next stage, the viscosity values of oil samples are calculated for
rheological studies at the same shear rate from following correlations:
ϒ= M×%ϒ (1/s) (A-1)
τ = A×% τ (Pa) (A-2)
η=
(Pa.s) (A-3)
η=
× 1000 (mPa.s) or (cP) (A-4)
Rheological measurements of Camurlu and Bati Raman oil samples in different
circumstances of experiments are given in following rheograms. Both oil samples exhibit shear thinning behavior. As can clearly be seen in following rheograms, oil samples behave
as semi-Newtonian fluid at shear rate 56.96 (1/s) and 60 C, so oil samples viscosity were
calculated at this boundary to compare and study.

76
Figure A.1 Camurlu crude oil
Figure A.2 Camurlu, 250 C
0
100
200
300
400
500
600
700
800
900
0 100 200 300 400 500
She
ar S
tre
ss, τ
(P
a)
Shear Rate, ϒ (1/s)
T= 40 0C
T= 50 0C
T= 60 0C

77
Figure A.3 Camurlu+10% CBF, 150 ⁰C
Figure A.4 Camurlu+10% SSF, 150 ⁰C
0
200
400
600
800
1000
1200
0 100 200 300 400 500
She
ar S
tre
ss, τ
(P
a)
Shear Rate, ϒ (1/s)
T= 40 0C
T=50 0C
T=60 0C
0
100
200
300
400
500
600
0 100 200 300 400 500
She
ar S
tre
ss, τ
(P
a)
Shear Rate, ϒ (1/s)
T=40 0C
T= 50 0C
T=60 0C

78
Figure A.5 Camurlu+10% CBF, 200 ⁰C
Figure A.6 Camurlu+10% SSF, 200 ⁰C
0
100
200
300
400
500
600
700
800
900
0 200 400 600
Shea
r S
tres
s, τ
(P
a)
Shear Rate,ϒ (1/s)
T=40 0C
T= 50 0C
T= 60 0C
0
100
200
300
400
500
600
700
800
900
1000
0 100 200 300 400 500
Shea
r S
tres
s, τ
(P
a)
Shear Rate, ϒ (1/s)
T=40 0C
T=50 0C
T=60 0C

79
Figure A.7 Camurlu+10% CBF, 250 ⁰C
Figure A.8 Camurlu+10% SSF, 250 ⁰C
0
200
400
600
800
1000
1200
0 200 400 600
Shea
r S
tres
s, τ
(P
a)
Shear Rate, ϒ (1/s)
T=40 0C
T=50 0C
T= 60 0C
0
200
400
600
800
1000
1200
0 100 200 300 400 500
Shea
r S
tres
s, τ
(P
a)
Shear Rate, ϒ (1/s)
T= 40 0C
T= 50 0C
T= 60 0C

80
Figure A.9 Camurlu+8% CBF+2% BNT, 250 ⁰C
Figure A.10 Camurlu+8% SSF+2% BNT, 250 ⁰C
0
200
400
600
800
1000
1200
0 100 200 300 400 500
Shea
r S
tres
s, τ
(P
a)
Shear Rate, ϒ (1/s)
T=40 0C
T=50 0C
T=60 0C
0
100
200
300
400
500
600
700
800
900
1000
0 100 200 300 400 500
Shea
r S
tres
s, τ
(P
a)
Shear Rate, ϒ (1/s)
T=40 0C
T=50 0C
T=60 0C

81
Figure A.11 Camurlu+8% CBF+2% ZOL, 250 ⁰C
Figure A.12 Camurlu+8% SSF+2% ZOL, 250 ⁰C
0
200
400
600
800
1000
1200
0 100 200 300 400 500
Shea
r S
tres
s, τ
(P
a)
Shear Rate, ϒ (1/s)
T=40 0C
T=50 0C
T=60 0C
0
200
400
600
800
1000
1200
0 100 200 300 400 500
Shea
r S
tres
s, τ
(P
a)
Shear Rate, ϒ (1/s)
T=40 0C
T=50 0C
T=60 0C
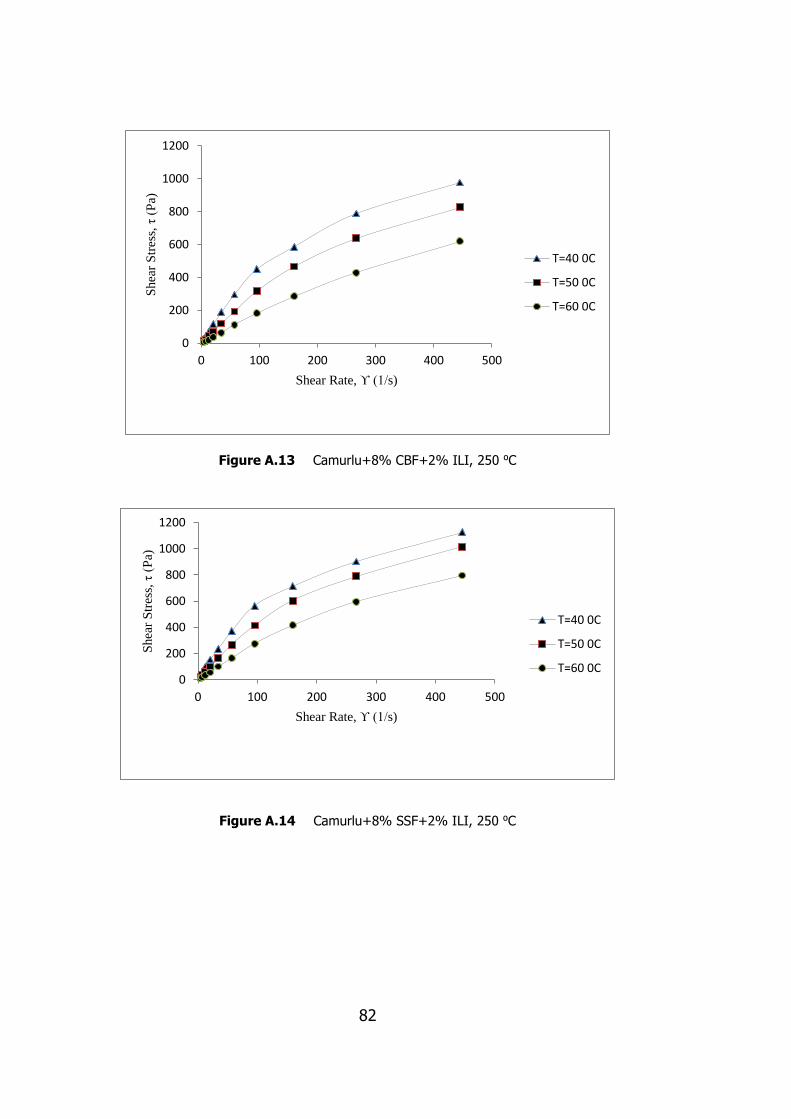
82
Figure A.13 Camurlu+8% CBF+2% ILI, 250 ⁰C
Figure A.14 Camurlu+8% SSF+2% ILI, 250 ⁰C
0
200
400
600
800
1000
1200
0 100 200 300 400 500
Shea
r S
tres
s, τ
(P
a)
Shear Rate, ϒ (1/s)
T=40 0C
T=50 0C
T=60 0C
0
200
400
600
800
1000
1200
0 100 200 300 400 500
Shea
r S
tres
s, τ
(P
a)
Shear Rate, ϒ (1/s)
T=40 0C
T=50 0C
T=60 0C

83
Figure A.15 Camurlu+8% CBF+2% SPT, 250 ⁰C
Figure A.16 Camurlu+8% SSF+2% SPT, 250 ⁰C
0
200
400
600
800
1000
1200
0 100 200 300 400 500
Shea
r S
tres
s, τ
(P
a)
Shear Rate, ϒ (1/s)
T=40 0C
T=50 0C
T=60 0C
0
200
400
600
800
1000
1200
0 100 200 300 400 500
Shea
r S
tres
s, τ
(P
a)
Shear Rate, ϒ (1/s)
T=40 0C
T=50 0C
T=60 0C

84
Figure A.17 Camurlu+8% CBF+2% KOL, 250 ⁰C
Figure A.18 Camurlu+8% SSF+2% KOL, 250 ⁰C
0
200
400
600
800
1000
1200
0 100 200 300 400 500
Shea
r S
tres
s, τ
(P
a)
Shear Rate, ϒ (1/s)
T=40 0C
T=50 0C
T=60 0C
0
200
400
600
800
1000
1200
0 100 200 300 400 500
Shea
r S
tres
s, τ
(P
a)
Shear Rate, ϒ (1/s)
T=40 0C
T=50 0C
T=60 0C

85
Figure A.19 Bati Raman crude oil
Figure A.20 Bati Raman, 250 ⁰C
0
100
200
300
400
500
600
700
0 100 200 300 400 500
Shea
r S
tres
s, τ
(P
a)
Shear Rate, ϒ (1/s)
T= 40 0C
T= 50 0C
T= 60 0C
0 100 200 300 400 500 600 700 800 900
1000
0 100 200 300 400 500
Shea
r S
tres
s, τ
(P
a)
Shear Rate, ϒ (1/s)
T=40 0C
T=50 0C
T=60 0C

86
Figure A.21 Bati Raman+10% CBF, 150 ⁰C
Figure A.22 Bati Raman+10% SSF, 150 ⁰C
0
100
200
300
400
500
600
700
800
900
0 100 200 300 400 500
Shea
r S
tres
s, τ
(P
a)
Shear Rate, ϒ (1/s)
T=40 0C
T=50 0C
T=60 0C
0
100
200
300
400
500
600
700
0 100 200 300 400 500
Shea
r S
tres
s, τ
(P
a)
Shear Rate, ϒ (1/s)
T=40 0C
T=50 0C
T=60 0C

87
Figure A.23 Bati Raman+10% CBF, 200 ⁰C
Figure A.24 Bati Raman+10% SSF, 200 ⁰C
0
100
200
300
400
500
600
700
800
900
0 100 200 300 400 500
Shea
r S
tres
s, τ
(P
a)
Shear Rate, ϒ (1/s)
T=40 0C
T= 50 0C
T= 60 0C
0
100
200
300
400
500
600
700
800
900
0 100 200 300 400 500
Shea
r S
tres
s, τ
(P
a)
Shear Rate, ϒ (1/s)
T=40 0C
T= 50 0C
T= 60 0C
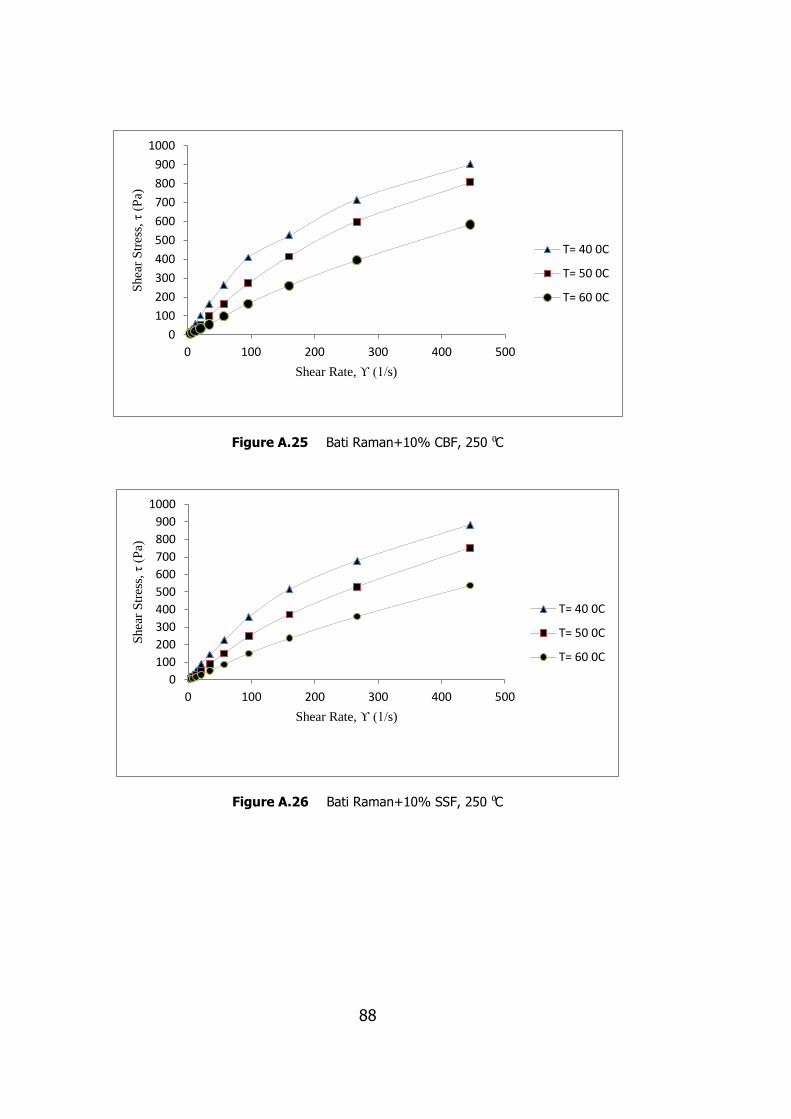
88
Figure A.25 Bati Raman+10% CBF, 250 ⁰C
Figure A.26 Bati Raman+10% SSF, 250 ⁰C
0
100
200
300
400
500
600
700
800
900
1000
0 100 200 300 400 500
Shea
r S
tres
s, τ
(P
a)
Shear Rate, ϒ (1/s)
T= 40 0C
T= 50 0C
T= 60 0C
0
100
200
300
400
500
600
700
800
900
1000
0 100 200 300 400 500
Shea
r S
tres
s, τ
(P
a)
Shear Rate, ϒ (1/s)
T= 40 0C
T= 50 0C
T= 60 0C

89
Figure A.27 Bati Raman+8% CBF+2% BNT, 250 ⁰C
Figure A.28 Bati Raman+8% SSF+2% BNT, 250 ⁰C
0
200
400
600
800
1000
1200
0 100 200 300 400 500
Shea
r S
tres
s, τ
(P
a)
Shear Rate, ϒ (1/s)
T=40 0C
T=50 0C
T=60 0C
0
100
200
300
400
500
600
700
800
900
0 100 200 300 400 500
Shea
r S
tres
s, τ
(P
a)
Shear Rate, ϒ (1/s)
T=40 0C
T=50 0C
T=60 0C

90
Figure A.29 Bati Raman+8% CBF+2% ZOL, 250 ⁰C
Figure A.30 Bati Raman+8% SSF+2% ZOL, 250 ⁰C
0
100
200
300
400
500
600
700
800
900
1000
0 100 200 300 400 500
Shea
r S
tres
s, τ
(P
a)
Shear Rate, ϒ (1/s)
T=40 0C
T=50 0C
T=60 0C
0
100
200
300
400
500
600
700
800
900
1000
0 100 200 300 400 500
Shea
r S
tres
s, τ
(P
a)
Shear Rate, ϒ (1/s)
T=40 0C
T=50 0C
T=60 0C

91
Figure A.31 Bati Raman+8% CBF+2% ILI, 250 ⁰C
Figure A.32 Bati Raman+8% SSF+2% ILI, 250 ⁰C
0
100
200
300
400
500
600
700
800
900
1000
0 100 200 300 400 500
Shea
r S
tres
s, τ
(P
a)
Shear Rate, ϒ (1/s)
T=40 0C
T=50 0C
T=60 0C
0
200
400
600
800
1000
1200
0 100 200 300 400 500
Shea
r S
tres
s, τ
(P
a)
Shear Rate, ϒ (1/s)
T=40 0C
T=50 0C
T=60 0C

92
Figure A.33 Bati Raman+8% CBF+2% SPT, 250 ⁰C
Figure A.34 Bati Raman+8% SSF+2% SPT, 250 ⁰C
0
100
200
300
400
500
600
700
800
900
0 100 200 300 400 500
Shea
r S
tres
s, τ
(P
a)
Shear Rate, ϒ (1/s)
T=40 0C
T=50 0C
T=60 0C
0
100
200
300
400
500
600
700
800
900
1000
0 100 200 300 400 500
Shea
r S
tres
s, τ
(P
a)
Shear Rate, ϒ (1/s)
T=40 0C
T=50 0C
T=60 0C

93
Figure A.35 Bati Raman+8% CBF+2% KOL, 250 ⁰C
Figure A.36 Bati Raman+8% SSF+2% KOL, 250 ⁰C
0
200
400
600
800
1000
1200
0 100 200 300 400 500
Shea
r S
tres
s, τ
(P
a)
Shear Rate, ϒ (1/s)
T=40 0C
T=50 0C
T=60 0C
0
200
400
600
800
1000
1200
0 100 200 300 400 500
Shea
r S
tres
s, τ
(P
a)
Shear Rate, ϒ (1/s)
T=40 0C
T=50 0C
T=60 0C

94

95
APPENDIX B
RAW DATA OF DENSITY AND VISCOSITY MEASUREMENTS
Table B.1 Density of Camurlu oil samples
SAMPLE Density at 15 C (g/cm3)
Camurlu Crude Oil 1.00615
Camurlu+10% CBF, 150 C 1.00690
Camurlu+10% SSF, 150 C 1.00750
Camurlu+10% CBF, 200 C 1.01300
Camurlu+10% SSF, 200 C 1.01370
Camurlu+10% CBF, 250 C 1.01305
Camurlu+10% SSF, 250 C 1.01165
Camurlu, 250 C 1.03200
Camurlu+ 8% CBF+2% BNT , 250 C 1.01290
Camurlu+ 8% SSF+2% BNT , 250 C 1.00665
Camurlu+ 8% CBF+2% ZOL , 250 C 1.01455
Camurlu+ 8% SSF+2% ZOL , 250 C 1.01695
Camurlu+ 8% CBF+2% ILI , 250 C 1.01250
Camurlu+ 8% SSF+2% ILI , 250 C 1.01810
Camurlu+ 8% CBF+2% SPT , 250 C 1.01670
Camurlu+ 8% SSF+2% SPT , 250 C 1.01745
Camurlu+ 8% CBF+2% KOL ,250 C 1.02050
Camurlu+ 8% SSF+2% KOL , 250 C 1.01880

96
Table B.2 Density of Bati Raman oil samples
SAMPLE Density at 15 C (g/cm3)
Bati Raman Crude Oil 0.98635
Bati Raman+10% CBF, 150 C 0.98690
Bati Raman+10% SSF, 150 C 0.98900
Bati Raman+10% CBF,200 C 0.99755
Bati Raman+10% SSF, 200 C 0.99470
Bati Raman+10% CBF, 250 C 0.99720
Bati Raman+10% SSF, 250 C 0.99260
Bati Raman, 250 C 1.00245
Bati Raman+8% CBF+2% BNT , 250 C 0.99760
Bati Raman+8% SSF+2% BNT , 250 C 1.00095
Bati Raman+8% CBF+2% ZOL , 250 C 1.00025
Bati Raman+8% SSF+2% ZOL , 250 C 0.99950
Bati Raman+8% CBF+2% ILI , 250 C 0.99790
Bati Raman+8% SSF+2% ILI , 250 C 0.99525
Bati Raman+8% CBF+2%SPT , 250 C 0.99950
Bati Raman+8% SSF+2% SPT , 250 C 0.99500
Bati Raman+8% CBF+2% KOL , 250 C 1.00450
Bati Raman+8% SSF+2% KOL , 250 C 1.00170

97
Table B.3 Viscosity of Camurlu oil samples
SAMPLE Viscosity (cP) @(ϒ=56.96, 60 C)
Camurlu Crude Oil 1134.40
Camurlu+10% CBF, 150 C 2079.35
Camurlu+10% SSF, 150 C 858.15
Camurlu+10% CBF, 200 C 1782.30
Camurlu+10% SSF, 200 C 2508.43
Camurlu+10% CBF, 250 C 2706.46
Camurlu+10% SSF, 250 C 2310.39
Camurlu, 250 C 5148.88
Camurlu+ 8% CBF+2% BNT , 250 C 2574.44
Camurlu+ 8% SSF+2% BNT , 250 C 1716.29
Camurlu+ 8% CBF+2% ZOL , 250 C 2739.47
Camurlu+ 8% SSF+2% ZOL , 250 C 2838.48
Camurlu+ 8% CBF+2% ILI , 250 C 1947.33
Camurlu+ 8% SSF+2% ILI , 250 C 2904.49
Camurlu+ 8% CBF+2% SPT , 250 C 2343.40
Camurlu+ 8% SSF+2% SPT , 250 C 2739.47
Camurlu+ 8% CBF+2% KOL ,250 C 2772.47
Camurlu+ 8% SSF+2% KOL , 250 C 1980.34
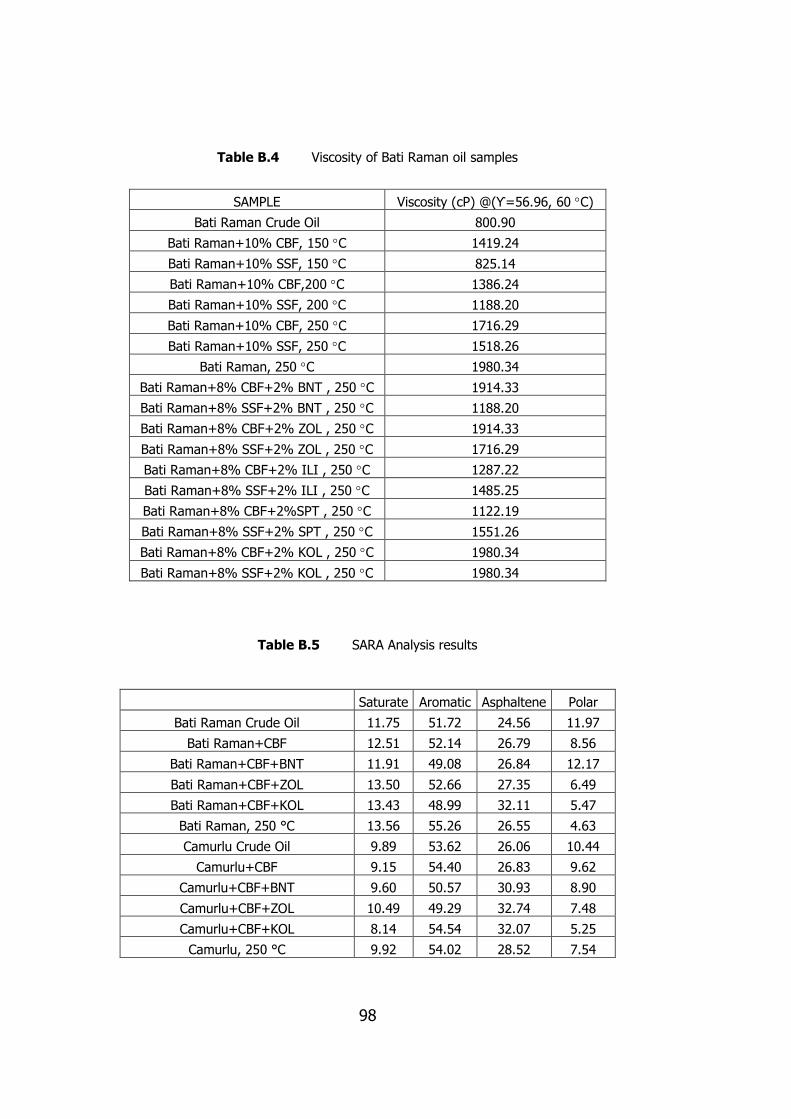
98
Table B.4 Viscosity of Bati Raman oil samples
SAMPLE Viscosity (cP) @(ϒ=56.96, 60 C)
Bati Raman Crude Oil 800.90
Bati Raman+10% CBF, 150 C 1419.24
Bati Raman+10% SSF, 150 C 825.14
Bati Raman+10% CBF,200 C 1386.24
Bati Raman+10% SSF, 200 C 1188.20
Bati Raman+10% CBF, 250 C 1716.29
Bati Raman+10% SSF, 250 C 1518.26
Bati Raman, 250 C 1980.34
Bati Raman+8% CBF+2% BNT , 250 C 1914.33
Bati Raman+8% SSF+2% BNT , 250 C 1188.20
Bati Raman+8% CBF+2% ZOL , 250 C 1914.33
Bati Raman+8% SSF+2% ZOL , 250 C 1716.29
Bati Raman+8% CBF+2% ILI , 250 C 1287.22
Bati Raman+8% SSF+2% ILI , 250 C 1485.25
Bati Raman+8% CBF+2%SPT , 250 C 1122.19
Bati Raman+8% SSF+2% SPT , 250 C 1551.26
Bati Raman+8% CBF+2% KOL , 250 C 1980.34
Bati Raman+8% SSF+2% KOL , 250 C 1980.34
Table B.5 SARA Analysis results
Saturate Aromatic Asphaltene Polar
Bati Raman Crude Oil 11.75 51.72 24.56 11.97
Bati Raman+CBF 12.51 52.14 26.79 8.56
Bati Raman+CBF+BNT 11.91 49.08 26.84 12.17
Bati Raman+CBF+ZOL 13.50 52.66 27.35 6.49
Bati Raman+CBF+KOL 13.43 48.99 32.11 5.47
Bati Raman, 250 °C 13.56 55.26 26.55 4.63
Camurlu Crude Oil 9.89 53.62 26.06 10.44
Camurlu+CBF 9.15 54.40 26.83 9.62
Camurlu+CBF+BNT 9.60 50.57 30.93 8.90
Camurlu+CBF+ZOL 10.49 49.29 32.74 7.48
Camurlu+CBF+KOL 8.14 54.54 32.07 5.25
Camurlu, 250 °C 9.92 54.02 28.52 7.54

99
APPENDIX C
XRD MEASUREMENTS
Figure C.1 XRD measurement for carbonate rock (Bulk sample)

100
Figure C.2 XRD measurement for carbonate rock (Air dried)

101
Figure C.3 XRD measurement for carbonate rock (Ethylene glycolated)

102
Figure C.4 XRD measurement for carbonate rock (Heated at 300 ⁰C)

103
Figure C.5 XRD measurement for carbonate rock (Heated at 550 ⁰C)

104
Figure C.6 XRD measurement for sandstone rock (Bulk sample)

105
Figure C.7 XRD measurement for sandstone rock (Air dried)

106
Figure C.8 XRD measurement for sandstone rock (Ethylene glycolated)

107
Figure C.9 XRD measurement for sandstone rock (Heated at 300 ⁰C)

108
Figure C.10 XRD measurement for sandstone rock (Heated at 550 ⁰C)

109
APPENDIX D
TPH MEASUREMENTS
Figure D.1 TPH measurement for Camurlu+8% CBF+2%KOL, 250 C

110
Figure D.1 TPH measurement for Camurlu+8% CBF+2%KOL, 250 C (cont.)

111
Figure D.2 TPH measurement for Camurlu+8% SSF+2%KOL, 250 C

112
Figure D.2 TPH measurement for Camurlu+8% SSF+2%KOL, 250 C (Cont.)

113
Figure D.3 TPH measurement for Bati Raman+8% CBF+2%KOL, 250 C
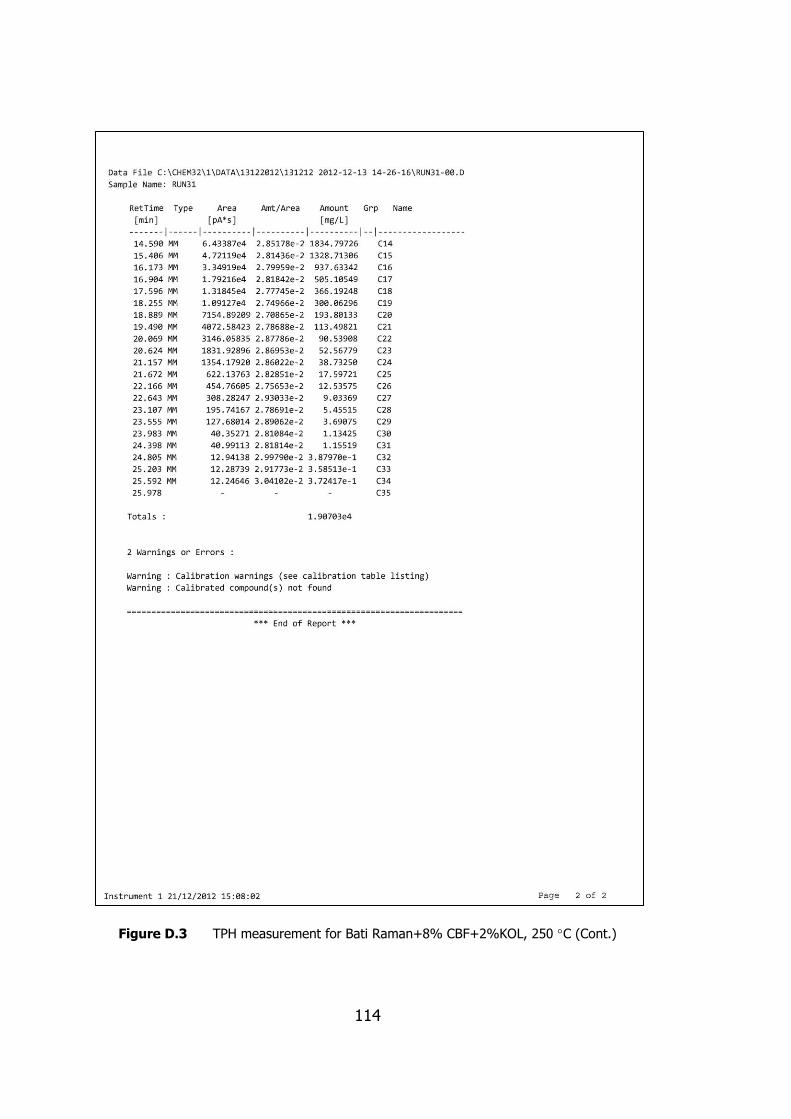
114
Figure D.3 TPH measurement for Bati Raman+8% CBF+2%KOL, 250 C (Cont.)
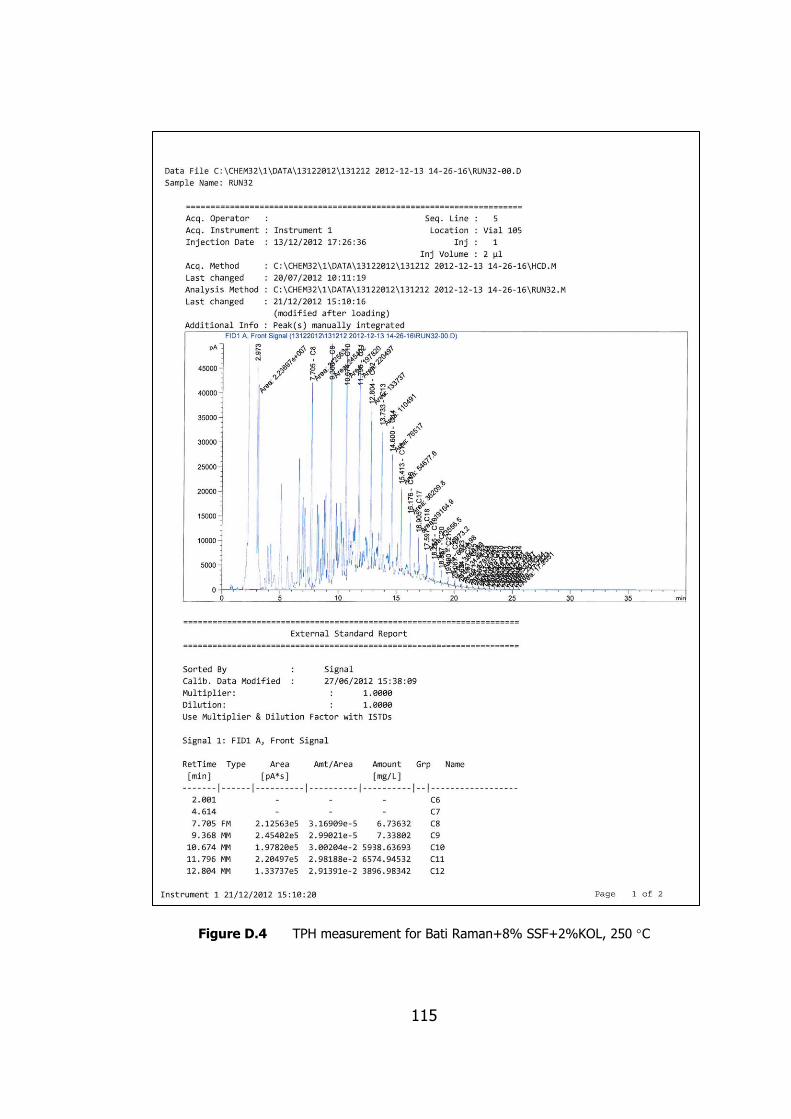
115
Figure D.4 TPH measurement for Bati Raman+8% SSF+2%KOL, 250 C

116
Figure D.4 TPH measurement for Bati Raman+8% SSF+2%KOL, 250 C (Cont.)
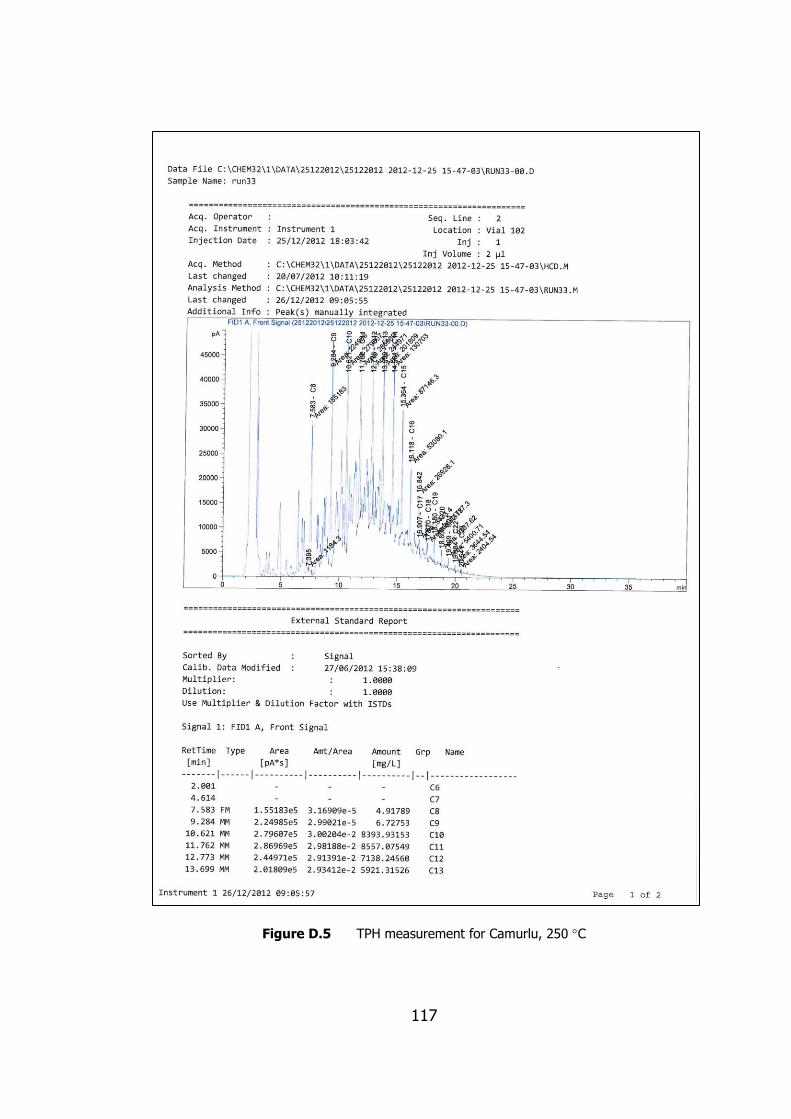
117
Figure D.5 TPH measurement for Camurlu, 250 C
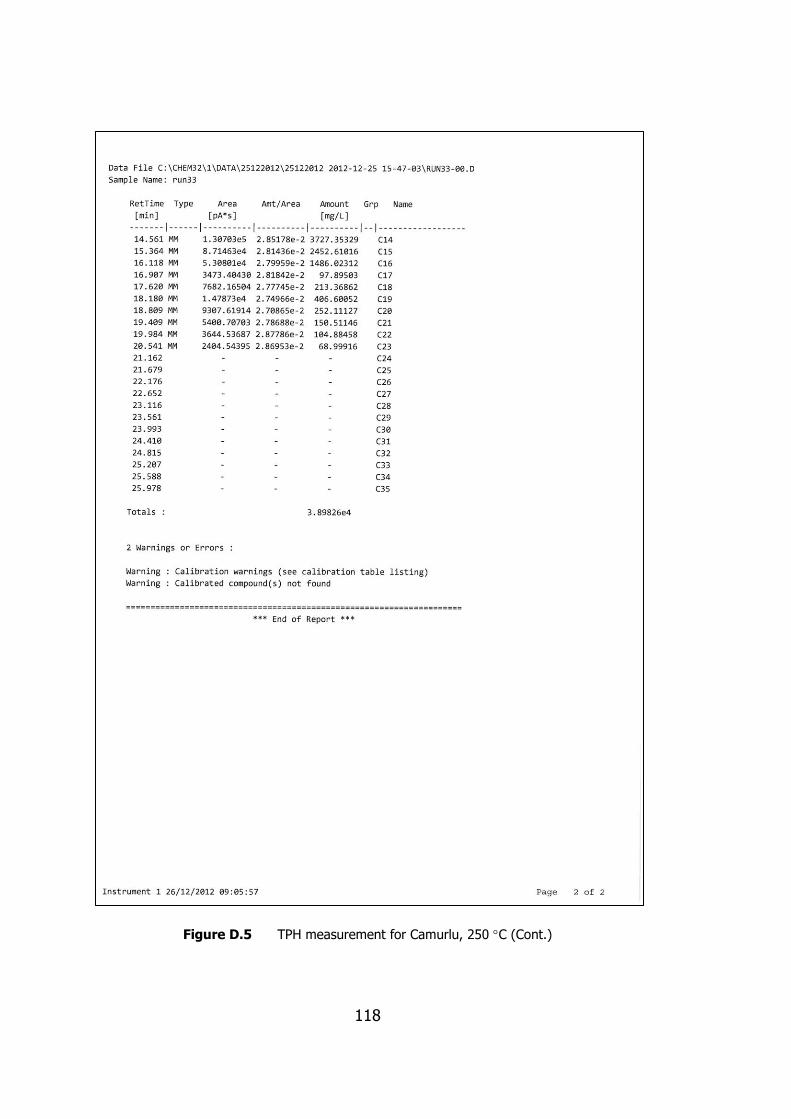
118
Figure D.5 TPH measurement for Camurlu, 250 C (Cont.)

119
Figure D.6 TPH measurement for Bati Raman, 250 C

120
Figure D.6 TPH measurement for Bati Raman, 250 C (Cont.)