MICROSTRUCTURAL AND MECHANICAL CHARACTERIZATION …etd.lib.metu.edu.tr/upload/12614001/index.pdf ·...
72
MICROSTRUCTURAL AND MECHANICAL CHARACTERIZATION OF DUPLEX STAINLESS STEEL GRADE 2205 JOINED BY HYBRID PLASMA AND GAS METAL ARC WELDING A THESIS SUBMITTED TO THE GRADUATE SCHOOL OF NATURAL AND APPLIED SCIENCES OF MIDDLE EAST TECHNICAL UNIVERSITY BY BURCU TOLUNGÜÇ IN PARTIAL FULFILLMENT OF THE REQUIREMENTS FOR THE DEGREE OF MASTER OF SCIENCE IN METALLURGICAL AND MATERIALS ENGINEERING JANUARY 2012
Transcript of MICROSTRUCTURAL AND MECHANICAL CHARACTERIZATION …etd.lib.metu.edu.tr/upload/12614001/index.pdf ·...
MICROSTRUCTURAL AND MECHANICAL CHARACTERIZATION OF DUPLEX STAINLESS STEEL GRADE 2205 JOINED BY HYBRID PLASMA
AND GAS METAL ARC WELDING
A THESIS SUBMITTED TO THE GRADUATE SCHOOL OF NATURAL AND APPLIED SCIENCES
OF MIDDLE EAST TECHNICAL UNIVERSITY
BY
BURCU TOLUNGÜÇ
IN PARTIAL FULFILLMENT OF THE REQUIREMENTS FOR
THE DEGREE OF MASTER OF SCIENCE IN
METALLURGICAL AND MATERIALS ENGINEERING
JANUARY 2012
Approval of the thesis
MICROSTRUCTURAL AND MECHANICAL CHARACTERIZATION OF DUPLEX STAINLESS STEEL GRADE 2205 JOINED BY HYBRID PLASMA
AND GAS METAL ARC WELDING
Submitted by BURCU TOLUNGÜÇ in partial fulfillment of the requirements for the degree of Master of Science in Metallurgical and Materials Engineering Department, Middle East Technical University by
Prof. Dr. Canan Özgen Dean, Graduate School of Natural and Applied Sciences ___________ Prof. Dr. Tayfur Öztürk Head of Department, Metallurgical and Materials Eng. ___________ Prof. Dr. C. Hakan Gür Supervisor, Metallurgical and Materials Eng. Dept., METU ___________ Prof. Dr. Rıza Gürbüz Co-Supervisor, Metallurgical and Materials Eng. Dept., METU ___________
Examining Committee Members Prof. Dr. Tayfur Öztürk Metallurgical and Materials Eng. Dept., METU ________________ Prof. Dr. C. Hakan Gür Metallurgical and Materials Eng. Dept., METU ________________ Prof. Dr. Rıza Gürbüz Metallurgical and Materials Eng. Dept., METU ________________ Prof. Dr. Bilgehan Ögel Metallurgical and Materials Eng. Dept., METU ________________ Assist. Prof. Dr. Kazım Tur Metallurgical and Materials Eng. Dept., Atılım University ________________
DATE: 06/01/2012
iii
I hereby declare that all information in this document has been obtained and presented in accordance with academic rules and ethical conduct. I also declare that, as required by these rules and conduct, I have fully cited and referenced all material and results that are not original to this work.
Name, Last name: Burcu TOLUNGÜÇ
Signature:
iv
ABSTRACT
MICROSTRUCTURAL AND MECHANICAL CHARACTERIZATION OF DUPLEX STAINLESS STEEL GRADE 2205 JOINED BY HYBRID
PLASMA AND GAS METAL ARC WELDING
Tolungüç, Burcu
M. Sc., Department of Metallurgical and Materials Engineering
Supervisor: Prof. Dr. C. Hakan Gür
Co-supervisor: Prof. Dr. Rıza Gürbüz
January 2012, 57 Pages
In the present study, the applicability of the hybrid plasma arc welding, in
which a keyhole is responsible of deep penetration and a filler wire electrode
supplies a high deposition rate, was examined. The microstructural
evolutions in grade 2205 duplex stainless steel plates joined by keyhole and
melt-in techniques were investigated. The specimens obtained from welded
plates having thickness of 8 mm were examined via optical and scanning
electron microscopy. Metallographic investigations were supported by X-ray
diffraction and energy dispersed spectra analyses by characterizing the
phases formed after welding. Impact toughness properties, hardness
profiles, and crack propagation behavior of welding zones were
quantitatively and qualitatively compared for mechanical characterization.
Fracture characteristics were determined via scanning electron microscopy
examinations.
v
It was observed that single-pass HPA weldment seemed to be free of
secondary austenite precipitation in acicular form, which is inevitable in
multi-pass conventional arc welding methods. Besides δ-ferrite was
successfully kept under 70%, which is presented as a limit to not to
deteriorate the mechanical properties of DSS. High linear welding speed and
high power density supplied by HPAW presented narrower weld metal and
heat affected zone with not only lower hardness but also higher impact
toughness energies. Synergic effect of the keyhole formed by a plasma arc
and the metal transfer supplied by gas metal arc gave reasonable dilution in
the weld metal. Furthermore, fatigue crack growth tests revealed that crack
propagation rates in HPAW joints were comparable to GMAW joints.
Keywords: Duplex Stainless Steel, Hybrid Plasma Arc Welding,
Microstructure, Fatigue crack propagation
vi
ÖZ
HĐBRĐT PLAZMA VE GAZ METAL ARK KAYNAĞI ĐLE BĐRLEŞTĐRMĐŞ 2205 DUBLEKS PASLANMAZ ÇELĐKLERĐNĐN MĐKROYAPI VE
MEKANĐK KARAKTERĐZASYONU
Tolungüç, Burcu
Yüksek Lisans, Metalurji ve Malzeme Mühendisliği Bölümü
Tez Yöneticisi: Prof. Dr. C. Hakan Gür
Ortak Tez Yöneticisi: Prof. Dr. Rıza Gürbüz
Ocak 2012, 57 Sayfa
Bu çalışmada, hibrit plazma ark kaynağı incelenmiştir. Bu kaynak yöntemi,
anahtar deliği tekniği sayesinde derin nüfuziyet ve dolgu teli elektrodu
sayesinde ise yüksek kaplama hızına sahiptir. Anahtar deliği ve eritme
tekniği ile birleştirilen 2205 sınıfı dubleks paslanmaz (DP) çelik plakalar
araştırılmıştır. Kaynaklamış 8mm kalınlığındaki plakalardan elde edilen
örnekler optik ve taramalı elektron mikroskobu ile incelenmiştir.
Metalografik incelemeler, kaynak işlemi sonrası oluşan ikincil fazların
karakterizasyonu için kullanılan X-Işını kırınımı ve enerji dağılımlı X-Işını
spektroskopisi yöntemleri ile desteklenmiştir. Kaynak bölgelerinin darbe
tokluğu özellikleri, sertlik profilleri ve yorulma çatlak ilerleme davranışları
mekanik karakterizasyonu amacıyla karşılaştırılmıştır. Kırılma
karakteristikleri taramalı elektron mikroskobu yardımıyla belirlenmiştir.
vii
Tek paso olarak gerçekleştirilen HPA kaynağında, çok pasolu yöntemlerde
kaçınılmaz olan ve asikular formda oluşan ikincil östenit oluşumu
gözlenmemiştir. Bunun yanı sıra δ-ferrit oranı mekanik özelliklerin
bozulması nedeniyle kritik olarak tanımlanan %70’in altında kalmıştır. HPA
kaynağı yönteminde elde edilen yüksek kaynak hızı ve güç yoğunluğu,
kaynak bölgesinin ve ısıdan etkilenmiş bölgenin dar kalmasına ve bununla
beraber düşük sertlik ve yüksek tokluk değerlerine ulaşılmasını sağlamıştır.
Plazma arkının oluşturduğu anahtar deliği ve gaz metal arkının
oluşturduğu metal transfer etkilerinin birleşimi kaynakta yüksek
penetrasyona ulaşılmasına olanak vermiştir. Buna ek olarak, yorulma
çatlak ilerlemesi testlerinden elde edilen sonuçlar, HPA kaynaklı örneklerde
elde edilen çatlak ilerleme hızlarının, GMA kaynaklı örneklerle
karşılaştırılabilir olduğunu göstermiştir.
Anahtar Kelimeler: Dubleks paslanmaz çelikler, Hibrit Plazma Ark Kaynağı,
Đçyapı, Yorulma çatlak ilerlemesi

viii
To My Beloved Husband
ix
ACKNOWLEDGMENTS
I wish to thank my supervisor Prof. Dr. C. Hakan Gür and co supervisor
Prof. Dr. Rıza Gürbüz for their guidance, advice, criticism, encouragements
and insight throughout the research.
I would like to express my deepest gratitude to Koray Yurtışık; words are
insufficient to describe his contribution both in this thesis and in my life.
Dr. Süha Tirkeş is gratefully and respectfully acknowledged for his efforts
and suggestions especially on metallographic evolutions and his support
and encouragements throughout the thesis.
I also want to express my appreciation to Göksu Gürer for his efforts,
guidance, and helps on mechanical tests and Murat Tolga Ertürk for being
there every time I was in need.
I want to thank Sinem Adıgüzel and Esra Çorapçı for their friendship and
support and especially their valuable sharing of the good and bad times of
the path.
I want to extend my appreciation to my family; my parents Filiz and Metin
Anık and my sister Ezgi Anık for their infinite support, my grandmother
Semiha Yorgancı for her endless love for education, my aunts Sema
Yorgancı and Nur Acardağ for their priceless friendship, my mother and
father Gaye and Ahmet Tolungüç for their faith in me, to all my friends and
to whomever eased the load on me walking this path.
Finally, I would like to thank my beloved husband for his presence in my
life.
x
TABLE OF CONTENTS
ABSTRACT ..................................................................................................iv
ÖZ ..............................................................................................................vi
ACKNOWLEDGMENTS .............................................................................. ix
TABLE OF CONTENTS ................................................................................ x
LIST OF TABLES ....................................................................................... xii
LIST OF FIGURES .................................................................................... xiii
CHAPTERS
1. INTRODUCTION ...................................................................................... 1
2. THEORY ................................................................................................. 3
2.1. Duplex Stainless Steels ............................................................ 3
2.1.1. Physical metallurgy ........................................................... 4
2.1.2. Mechanical properties ....................................................... 9
2.1.3. Standards and codes defining Gr 2205 ............................ 11
2.2. Service Environment of Reaction Vessels ............................... 12
2.2.1. Definition, geometry, and manufacturing ........................ 12
2.2.2. Stress and strain ............................................................. 12
2.2.3. Stresses on longitudinal and circumferential joints ......... 15
2.2.4. Leak before burst ............................................................ 16
2.2.5. Crack propagation in weldments ..................................... 17
2.3. Weldability of Duplex Stainless Steels .................................... 18
2.3.1. Conventional arc welding methods .................................. 19
2.3.2. Preheating and post weld heat treatment (PWHT) ............ 21
2.3.3. Interpass temperature and heat input ............................. 21
2.4. Hybrid Plasma Arc Welding .................................................... 22
2.4.1. Marangoni Effect ............................................................. 23
3. EXPERIMENTAL STUDIES .................................................................... 25

xi
3.1. Base Metal Characterization .................................................. 25
3.2. Welding Parameters ............................................................... 26
3.3. Weld Metal Microstructural Characterization ......................... 28
3.4. Hardness and Charpy Impact Toughness of Weld Metals ....... 29
3.5. Fatigue Crack Propagation Tests ............................................ 30
4. RESULTS AND DISCUSSION ................................................................ 33
4.1. Base Metal Characterization .................................................. 33
4.2. Welding Parameters ............................................................... 35
4.3. Weld Metal Microstructural Characterization ......................... 39
4.4. Hardness and Charpy Impact Toughness of Weld Metals ....... 42
4.5. Fatigue Crack Propagation Tests ............................................ 45
5. CONCLUSION ....................................................................................... 53
REFERENCES .......................................................................................... 55
xii
LIST OF TABLES
TABLES
Table 1: Crystal structure and chemical composition of the phases present in DSS ............................................................................... 8
Table 2: Average mechanical properties of 2205 duplex stainless steels. ............................................................................................. 9
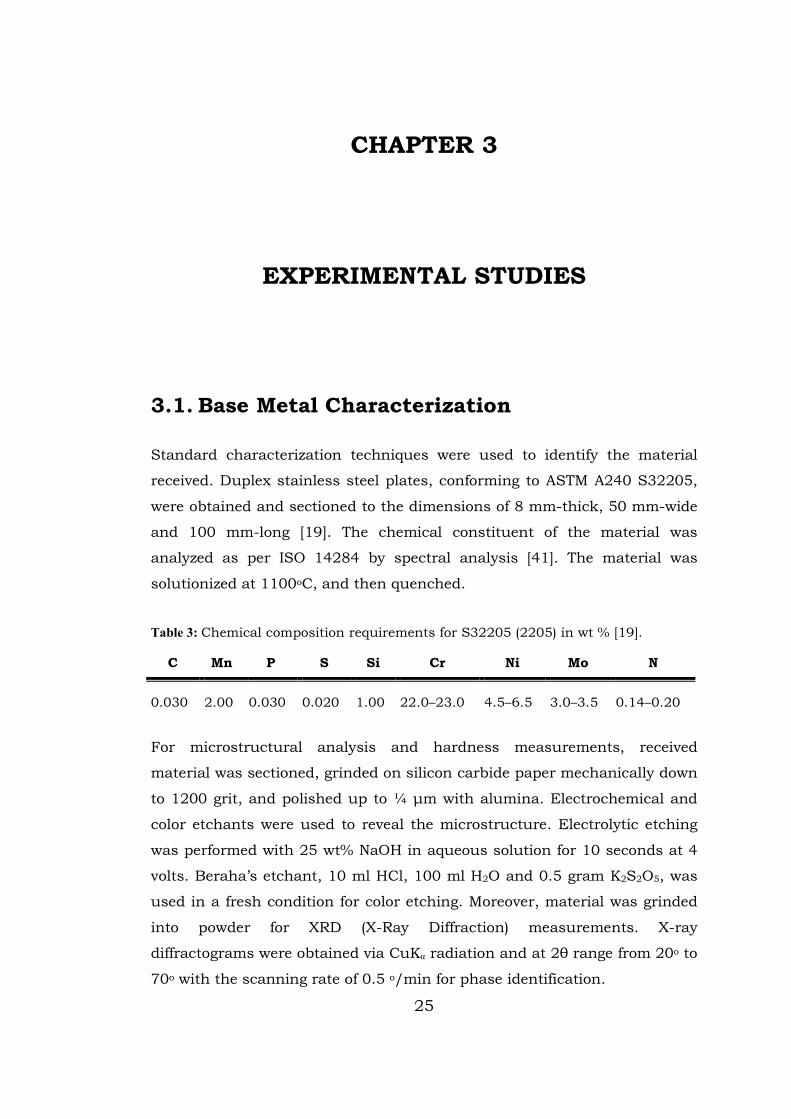
Table 3: Chemical composition requirements for S32205 (2205) in wt%. ............................................................................................. 25
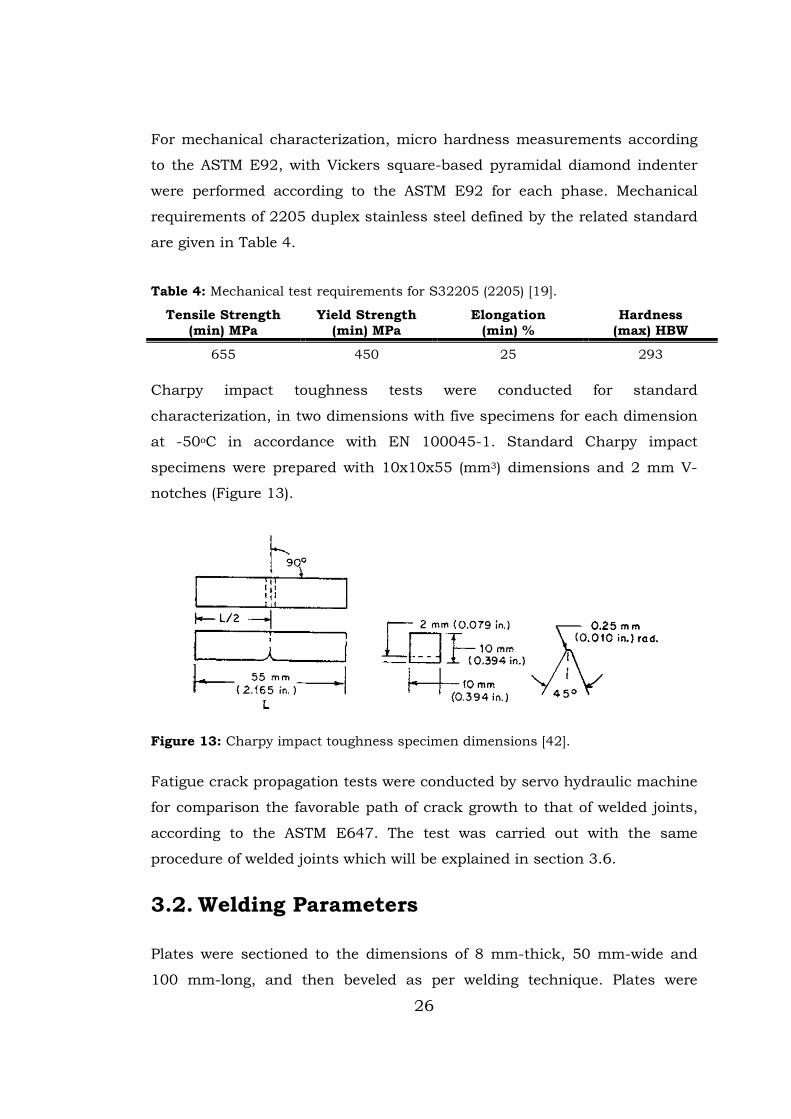
Table 4: Mechanical test requirements for S32205 (2205). ........................ 26
Table 5: Chemical composition of the filler wire in wt %. ........................... 27
Table 6: Chemical composition of the base metal in wt%. ......................... 33
Table 7: Microhardness measurements of each phase present in the base metal. ................................................................................... 35
Table 8: Charpy impact test results of the base metal ............................... 35
Table 9: Welding parameters for HPAW and GMAW performances. ........... 36
Table 10: Comparıson of welding consumables for both GMAW and HPAW ........................................................................................... 36
Table 11: Welding parameters and heat input results for each pass of GMAW. ......................................................................................... 37
Table 12: Welding parameters and heat input results for HPAW. .............. 37
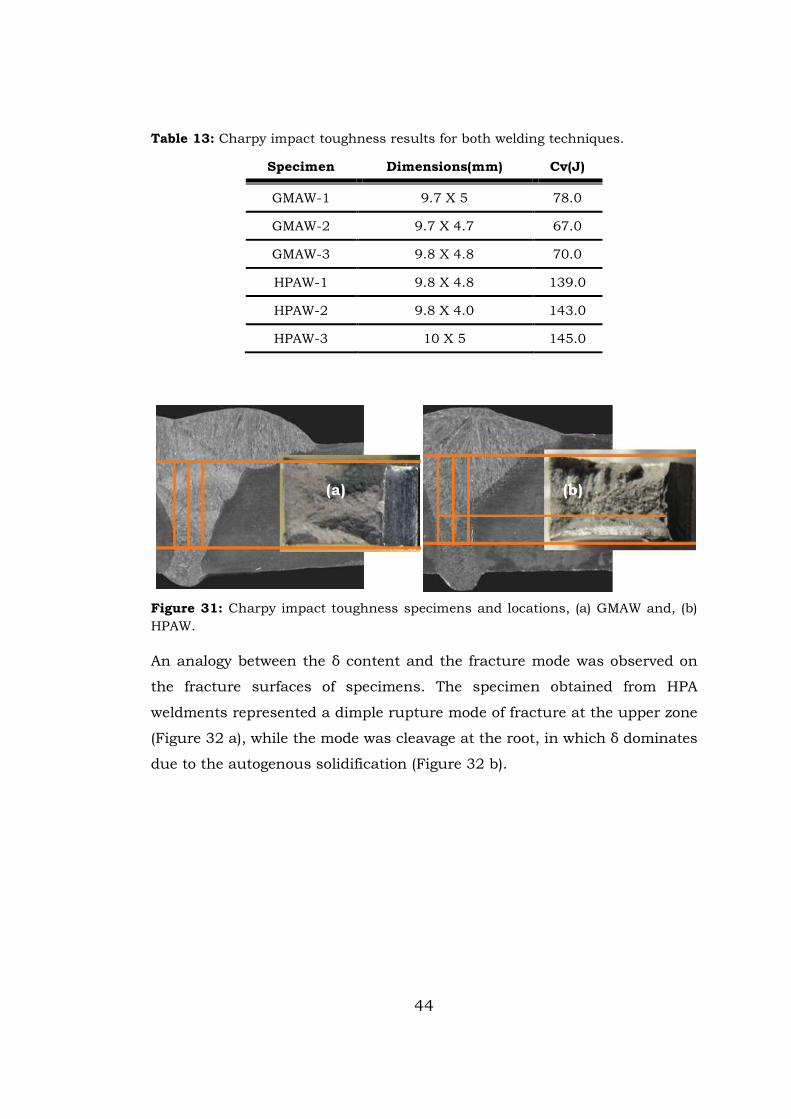
Table 13: Charpy impact toughness results for both welding techniques. ................................................................................... 44
Table 14: Material constants C and m. ...................................................... 50
xiii
LIST OF FIGURES
FIGURES
Figure 1: Crystallization modes of duplex stainless steels. .......................... 6
Figure 2: Change in nucleation rate and austenite fraction with temperature. ........................................................................................ 7
Figure 3: Formation of secondary phases in duplex stainless steels ............ 7
Figure 4: Isothermal precipitation diagram for duplex stainless steels, annealed at 1050°C. ............................................................................ 9
Figure 5: The effect of cold work on the tensile strength (Rm), yield strength
(Rp0.2
), elongation (A5) and hardness (H
v) ............................................ 10
Figure 6: Longitudinal and hoop stresses produced in the wall of a thin-walled pressure vessel. ....................................................................... 13
Figure 7: Plane stress situation for the outer shell of the thin-walled pressure vessel. ................................................................................. 14
Figure 8: A typical pressure vessel while being manufactured ................... 16
Figure 9: (a) Welding cross-section is totally subjected to the force applied, (b) base material primarily sustains the applied force. ....................... 16
Figure 10: A typical melt-in fusion welded DSS joint ................................. 20
Figure 11: Elements of the HPAW ............................................................. 23
Figure 12: (a) Reversed Marangoni effect, (b) Marangoni effect .................. 24
Figure 13: Charpy impact toughness specimen dimensions ...................... 26
Figure 14: Macro examinations of (a) GMAW, (b) HPAW. ........................... 28
Figure 15: Charpy impact toughness sub-size test specimens ................... 29
Figure 16: Schematic representation of the notch location on the welded joints. ................................................................................................ 29
xiv
Figure 17: Schematic representation of the indentation locations of hardness measurements. ................................................................... 30
Figure 18: Paris-Erdoğan Law ................................................................... 31
Figure 19: Schematic representation of compact tension specimen for crack propagation tests. .............................................................................. 32
Figure 20: Compact tension specimen orientations on longitudinal joints. 32
Figure 21: Chemical composition of the base metal compared with the limits defined in ASTM A240. ....................................................................... 34
Figure 22: (a) LOM micrograph of the base metal; color etched, (b) SEM micrograph of the base metal. ............................................................ 34
Figure 23: X-ray diffractogram of the parent metal. .................................. 34
Figure 24: Bevel geometry and schematic representation of passes for (a) GMAW and, (b) HPAW. ....................................................................... 36
Figure 25: t12/5 durations for GMAW cap pass and HPAW. ........................ 38
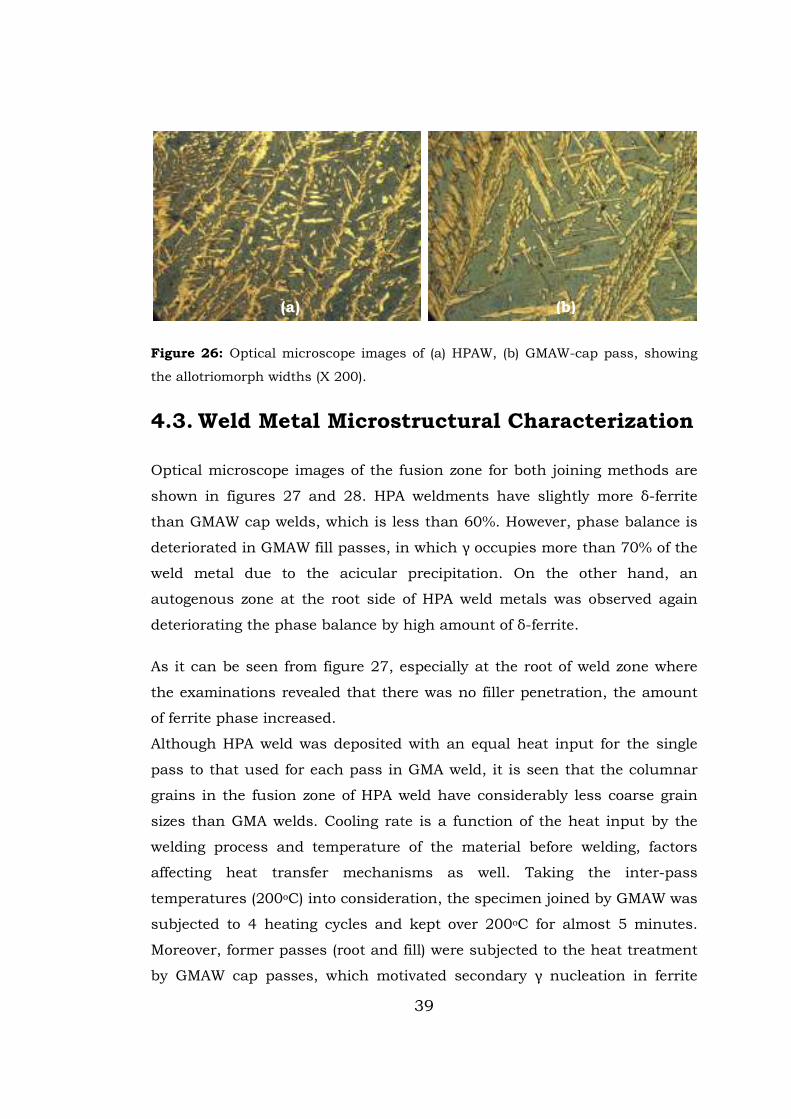
Figure 26: Optical microscope images of (a) HPAW, (b) GMAW-cap pass, showing the allotriomorph widths (x 200). ......................................... 39
Figure 27: Micrographs of HPA welded specimen; (a) LOM image, x200, (b) SEM image taken from cap side and, (c) SEM image from root side. ... 40
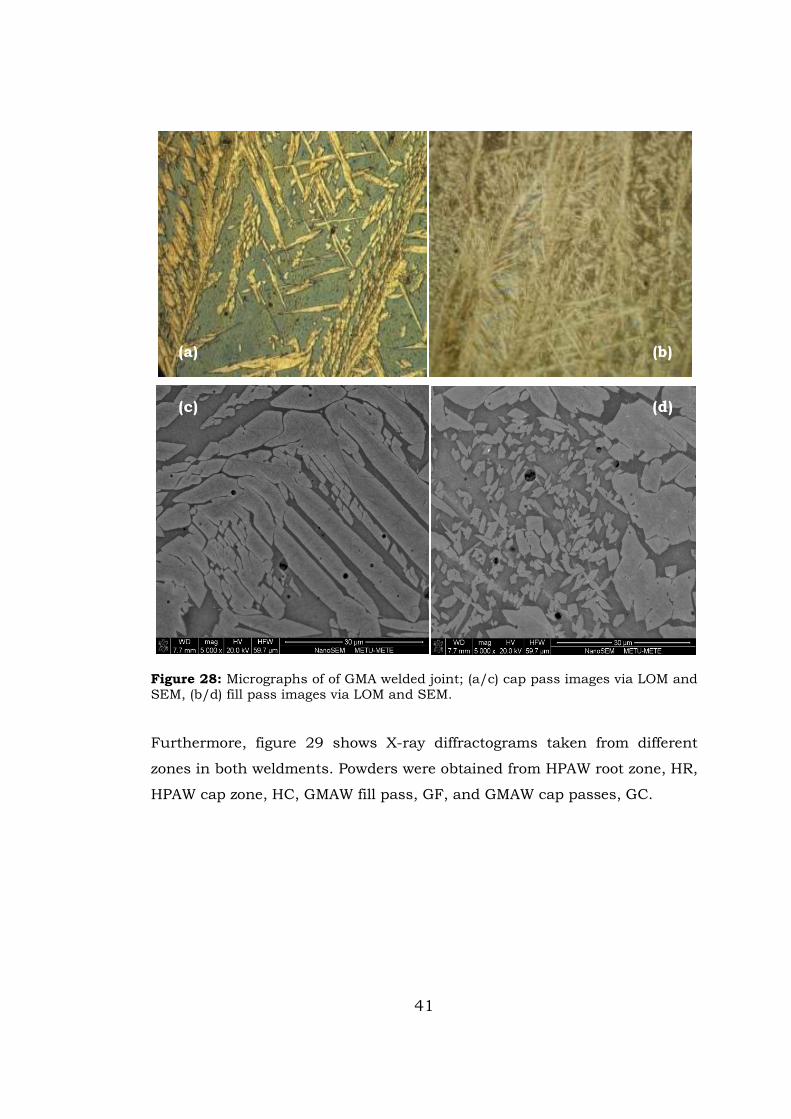
Figure 28: Micrographs of GMA welded joint; (a/c) cap pass images via LOM and SEM, (b/d) fill pass images via LOM and SEM. ........................... 41
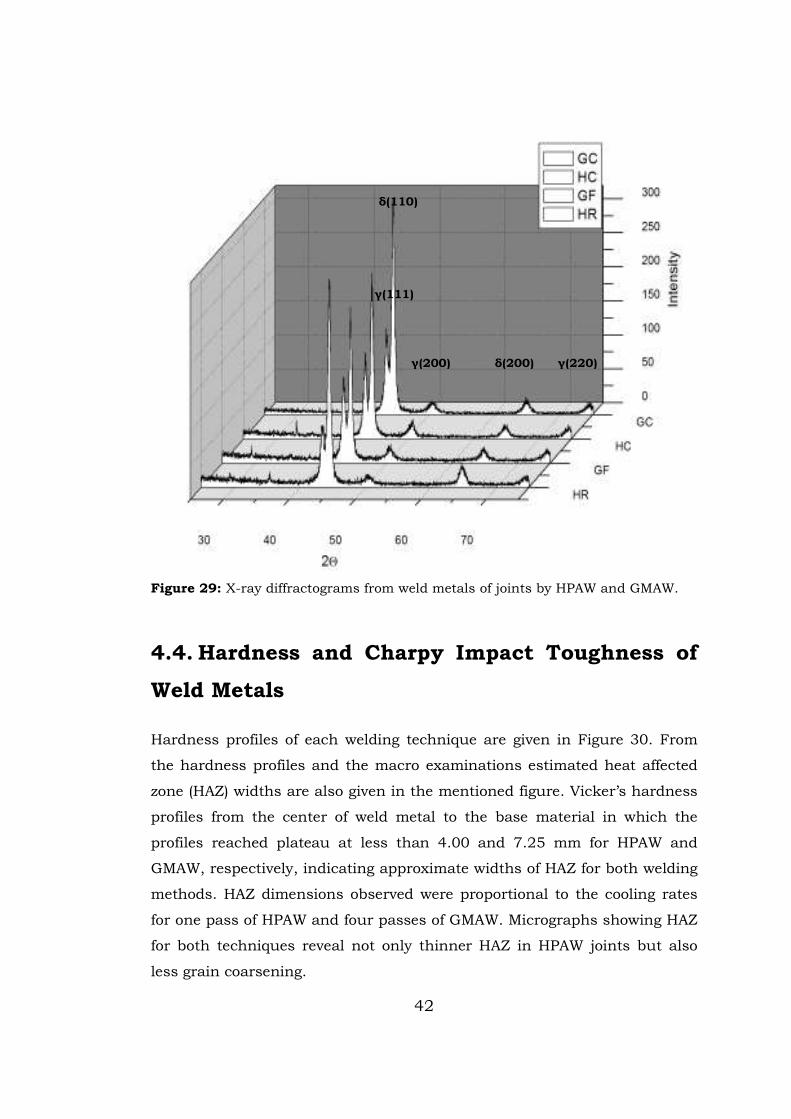
Figure 29: X-ray diffractograms from weld metals of joints by HPAW and GMAW ............................................................................................... 42
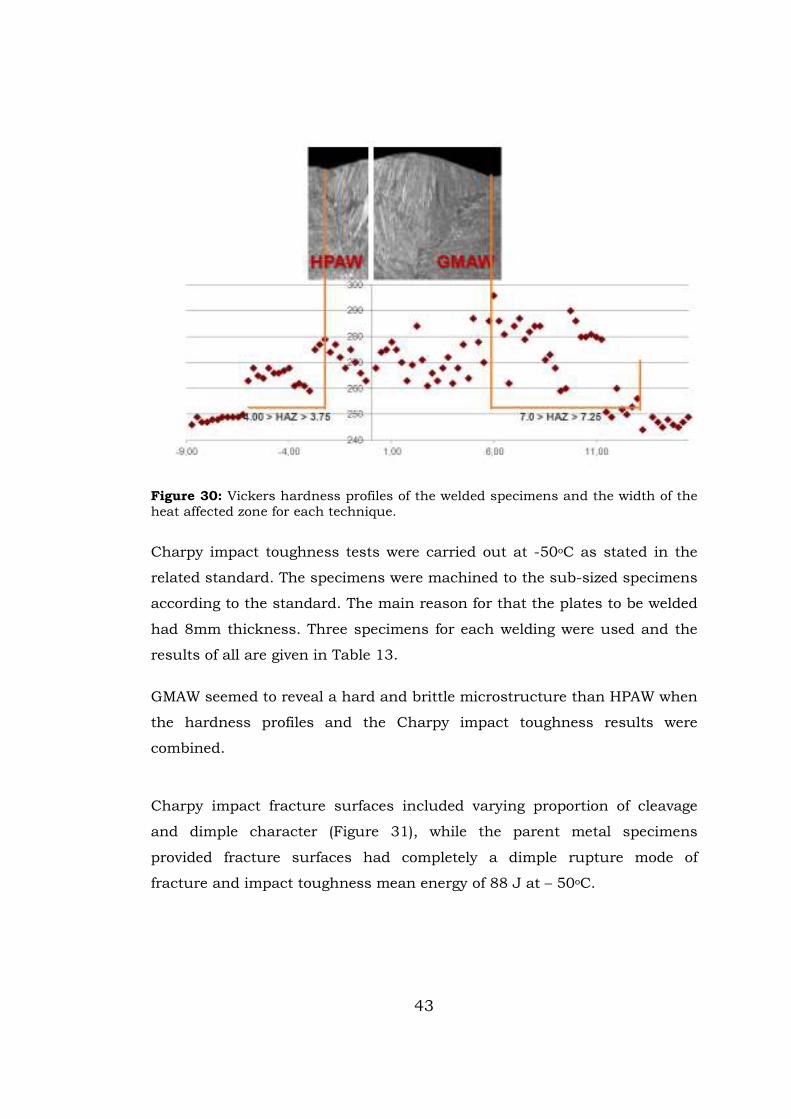
Figure 30: Vickers hardness profiles of the welded specimens and the width of the heat affected zone for each technique. ...................................... 43
Figure 31: Charpy impact toughness specimens and locations, (a) GMAW and, (b) HPAW. ................................................................................... 44
Figure 32: SEM images showing fracture surfaces of charpy impact test specimens of (a) HPAW upper zone and, (b) HPAW root zone. ............. 45
Figure 33: a vs. n diagrams obtained from fatigue crack propagation tests in L-T orientation. .................................................................................. 46
Figure 34: a vs. n diagrams obtained from fatigue crack propagation tests in T-LL orientation. ................................................................................. 46
xv
Figure 35: Crack growth rate vs. stress intensity factor range diagram for L-TL orientation. .................................................................................... 47
Figure 36: Fracture surface SEM image of HPA welded specimenin L-TL orientation. ........................................................................................ 48
Figure 37: Crack growth rate vs. stress intensity factor range diagram for T-LL orientation. .................................................................................... 49
Figure 38: CT specimens in T-LL orientation (a) GMAW and, (b) HPAW...... 51
Figure 39: Crack growth rate vs. distance travelled-HPAW ........................ 51
Figure 40: Crack growth rate vs. distance travelled - GMAW ..................... 52
1
CHAPTER 1
INTRODUCTION
Duplex Stainless Steels, DSS; which offer a superior combination of
mechanical properties and corrosion resistance due to their balanced
content between ferrite and austenite, have been utilized in power reactors,
off-shore plants, automotive and (petro) chemical industries. The balanced
delta-ferrite, δ, and austenite, γ, content of duplex stainless steel, DSS,
offers a good combination of strength and corrosion resistance. Due to its
relatively higher strength, DSS has been preferred instead of austenitic
stainless steels especially in components like piping and reaction vessels,
for which welding is a necessary process in fabrication.
New generation of DSS has good weldability by conventional arc welding
methods as long as the heat input and inter-pass temperatures are limited
in order to ensure a proper γ to δ ratio in the weld metal and heat affected
zone, HAZ [1; 2] DSS solidifies ferritically and than partially transforms to
austenite. Moderate cooling rates during welding promote a proper phase
proportion. Ferrite is more stable and with the existence of N, CrN and CrN2
precipitate under higher cooling rates [3; 4]. Very slow cooling increases the
possibility of the intermetallic precipitations like Sigma and Chi [5]. DSS
has a very good stress corrosion cracking, SCC, and intergranular
corrosion, IGC, resistance, and strength due to the ferrite content, however
ferrite contents in the weld metal and HAZ in excess of 70% resulting in the
loss of strength and increased susceptibility to IGC [6].
2
Key-hole welding allows a capability for deep and narrow weldments and
narrow heat affected zone, which minimize residual stresses and distortions
of assemblies. Electron beam and laser beam welding methods are utilized
without the addition of filler metal. However, autogenous welding of DSS is
not preferred since the welds will be very high in ferrite [3; 7; 8]. Such
weldments shall be quench-annealed in order to get the correct structure.
In the present study, the microstructural evolutions of 2205 Duplex
Stainless Steel joints by varying keyhole conditions were investigated. The
specimens obtained from welded 2205 plates having thickness of 11 mm
were examined via light optical microscopy and scanning electron
microscopy. Metallographies were supported by X-ray diffractions and
energy dispersed spectra by characterizing secondary phases formed after
welding. Volumetric fractions and the morphologies of ferrite and austenite
phases were among the major points to be subjected.
3
CHAPTER 2
THEORY
2.1. Duplex Stainless Steels
During the last fifty years, duplex stainless steel family has been improved
by introducing the nitrogen additions. This was a breakthrough mainly for
the weldability of DSS since the use and fields of applications increased [9].
DSS offers an alternative to austenitic stainless steels in many fields of
application, such as chemical, oil, and gas industries like pipelines and
reaction vessels. The unique combination of two phase structure of δ-ferrite
and austenite offers a good combination of strength and corrosion
resistance. Ferrite phase introduces strength and local corrosion resistance
to the material, where ductility and general corrosion resistance comes from
the austenite phase. Therefore, duplex stainless steels have high impact
toughness and overall corrosion resistance. Furthermore, their relatively
low thermal expansivity makes them useful for shell and tube heat
exchangers, and the improved stress corrosion cracking resistance in
chloride containing environments of temperatures above 50°C [10].
The ratio of austenite to δ-ferrite is quite critical to preserve the advanced
mechanical properties. The duplex microstructure is produced by the
adjustment of the δ and γ stabilizing alloying elements [10]. Duplex
stainless steels contain high amount of alloying elements which have great
effect on mechanical properties. However, high alloy content result in
complex phase transformation mechanisms [11]. Decomposition of δ-ferrite
and formation of intermetallic phases and precipitates as well as austenite
4
at between 600 – 1200oC, may cause decrease in toughness and corrosion
resistance [12]. The microstructure depends on the alloy composition and
thermo-mechanical treatment and to preserve the desired properties, it
should be equal mixture of austenite and δ-ferrite.
2.1.1. Physical metallurgy
The importance of alloying elements for DSS was mentioned earlier. Ni, C,
and Mn are austenite stabilizers while Cr, Mo, Si, and Nb stabilize δ-ferrite.
Duplex stainless steels can contain high levels of chromium up to 30 wt %.
Chromium has a bcc structure below its melting point. It is the main δ-
ferrite stabilizer and the other δ-ferrite stabilizer elements are given in the
form of a “chromium equivalent” [10].
Nickel has an fcc. structure below its melting point. Nickel stabilizes the
austenite phase and duplex stainless steels contain 5 to 9 wt. % of Ni.
Austenite stabilizing elements are represented in the form of “nickel
equivalent.”
Duplex stainless steels contain carbon and nitrogen; both are austenite
stabilizers, up to 0.08 and 0.3 wt. % respectively. The addition of C or N
increases the maximum solubility of Cr in austenite, which is important for
corrosion resistance.
Mo exists in duplex stainless steels in the range of 1 to 3.9 wt. %. After Cr
and Ni, Mo is the third important alloying element in duplex stainless steel.
Mo is a δ-ferrite stabilizer element and it improves the pitting corrosion
resistance.
Another ferrite stabilizer element that exists in DSS is silicon, having an
effect similar to that of molybdenum. The addition of 3-5 wt. % Si to duplex
stainless steel castings considerably improves the pitting resistance in
acidified ferric chloride solution, and at the same time impairs the
resistance to intergranular corrosion in boiling nitric acid solution [13].
5
Other ferrite stabilizer elements are Nb and Ti. Titanium forms TiC
precipitates by removing the carbon from the solution, and this may
increase the sigma formation since the Cr in the system remains free.
Mn and Cu are mentioned as austenite stabilizing elements. Cu addition
improves the corrosion resistance and by precipitation hardening
mechanism, it increases the strength of the material. Furthermore, Cu
results in fine austenite formation by acting as nucleation site for austenite
and pinning the growth of nuclei. Mn increases the solubility of nitrogen in
DSS.
Remaining alloying elements in DSS are Pd, Pt, and Ru. Additions of up to 8
wt. % of them to duplex stainless steels promotes an austenitic mode of
solidification, reduces martensite formation in the solution treated and
deformed materials and accelerates the formation of σ at 900°C on ageing
[14].
Duplex stainless steels, apart from some near ferritic alloys with low alloy
content, do not undergo a secondary transformation from austenite to
ferrite as is usually experienced by low-alloy and carbon steel weld metals.
Upon solidification from liquid, δ-ferrite crystallization occurs in 2205
duplex stainless steels. Temperatures around 1200oC, solid phase
transformation takes place as the formation of allotriomorphic austenite
along the ferrite grain boundaries down to temperatures around 400oC.
Further cooling results in the formation of Widmanstatten austenite plates
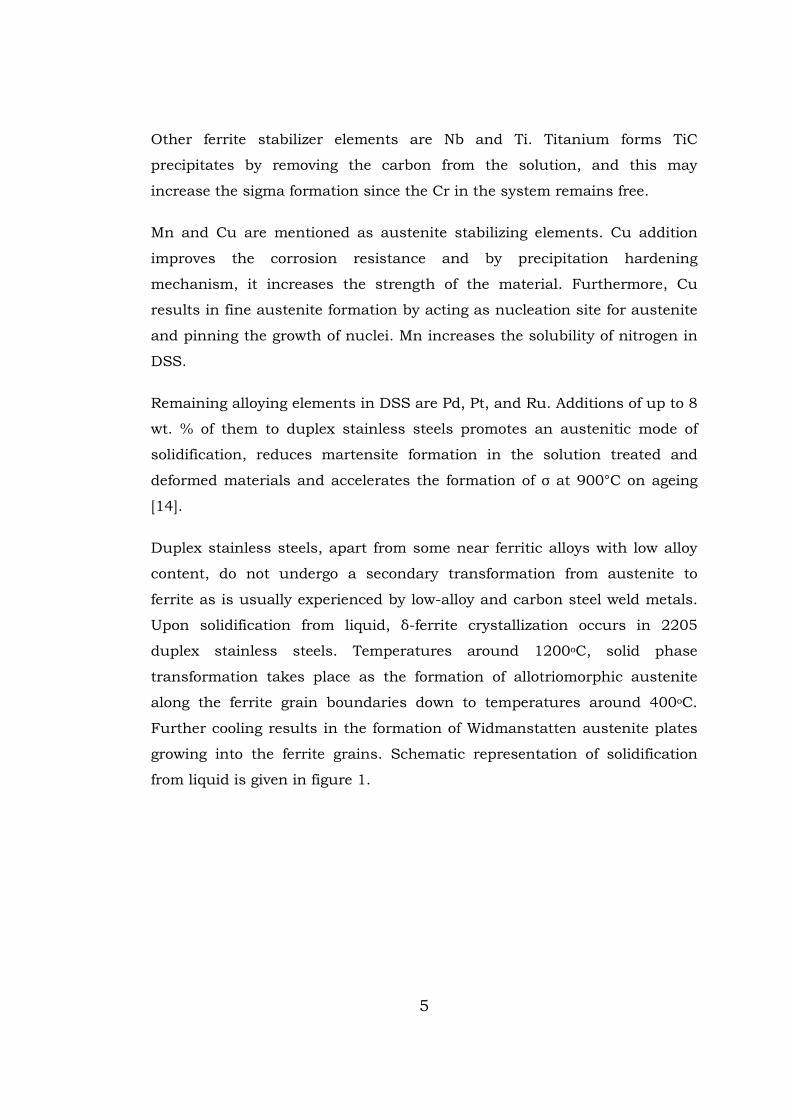
growing into the ferrite grains. Schematic representation of solidification
from liquid is given in figure 1.
6
Figure 1: Crystallization modes of duplex stainless steels; ferrite to austenite transformation at high temperatures (a) and (b), complete solidification to ferrite, austenite forms from solid-solid transformation (c) [10].
The solid state transformation is diffusion controlled. The austenite phase is
Ni and N enriched whereas Cr and Mo are found in ferrite phase [15]. The
nucleation rate of austenite in ferrite is very high. However, transformation
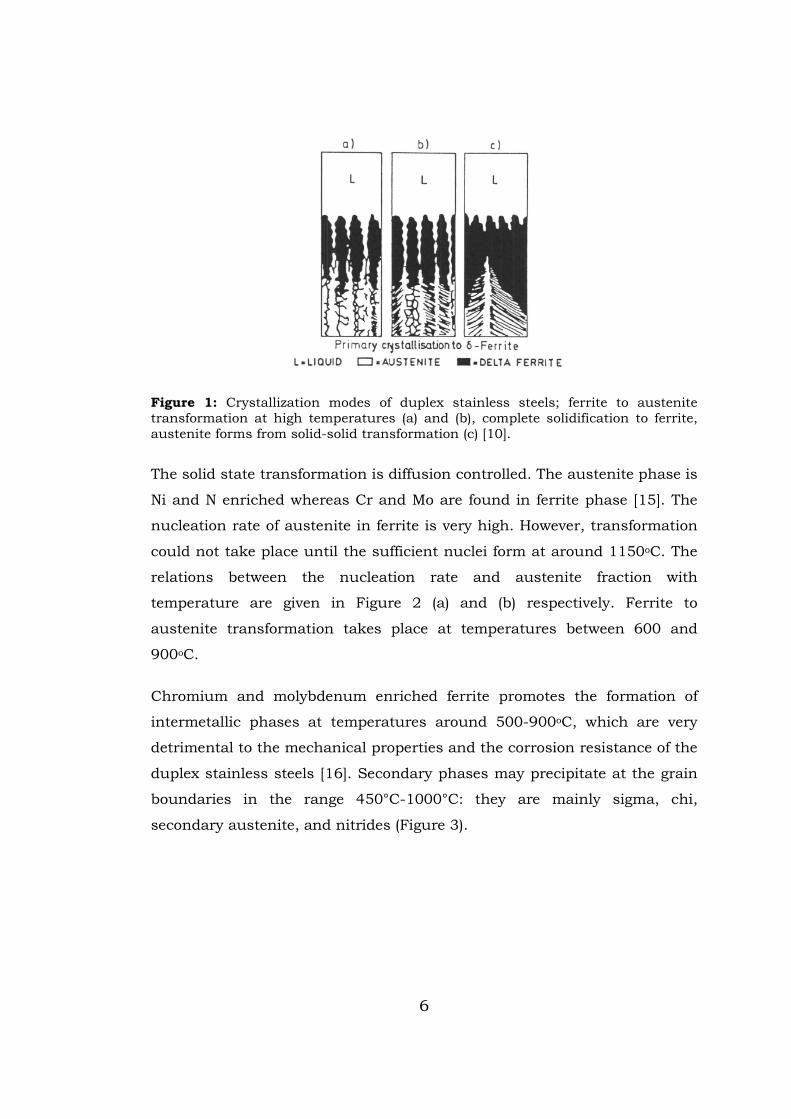
could not take place until the sufficient nuclei form at around 1150oC. The
relations between the nucleation rate and austenite fraction with
temperature are given in Figure 2 (a) and (b) respectively. Ferrite to
austenite transformation takes place at temperatures between 600 and
900oC.
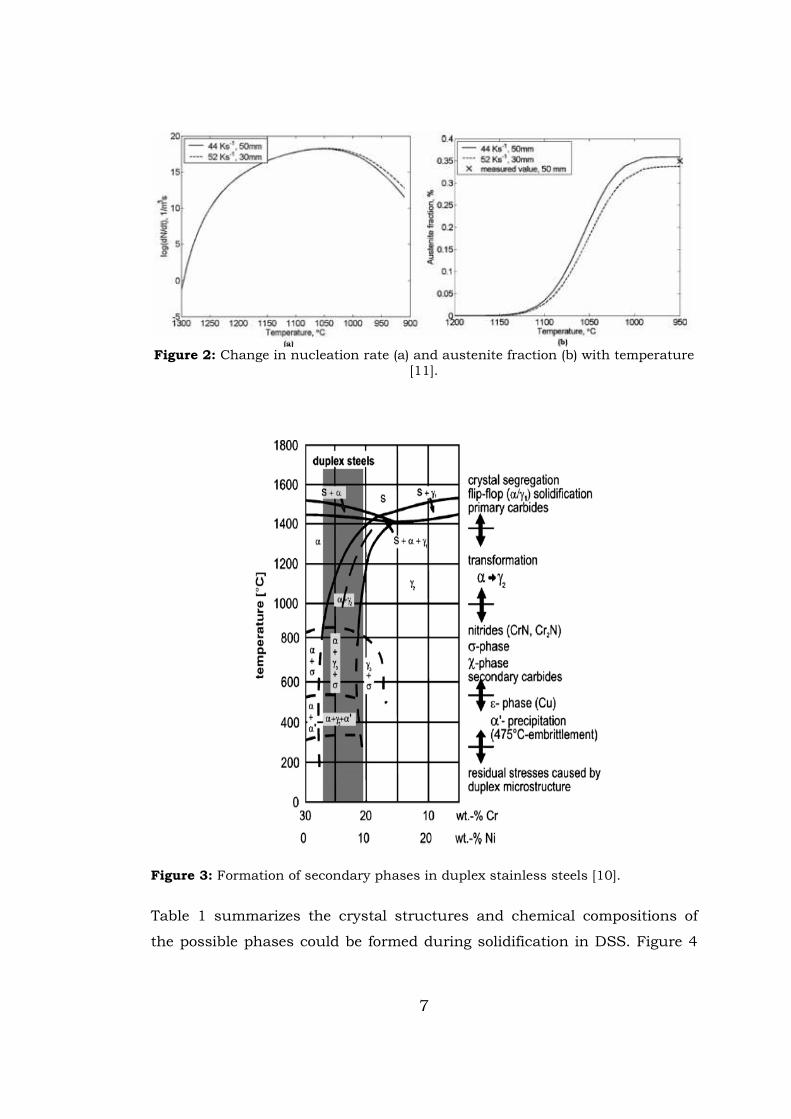
Chromium and molybdenum enriched ferrite promotes the formation of
intermetallic phases at temperatures around 500-900oC, which are very
detrimental to the mechanical properties and the corrosion resistance of the
duplex stainless steels [16]. Secondary phases may precipitate at the grain
boundaries in the range 450°C-1000°C: they are mainly sigma, chi,
secondary austenite, and nitrides (Figure 3).
7
Figure 2: Change in nucleation rate (a) and austenite fraction (b) with temperature [11].
Figure 3: Formation of secondary phases in duplex stainless steels [10].
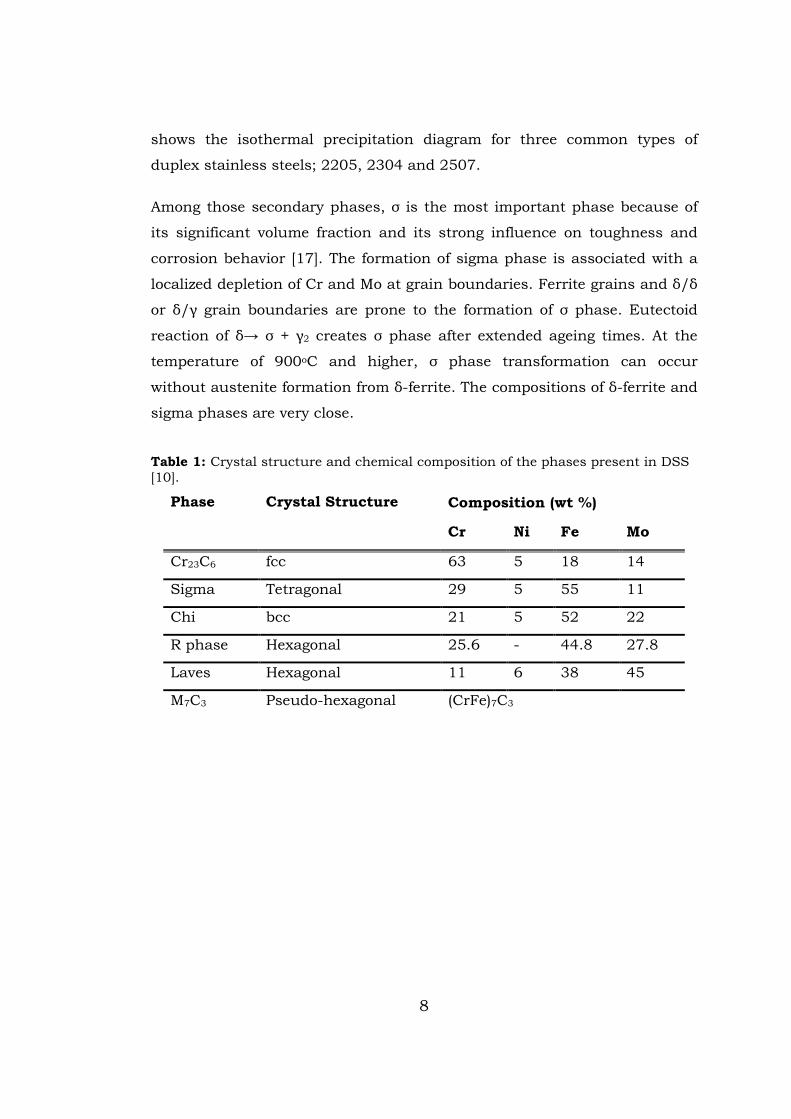
Table 1 summarizes the crystal structures and chemical compositions of
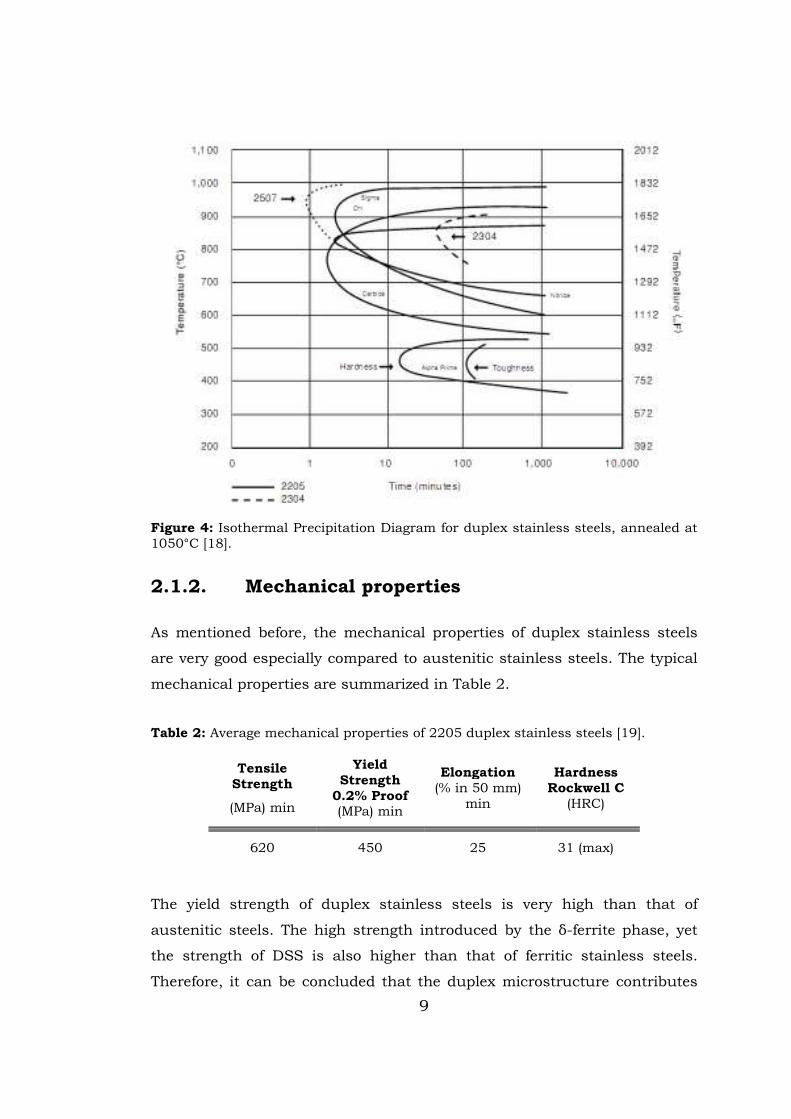
the possible phases could be formed during solidification in DSS. Figure 4
8
shows the isothermal precipitation diagram for three common types of
duplex stainless steels; 2205, 2304 and 2507.
Among those secondary phases, σ is the most important phase because of
its significant volume fraction and its strong influence on toughness and
corrosion behavior [17]. The formation of sigma phase is associated with a
localized depletion of Cr and Mo at grain boundaries. Ferrite grains and δ/δ
or δ/γ grain boundaries are prone to the formation of σ phase. Eutectoid
reaction of δ→ σ + γ2 creates σ phase after extended ageing times. At the
temperature of 900oC and higher, σ phase transformation can occur
without austenite formation from δ-ferrite. The compositions of δ-ferrite and
sigma phases are very close.
Table 1: Crystal structure and chemical composition of the phases present in DSS [10].
Phase Crystal Structure Composition (wt %)
Cr Ni Fe Mo
Cr23C6 fcc 63 5 18 14
Sigma Tetragonal 29 5 55 11
Chi bcc 21 5 52 22
R phase Hexagonal 25.6 - 44.8 27.8
Laves Hexagonal 11 6 38 45
M7C3 Pseudo-hexagonal (CrFe)7C3
9
Figure 4: Isothermal Precipitation Diagram for duplex stainless steels, annealed at 1050°C [18].
2.1.2. Mechanical properties
As mentioned before, the mechanical properties of duplex stainless steels
are very good especially compared to austenitic stainless steels. The typical
mechanical properties are summarized in Table 2.
Table 2: Average mechanical properties of 2205 duplex stainless steels [19].
Tensile Strength
(MPa) min
Yield Strength
0.2% Proof (MPa) min
Elongation (% in 50 mm)
min
Hardness Rockwell C
(HRC)
620 450 25 31 (max)
The yield strength of duplex stainless steels is very high than that of
austenitic steels. The high strength introduced by the δ-ferrite phase, yet
the strength of DSS is also higher than that of ferritic stainless steels.
Therefore, it can be concluded that the duplex microstructure contributes
10
to the high strength since there exists a mutual hindering of the growth of
grains leading to a fine grain structure. Furthermore, nitrogen in austenite
gives rise to interstitial solid solution hardening, and this may cause to
austenite having a higher strength even than δ-ferrite. The overall high
strength of DSS can be linked to the presence of δ-ferrite phase, small grain
size, formation of hard secondary austenite, and interstitial and
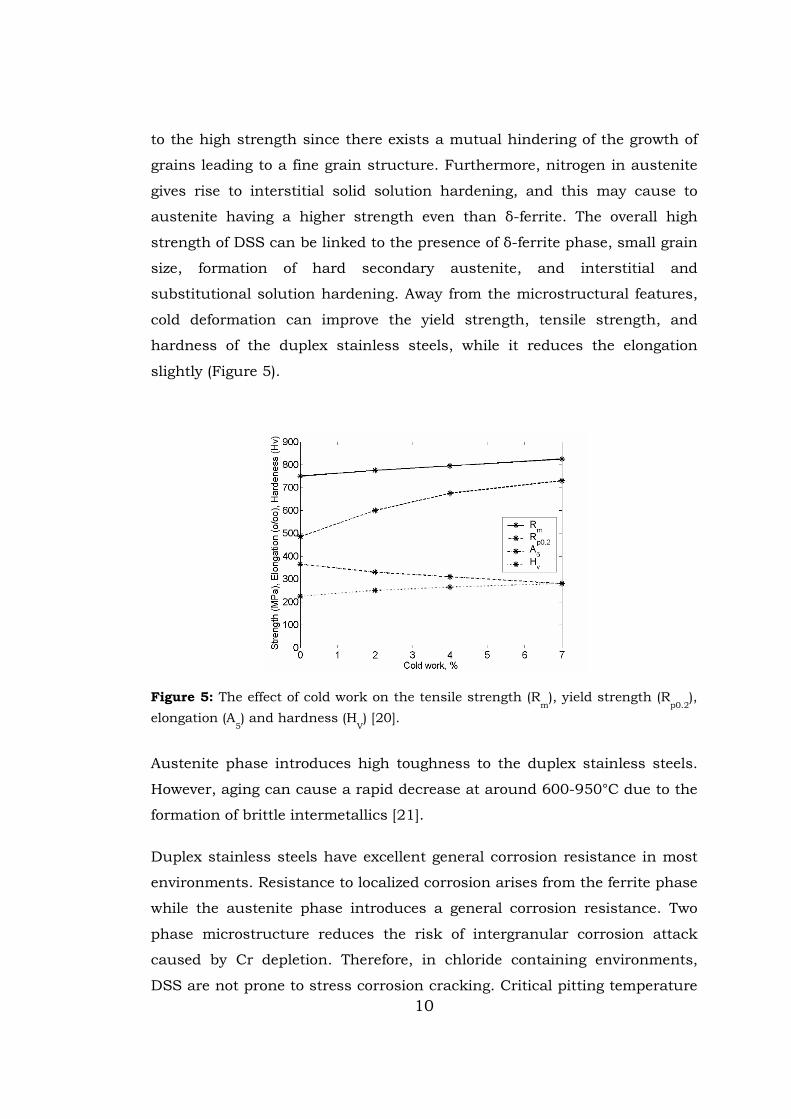
substitutional solution hardening. Away from the microstructural features,
cold deformation can improve the yield strength, tensile strength, and
hardness of the duplex stainless steels, while it reduces the elongation
slightly (Figure 5).
Figure 5: The effect of cold work on the tensile strength (Rm), yield strength (R
p0.2),
elongation (A5) and hardness (H
V) [20].
Austenite phase introduces high toughness to the duplex stainless steels.
However, aging can cause a rapid decrease at around 600-950°C due to the
formation of brittle intermetallics [21].
Duplex stainless steels have excellent general corrosion resistance in most
environments. Resistance to localized corrosion arises from the ferrite phase
while the austenite phase introduces a general corrosion resistance. Two
phase microstructure reduces the risk of intergranular corrosion attack
caused by Cr depletion. Therefore, in chloride containing environments,
DSS are not prone to stress corrosion cracking. Critical pitting temperature
11
(CPT) of 2205 duplex stainless steel is around 35oC. Grade 2205 will often
perform well in environments which cause premature failure of austenitic
stainless steels and have better resistance to sea water.
The fatigue strength of DSS corresponds approximately to the proof stress
of the material. Aging has a considerable effect on the crack growth rate of
duplex stainless steels [20]. Ferrite becomes very hard and only austenite
deforms plastically, while local brittle fracture occurs in ferrite. Increasing
the nitrogen content promotes the low cycle fatigue resistance by increasing
austenite formation [22].
2.1.3. Standards and codes defining Gr 2205
DSS are defined in both European and American codes and standards. EN
code of the grade 2205 is 1.4410, and it is 32205 by unified numbering
system, UNS.
DSS Gr 2205 plates, sheets and strips are designated as X2CrNiMoN22-5-3
as per EN 10088-2 [23], whereas seamless tubes and pipes made of the
material are designated in a same way according to EN 10216-5 [24].
Seamless and welded tubes and pipes of Gr 2205 are standardized in codes
ASTM A789 [25] and A790 [26], respectively. While ASTM A182 [27]
describes piping fittings made of stainless steels including Gr 2205, ASTM
A240 [19] defines plates, sheets and strips of the grade.
The material is approved by the American Society of Mechanical Engineers,
ASME, for use in accordance with ASME Boiler and Pressure Vessel Code,
section VIII, div. 1 and ASME B31.3 Chemical Plant and Petroleum Refinery
Piping. It is approved by ISO 15156-3/NACE MR 0175, Sulphide stress
cracking resistant material for oil field equipment, VdTÜV-Werkstoffblatt
508 and NGS 1609 Nordic rules.
12
2.2. Service Environment of Reaction Vessels
2.2.1. Definition, geometry, and manufacturing
Pressure vessels are used to store fluids under relatively high pressures.
Pressure Equipment Directive, PED, defines pressure vessels, in where the
pressure is above 0.5 atm [28].
Concerning stress and strain conditions, a sphere is the best shape for a
pressure vessel. However, this geometry is expensive to manufacture
therefore a common design including a cylindrical body and two heads,
which are typically either flat or semi-elliptical or hemi/tori-spherical, has
been usually employed for oil, (petro) chemical, nuclear, and mining
industries.
2.2.2. Stress and strain
If ratio of the inside radius to the wall thickness of the vessel is greater than
10, than the vessel is classified as thin-walled pressure vessel, which can be
considered under shell structures.
An enclosed fluid applies pressure to the shell uniform in magnitude. If the
pressure is more or less than the ambient pressure, some stresses and
consequently strains will evolve on the wall of the vessel. Stresses are due
to the resultant force, F, which is a product of the pressure, P, and internal
cross-sectional area of the shell; for cylindrical bodies the cross-sectional
area corresponds to πr2, where r is the radius of the cylinder.
� = � ��� (1)
Because the pressure and the vessel wall are symmetrical about the axis
shown in figure 5 (a), a circumferentially uniform longitudinal stress, σl, is
produced in the wall. For thin-walled pressure vessels, this stress can also
be assumed to be uniformly distributed across the wall thickness, t.
� = � 2��� (2)
13
� 2��� = � ��� (3)
Consequently, the longitudinal stress produced in the wall can be defined
as:
� = � ��
(4)
(a) (b)
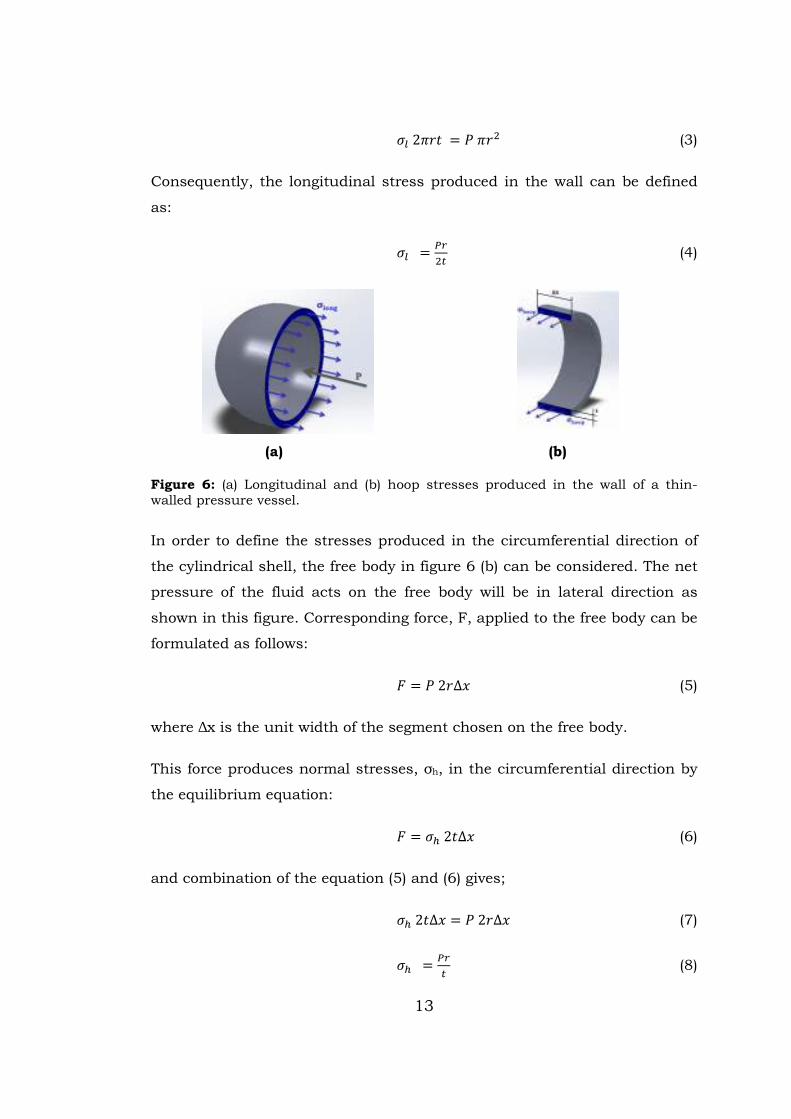
Figure 6: (a) Longitudinal and (b) hoop stresses produced in the wall of a thin-walled pressure vessel.
In order to define the stresses produced in the circumferential direction of
the cylindrical shell, the free body in figure 6 (b) can be considered. The net
pressure of the fluid acts on the free body will be in lateral direction as
shown in this figure. Corresponding force, F, applied to the free body can be
formulated as follows:
� = � 2�∆� (5)
where ∆x is the unit width of the segment chosen on the free body.
This force produces normal stresses, σh, in the circumferential direction by
the equilibrium equation:
� = �� 2�∆� (6)
and combination of the equation (5) and (6) gives;
�� 2�∆� = � 2�∆� (7)
�� = � � (8)
14
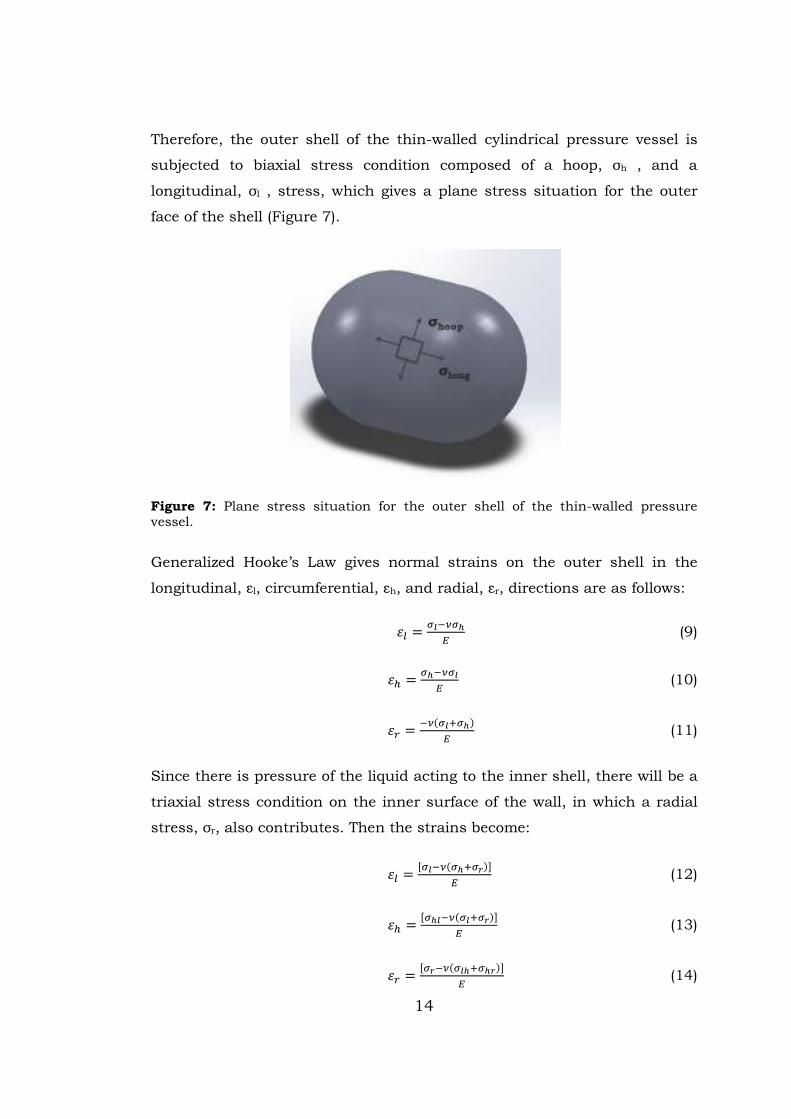
Therefore, the outer shell of the thin-walled cylindrical pressure vessel is
subjected to biaxial stress condition composed of a hoop, σh , and a
longitudinal, σl , stress, which gives a plane stress situation for the outer
face of the shell (Figure 7).
Figure 7: Plane stress situation for the outer shell of the thin-walled pressure vessel.
Generalized Hooke’s Law gives normal strains on the outer shell in the
longitudinal, εl, circumferential, εh, and radial, εr, directions are as follows:
� = ������
� (9)
�� = ������
� (10)
� = ���������
� (11)
Since there is pressure of the liquid acting to the inner shell, there will be a
triaxial stress condition on the inner surface of the wall, in which a radial
stress, σr, also contributes. Then the strains become:
� =�������������
� (12)
�� =��������������
� (13)
� =���������������
� (14)
15
For a vessel having 1000 liters of volume, 10 mm of shell thickness and
working under 50 bars with 2:1 semi-elliptical domed end caps,
longitudinal and hoop stresses evolved in the shell might reach about to
100 and 200 Nmm-2, respectively, which corresponds approximately to a
forth of ultimate tensile strength of the grade 2205. Corrosive environment
and service temperature are also taken into the consideration of shell
thickness.
2.2.3. Stresses on longitudinal and circumferential
joints
As explained in previous sub-section, hoop stresses are twice as large as the
longitudinal stresses introduced in the shell of thin-walled cylindrical
pressure vessels.
Due to the internal pressure acting on the inner shell of the vessel, there is
an additional stress called radial stress, which is equal to the absolute
amplitude of the pressure:
� = −� (15)
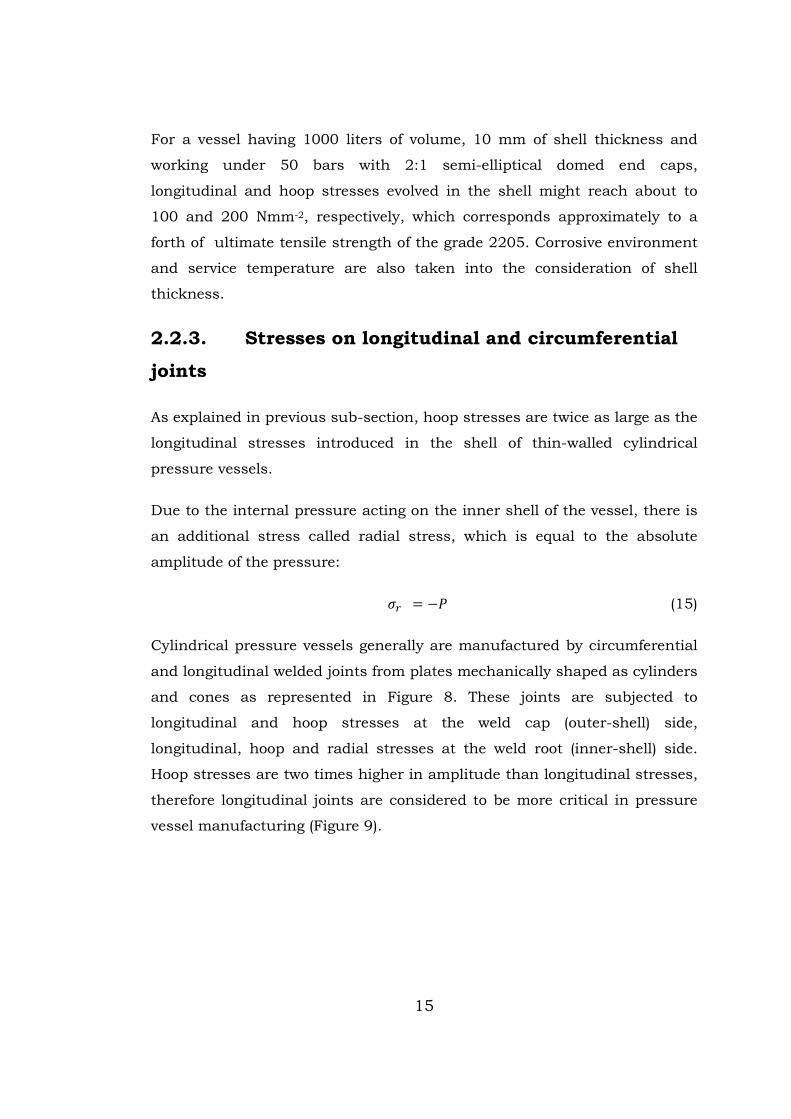
Cylindrical pressure vessels generally are manufactured by circumferential
and longitudinal welded joints from plates mechanically shaped as cylinders
and cones as represented in Figure 8. These joints are subjected to
longitudinal and hoop stresses at the weld cap (outer-shell) side,
longitudinal, hoop and radial stresses at the weld root (inner-shell) side.
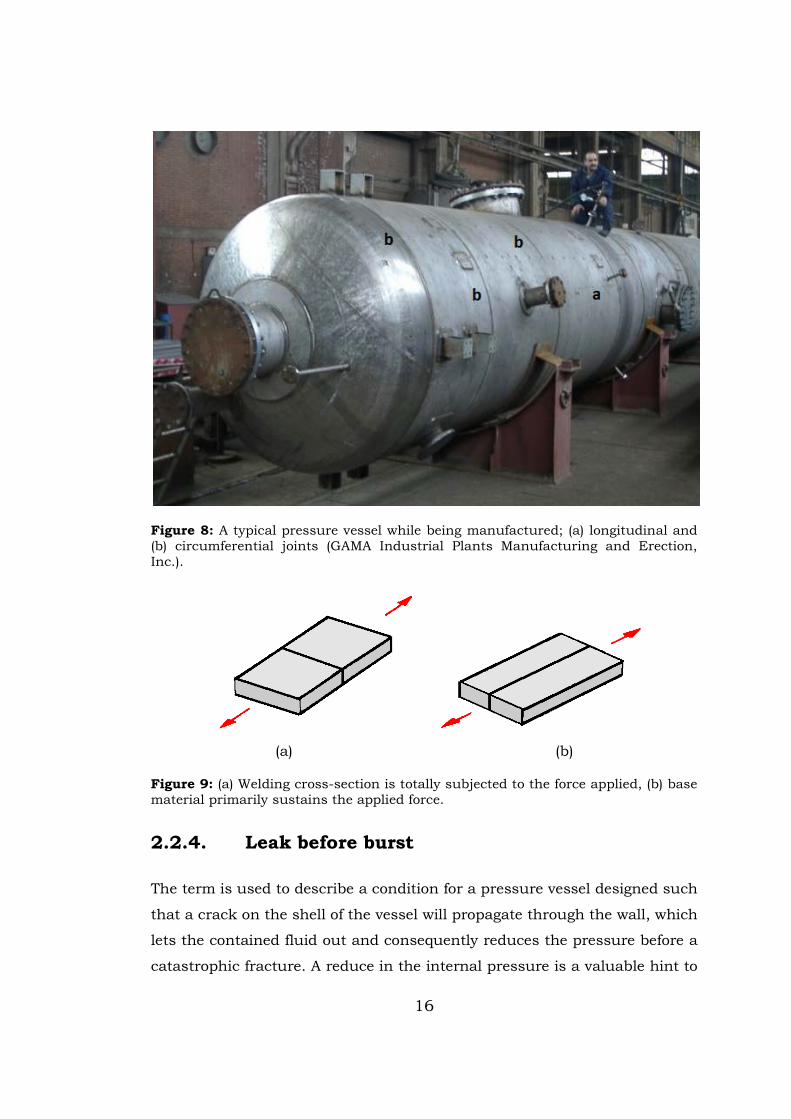
Hoop stresses are two times higher in amplitude than longitudinal stresses,
therefore longitudinal joints are considered to be more critical in pressure
vessel manufacturing (Figure 9).
16
Figure 8: A typical pressure vessel while being manufactured; (a) longitudinal and (b) circumferential joints (GAMA Industrial Plants Manufacturing and Erection, Inc.).
(a) (b)
Figure 9: (a) Welding cross-section is totally subjected to the force applied, (b) base material primarily sustains the applied force.
2.2.4. Leak before burst
The term is used to describe a condition for a pressure vessel designed such
that a crack on the shell of the vessel will propagate through the wall, which
lets the contained fluid out and consequently reduces the pressure before a
catastrophic fracture. A reduce in the internal pressure is a valuable hint to
17
understand that there is a source of leak like cracks. Once it is understood,
it is possible to detect the place of the crack by non-destructive inspection
techniques.
Generally, pressure vessels are designed for pressure loading of non-cyclic
nature. Design By Formulae section of EN 13445-3 [29] provides
satisfactory designs when the number of pressure cycles is less than 500
with the safety factor 4 on the ultimate tensile strength, whereas ASME
Code [30] takes 1000 with the safety factor of 2.4. As compared with
structures subjected to cycling loading like steel or aluminum
constructional members, cranes, vehicle components et cetera, fatigue
failures are comparatively rare in pressure vessels. However, the avoidance
of fatigue is still an important design criterion and the fatigue design rules
occupy a considerable per cent of EN 13445-3 [29].
2.2.5. Crack propagation in weldments
In weldments, crack initiation can be suppressed by controlling the
microstructure of weld metal and HAZ ensuring that the fracture toughness
is sufficiently high for the stress levels to be experienced. However all
welding joints consist some discontinuities and a linear discontinuity may
be above the critical size for crack initiation. Therefore predicting crack
propagation kinetics becomes important not only for the components that
are working under considerable cycling stress amplitudes, but also for
pressure vessels. Certain mechanical and thermal stresses are introduced
to a vessel during system start-up, shutdown, and other changes in the
working condition.
The fatigue strength of weldments is primarily governed by their physical
profile. Fracture mechanics model and an experimental approach was used
to investigate the effect of plate thickness on the fatigue strength of
transverse fillet welds in axial loading [31]. Meanwhile, some researchers
used a linear elastic fracture mechanics (LEFM) model to predict the fatigue
life of the T joint [32]. Concerning full penetration butt (groove) welds where
the reinforcement and excess root have been removed, discontinuities in
18
weld metal and partially melted zone (fusion line) become effective in
predicting the fatigue behavior. Linear discontinuities like slag inclusions,
gas pores and lack of penetration are common in weld joints. Tips of such
linear discontinuities are stress concentrators, which becomes preferable
crack initiation sites, with subsequent crack propagation causing structural
failure.
Moreover, owing to incompatible thermal strains caused by heating and
cooling cycles while welding, weldments contain residual stresses up to
yield strength in magnitude. Residual stresses act as a mean stress and
reduce the fatigue strength of the joint. The LEFM fatigue life prediction
analysis was modified based on an effective stress range and, in doing so,
was able to model the residual-stress effect on short-crack growth in as-
welded cruciform joints [33].
2.3. Weldability of Duplex Stainless Steels
DSS, combining useful properties of both ferritic and austenitic stainless
steels, have been preferred in many engineering applications. DSSs are
fusion weldable however; their corrosion resistance and mechanical
properties should be adjusted by proper welding parameters that give
almost equal phase balance in between austenite and δ-ferrite. Studies has
represented that DSS weldments have optimum corrosion and mechanical
properties when 35 to 60 % δ-ferrite is maintained. If the δ-ferrite content
exceeds 60%, the pitting resistance and ductility considerably decreases.
On the other hand, if the δ-ferrite content stays below 35% than it means te
solidification mode has changed and detrimental precipitates have formed,
which reduces stress corrosion cracking resistance and impact toughness.
An imbalance phase distribution may also cause worse fracture toughness
and fatigue properties, which are originally other advantages of DSS.
Cooling rate is one of the most important affecting factors for as-welded
microstructure of DSSs, which has upper and lower limits in order to have
desired metallurgy. Low cooling rates reveal formation of intermetallic
phases, whereas high cooling rates may give δ-ferrite content more than
19
60%. Cooling rate can be adjusted by welding heat input for a specific
composition and thickness of the base metal to be welded.
Heat affected zone, HAZ, of DSS is narrower than austenitic stainless steels.
DSS weldments have about 50 µm-wide HAZ, which correspond only a
couple of grains. Therefore, it is hard to test the impact toughness
properties of DSS HAZ by conventional methods [34].
2.3.1. Conventional arc welding methods
Almost all common arc welding methods can be utilized in welding of DSS.
Gas tungsten arc welding, GTAW (TIG, 141), shielded metal arc welding,
SMAW (E, 111), submerged arc welding, SAW (UP, 12), gas metal arc
welding, GMAW (MAG, 135) and flux cored arc welding, FCAW (MAG, 136)
have conventionally been used.
Arc welding is a sort of fusion welding, which is a local casting process with
respect to the weld seam. Parts to be welded become dies in this casting
project and they are subjected to the temperatures from melting point of the
base material to ambient temperature. Thus, the metallurgy of the
weldment is different from the base material, and the metallurgy of
neighboring zones is modified by the heat of welding.
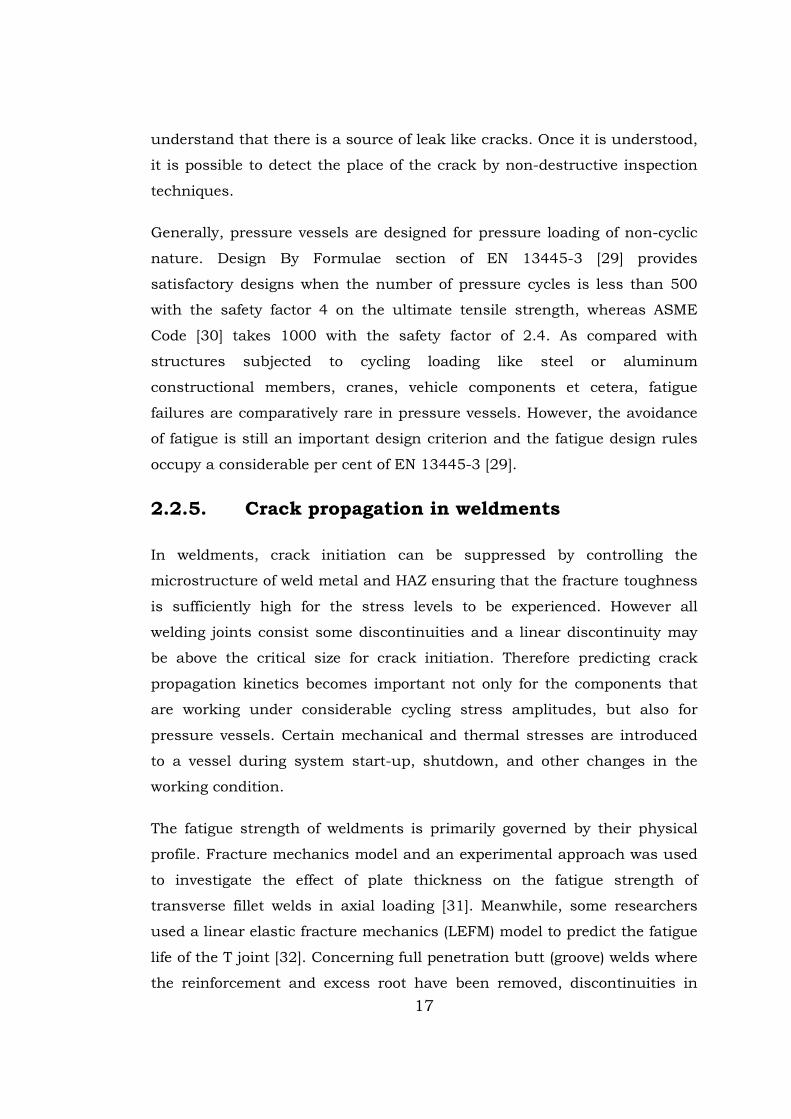
Figure 10 represents weld metal and heat affected zone microstructures
from a super-DSS, 2507 joint by SMAW. δ-ferrite /austenite phase balance
in base metal changes in annealed zones by the weld heat input. Besides
the partially annealed region of the heat affected zone, HAZ is characterized
by significant grain growth compared to the base metal. This portion is
heated into the two-phase domain. An amount of original δ-ferrite has
transformed to austenite on cooling. On the other hand, the over-heated
zone is characterized by a relatively lower amount of austenite compared to
the melted and partially annealed zones; consequently, a high level of the δ-
ferrite phase was present in this region. In the fusion zone (weld metal),
austenite precipitates at the boundaries of δ-ferrite grains (allotriomorphic
austenite). It is also possible to see austenite grains in the form of
20
Widmanstätten plates and acicular precipitates (secondary austenite) within
the matrix of δ-ferrite in the multi-pass weldments.
a b c d
Figure 10: A typical melt-in fusion welded DSS joint; (a) base metal, (b) heat affected zone, (c) fusion line, and (d) weld metal microstructures revealed via Beraha II etchant [35].
Gas-shielded processes give better low-temperature impact toughness in
DSS weldments than flux-shielded ones [36]. Although pure Ar is enough to
get DSS weldments having good corrosion properties, N are usually added
to shielding, N or N and H2 mixtures can be used as backing gases in order
to increase austenite content in the microstructure.
Filler metals consist of extra Ni in order to ensure an appropriate phase
balance in the weld metal via promoting transformation from δ-ferrite to
austenite and consequently delaying the formation of intermetallics. N
additions to filler metals help preventing the precipitating of σ.
Autogenous welding processes are not recommended for DSS, since such
processes create welds with very high amount of δ-ferrite [37]. However, a
post-weld normalization treatment after autogenous welding processes like
laser beam, electron beam and plasma arc welding can be utilized to get
21
proper phase balance. Besides improvement of hybrid welding techniques of
such keyhole processes, in which filler can be added to the weld pool, has
started to be applied in DSS welding [38].
2.3.2. Preheating and post weld heat treatment
(PWHT)
Depending upon the alloying content, embrittlement may arise at the heat
affected zone while welding of steels due to hardening and hydrogen
entrapment at relatively fast cooling. In order to avoid embrittlement, the
cooling rate must be reduced. Preheating is a way to reduce cooling rates
via generating hot spots.
If the expected operating loads make it necessary to reduce residual
stresses in welded joints, a post-weld heat treatment, PWHT, is utilized to
relieve such stresses. Cold cracking susceptibility due to hydrogen
embrittlement is sometimes another reason to perform PWHT for
weldments.
Preheating is not recommended for DSS welding because it reduces the
cooling rate and may lead formation of undesired phases. Stress relieving
post-weld heat treatment processes under AC1 is not applied for DSS
because of the risk of intermetallics formation during the treatment.
Weldments for sour applications require full solution annealing followed by
quenching.
2.3.3. Interpass temperature and heat input
Weld heat input is a major affecting factor for the cooling rate of the weld
zones. Higher the heat input, lower the cooling rate, and vice versa. Since
there are upper and lower limits for cooling rate for fusion welding of DSS,
heat input should also be limited in a range, which is in between 0.5 to 2.5
kJ/mm.
22
Metallurgical and mechanical properties of weldments are further
determined by the cycles of temperature and the duration of welding
process besides the heat input. The maximum recommended interpass
temperature is in between 180 to 200oC. Exceeding advised interpass
temperature limits might cause embrittlement and low impact values for
HAZ and lower passes.
2.4. Hybrid Plasma Arc Welding
Hybrid welding is defined by the American Welding Society as the
combination two distinct welding energy sources within a single welding
process. In fusion welding methods, Hybrid Laser Arc Welding, HLAW, is
one of the most popular welding technique, which combines the advantages
of a laser beam giving very deep penetration with very low heat input and
GMAW giving a considerable deposition rate. Instead of a laser beam, a
concentrated plasma arc is preferred for pieces to be welded, where fit-up
tolerances are not so tight.
Hybrid Plasma Arc Welding, HPAW, method combines a plasma arc and a
gas metal arc into one process. HPAW comprises a sintered tungsten alloy
electrode next to a filler wire electrode within a single welding torch. The
tungsten electrode is positioned within a fine-bore copper nozzle, in which
plasma is forced through. The plasma constricts the arc formed between the
non-consumable tungsten electrode and the workpiece by leaving the orifice
at high velocities just below the speed of sound. The plasma arc is at the
leading position of the welding process, and it creates a keyhole through the
thickness of the material. The gas metal arc follows the primary arc and fills
the void formed by it (Figure 11).
23
Figure 11: Elements of the HPAW; (1) workpiece; (2) plasma jet; (3) plasma nozzle; (4) melting metal; (5) plasma arc electrode axis; (6) wire axis; (7) angle between electrode’s axes; (8) tungsten electrode; (9) consumable electrode (wire); (10) GMAW arc; (11) plasma; (12) wire current (Iw) direction; (13) plasma current (Ip) direction; (14) magnetic forces applied to plasma arc; (15) magnetic forces applied to GMAW arc [39].
The tungsten electrode operates at direct current electrode negative, DCEN,
or in other words straight polarity, DCSP, whereas filler wire electrode
operates at direct current electrode positive, DCEP, or in other words
reverse polarity, DCRP. Two arcs having different polarities apply a
magnetic force to each other, which causes a deflection especially of the
plasma arc toward the secondary arc. An additional magnetic field is
introduced in between two arcs to neutralize this tendency and keep the
primary arc toward the front of the weld pool.
2.4.1. Marangoni Effect
The convective flowing of the molten metal from the centre towards the edge
is the phenomenon that is called Marangoni-effect. It is working when the
gradient of the surface tension of the weld pool is negative [40]. The
“reversed Marangoni-effect theory” of HPAW states that the active flux turns
the gradient of surface tension of the weld pool from negative (-) to positive
(+) which leads to the reversed circulation of the molten metal in the weld
pool (Figure 12). The reversed circulation of the weld pool thus keeps
towards the centre line and is more intensive. This result finally in deeper
penetration compared to conventional welding methods in which the
surface tension gradient of the weld pool is from positive (+) to negative (-).
24
To prove or confute this theory the nitrogen sensitivity of phase balance of
duplex would be a very good tool.
Figure 12: (a) Reversed Marangoni Effect, (b) Marangoni Effect [40].
25
CHAPTER 3
EXPERIMENTAL STUDIES
3.1. Base Metal Characterization
Standard characterization techniques were used to identify the material
received. Duplex stainless steel plates, conforming to ASTM A240 S32205,
were obtained and sectioned to the dimensions of 8 mm-thick, 50 mm-wide
and 100 mm-long [19]. The chemical constituent of the material was
analyzed as per ISO 14284 by spectral analysis [41]. The material was
solutionized at 1100oC, and then quenched.
Table 3: Chemical composition requirements for S32205 (2205) in wt % [19].
C Mn P S Si Cr Ni Mo N
0.030 2.00 0.030 0.020 1.00 22.0–23.0 4.5–6.5 3.0–3.5 0.14–0.20
For microstructural analysis and hardness measurements, received
material was sectioned, grinded on silicon carbide paper mechanically down
to 1200 grit, and polished up to ¼ µm with alumina. Electrochemical and
color etchants were used to reveal the microstructure. Electrolytic etching
was performed with 25 wt% NaOH in aqueous solution for 10 seconds at 4
volts. Beraha’s etchant, 10 ml HCl, 100 ml H2O and 0.5 gram K2S2O5, was
used in a fresh condition for color etching. Moreover, material was grinded
into powder for XRD (X-Ray Diffraction) measurements. X-ray
diffractograms were obtained via CuKg radiation and at 2θ range from 20o to
70o with the scanning rate of 0.5 o/min for phase identification.
26
For mechanical characterization, micro hardness measurements according
to the ASTM E92, with Vickers square-based pyramidal diamond indenter
were performed according to the ASTM E92 for each phase. Mechanical
requirements of 2205 duplex stainless steel defined by the related standard
are given in Table 4.
Table 4: Mechanical test requirements for S32205 (2205) [19].
Tensile Strength (min) MPa
Yield Strength (min) MPa
Elongation (min) %
Hardness (max) HBW
655 450 25 293
Charpy impact toughness tests were conducted for standard
characterization, in two dimensions with five specimens for each dimension
at -50oC in accordance with EN 100045-1. Standard Charpy impact
specimens were prepared with 10x10x55 (mm3) dimensions and 2 mm V-
notches (Figure 13).
Figure 13: Charpy impact toughness specimen dimensions [42].
Fatigue crack propagation tests were conducted by servo hydraulic machine
for comparison the favorable path of crack growth to that of welded joints,
according to the ASTM E647. The test was carried out with the same
procedure of welded joints which will be explained in section 3.6.
3.2. Welding Parameters
Plates were sectioned to the dimensions of 8 mm-thick, 50 mm-wide and
100 mm-long, and then beveled as per welding technique. Plates were
27
joined by Hybrid Plasma Arc Welding, HPAW, and Gas Metal Arc Welding,
GMAW, techniques at the flat position (1G / PA). The pieces were clamped
to a welding platform and the torch was driven by the action of a single-axis
translation stage. The contact tube spacing was manually set prior to
commencing each weld.
While an arc exists between the filler wire electrode and the workpiece in
GMAW, two different arcs exist simultaneously in HPAW; a straight polarity
direct current between the workpiece and tungsten electrode and a reversed
polarity direct current between the filler wire electrode and the workpiece. A
lanthanated tungsten electrode, 2.4 mm in diameter, was used for the
HPAW. Weld bevel geometries and welding parameters, subjected to the
studies, will be given in chapter 4. Duplex stainless steel solid wire
electrodes, 1.2 mm in diameter, conforming to SFA/AWS 5.9 ER2209 and ;
ISO 14343 G 22 9 3 NL were utilized in both welding techniques (Table 5).
An argon-2% O2 mixture of gas was used for shielding of the solidifying weld
metal and heat affected zone (HAZ) for both techniques. High purity argon
(99.999%) was used as orifice gas with the flow rate of 4 lt/min while HPAW
performances. The soundness of the resulting test weld joint was confirmed
using macro examinations (Figure 14).
Table 5: Chemical composition of the filler wire in wt %.
C Mn Si P S N Cr Ni Mo
0.012 1.57 0.42 0.007 0.002 0.15 23.1 8.84 3.21
Heat input comparisons of each welding were carried out. Heat input was
calculated from the measured values of arc voltage, current and travel
speed. It is simply the ratio of the power to the velocity of the heat source.
Heat input is a relative measure of the energy transferred during welding.
Equations (16) and (17) show the heat input calculations. During the
calculations, basic line energy and heat input definitions were utilized. Heat
Input, H (kJ/mm), is a product of Line Energy and Efficiency Factor, η, for
a specific welding method, where η is assumed 0.85 for GMAW and 0.5 for
HPAW:
28
= ! × # (16)
Line Energy, E (kJ/mm), is a product of welding power and linear welding
speed, LWS:
! = ��$%&�'()�** +,-⁄ �
(17)
Cooling rates were recorded during welding performances by both key hole
and GMAW techniques. From 1200oC down to 200oC, the readings were
carried out with type-K chromel thermocouples at the center of weld pools
with a sensitivity of 41µV/oC.
3.3. Weld Metal Microstructural Characterization
The plates joined using both techniques were sectioned transverse to the
weld direction for microstructural characterization. Grinding was carried
out with various grades of SiC papers down to 1200 grit followed by
polishing using 6, 1, and ¼ µm alumina colloidal. The samples were etched
with both Beraha II and Aqua Regia (3ml HCl, 1ml HNO3) reagents and,
electrolytic etching (aqueous 20% NaOH -4 V dc, 10 s). The specimens were
examined using light optical microscopy, LOM and scanning electron
microscopy, SEM.
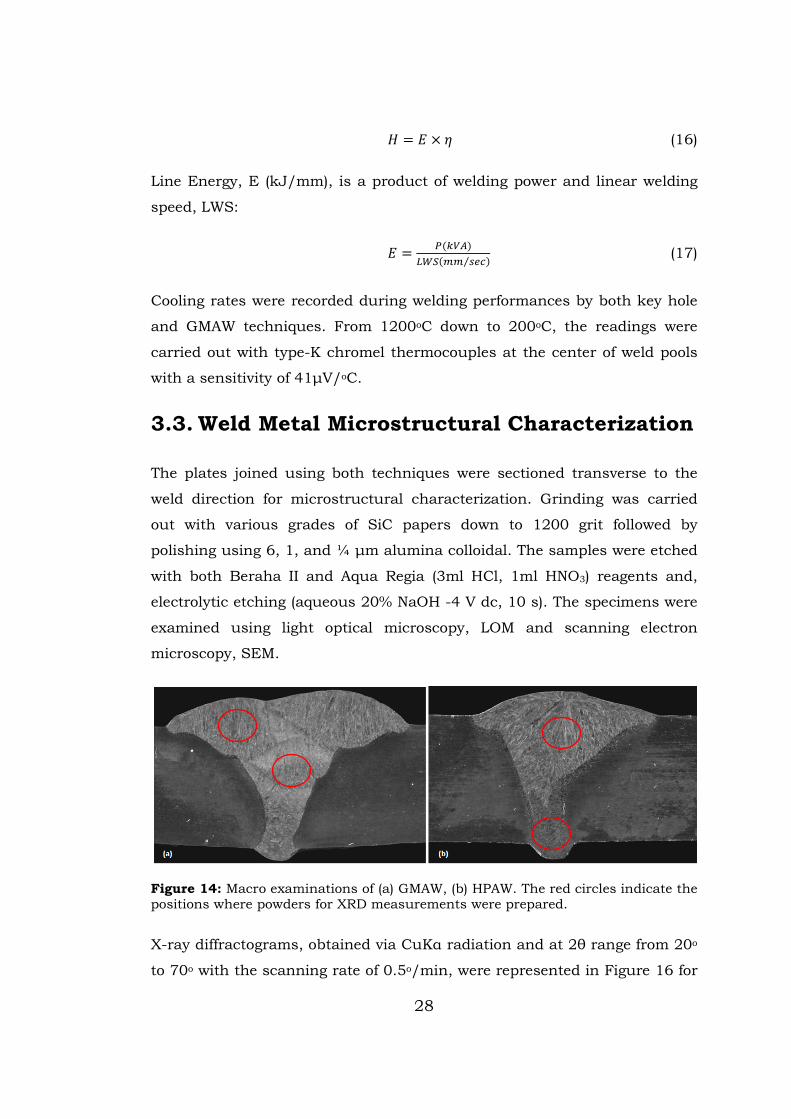
Figure 14: Macro examinations of (a) GMAW, (b) HPAW. The red circles indicate the positions where powders for XRD measurements were prepared.
X-ray diffractograms, obtained via CuKα radiation and at 2θ range from 20o
to 70o with the scanning rate of 0.5o/min, were represented in Figure 16 for
29
different weld and heat affected zones, HAZ, by both technique, and base
metal as well.
3.4. Hardness and Charpy Impact Toughness of
Weld Metals
The pieces were subjected to Charpy impact toughness tests at -50oC in
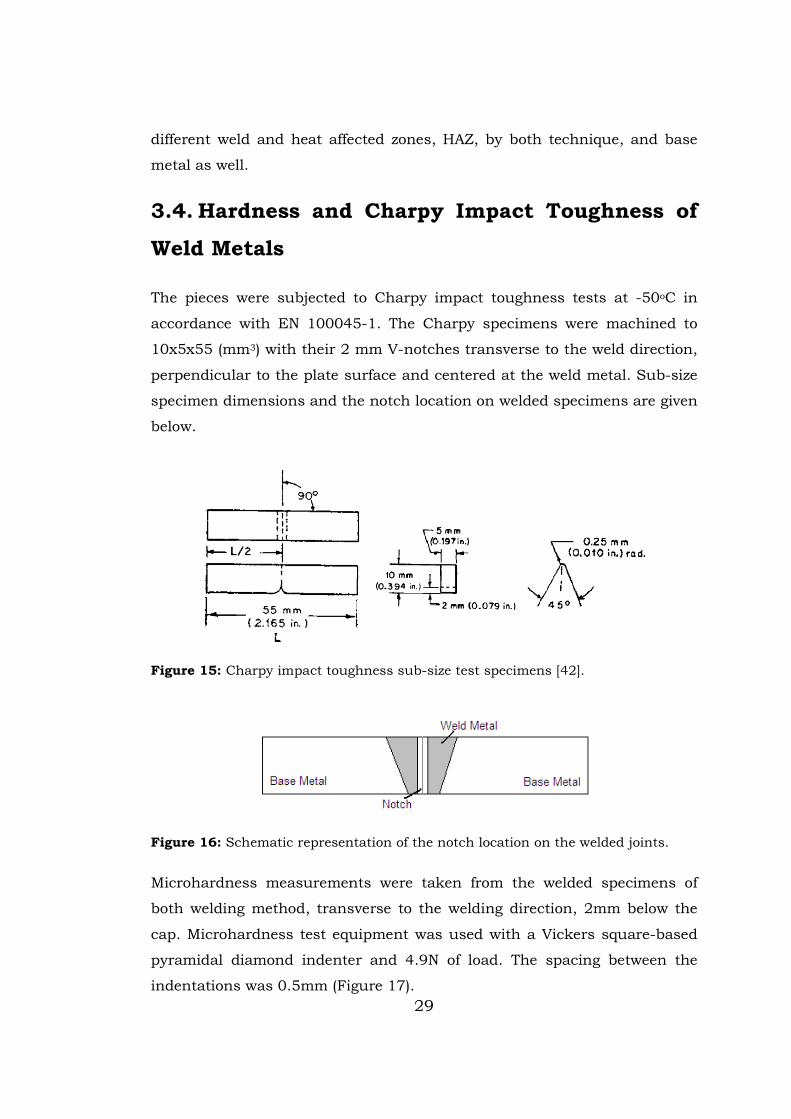
accordance with EN 100045-1. The Charpy specimens were machined to
10x5x55 (mm3) with their 2 mm V-notches transverse to the weld direction,
perpendicular to the plate surface and centered at the weld metal. Sub-size
specimen dimensions and the notch location on welded specimens are given
below.
Figure 15: Charpy impact toughness sub-size test specimens [42].
Figure 16: Schematic representation of the notch location on the welded joints.
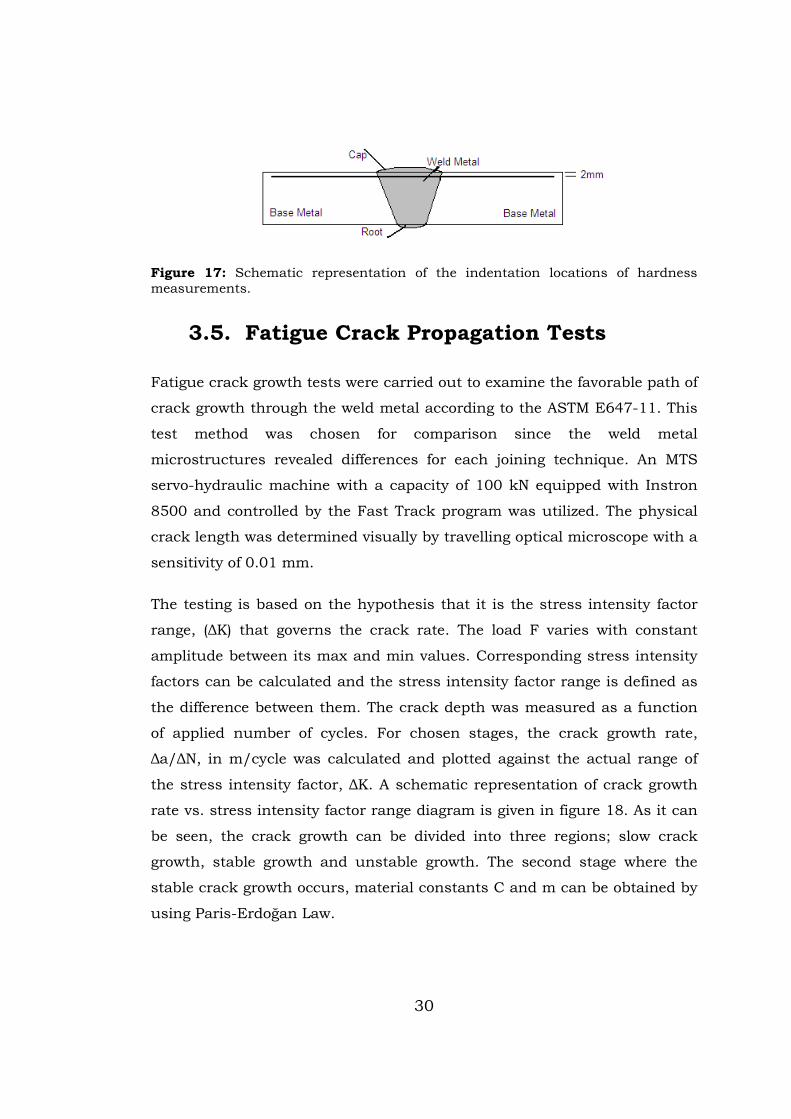
Microhardness measurements were taken from the welded specimens of
both welding method, transverse to the welding direction, 2mm below the
cap. Microhardness test equipment was used with a Vickers square-based
pyramidal diamond indenter and 4.9N of load. The spacing between the
indentations was 0.5mm (Figure 17).
30
Figure 17: Schematic representation of the indentation locations of hardness measurements.
3.5. Fatigue Crack Propagation Tests
Fatigue crack growth tests were carried out to examine the favorable path of
crack growth through the weld metal according to the ASTM E647-11. This
test method was chosen for comparison since the weld metal
microstructures revealed differences for each joining technique. An MTS
servo-hydraulic machine with a capacity of 100 kN equipped with Instron
8500 and controlled by the Fast Track program was utilized. The physical
crack length was determined visually by travelling optical microscope with a
sensitivity of 0.01 mm.
The testing is based on the hypothesis that it is the stress intensity factor
range, (∆K) that governs the crack rate. The load F varies with constant
amplitude between its max and min values. Corresponding stress intensity
factors can be calculated and the stress intensity factor range is defined as
the difference between them. The crack depth was measured as a function
of applied number of cycles. For chosen stages, the crack growth rate,
∆a/∆N, in m/cycle was calculated and plotted against the actual range of
the stress intensity factor, ∆K. A schematic representation of crack growth
rate vs. stress intensity factor range diagram is given in figure 18. As it can
be seen, the crack growth can be divided into three regions; slow crack
growth, stable growth and unstable growth. The second stage where the
stable crack growth occurs, material constants C and m can be obtained by
using Paris-Erdoğan Law.
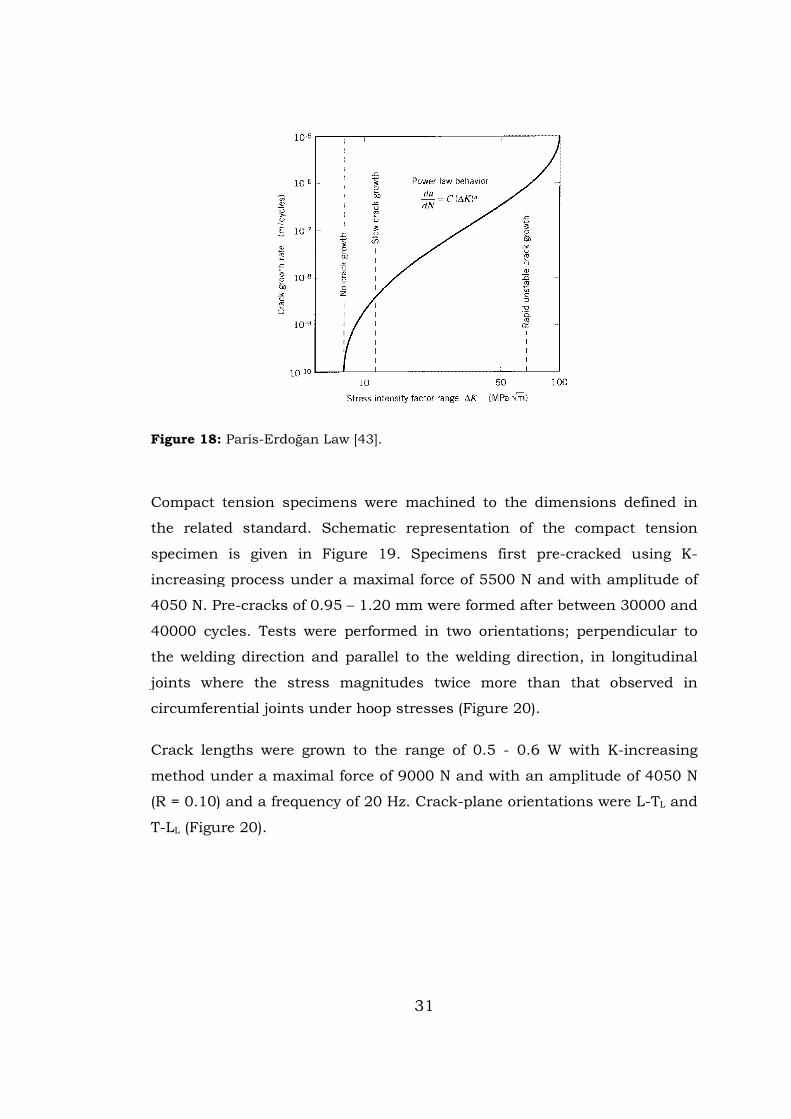
Figure 18: Paris-Erdo
Compact tension specimens were machined to the dimensions defined in
the related standard. Schematic representation of the compact tensi
specimen is given in Figure 1
increasing process under a maximal
4050 N. Pre-cracks of 0.95
40000 cycles. Tests were performed in two orientations
the welding direction and parallel to the welding direction,
joints where the
circumferential joints
Crack lengths were grown to the range of 0.5
method under a maximal force of
(R = 0.10) and a frequency of 20 Hz. Crack
T-LL (Figure 20).
31
Erdoğan Law [43].
Compact tension specimens were machined to the dimensions defined in
the related standard. Schematic representation of the compact tensi
specimen is given in Figure 19. Specimens first pre-cracked using K
increasing process under a maximal force of 5500 N and with amplitude of
cracks of 0.95 – 1.20 mm were formed after between 30000 and
Tests were performed in two orientations; perpendicular to
the welding direction and parallel to the welding direction,
joints where the stress magnitudes twice more than that observed in
joints under hoop stresses (Figure 20).
Crack lengths were grown to the range of 0.5 - 0.6 W with K
method under a maximal force of 9000 N and with an ampli
) and a frequency of 20 Hz. Crack-plane orientations were L
Compact tension specimens were machined to the dimensions defined in
the related standard. Schematic representation of the compact tension
cracked using K-
force of 5500 N and with amplitude of
1.20 mm were formed after between 30000 and
; perpendicular to
the welding direction and parallel to the welding direction, in longitudinal
that observed in
0.6 W with K-increasing
N and with an amplitude of 4050 N
plane orientations were L-TL and

32
Figure 19: Schematic representation of compact tension specimen for crack propagation tests.
Figure 20: Compact tension specimen orientations on longitudinal joints.
33
CHAPTER 4
RESULTS AND DISCUSSION
4.1. Base Metal Characterization
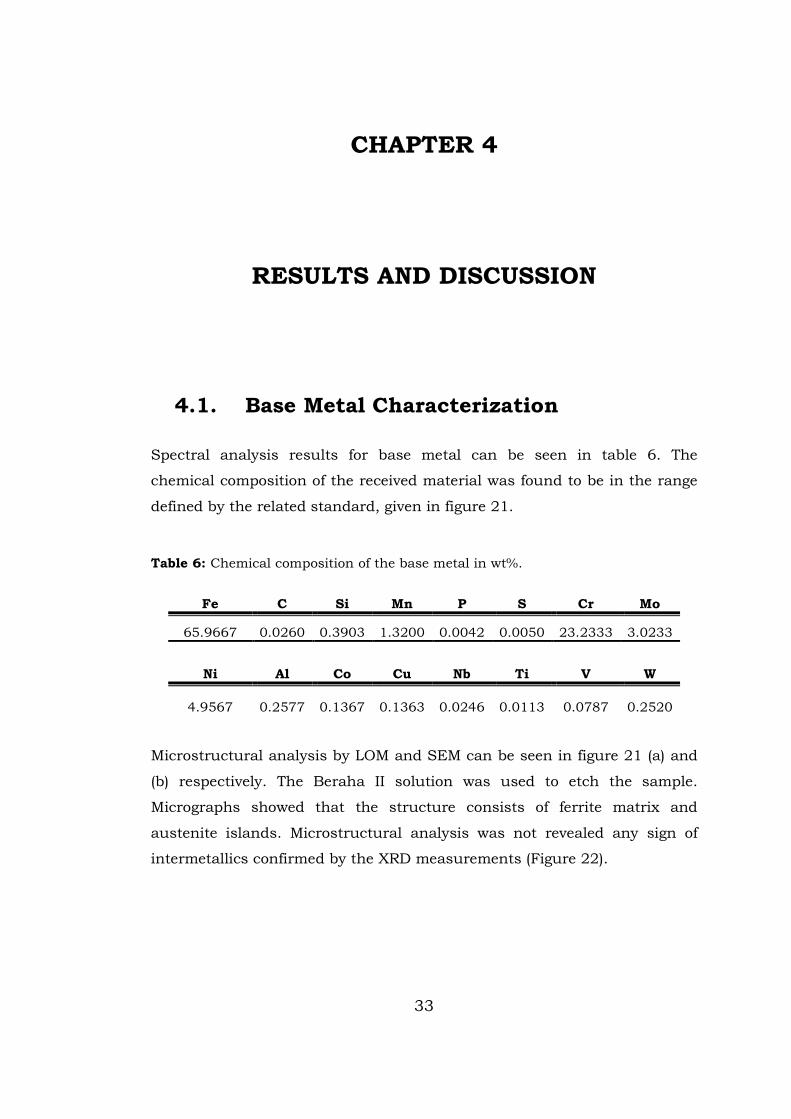
Spectral analysis results for base metal can be seen in table 6. The
chemical composition of the received material was found to be in the range
defined by the related standard, given in figure 21.
Table 6: Chemical composition of the base metal in wt%.
Fe C Si Mn P S Cr Mo
65.9667 0.0260 0.3903 1.3200 0.0042 0.0050 23.2333 3.0233
Ni Al Co Cu Nb Ti V W
4.9567 0.2577 0.1367 0.1363 0.0246 0.0113 0.0787 0.2520
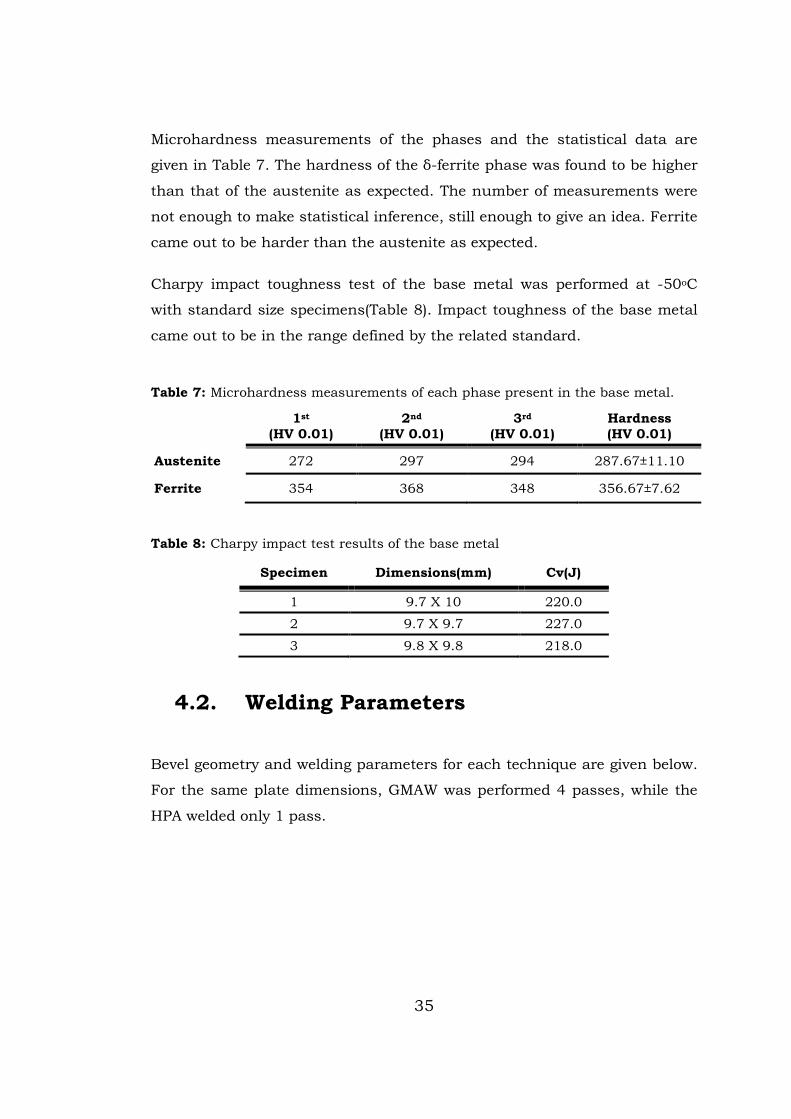
Microstructural analysis by LOM and SEM can be seen in figure 21 (a) and
(b) respectively. The Beraha II solution was used to etch the sample.
Micrographs showed that the structure consists of ferrite matrix and
austenite islands. Microstructural analysis was not revealed any sign of
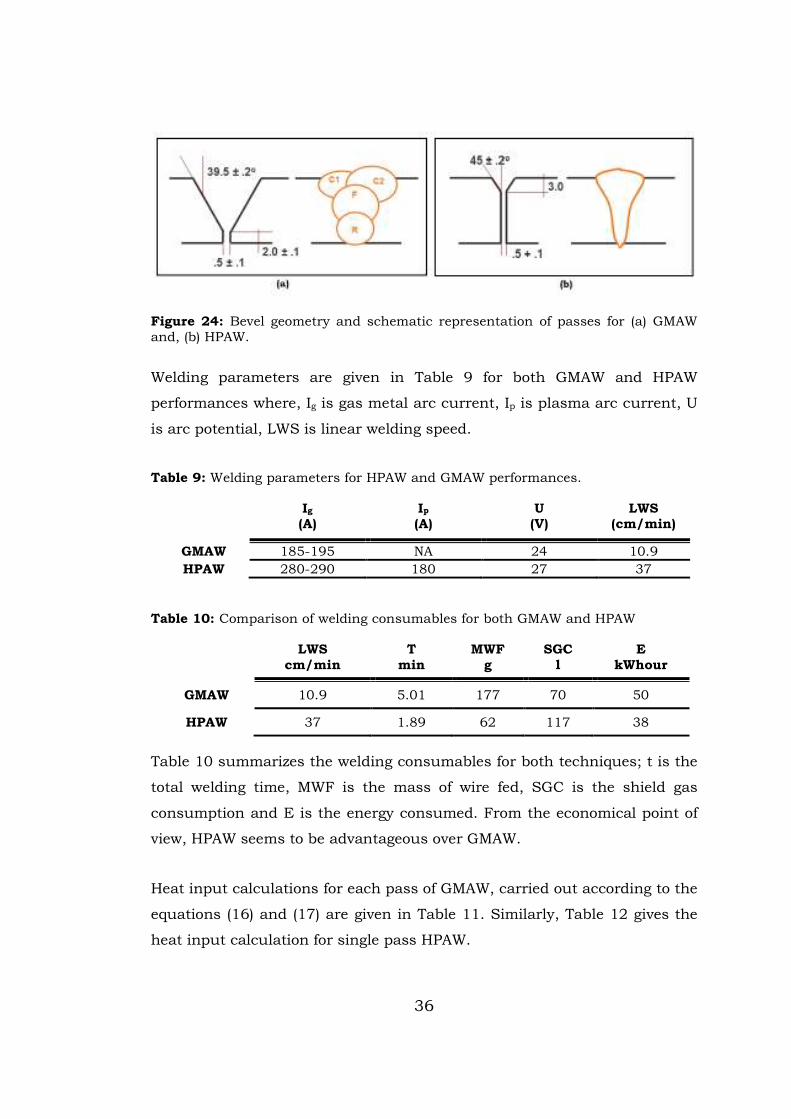
intermetallics confirmed by the XRD measurements (Figure 22).
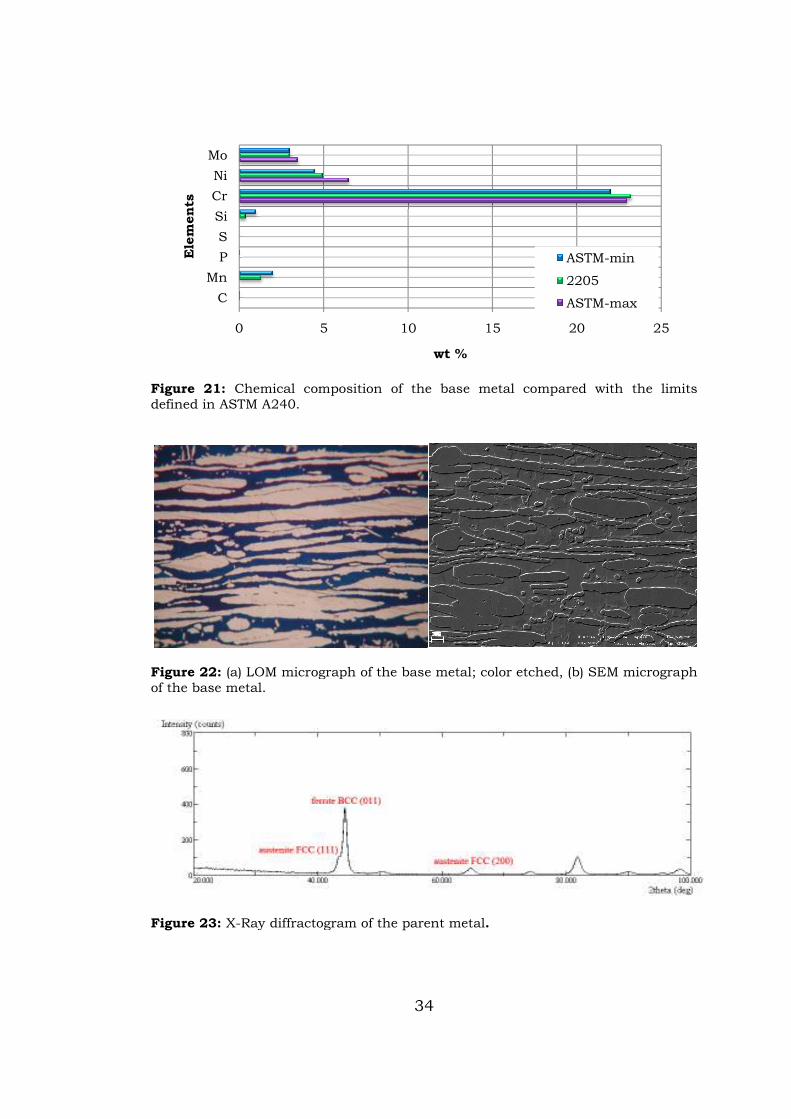
Figure 21: Chemical composition of the base metal compared with the limits defined in ASTM A240.
Figure 22: (a) LOM micrograph of the base metal; color etched, (b) SEM of the base metal.
Figure 23: X-Ray diffractogram of the
0
C
Mn
P
S
Si
Cr
Ni
Mo
Ele
ments
34
Chemical composition of the base metal compared with the limits defined in ASTM A240.
(a) LOM micrograph of the base metal; color etched, (b) SEM
Ray diffractogram of the parent metal.
5 10 15 20
wt %
ASTM
2205
ASTM
Chemical composition of the base metal compared with the limits
(a) LOM micrograph of the base metal; color etched, (b) SEM micrograph
20 25
ASTM-min
2205
ASTM-max
35
Microhardness measurements of the phases and the statistical data are
given in Table 7. The hardness of the δ-ferrite phase was found to be higher
than that of the austenite as expected. The number of measurements were
not enough to make statistical inference, still enough to give an idea. Ferrite
came out to be harder than the austenite as expected.
Charpy impact toughness test of the base metal was performed at -50oC
with standard size specimens(Table 8). Impact toughness of the base metal
came out to be in the range defined by the related standard.
Table 7: Microhardness measurements of each phase present in the base metal.
1st
(HV 0.01) 2nd
(HV 0.01) 3rd
(HV 0.01) Hardness (HV 0.01)
Austenite 272 297 294 287.67±11.10
Ferrite 354 368 348 356.67±7.62
Table 8: Charpy impact test results of the base metal
Specimen Dimensions(mm) Cv(J)
1 9.7 X 10 220.0
2 9.7 X 9.7 227.0
3 9.8 X 9.8 218.0
4.2. Welding Parameters
Bevel geometry and welding parameters for each technique are given below.
For the same plate dimensions, GMAW was performed 4 passes, while the
HPA welded only 1 pass.
36
Figure 24: Bevel geometry and schematic representation of passes for (a) GMAW and, (b) HPAW.
Welding parameters are given in Table 9 for both GMAW and HPAW
performances where, Ig is gas metal arc current, Ip is plasma arc current, U
is arc potential, LWS is linear welding speed.
Table 9: Welding parameters for HPAW and GMAW performances.
Ig (A)
Ip (A)
U (V)
LWS (cm/min)
GMAW 185-195 NA 24 10.9 HPAW 280-290 180 27 37
Table 10: Comparison of welding consumables for both GMAW and HPAW
LWS cm/min
T min
MWF g
SGC l
E kWhour
GMAW 10.9 5.01 177 70 50
HPAW 37 1.89 62 117 38
Table 10 summarizes the welding consumables for both techniques; t is the
total welding time, MWF is the mass of wire fed, SGC is the shield gas
consumption and E is the energy consumed. From the economical point of
view, HPAW seems to be advantageous over GMAW.
Heat input calculations for each pass of GMAW, carried out according to the
equations (16) and (17) are given in Table 11. Similarly, Table 12 gives the
heat input calculation for single pass HPAW.

37
The keyhole obtained by high-power-density arcs, and laser or electron
beams as well, introduces deep penetration with a narrow bead resulting
thinner HAZ and less residual stresses due to lower heat input. It was
calculated that while HPAW introduced 0.60 kJ/mm, line energy given by a
pass of GMAW was 0.61 kJ/mm and total heat input was 2.45 kJ/mm
(Tables 11-12).
Table 11: Welding parameters and heat input results for each pass of GMAW.
Passes W- Current
(A) WFS
(m/min) Voltage
(V) LWS
(mm/min) H
(kJ/mm)
Root 185 – 195 8.50 24.0 400 0.61
Fill 185 – 195 8.50 24.0 400 0.61
Cap 1 185 – 195 8.50 24.0 400 0.61
Cap 2 185 – 195 8.50 24.0 400 0.61
Table 12: Welding parameters and heat input results for HPAW.
W-Current (A)
WFS (m/min)
E-Current (A)
Voltage (V)
LWS (mm/min)
H (kJ/mm)
280-290 15.0 180 27.0 800 0.60
Tables 11, 12 show the welding parameters; wire current (W), wire feed
speed (WFS), voltage, linear weld speed (LWS) and heat input (H) results for
both welding techniques.
Cooling curves for HPAW and GMAW practices from 1200 to 500oC are
given in figure 24, where, the measurements for GMAW represents the cap
pass. Cooling time measurements for each pass of GMAW were carried out
also. ∆t12/5 durations were recorded as 3.33 and 8.82 seconds during the
HPAW pass and the GMAW cap pass, respectively.
38
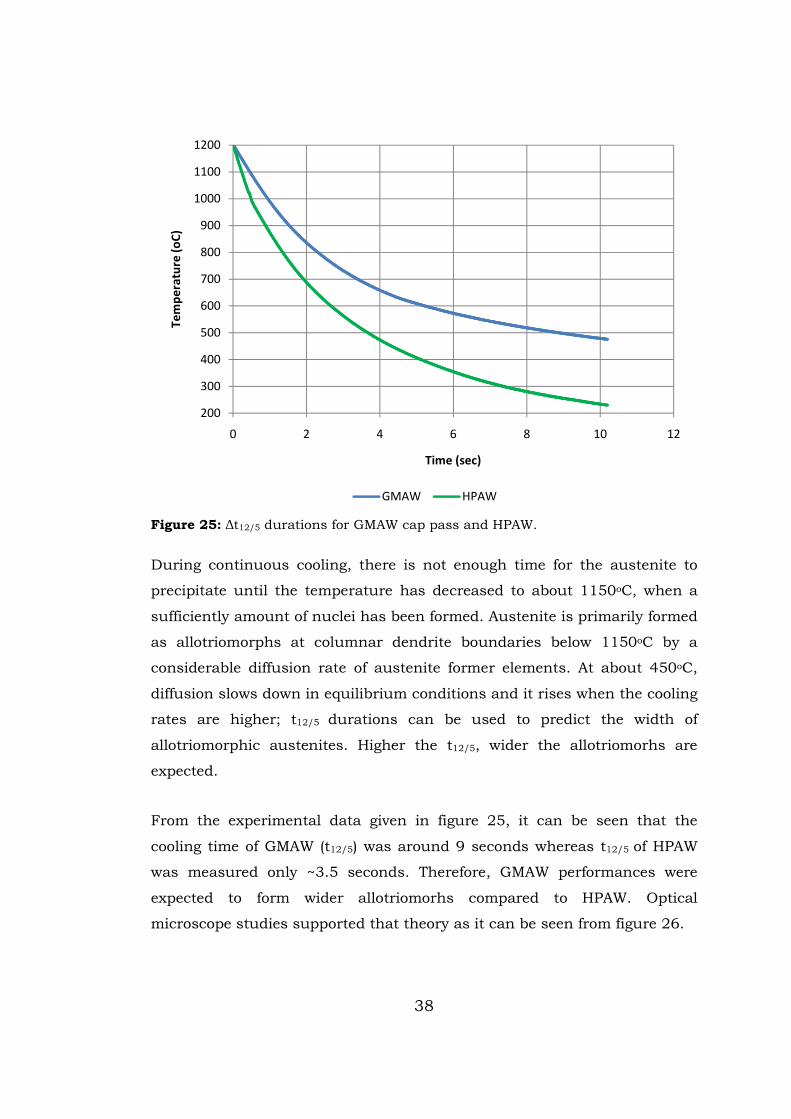
Figure 25: ∆t12/5 durations for GMAW cap pass and HPAW.
During continuous cooling, there is not enough time for the austenite to
precipitate until the temperature has decreased to about 1150oC, when a
sufficiently amount of nuclei has been formed. Austenite is primarily formed
as allotriomorphs at columnar dendrite boundaries below 1150oC by a
considerable diffusion rate of austenite former elements. At about 450oC,
diffusion slows down in equilibrium conditions and it rises when the cooling
rates are higher; t12/5 durations can be used to predict the width of
allotriomorphic austenites. Higher the t12/5, wider the allotriomorhs are
expected.
From the experimental data given in figure 25, it can be seen that the
cooling time of GMAW (t12/5) was around 9 seconds whereas t12/5 of HPAW
was measured only ~3.5 seconds. Therefore, GMAW performances were
expected to form wider allotriomorhs compared to HPAW. Optical
microscope studies supported that theory as it can be seen from figure 26.
200
300
400
500
600
700
800
900
1000
1100
1200
0 2 4 6 8 10 12
Te
mp
era
ture
(o
C)
Time (sec)
GMAW HPAW
39
Figure 26: Optical microscope images of (a) HPAW, (b) GMAW-cap pass, showing
the allotriomorph widths (X 200).
4.3. Weld Metal Microstructural Characterization
Optical microscope images of the fusion zone for both joining methods are
shown in figures 27 and 28. HPA weldments have slightly more δ-ferrite
than GMAW cap welds, which is less than 60%. However, phase balance is
deteriorated in GMAW fill passes, in which γ occupies more than 70% of the
weld metal due to the acicular precipitation. On the other hand, an
autogenous zone at the root side of HPA weld metals was observed again
deteriorating the phase balance by high amount of δ-ferrite.
As it can be seen from figure 27, especially at the root of weld zone where
the examinations revealed that there was no filler penetration, the amount
of ferrite phase increased.
Although HPA weld was deposited with an equal heat input for the single
pass to that used for each pass in GMA weld, it is seen that the columnar
grains in the fusion zone of HPA weld have considerably less coarse grain
sizes than GMA welds. Cooling rate is a function of the heat input by the
welding process and temperature of the material before welding, factors
affecting heat transfer mechanisms as well. Taking the inter-pass
temperatures (200oC) into consideration, the specimen joined by GMAW was
subjected to 4 heating cycles and kept over 200oC for almost 5 minutes.
Moreover, former passes (root and fill) were subjected to the heat treatment
by GMAW cap passes, which motivated secondary γ nucleation in ferrite
(a) (b)
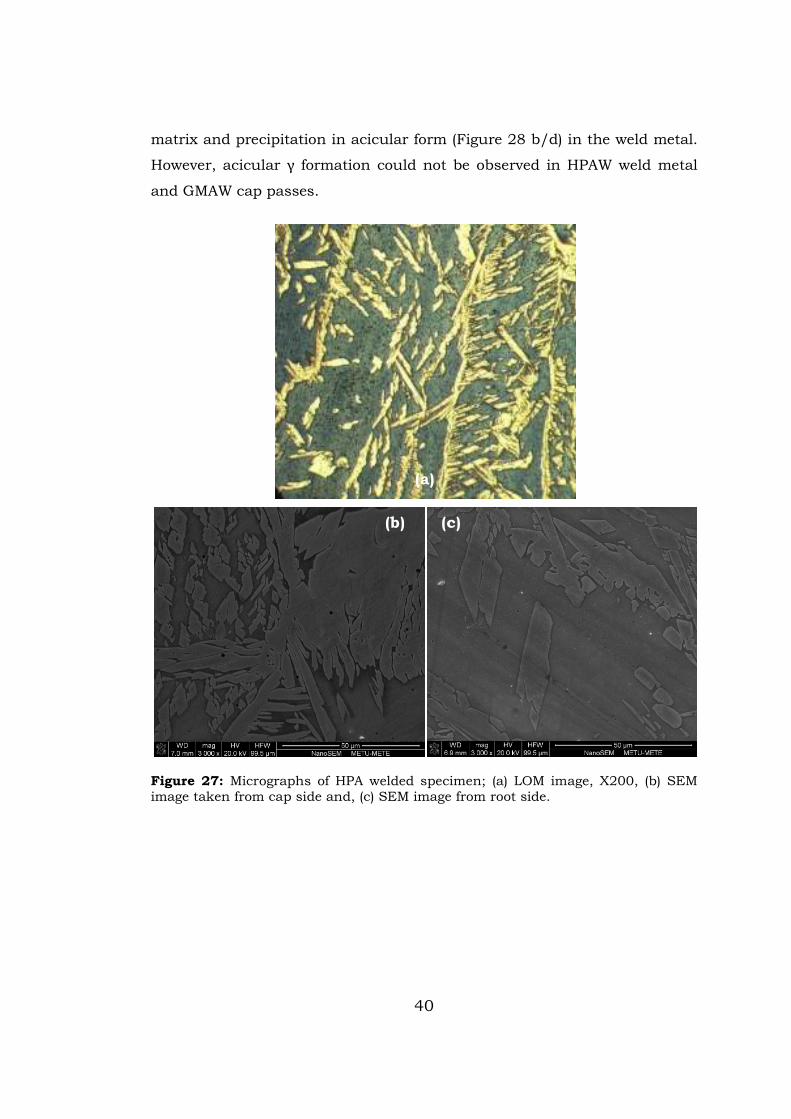
40
matrix and precipitation in acicular form (Figure 28 b/d) in the weld metal.
However, acicular γ formation could not be observed in HPAW weld metal
and GMAW cap passes.
Figure 27: Micrographs of HPA welded specimen; (a) LOM image, X200, (b) SEM image taken from cap side and, (c) SEM image from root side.
(a)
(b) (c)
41
Figure 28: Micrographs of of GMA welded joint; (a/c) cap pass images via LOM and SEM, (b/d) fill pass images via LOM and SEM.
Furthermore, figure 29 shows X-ray diffractograms taken from different
zones in both weldments. Powders were obtained from HPAW root zone, HR,
HPAW cap zone, HC, GMAW fill pass, GF, and GMAW cap passes, GC.
(a) (b)
(c) (d)
42
Figure 29: X-ray diffractograms from weld metals of joints by HPAW and GMAW.
4.4. Hardness and Charpy Impact Toughness of
Weld Metals
Hardness profiles of each welding technique are given in Figure 30. From
the hardness profiles and the macro examinations estimated heat affected
zone (HAZ) widths are also given in the mentioned figure. Vicker’s hardness
profiles from the center of weld metal to the base material in which the
profiles reached plateau at less than 4.00 and 7.25 mm for HPAW and
GMAW, respectively, indicating approximate widths of HAZ for both welding
methods. HAZ dimensions observed were proportional to the cooling rates
for one pass of HPAW and four passes of GMAW. Micrographs showing HAZ
for both techniques reveal not only thinner HAZ in HPAW joints but also
less grain coarsening.
γ(200) δ(200) γ(220)
δ(110)
γ(111)
43
Figure 30: Vickers hardness profiles of the welded specimens and the width of the heat affected zone for each technique.
Charpy impact toughness tests were carried out at -50oC as stated in the
related standard. The specimens were machined to the sub-sized specimens
according to the standard. The main reason for that the plates to be welded
had 8mm thickness. Three specimens for each welding were used and the
results of all are given in Table 13.
GMAW seemed to reveal a hard and brittle microstructure than HPAW when
the hardness profiles and the Charpy impact toughness results were
combined.
Charpy impact fracture surfaces included varying proportion of cleavage
and dimple character (Figure 31), while the parent metal specimens
provided fracture surfaces had completely a dimple rupture mode of
fracture and impact toughness mean energy of 88 J at – 50oC.
44
Table 13: Charpy impact toughness results for both welding techniques.
Specimen Dimensions(mm) Cv(J)
GMAW-1 9.7 X 5 78.0
GMAW-2 9.7 X 4.7 67.0
GMAW-3 9.8 X 4.8 70.0
HPAW-1 9.8 X 4.8 139.0
HPAW-2 9.8 X 4.0 143.0
HPAW-3 10 X 5 145.0
Figure 31: Charpy impact toughness specimens and locations, (a) GMAW and, (b)
HPAW.
An analogy between the δ content and the fracture mode was observed on
the fracture surfaces of specimens. The specimen obtained from HPA
weldments represented a dimple rupture mode of fracture at the upper zone
(Figure 32 a), while the mode was cleavage at the root, in which δ dominates
due to the autogenous solidification (Figure 32 b).
(a) (b)
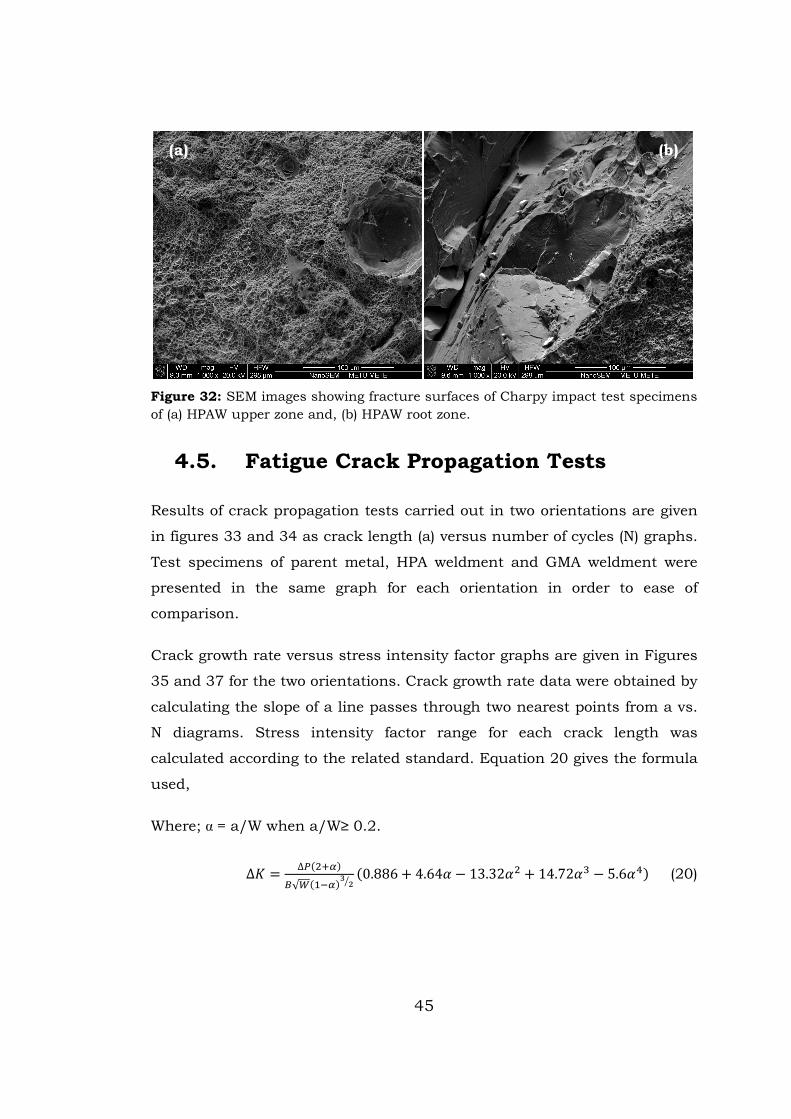
45
Figure 32: SEM images showing fracture surfaces of Charpy impact test specimens
of (a) HPAW upper zone and, (b) HPAW root zone.
4.5. Fatigue Crack Propagation Tests
Results of crack propagation tests carried out in two orientations are given
in figures 33 and 34 as crack length (a) versus number of cycles (N) graphs.
Test specimens of parent metal, HPA weldment and GMA weldment were
presented in the same graph for each orientation in order to ease of
comparison.
Crack growth rate versus stress intensity factor graphs are given in Figures
35 and 37 for the two orientations. Crack growth rate data were obtained by
calculating the slope of a line passes through two nearest points from a vs.
N diagrams. Stress intensity factor range for each crack length was
calculated according to the related standard. Equation 20 gives the formula
used,
Where; � = a/W when a/W≥ 0.2.
∆/ = ∆����0�
1√(�3�0�4
56�0.886 + 4.64= − 13.32=� + 14.72=A − 5.6=C� (20)
(a) (b)
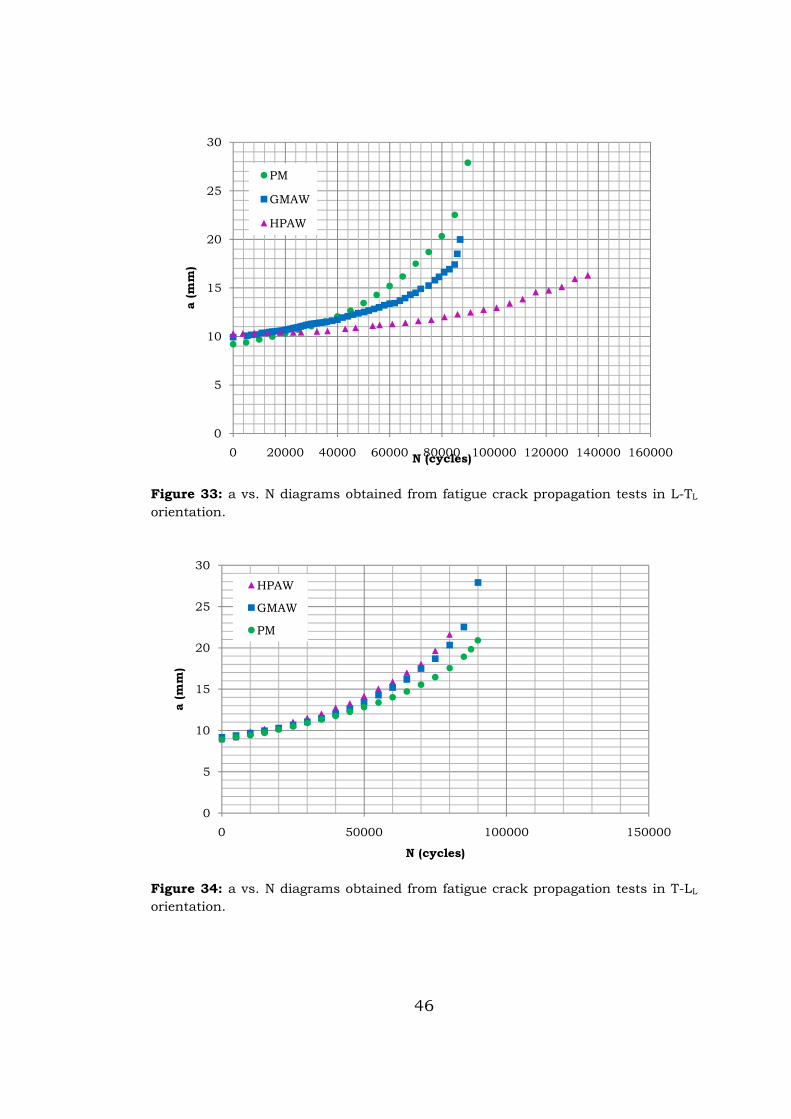
46
Figure 33: a vs. N diagrams obtained from fatigue crack propagation tests in L-TL
orientation.
Figure 34: a vs. N diagrams obtained from fatigue crack propagation tests in T-LL
orientation.
0
5
10
15
20
25
30
0 20000 40000 60000 80000 100000 120000 140000 160000
a (m
m)
N (cycles)
PM
GMAW
HPAW
0
5
10
15
20
25
30
0 50000 100000 150000
a (m
m)
N (cycles)
HPAW
GMAW
PM
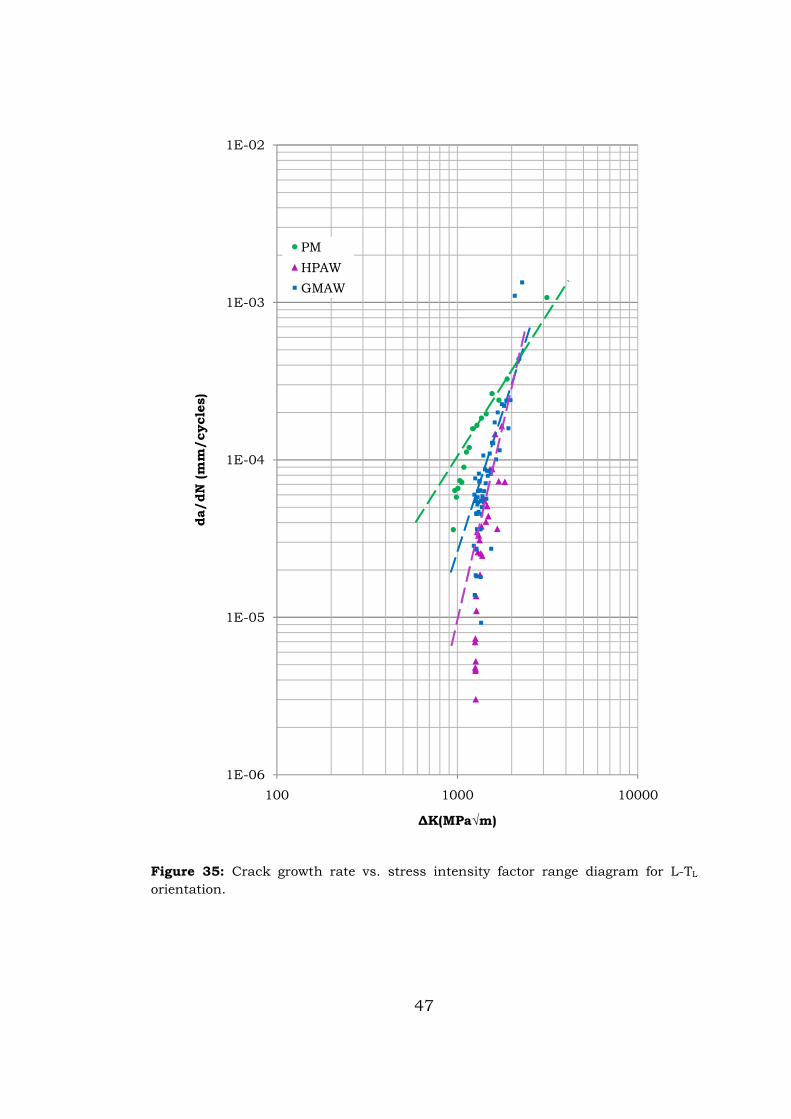
47
Figure 35: Crack growth rate vs. stress intensity factor range diagram for L-TL
orientation.
1E-06
1E-05
1E-04
1E-03
1E-02
100 1000 10000
da/dN
(m
m/cycle
s)
∆K(MPa√m)
PM
HPAW
GMAW
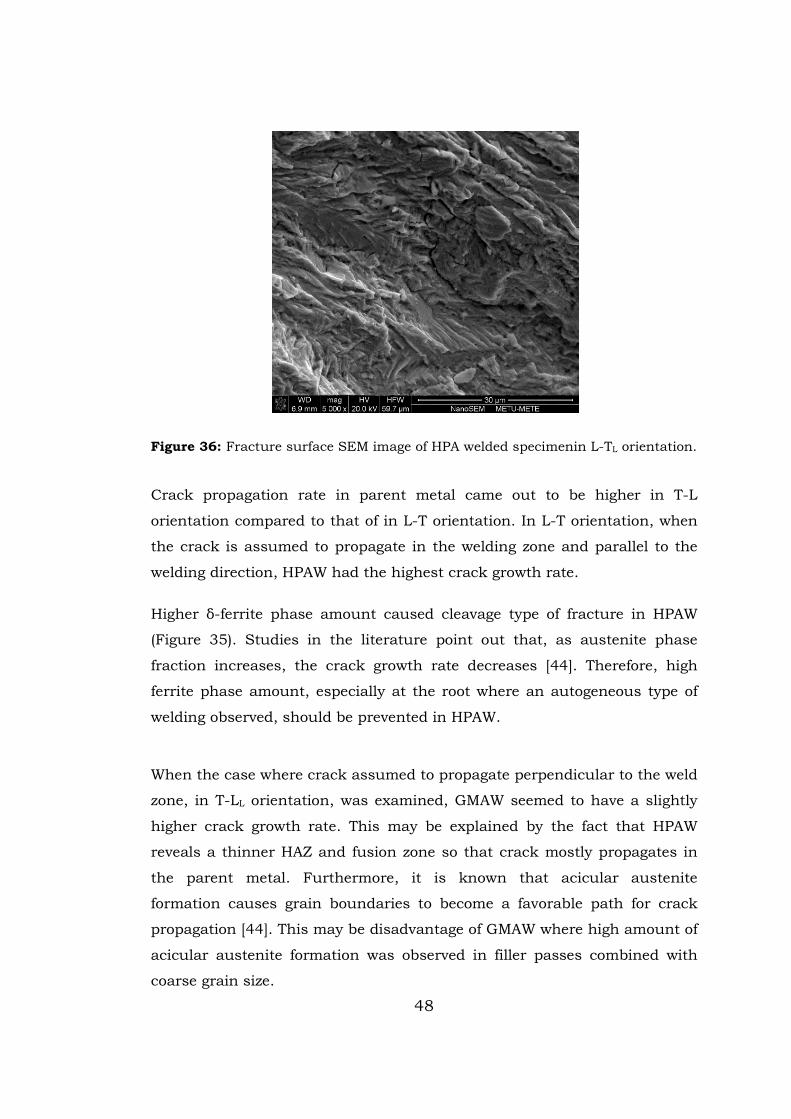
48
Figure 36: Fracture surface SEM image of HPA welded specimenin L-TL orientation.
Crack propagation rate in parent metal came out to be higher in T-L
orientation compared to that of in L-T orientation. In L-T orientation, when
the crack is assumed to propagate in the welding zone and parallel to the
welding direction, HPAW had the highest crack growth rate.
Higher δ-ferrite phase amount caused cleavage type of fracture in HPAW
(Figure 35). Studies in the literature point out that, as austenite phase
fraction increases, the crack growth rate decreases [44]. Therefore, high
ferrite phase amount, especially at the root where an autogeneous type of
welding observed, should be prevented in HPAW.
When the case where crack assumed to propagate perpendicular to the weld
zone, in T-LL orientation, was examined, GMAW seemed to have a slightly
higher crack growth rate. This may be explained by the fact that HPAW
reveals a thinner HAZ and fusion zone so that crack mostly propagates in
the parent metal. Furthermore, it is known that acicular austenite
formation causes grain boundaries to become a favorable path for crack
propagation [44]. This may be disadvantage of GMAW where high amount of
acicular austenite formation was observed in filler passes combined with
coarse grain size.
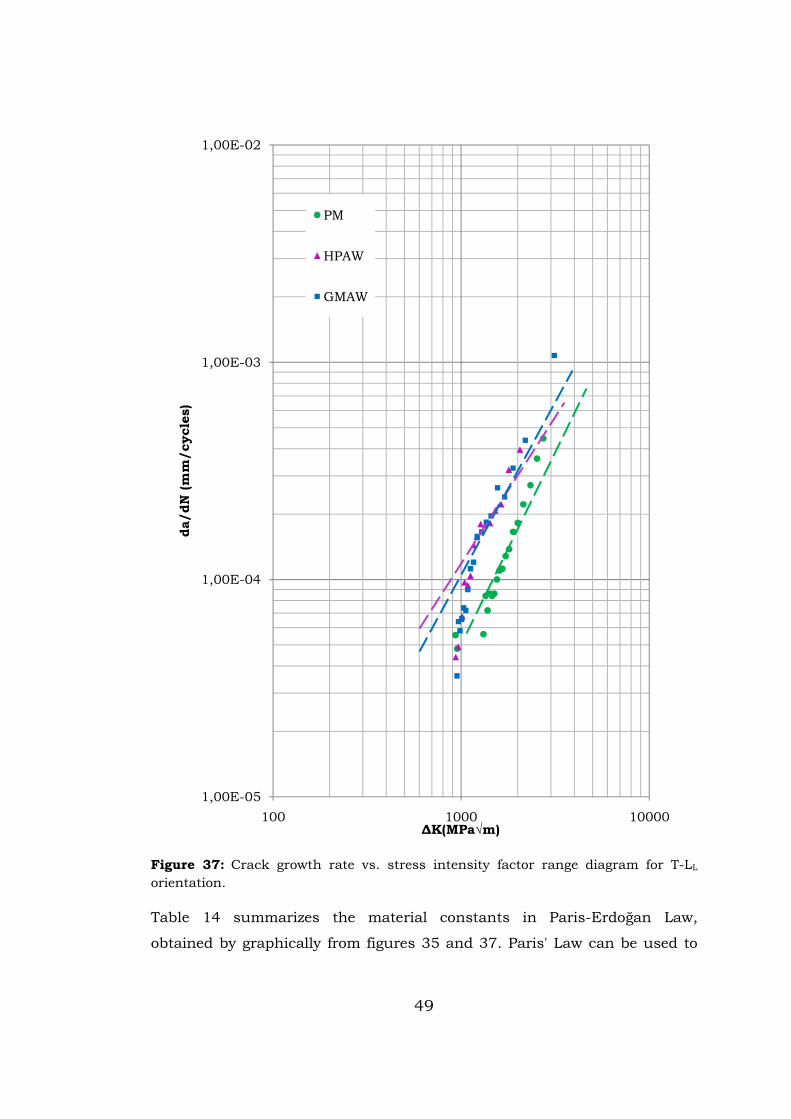
49
Figure 37: Crack growth rate vs. stress intensity factor range diagram for T-LL
orientation.
Table 14 summarizes the material constants in Paris-Erdoğan Law,
obtained by graphically from figures 35 and 37. Paris' Law can be used to
1,00E-05
1,00E-04
1,00E-03
1,00E-02
100 1000 10000
da/dN
(m
m/cycle
s)
∆K(MPa√m)
PM
HPAW
GMAW
50
quantify the residual life of a specimen given a particular crack size. Here,
m seemed to have a greater influence by being in a power law relationship.
Table 14: Material constants C and m.
C m C m
L-T
PM 2.96 10-14 2.107
T-L
PM 1.96 10-15 2.286
HPAW 2.30 10-26 4.610 HPAW 7.57 10-15 2.229
GMAW 2.75 10-24 4.188 GMAW 8.71 10-17 2.644
Fatigue crack growth tests carried out in T-LL orientation can also be
considered as a study of crack propagation in weld zone and HAZ (Figure
38). Therefore, crack growth can be divided into three regions having
different slopes. Figures 39 and 40 show the crack propagation and crack
length or distance travelled by the crack relation for HPAW and GMAW.
Stage 1 of crack growth, where the crack is very small in size and
propagation takes place in very small increments, coincided with the fusion
zone of HPAW. Therefore, data taken from there may have included
experimental errors. On the other hand, from the data obtained by using
Paris-Erdoğan Law in second stage of crack growth, it seemed to have a
higher growth rate compared to other regions (Figure 39). Crack growth in
the HAZ seemed to start fast and then slow down as it reaches to the parent
metal.
On the contrary, when the figure 40 was examined, crack growth seemed to
have high rate through the weld and the HAZ compared to parent metal.
However, the data taken from the parent metal was not enough to predict a
pattern. GMAW did not revealed distinguished change in crack growth rate
and it seemed to have a slower growth compared to HPAW. Nevertheless,
when the crack growth rate data was analyzed, HPAW reached a maximum
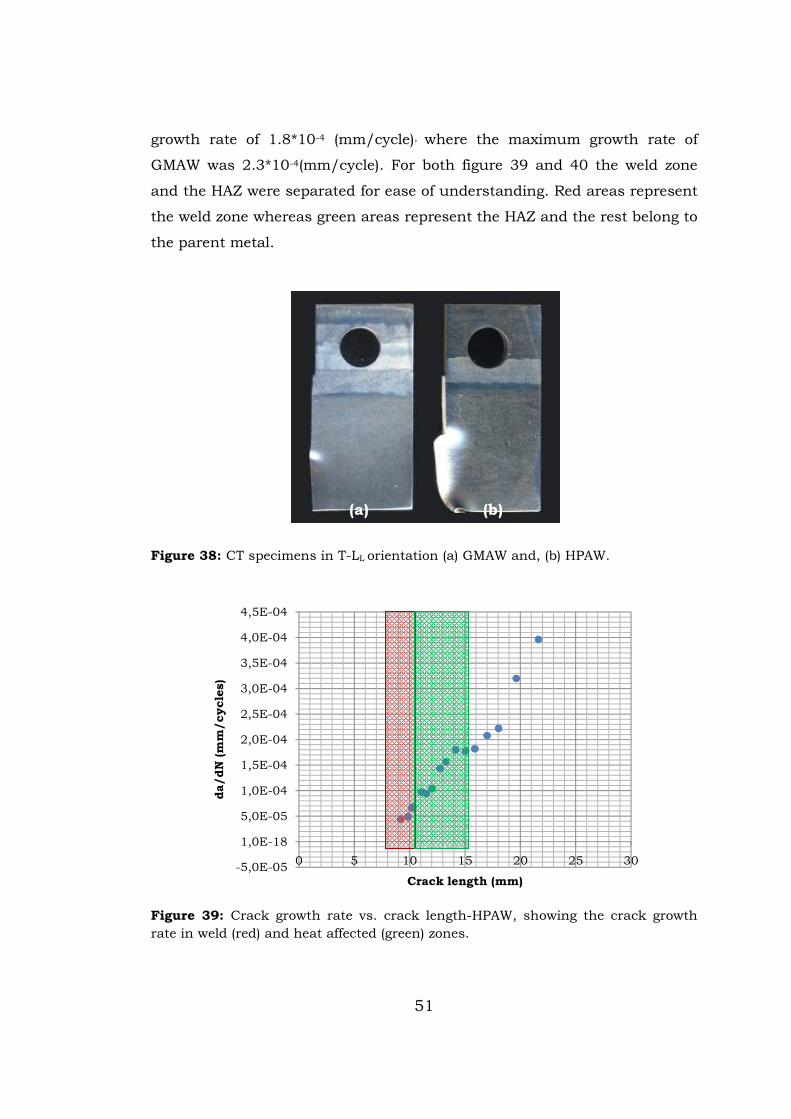
51
growth rate of 1.8*10-4 (mm/cycle), where the maximum growth rate of
GMAW was 2.3*10-4(mm/cycle). For both figure 39 and 40 the weld zone
and the HAZ were separated for ease of understanding. Red areas represent
the weld zone whereas green areas represent the HAZ and the rest belong to
the parent metal.
Figure 38: CT specimens in T-LL orientation (a) GMAW and, (b) HPAW.
Figure 39: Crack growth rate vs. crack length-HPAW, showing the crack growth
rate in weld (red) and heat affected (green) zones.
-5,0E-05
1,0E-18
5,0E-05
1,0E-04
1,5E-04
2,0E-04
2,5E-04
3,0E-04
3,5E-04
4,0E-04
4,5E-04
0 5 10 15 20 25 30
da/dN
(m
m/cycle
s)
Crack length (mm)
(a) (b)
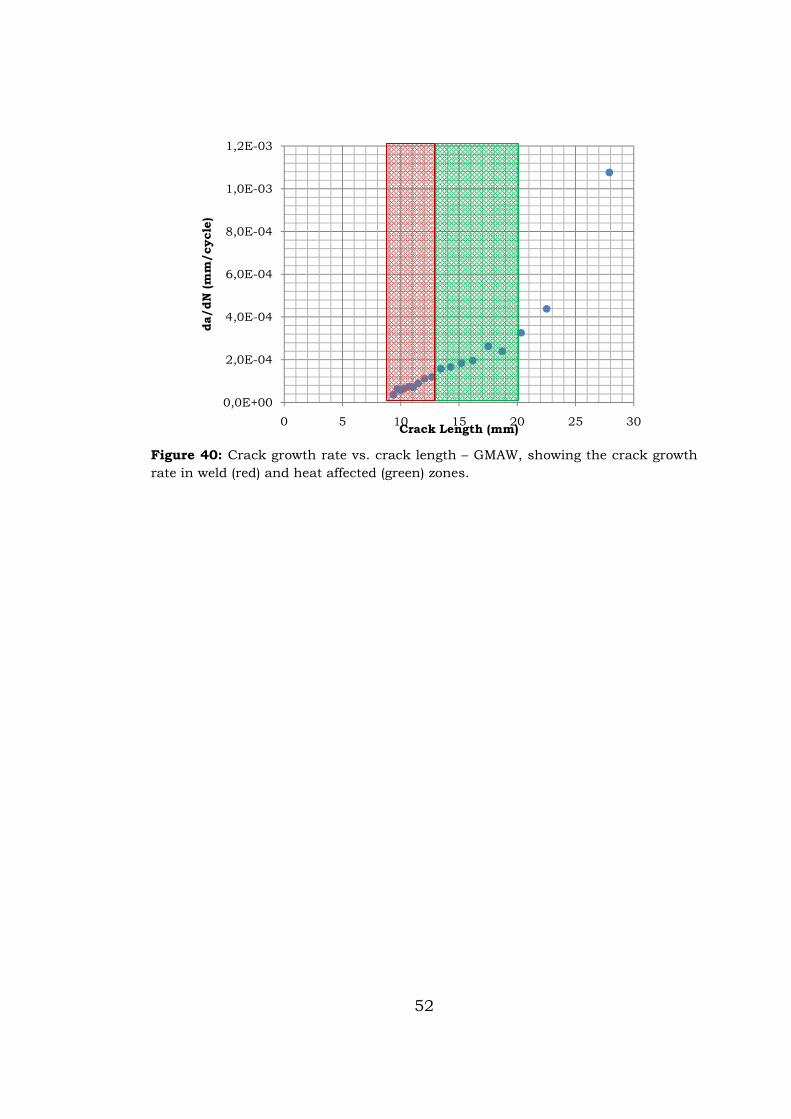
52
Figure 40: Crack growth rate vs. crack length – GMAW, showing the crack growth
rate in weld (red) and heat affected (green) zones.
0,0E+00
2,0E-04
4,0E-04
6,0E-04
8,0E-04
1,0E-03
1,2E-03
0 5 10 15 20 25 30
da/dN
(m
m/cycle
)
Crack Length (mm)
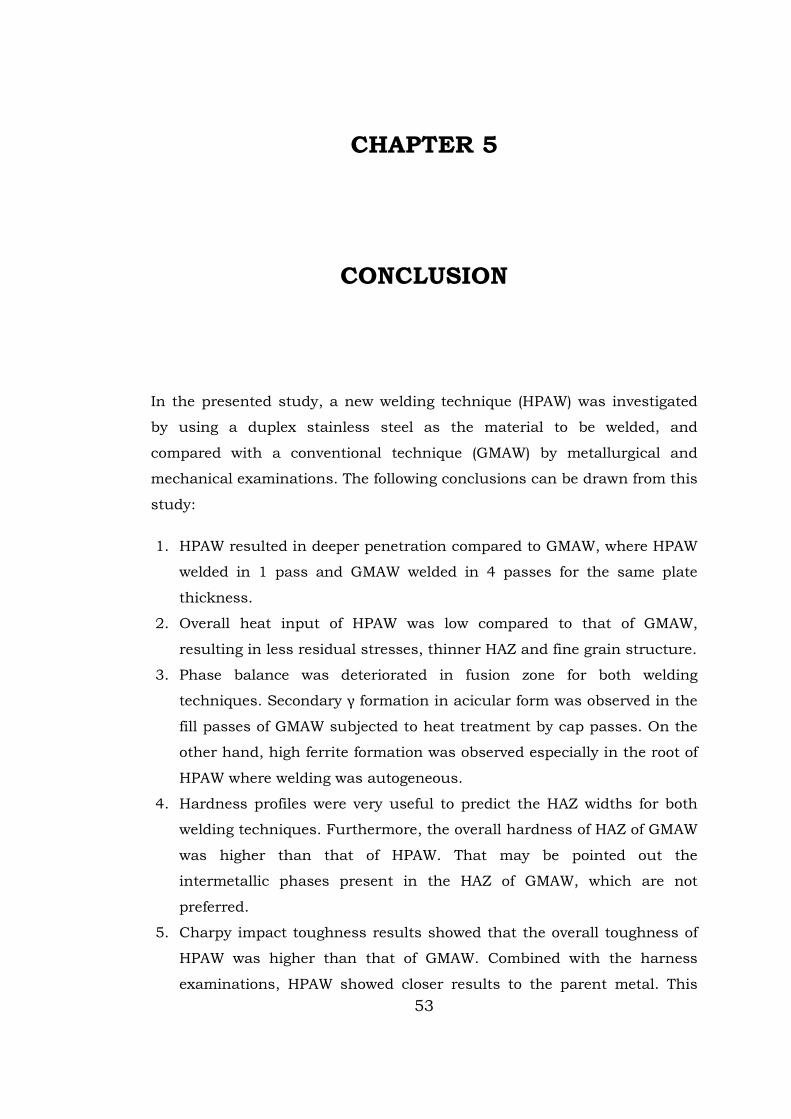
53
CHAPTER 5
CONCLUSION
In the presented study, a new welding technique (HPAW) was investigated
by using a duplex stainless steel as the material to be welded, and
compared with a conventional technique (GMAW) by metallurgical and
mechanical examinations. The following conclusions can be drawn from this
study:
1. HPAW resulted in deeper penetration compared to GMAW, where HPAW
welded in 1 pass and GMAW welded in 4 passes for the same plate
thickness.
2. Overall heat input of HPAW was low compared to that of GMAW,
resulting in less residual stresses, thinner HAZ and fine grain structure.
3. Phase balance was deteriorated in fusion zone for both welding
techniques. Secondary γ formation in acicular form was observed in the
fill passes of GMAW subjected to heat treatment by cap passes. On the
other hand, high ferrite formation was observed especially in the root of
HPAW where welding was autogeneous.
4. Hardness profiles were very useful to predict the HAZ widths for both
welding techniques. Furthermore, the overall hardness of HAZ of GMAW
was higher than that of HPAW. That may be pointed out the
intermetallic phases present in the HAZ of GMAW, which are not
preferred.
5. Charpy impact toughness results showed that the overall toughness of
HPAW was higher than that of GMAW. Combined with the harness
examinations, HPAW showed closer results to the parent metal. This
54
can be explained that the weld zone and especially the HAZ of HPAW
were very thin compared to that of GMAW. Therefore, especially for the
toughness examinations the results were coming from both HPAW and
the parent metal.
6. Fatigue crack growth examinations can be examined in two ways. For
the orientation where the crack propagates along the weld metal; HPAW
showed high crack growth rate and brittle fracture surfaces due to the
high ferrite content. However, in the case where the crack propagation
was perpendicular to the welding direction; HPAW resulted in analogous
crack growth rate with the parent metal. This phenomenon can be
explained again the thinner weld zone and HAZ obtained by the HPAW
and the results contain data mostly from the parent metal.
HPAW revealed almost similar, at some points better, metallurgical and
mechanical properties compared to GMAW. Furthermore, HPAW is more
advantageous in practical application and economical by means of low
number of passes, and heat input. However, the autogenous welding zone
should be prevented to preserve the superior mechanical properties arising
from the phase balance of austenite and ferrite.
55
REFERENCES
1. JO., Nilsson; Super duplex stainless steels. Materials Science and Technology. 1992, Vol. 8, pp. 685-700.
2. JD., Kordatos, G., Fourlaris & G., Papadimitriou; The effect of cooling rate on the mechanical and corrosion properties of SAF 2205 (UNS 31803) duplex stainless steel welds. Scripta Metallurgica. 2001, Vol. 44, pp. 401 – 408.
3. A., Westin. & EM., Fellman; Effect of laser and laser hybrid welding on the corrosion performance of a lean duplex stainless steel. Journal of Laser Applications. 2010, Vol. 22, pp. 150 – 159.
4. JO., Nilsson, P., Kangas, T., Karlsson and A., Wilson; Mechanical properties, microstructural stability and kinetics of σ phase formation in 29Cr-6Ni-2Mo-0,38N super duplex stainless steel. Metallurgical and Materials Transactions A. 2000, Vol. 31A, pp. 35 – 40.
5. T., Omura, T., Kushida & Y., Komizo; Microstructural features and corrosion properties in laser welded duplex stainless steels. Welding International. 2000, Vol. 14, pp. 257 – 260.
6. NA., McPherson, H., Samson, TN., Baker & SN., Fernandez; Steel microstructures in autogenous laser welds. Journal of Laser Applications. 2000, Vol. 15, pp. 200-211.
7. JS., Ku, NJ., Ho & SC., Tjong; Properties of electron beam welded SAF 2205 duplex stainless steel. Journal of Materials Processing Technology. 1997, Vol. 63, pp. 770-775.
8. J.C., Ion; Laser Processing of Engineering Materials; Keyhole welding. . Burlington : Elsevier Butterworth-Heinemann, 2005, pp. 395 – 455.
9. S., Henrik; Fracture toughness properties of duplex stainless steels. Doctoral Thesis. Stockholm, Sweden : Department of Materials Science and Engineering, Royal Institute of Technology, 2006.
10. N.I.A., Haddad; The development of microstructure in duplex stainless steel welds. PhD Thesis. Cambridge : Pembroke College, 1989.
11. TH.,Chen, KL.,Weng, JR., Yang; The effect of high temperature exposure on the microstructural stability and toughness property in a 2205 duplex stainless steel. Mater Sci Eng A. A338, 2002, Vol. 259, 70.
12. W., Zhang, T., Debroy, TA., Palmer, JW., Elmer; Modelling of δ-ferrite formation in a duplex stainless steel weld, considering non-uniform starting microstructure. Acta Materiala. 53, 2005, Vol. 4441, 53.
13. CH., Sump, and GC., Bodine; Duplex Stainless Steel. [ed.] R. A. Lula. s.l. : American Society for Metals, 1983.
14. S., McKenzie, HM., Flower, and DRF., West; Conf. Proc. Stainless Steels. 1984.
56
15. J., Michalska, M., Sozanska; Qualitative and quantitative analysis of σ and χ phases in 2205 duplex stainless steels. Material Characterization. 2006, Vol. 56, p. 355.
16. S., Topolska, J., Łabanowski; Effect of microstructure on impact toughness of duplex and superduplex stainless steels. vol. 36, 2 : Journal of achievements in materials and manufacturing engineering, 2009. 142.
17. O., Smuk, P., Nenonen, H., Hanninen and J., Liimatainen; Precipitation of Secondary Phases In Duplok 27 Duplex Stainless Steel With Emphasis on Copper Effects, Helsinki University of Technology, 2002. p. 72. Internal Report TKK-MTR 6/02.
18. Practical guidelines for the fabrication duplex stainless steels. International Molybdenum Association. 2001. p. 9.
19. Standard Specification for Chromium and Chromium-Nickel Stainless Steel Plate, Sheet, and Strip for Pressure Vessels and for General Applications. ASTM A240/A240M-11a.
20. T., Thorvaldsson, H., Eriksson, J., Kutka, A., Salwén; Influence of microstructure on mechanical properties of a duplex stainless steel. Göteborg, Sweden : 1984. Stainless Steel. pp. 101-105.
21. F., Iacoviello, M., Boniardi, GM., La Vecchia; Fatigue crack propagation in austeno-ferritic duplex stainless steel 22Cr5Ni. Internatioanl Journal of Fatigue. 1999, 21, pp. 957-963.
22. J.-B., Vogt. Fatigue properties of high nitrogen steels. Mater. Proc. Tech. 117, 2001, pp. 364-369.
23. Stainless steels. Technical delivery conditions for sheet/plate and strip of corrosion resisting steels for general purposes. BS EN10088-2:2005.
24. Seamless steel tubes for pressure purposes. Technical delivery conditions. Stainless steel tubes. BS EN10216-5:2004.
25. Standard Specification for Seamless and Welded Ferritic/Austenitic Stainless Steel Tubing for General Service. ASTM A789 / A789M - 10a.
26. Standard Specification for Seamless and Welded Ferritic/Austenitic Stainless Steel Pipe. ASTM A790 / A790M - 11.
27. Standard Specification for Forged or Rolled Alloy and Stainless Steel Pipe Flanges, Forged Fittings, and Valves and Parts for High-Temperature Service.
ASTM A182 / A182M - 11a.
28. The Pressure Equipment Directive (97/23/EC): European Parliament and the European Council.
29. Unfired pressure vessels - Part 3: Design. EN 13445-3.
30. Boiler and Pressure Vessel Code Section VIII. ASME.
31. B., Stig; On the effect of plate thickness in fatigue of welds. Engineering Fracture Mechanics. 1985, Vol. 21, 2, pp. 423-435.
32. C., Capela, J.D., Costa, F., Antunes, J.M., Ferreira; Thermal fatigue assessment of components made with particulate polymer composites. Theoretical and Applied Fracture Mechanics. 2004, 42, pp. 171-181.
33. CM., Pang, JH., Song; Crack growth and closure behavior of short fatigue crack. . Engineering Fracture Mechanics . 1994, 47, p. 327.
57
34. H., Sieurin, R., Sandström; Austenite reformation in the heat affected zone of duplex stainless steel 2205. Material Science Engineering A. 2006, 418, pp. 250-256.
35. T., Süha, Y., Koray and B., Caner; Microstructural characterization of heat affected zone in the 2507 SDSS welds. Ankara, 2008.
36. J.R., Davis; Corrosion of weldments. Materials Park, ASM International, 2006. OH 44073-002.
37. M., Barry, O., Vasile, W., Andrew; Duplex stainless steel welding: best practices. Stainless Steel World. 2007, pp. 53-63.
38. R. Badji, B.Belkessa, H. Maza, M.Bouabdallah, B.Bacroix, C.Kahloun. Effect of Post Weld Heat Treatment on Microstructure and Mechanical Properties of Welded 2205 Duplex Stainless Steel. Materials Science Forum. 2004, Vols. 467-470, pp. 217-222.
39. I., Dykhno, R., Davis; Joining GMAW and GTAW. The Fabricator. 2006, pp. 60 – 62.
40. T., Sándor, J., Dobránszky; Experiences of ATIG welding of austenitic stainless steel plates .
41. Steel and iron - Sampling and preparation of samples for the determination of chemical composition. ISO 14284:1996.
42. Charpy Impact Test on Metallic Materials. TS EN 10045-1 .
43. P., Paris, and F., Erdogan; A Critical Analysis of Crack Propagation Law. Journal of Basic Engineering. 1963, Vol. 85, pp. 528-534.
44. N., Ki-Woo, et al. Fatigue Crack Propagation of Super Duplex Stainless Steel with Dispersed Structure and Time-Frequency Analysis of Acoustic Emission. METALS AND MATERIALS International. 2001, Vol. 7, 3, pp. 227-231.