An experimental study on particle deposition above near-wall heat source
11
An experimental study on particle deposition above near-wall heat source Xi Chen a, b, * , Angui Li b a School of Civil Engineering and Architecture, Henan University of Technology, Zhengzhou, Henan 450001, PR China b School of Environmental and Municipal Engineering, Xi'an University of Architecture and Technology, Xi'an, Shaanxi 710055, PR China article info Article history: Received 28 February 2014 Received in revised form 6 June 2014 Accepted 24 June 2014 Available online 1 July 2014 Keywords: Particle concentration Particle size distribution Particle deposition Near-wall heat source Particle decay rate loss coefficient abstract To investigate the effect of near-wall heat sources on the particle deposition, an experiment on particle dimensionless concentrations and size distributions above a near-wall heat source and in the indoor environment is performed. The suspended particles above the near-wall heat source and in the adjacent indoor air are measured and compared. Then the particles are collected under twenty-five different cases by using a Grimm 31-Channel Portable Aerosol Spectrometer. The results reveal that the particles above the near-wall heat source have larger deposition rate than that in the adjacent indoor air. Particles with 0.75 mme11.25 mm dimension stay more in the air above the heat source than in the adjacent indoor air. We also found that the particle decay rate loss coefficient increases as the heat source surface temper- ature increases, and it reduces as the gap between the heat source and the wall increases. © 2014 Elsevier Ltd. All rights reserved. 1. Introduction Haze pollution recently received a widespread attention as a result of its significant effects on the public health and the visibility [1]. High concentrations of fine particulate matters and the persistence of the episodes have arisen public concerns [2]. The indoor particle concentrations are directly affected by the outdoor particles [3e5] and people spend a considerable amount of time indoors [6,7]. The indoor suspended particles can adversely affect human health. In addition, there are concerns that particles can attract insects and that they have a significant impact on the human health [8]. Airborne particle deposition will cause material damage [9] and disturbance in industries [10]. Thus, it is evident that more attention should be paid to the indoor particles. Our experiment introduces an effective means for detecting the airborne particles and settled dusts in the indoor environment. Indoor aerosol deposition experiments are always carried out in small chambers or real houses. Many researchers investigated the factors affecting indoor particles, experimentally [11e 13]. For example, experiments were performed in a 1.22 m 1.22 m 1.22 m aluminum chamber by Thatcher et al., which involved the effects of the particle size, the surface orien- tation, and the surface-air-temperature difference on the particle deposition velocity [14]. Furthermore, Abadie et al. studied the deposition constants for several wall textures [15]. Moreover, Miller and Nazaroff considered smoker segregation, ventilation modifi- cation and air filtration, which were effective on the exposure to airborne particles [16]. Also, Thatcher et al. discussed the particle deposition in an isolated room with different indoor furnishing levels and four different airflow conditions [17]. In the same year, the effects of the surface texture and the airflow condition on the indoor particle depositions were presented by Lai et al. [18].It was found that the ratio of the particle deposition on rough surfaces relative to smooth surfaces increased with the particle size and magnitude of airflow. Following this work, Howard-Reed et al. proposed that the particle size, HAC fan operation and electrostatic precipitator had significant effects on the particle deposition [19]. Particle deposition on the smooth glass plates and the sandpaper were measured with four different roughness scales by Lai and Nazaroff [20]. Their results showed that the particle deposition on smooth and rough vertical surfaces increased with particle size for most conditions. Schnell et al. investigated the particle deposition and distribution in a chamber under both still and stirred condi- tions [21]. They found that no evident difference between the coagulation coefficient for still and stirred conditions. However, the deposition velocity was higher under the stirred conditions. Hus- sein et al. investigated the physical characteristics and emission * Corresponding author. School of Civil Engineering and Architecture, Henan University of Technology, Zhengzhou, Henan 450001, PR China. Tel.: þ86 18539968977. E-mail address: [email protected] (X. Chen). Contents lists available at ScienceDirect Building and Environment journal homepage: www.elsevier.com/locate/buildenv http://dx.doi.org/10.1016/j.buildenv.2014.06.020 0360-1323/© 2014 Elsevier Ltd. All rights reserved. Building and Environment 81 (2014) 139e149
Transcript of An experimental study on particle deposition above near-wall heat source

lable at ScienceDirect
Building and Environment 81 (2014) 139e149
Contents lists avai
Building and Environment
journal homepage: www.elsevier .com/locate/bui ldenv
An experimental study on particle deposition above near-wall heatsource
Xi Chen a, b, *, Angui Li b
a School of Civil Engineering and Architecture, Henan University of Technology, Zhengzhou, Henan 450001, PR Chinab School of Environmental and Municipal Engineering, Xi'an University of Architecture and Technology, Xi'an, Shaanxi 710055, PR China
a r t i c l e i n f o
Article history:Received 28 February 2014Received in revised form6 June 2014Accepted 24 June 2014Available online 1 July 2014
Keywords:Particle concentrationParticle size distributionParticle depositionNear-wall heat sourceParticle decay rate loss coefficient
* Corresponding author. School of Civil EngineeriUniversity of Technology, Zhengzhou, Henan 4518539968977.
E-mail address: [email protected] (X. Chen
http://dx.doi.org/10.1016/j.buildenv.2014.06.0200360-1323/© 2014 Elsevier Ltd. All rights reserved.
a b s t r a c t
To investigate the effect of near-wall heat sources on the particle deposition, an experiment on particledimensionless concentrations and size distributions above a near-wall heat source and in the indoorenvironment is performed. The suspended particles above the near-wall heat source and in the adjacentindoor air are measured and compared. Then the particles are collected under twenty-five different casesby using a Grimm 31-Channel Portable Aerosol Spectrometer. The results reveal that the particles abovethe near-wall heat source have larger deposition rate than that in the adjacent indoor air. Particles with0.75 mme11.25 mm dimension stay more in the air above the heat source than in the adjacent indoor air.We also found that the particle decay rate loss coefficient increases as the heat source surface temper-ature increases, and it reduces as the gap between the heat source and the wall increases.
© 2014 Elsevier Ltd. All rights reserved.
1. Introduction
Haze pollution recently received a widespread attention as aresult of its significant effects on the public health and the visibility[1]. High concentrations of fine particulate matters and thepersistence of the episodes have arisen public concerns [2]. Theindoor particle concentrations are directly affected by the outdoorparticles [3e5] and people spend a considerable amount of timeindoors [6,7]. The indoor suspended particles can adversely affecthuman health. In addition, there are concerns that particles canattract insects and that they have a significant impact on the humanhealth [8]. Airborne particle deposition will cause material damage[9] and disturbance in industries [10]. Thus, it is evident that moreattention should be paid to the indoor particles.
Our experiment introduces an effective means for detecting theairborne particles and settled dusts in the indoor environment.Indoor aerosol deposition experiments are always carried outin small chambers or real houses. Many researchersinvestigated the factors affecting indoor particles, experimentally[11e13]. For example, experiments were performed in a1.22 m � 1.22 m � 1.22 m aluminum chamber by Thatcher et al.,
ng and Architecture, Henan0001, PR China. Tel.: þ86
).
which involved the effects of the particle size, the surface orien-tation, and the surface-air-temperature difference on the particledeposition velocity [14]. Furthermore, Abadie et al. studied thedeposition constants for several wall textures [15]. Moreover, Millerand Nazaroff considered smoker segregation, ventilation modifi-cation and air filtration, which were effective on the exposure toairborne particles [16]. Also, Thatcher et al. discussed the particledeposition in an isolated room with different indoor furnishinglevels and four different airflow conditions [17]. In the same year,the effects of the surface texture and the airflow condition on theindoor particle depositions were presented by Lai et al. [18].It wasfound that the ratio of the particle deposition on rough surfacesrelative to smooth surfaces increased with the particle size andmagnitude of airflow. Following this work, Howard-Reed et al.proposed that the particle size, HAC fan operation and electrostaticprecipitator had significant effects on the particle deposition [19].Particle deposition on the smooth glass plates and the sandpaperwere measured with four different roughness scales by Lai andNazaroff [20]. Their results showed that the particle deposition onsmooth and rough vertical surfaces increased with particle size formost conditions. Schnell et al. investigated the particle depositionand distribution in a chamber under both still and stirred condi-tions [21]. They found that no evident difference between thecoagulation coefficient for still and stirred conditions. However, thedeposition velocity was higher under the stirred conditions. Hus-sein et al. investigated the physical characteristics and emission

Fig. 1. Photograph of the room-sized enclosure.
Fig. 2. Photograph of the near-wall heat source system.
X. Chen, A. Li / Building and Environment 81 (2014) 139e149140
rates of indoor particles during different activities [22]. Later, Kagiet al. reported the impact of the printers on particle emissions [23].In another experiment, the particle loss rate coefficients on eightcoverings were studied by Hamdani et al. [24]. Results showed thatthe surface three-dimensional roughness was less obvious whenparticle deposition clearly increased with near-wall airflow veloc-ity. See and Balasubramanian explored the emission factors ofPM2.5 and its chemical constituents emitted from the incense sticks[25]., Shao et al. recently collected the coal-burning indoor andcorresponding outdoor PM10 samples and analyzed the relation-ship between the oxidative capacity of PM10 and the lung cancerrate [26].Although many experimental studies have been publishedconcerning indoor particles, little research has been done on par-ticle deposition above near-wall heat sources.
Near-wall heat sources have a large impact on the particledeposition and distribution. Salthammer et al. presented that alarge proportion of “Black Magic Dust” phenomenon was found onthe wall areas above radiators [27]. The sudden appearances ofdiscolorations on horizontal or vertical surfaces in dwellings werecommonly called “Black Dwellings” or “Black Magic Dust” [27].“Black Magic Dust” was noticed for the first time at the end of the1980s and it has been increasingly observed since the mid-1990s[28]. In the following years, other scientific literatures on the sub-ject of “Black Magic Dust” were published [29,30]. A series ofquestionnaire campaigns on the phenomenon of the “Black MagicDust” were initiated by German Federal Environment Agency be-tween 1997 and 2001. The results showed that the “Black MagicDust” occurred suddenly, almost exclusively during heating periods[28]. Morawska and Salthammer indicated that the optically visibleblackening of the walls was essentially caused by dust particles.Furthermore, the temperature differences determined at the wallsurfaces in the investigated housing units possibly led to the “BlackMagic Dust” phenomenon [28]. Due to the complexity of this topic,more experiments and investigations are required in order toprovide better explanations.
This paper focuses on the effect of near-wall heat sources on theparticle deposition. The concentrations of particles and the particlesize distributions above a near-wall heat source are studiedexperimentally. A Grimm 31-Channel Portable Aerosol Spectrom-eter monitors the suspended particles above the near-wall heatsource and in the adjacent indoor air. Also, in twenty-five cases, wemeasure the particle concentrations above the heat source.
2. Experimental methodology
2.1. Experimental set-up
Experiments are conducted in a room-sized enclosure, as shownin Fig. 1, with the length of 4500 mm and the width of 3200 mm.During the tests, the room is unoccupied and without mechanicalventilation. All of the building envelope components in thisenclosure are either windows or an interior door. Windows and thedoor are closed in the monitoring process to minimize the effect ofthe outdoor air and the particle penetration. In addition, the curtainand the windows are closed; also a black paper covers the cracks inorder to reduce the sunlight and the infiltration.
2.1.1. Near-wall heat source systemFig. 2 shows the near-wall heat source system designed for the
present study. The heat source system comprises a heating plate, atemperature probe, a temperature control instrument and analternating current contactor. The details of these instruments arelisted in Table 1. The heating plate locates near an interior wall ofthe room. The lower edge of the heating plate is set to 600mmhighabove the floor. The desired temperature is selected via the
temperature control instrument. The surface temperature of theheating plate is detected by the temperature probe and thentransferred to the temperature control instrument. The tempera-ture control instrument compares the actual temperature with thedesired temperature and it outputs the control signals to maintainthe heat source surface temperature.
2.1.2. Apparatus and parameters measuredIn the present study, a Grimm 31-Channel Portable Aerosol
Spectrometer (model No.1.109) is selected for monitoring the par-ticle concentrations and the particle size distributions. The sampleair is guided directly to the measuring unit via the inlet. Then, the

Table 1The main experimental instruments.
Names ofinstruments
Appearances Parameters
Heating plate Size:300 mm � 170 mm � 1 mmHeating power:300 W
Temperatureprobe
Measurementrange: �50 �C ~ þ250 �CMaximum current:2 mA
Temperaturecontrolinstrument
Deviation from the setpoint:�1.0%FSWorking environment:Temperature 0e50 �C, Relativehumidity <85%
Alternatingcurrentcontactor
Pull-in voltage: 85% ~ 110% ofOperating voltageRelease voltage: 20% ~ 75% ofOperating voltageWorking environment:Temperature �5 ~ þ40 �C
X. Chen, A. Li / Building and Environment 81 (2014) 139e149 141
particles in the sample air are detected by the light scattering insidethe measuring unit. The scattering light pulse of each particle isdetected and the scattering light signal intensity of the particle isclassified to a certain particle size. The real timemeasuring range ofthe Portable Aerosol Spectrometer is from 0.25 to 32 mm in 31channel sizes and each unit is certified according to the NationalInstitute of Standards and Technology [31]. At the beginning of eachsampling, the Portable Aerosol Spectrometer makes a self-test. Allof the optical, pneumatical and electronical components are beingchecked during this process. The self-test lasts about 30 s. After theself-test, the actual sampling starts. In this study, the Portable
Table 2Parameters in different cases.
Cases Surface temperatureof the heat source (ts)
Gap between the heatsource and the wall (d)
1 40 �C 0.00 m2 50 �C 0.00 m3 60 �C 0.00 m4 70 �C 0.00 m5 80 �C 0.00 m6 40 �C 0.05 m7 50 �C 0.05 m8 60 �C 0.05 m9 70 �C 0.05 m10 80 �C 0.05 m11 40 �C 0.10 m12 50 �C 0.10 m13 60 �C 0.10 m
Aerosol Spectrometer measures the concentrations of PM10, PM2.5and PM1 as well as the particle size distributions.
2.2. Studied cases
In order to explore the particle deposition above the near-wallheat source, twenty-five cases with different heat source temper-atures and different gaps between the heat source and the wall arestudied and listed in Table 2.
2.3. Procedure
In this work, the suspended particulate matters above the near-wall heat source and in the adjacent indoor air are compared first.Then, the variation of the particle concentrations above the near-wall heat source is measured for twenty-five cases. We aim toexplore the influence of the near-wall heat source on the particledeposition. The effects of heat source temperature and the gapbetween the heat source and thewall on the particle decay rate losscoefficient are also discussed.
A total of seven sampling points are set in the room. Among them,six sampling points are located above the near-wall heat source andone other point is in the adjacent indoor air. The six sampling pointsabove the heat source are 2 mm away from the wall surface andnumbered successively from A1 to A6, as shown in Fig. 3. Also, thesampling point in the adjacent indoor air, which is labeled as B1, is inthemiddle of the room and 1500mmabove the ground, as shown inFig. 1. The Sampling Point B1 is located in the breathing zone. Theparticle concentration in the breathing zone is important for evalu-ating the exposure condition and it needs excessive attention.
When preparations are completed, the near-wall heat sourcesystem is turned on and the desired temperature isfixed. At the sametime, the aerosol spectrometer starts running and the operator leavesthe room immediatelyafter completing the steps.Whenheatingplatesurface temperature reaches the setting value and the Grimm 31-Channel Portable Aerosol Spectrometer finishes the self-test, theparticle concentrations and size distributions aremonitored. In ordertominimize the human impact on the particle deposition, the level ofoperator activities is kept low and the data of the first 3 min is elim-inated from the data sets. Although 3minmay not be long enough forsome fine particles that are influenced by the human activities tosettle down, the airflow pattern is relatively stable 3 min later. Also,the trend of the decay in the particle dimensionless concentrationsduring the measurement period has not noticeably altered, whichsuggests that the effect of operator activities on the change of theparticle concentrations is very little hence can be ignored.
In our experiment, firstly, the particle concentrations and thesize distributions at Sampling Points A1 and B1 in the Case 2 are
Cases Surface temperatureof the heat source (ts)
Gap between the heatsource and the wall (d)
14 70 �C 0.10 m15 80 �C 0.10 m16 40 �C 0.15 m17 50 �C 0.15 m18 60 �C 0.15 m19 70 �C 0.15 m20 80 �C 0.15 m21 40 �C 0.20 m22 50 �C 0.20 m23 60 �C 0.20 m24 70 �C 0.20 m25 80 �C 0.20 m

Fig. 3. Schematic of sampling points.
Fig. 4. Extracted plot of PM10 concentration decay and negative slope of the regressioncurve. The presented data is extracted from data series measured at Sampling Point A2in Case 9.
X. Chen, A. Li / Building and Environment 81 (2014) 139e149142
continuously measured for 24 h to obtain the particle depositioncharacteristics. Secondly, the variations of the concentrations ofPM10, PM2.5 and PM1 at the Sampling Points A1eA6 for twenty-fivecases are detected in order to investigate the influences of the heatsource temperature and the gap between the heat source and thewall on the particle decay rate loss coefficients. In this section, thesampling instrument is alternatively positioned at each samplingpoint for 90 min after the self-test.
There is no specific particle source used in the experiment. Inthe room-sized enclosure without the operation of mechanicalventilation, the natural ventilation is the dominant mode. Beforeeach experiment, the windows or the door are opened to allow theindoor particle concentrations to reach to a relatively high level.When the measurement is initiated, windows and the door areclosed, so the indoor particle concentrations start to decay. Thereare no human activities and any new particle formation in the roomduring the measurement period. The initial particle concentrationsat the sampling points above the near-wall heat source are notsame for these cases and in the range of 29.9e96.5 mg/m3 for PM10,23.4e45.3 mg/m3 for PM2.5 and 20.4e40.3 mg/m3 for PM1.
2.4. Definition of particle decay rate loss coefficient
The particle decay rate loss coefficient is a variable that is mostcommonly studied to judge the particle loss in an enclosure.
The particle decay rate loss coefficient is introduced to discussthe particle deposition above near-wall heat sources in this study.The particle concentration,C(t), in a well-mixed room would decaywith time according to the following formula [32]:
CðtÞ ¼ Co expð�btÞ (1)
where Co is the initial concentration, t is the elapsed time, and b isthe particle decay rate loss coefficient. The particle decay rate losscoefficients in this paper do not consider the coagulation, evapo-ration, condensation [11] and infiltration.
In this paper, b is obtained by fitting the decay curve of thedimensionless concentrations. One of the computed instances isillustrated in Fig. 4.
3. Results
3.1. Comparison of the suspended particulate matter above thenear-wall heat source and in the indoor air
3.1.1. Particle concentrationFig. 5 depicts the dimensionless concentrations (C(t)/Co)
versus time at the Sampling Points A1 and B1 in Case 2. Also, in
X. Chen, A. Li / Building and Environment 81 (2014) 139e149 143
Fig. 5, we compared the C(t)/Coof the Sampling Points A1 and B1in Case 2 under the condition of no heat sources. The comparisonshows that the measurement data at Sampling Point B1 in Case 2is close to that on the condition without heat source, which in-dicates that the heat source has little effect on the particle con-centrations at the Sampling Point B1. It can also be observed thatthe particle dimensionless concentrations of the Sampling PointA1 in Case 2 and on the condition without heat source have asimilar tendency. For all of results presented, it is noted that theparticle dimensionless concentrations of PM10, PM2.5 and PM1both above the heat source and in the adjacent indoor airgenerally decrease over time. After 24 h, the particle concentra-tions fall below 50 percent of the initial concentrations. Similarparticle concentration decay curves have been displayed anddescribed by Hamdani et al. [24] and Spilak et al. [33]. Althoughthe difference in the dimensionless concentrations amongdifferent literatures is quite significant, the anticipated negativeslope can be seen for most of the data sets. In the absence ofindoor activities and when windows and the door are closed, theloss of indoor particles is mainly due to the particle deposition.The particle deposition mentioned in this paper is related to theparticles deposited on not only the vertical wall behind the heatsource but also on other surfaces. The comparison shown in Fig. 5also indicates that the particle concentrations above the heatsource have much higher dropping rate comparing to the adja-cent indoor air. Larger temperature differences between the wallsurface and the surrounding air caused by the near-wall heatsource are possibly sufficient to trigger this phenomenon. Theturbulent airflows, particularly along the cold wall surfaces, maybe another factor, which results in greater particle depositionvelocities above the near-wall heat source [27].
As shown in this figure, the particle dimensionless concen-trations at the Sampling Point A1 have a larger fluctuation thanthat of the Sampling Point B1. Particle resuspension is one of thepossible reasons for this result. The rising of the hot air from thenear-wall heat sources leads to a greater turbulent intensity. Theenhancement of the turbulent intensity above the heat sourcemay make more particles resuspended and the resuspendedparticles are likely to be deposited onto surfaces again. Hence, theparticle concentration above the heat source changes moregreatly. From Fig. 5, it also can be seen that the fluctuations in theconcentration of PM1 are much greater than that in the concen-tration of PM2.5 and PM10. This is because the small particles haverelatively little inertia, which makes them more susceptible toairflows. For this measurement, the slope of the PM10 dimen-sionless concentration curve is observed to be larger than that ofPM2.5 and PM1 during the first 2 h. This implies that largerparticles have more chances to be deposited onto the surfaces inthe first few hours. However, the percentage of smaller particlesin the sediment particles shows an increase in the latermeasurements.
3.1.2. Particle size distributionKnowing the particle size distribution in the indoor environ-
ment is important because particles with different sizes will havedifferent penetration rates and deposition patterns that are relatedto health effects and material damages. In Fig. 6, the particlenumber concentrations of the Sampling Points A1 and B1 at 0 h,12 h and 24 h after the beginning of the measurement are pre-sented as examples. From Fig. 6, it can be concluded that smallerparticles (�1.15 mm) form majority of the total suspended particles,for both of the air above the heat source and in the indoor envi-ronment. This finding is consistent with those results reported byMorawska et al. [34] and Christopher et al. [35]. It is pointed outthat most of the particles are in the ultrafine size range in the
indoor environment. Small particles can persist in the air since theyare too small for the inertial deposition, hence, they are capable ofremaining airborne for longer periods of time. Fig. 5 shows that theparticle size distribution changes with the time as larger particlessettle faster than smaller particles. At 24 h after achieving the pre-set heat source temperature, the particles with the diameter largerthan 7.0 mm all are deposited onto surfaces. One of the possiblecauses is that the gravitational settling serves as the dominantinfluencing factor on the particle deposition for larger particles.Also, these particles are difficult to be resuspend. In addition, it canbe seen in Fig. 6 that there are more 0.75 mme11.25 mm particlesabove the near-wall heat source than in the adjacent indoor air atthe same time. After the first 24 h, there are no particles larger than2.5 mm in the adjacent indoor air, whereas some particles of2.75e5.75 mm are still above the near-wall heat source. This may beattributed to the enhancement of the turbulent intensity above theheat source and to the fact that some of the larger particles areresuspended.
In order to develop deeper understandings of the effect of thenear-wall heat source on particles with different sizes, thedimensionless concentrations of the 0.265 mm and 2.25 mm par-ticles at the Sampling Points A1 and B1 in Case 2 are plotted inFig. 7. It is shown on Fig. 7 that the deposition patterns of these twokinds of particles are obviously different. The dimensionless con-centrations of the 0.265 mm particles both above the near-wall heatsource and in the adjacent indoor air gently decrease as theelapsed time increases. However, the dimensionless concentra-tions of 2.25 mm particles are more volatile. Hamdani et al. [24]illustrated the evolution of the concentration of the 0.35 mm par-ticles in a chamber with rough wallpaper coverings. The concen-tration of 0.35 mm particles appeared to be less volatile, but theparticle decay rate loss coefficient was larger than that of the0.265 mm particles in this study. Part of the reason for this defer-ence might be due to the different particle sizes and experimentalenvironments. During the early stages of the measurement, thedeposition velocity of the 0.265 mm particles is significantlysmaller than that of the 2.25 mm particles. A possible reason is thelarger gravity of the 2.25 mm particles. As shown in Fig. 7 (b), theC(t)/Co of the 2.25 mm particles declines sharply in the first 4 h.After that, the dimensionless concentrations of the 2.25 mm par-ticles fluctuate around a constant level. One reason for this couldbe that the 2.25 mm particles in suspension are relatively fewer andthe airflow can cause a great difference on the dimensionlessconcentrations.
Fig. 7 (b) which compares the Sampling Points A1 and B1,illustrate that the C(t)/Co of the Sampling Point A1 has a greaterfluctuation. It is likely that the air turbulence intensity above thenear-wall heat source is larger than that in the adjacent indoor air.Hence, more deposited particles are resuspended and particles inother places are more probably carried to the region above the heatsource. Also, it seems that there are more particles of 0.265 mm aredeposited at Sampling Point A1 than that at the Sampling Point B1when the measurement is conducted for 24 h. However, for the2.25 mmparticles, the opposite situation occurred. These results canbe explained by assuming that thermophoretic force plays a sig-nificant role for the smaller particles (0.265 mm). When the tem-perature gradient is larger, the thermophoretic force is greater andit can result in the flow of more particles, hence, it is more probablefor the smaller particles to be deposited. As for larger particles(2.25 mm), the enhancement of the turbulent intensity above thenear-wall heat source may prevent the deposition of some particlesand make more particles resuspended. The initial number of theparticle of 2.25 mm is smaller than that of the 0.265 mm particlesand the effect of resuspended 2.25 mm particles on the C(t)/Co ismore significant.
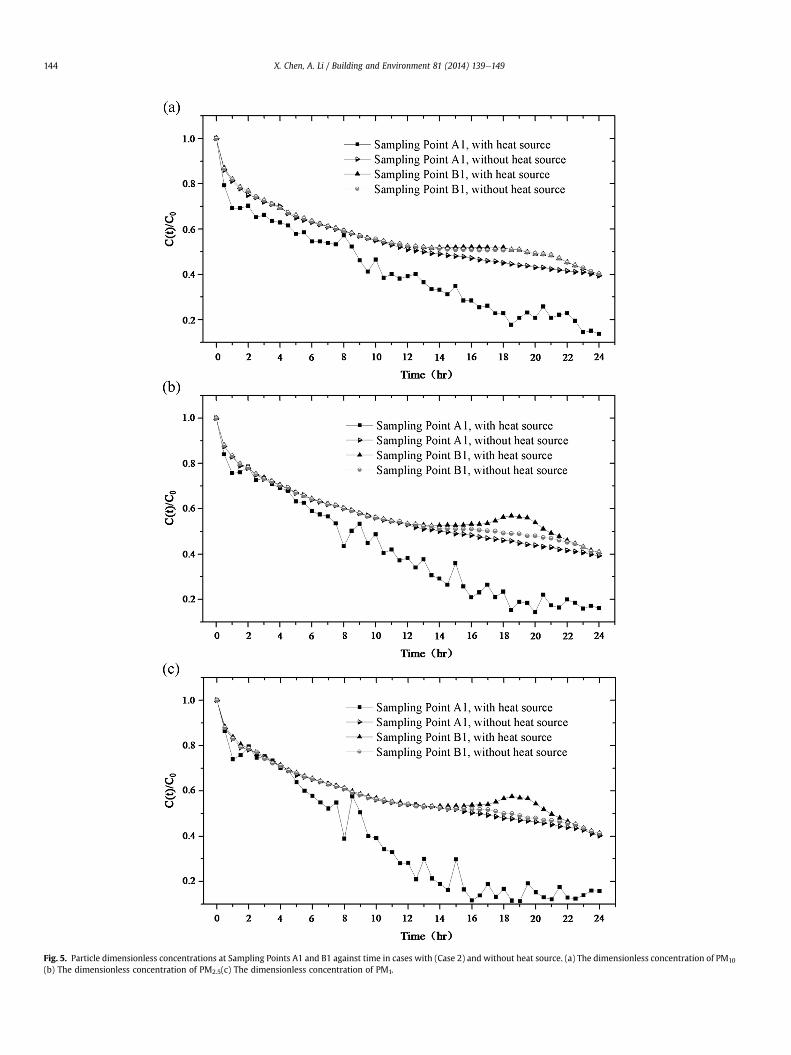
Fig. 5. Particle dimensionless concentrations at Sampling Points A1 and B1 against time in cases with (Case 2) and without heat source. (a) The dimensionless concentration of PM10
(b) The dimensionless concentration of PM2.5(c) The dimensionless concentration of PM1.
X. Chen, A. Li / Building and Environment 81 (2014) 139e149144

Fig. 6. Particle size distributions at Sampling Points A1 and B1 against time under Case 2 (ts ¼ 50 �C,d ¼ 0.00 m) (a) Particle size distributions at 0 h (b) Particle size distributions at12 h (c) Particle size distributions at 24 h.

Fig. 7. Particle dimensionless concentration at Sampling Points A1 and B1 against time under Case 2 (ts ¼ 50 �C,d ¼ 0.00 m) (a) 0.265 mm particles (b) 2.25 mm particles.
X. Chen, A. Li / Building and Environment 81 (2014) 139e149146
3.2. Effect of the heat source temperature on particle decay rate losscoefficient
Fig. 8 illustrates the particle decay rate loss coefficients at theSampling Points A1, A3, and A6 versus the near-wall heat sourcetemperature when the gaps between the heat source and the wallare 0.00 m, 0.10 m and 0.15 m, respectively. As can be seen fromFig. 8, the particle decay rate loss coefficients increase as the heatsource surface temperature increases. It follows that the particledeposition rises when the heat source temperature increases whilekeeping other parameters constant. The particle decay rate losscoefficient at the Sampling Points A1 is mostly affected by thetemperature among these three sampling points. The SamplingPoint A1 is the closest point to the heat source, and it is easier to beinfluenced by the variation of the heat source temperature.Comparing the data in Fig. 8 (a), (b) and (c), the decay rate losscoefficients of PM10, PM2.5 and PM1 at the Sampling Point A1 showmore significant differences than those at Sampling Points A3 andA6. It seems that the differences of b among the particles withdifferent sizes that is caused by the near-wall heat source arestronger in the regions nearer to the heat source. Also, it can beobserved from Fig. 8 that the variation trends of the decay rate losscoefficients of PM10, PM2.5, and PM1 are similar to each other.
3.3. Effect of the gap between the heat source and the wall onparticle decay rate loss coefficient
Fig. 9 displays variations of particle decay rate loss coefficients atthe Sampling Points A1, A3 and A6 with heat source temperaturesof 70 �C, 60 �C and 40 �C, respectively. As it is seen, b decreases asthe gap between the heat source and the wall increases. In otherwords, the increase of the gap between the heat source and thewallhas a negative effect on the particle deposition. As the gap betweenthe heat source and the wall increases, the influence of the heat
source on the near-wall region decreases and the air velocitiesabove the heat source are reduced. The reductions of the thermo-phoretic force and the air velocities lead to the decrease of theparticle deposition. Results also show that the three lines in onefigure (Fig. 9 (a), (b) or (c)) become closer when the gap betweenthe heat source and the wall increases. This could mean thatincreasing gap reduces the effects of the heat source temperatureand the sampling point locations on the particle decay rate losscoefficients.
4. Conclusion
Particle deposition above the near-wall heat source has beenstudied in the present work. Based upon the data generated fromthe experiment and according to our analysis, the following con-clusions may be drawn:
1. After over 24 h of monitoring, the particle dimensionlessconcentrations of PM10, PM2.5 and PM1 above the heat sourceand in the adjacent indoor both fall below 50 percent of theinitial concentrations. The particles above the near-wall heatsource have larger deposition rates than that in the adjacentindoor air.
2. Larger particles are deposited faster than smaller particles.3. The particles with the diameters of 0.75e11.25 mm are located
more above the near-wall heat source than in the indoor air.4. The particle concentrations above the near-wall heat source
have greater fluctuation than that in the adjacent indoor air.5. The deposition patterns of larger particles and smaller particles
above the near-wall heat source are obviously different.6. The particle decay rate loss coefficients increase as the heat
source surface temperature increases.7. The particle decay rate loss coefficients decrease when the gap
between the heat source and the wall increases.

Fig. 8. Variation of particle decay rate loss coefficients with increasing near-wall heat source temperature (a) Particle decay rate loss coefficients of PM10 (b) Particle decay rate losscoefficients of PM2.5 (c) Particle decay rate loss coefficients of PM1.
X. Chen, A. Li / Building and Environment 81 (2014) 139e149 147

Fig. 9. Variation of particle decay rate loss coefficients with the gap between the heat source and the wall (a) Particle decay rate loss coefficients of PM10 (b) Particle decay rate losscoefficients of PM2.5 (c) Particle decay rate loss coefficients of PM1.
X. Chen, A. Li / Building and Environment 81 (2014) 139e149148

X. Chen, A. Li / Building and Environment 81 (2014) 139e149 149
At the present time there are few universally valid conclusionsabout the particle deposition above near-wall heat sources andfurther studies must be carried out. Also, one should highlight thefact that temperature fields and velocity fields above near-wall heatsources have great influences on the particle dispersion anddeposition. For a comprehensive understanding of the effects of thenear-wall heat sources on the particle dispersion and deposition,more measurements of particle concentrations and related envi-ronmental parameters need to be conducted.
Acknowledgment
This research project is sponsored by National Natural ScienceFoundation of China (No. 51178374).
References
[1] Xiao Z, Zhang Y, Hong S, Bi X, Jiao L, Feng Y, et al. Estimation of the mainfactors influencing haze, based on a long-term monitoring campaign inHangzhou, China. Aerosol Air Qual Res 2011;11:873e82.
[2] Wang LT, Wei Z, Yang J, Zhang Y, Zhang FF, Su J, et al. The 2013 severe hazeover the southern Hebei, China: model evaluation, source apportionment, andpolicy implications. Atmospheric Chem Phys Discuss 2013;13(11):28395e451.
[3] Vette AF, Rea AW, Lawless PA, Rodes CE, Evans G, Highsmith VR, et al. Char-acterization of indoor-outdoor aerosol concentration relationships during theFresno PM exposure studies. Aerosol Sci Technol 2001;34:118e26.
[4] Nazaroff WW. Indoor particle dynamics. Indoor Air 2004;14:175e83.[5] Orch ZEl, Stephens B, Waring MS. Predictions and determinants of size-
resolved particle infiltration factors in single-family homes in the U.S. BuildEnviron 2014;74:106e18.
[6] Wallace L. Indoor particles: a review. J Air Waste Manag Assoc 1996;46(2):98e126.
[7] SpilakaMP,KarottkiGD,KolarikB, FrederiksenM, Loft S, Gunnarsen L. Evaluationof building characteristics in 27 dwellings in Denmark and the effect of usingparticle filtration units on PM2.5 concentrations. Build Environ 2014;73:55e63.
[8] Morawska L, Salthammer T. Indoor environment: airborne particles andsettled dust. Weinheim: WILEY-VCH; 2003V.
[9] Lai ACK, Nazaroff WW. Modeling indoor particle deposition from turbulentflow onto smooth surfaces. J Aerosol Sci 2000;31(4):463e76.
[10] Cooper DW. Particulate contamination and microelectronics manufacturing:an introduction. Aerosol Sci Technol 1986;5:287e99.
[11] Lai ACK. Particle deposition indoors: a review. Indoor Air 2002;12:211e4.[12] Licina D, Pantelic J, Melikov A, Sekhar C, Tham KW. Experimental investigation
of the human convective boundary layer in a quiescent indoor environment.Build Environ 2014;75:79e91.
[13] Yu CKH, Li M, Chan V, Lai ACK. Influence of mechanical ventilation system onindoor carbon dioxide and particulate matter concentration. Build Environ2014;76:73e80.
[14] Thatcher TL, Fairchild WA, Nazaroff WW. Particle deposition from naturalconvection enclosure flow onto smooth surfaces. Aerosol Sci Technol1996;25:359e74.
[15] Abadie M, Limam K, Allard F. Indoor particle pollution: effect of wall textureson particle deposition. Build Environ 2001;36:821e7.
[16] Miller SL, Nazaroff WW. Environmental tobacco smoke particles in multizoneindoor environments. Atmos Environ 2001;35(12):2053e67.
[17] Thatcher TL, Lai ACK, Moreno-Jackson R, Sextro RG, Nazaroff WW. Effects ofroom furnishings and air speed on particle deposition rates indoors. AtmosEnviron 2002;36:1811e9.
[18] Lai ACK, Byrne MA, Goddard AJH. Experimental studies of the effect of roughsurfaces and air speed on aerosol deposition in a test chamber. Aerosol SciTechnol 2002;36:973e82.
[19] Howard-Reed C, Wallace LA, Emmerich SJ. Effect of ventilation systems andair filters on decay rates of particles produced by indoor sources in an occu-pied townhouse. Atmos Environ 2003;37:5295e306.
[20] Lai ACK, Nazaroff WW. Supermicron particle deposition from turbulentchamber flow onto smooth and rough vertical surfaces. Atmos Environ2005;39:4893e900.
[21] Schnell M, Cheung CS, Leung CW. Investigation on the coagulation anddeposition of combustion particles in an enclosed chamber with and withoutstirring. J Aerosol Sci 2006;37:1581e95.
[22] Hussein T, Glytsos T, Ondr�a�cek J, Doh�anyosov�a P, �Zdímal V, H€ameri K, et al.Particle size characterization and emission rates during indoor activities in ahouse. Atmos Environ 2006;40(23):4285e307.
[23] Kagi N, Fujii S, Horiba Y, Namiki N, Ohtani Y, Emi H, et al. Indoor air quality forchemical and ultrafine particle contaminants from printers. Build Environ2007;42:1949e54.
[24] Hamdani SEl, Limam K, Abadie MO, Bendou A. Deposition of fine particles onbuilding internal surfaces. Atmos Environ 2008;42:8893e901.
[25] See SW, Balasubramanian R. Characterization offline particle emissions fromincense burning. Build Environ 2011;46:1074e80.
[26] Shao L, Hua Y, Wang J, Hou C, Yang Y, Wu M. Particle-induced oxidativedamage of indoor PM10 from coal burning homes in the lung cancer area ofXuan Wei, China. Atmos Environ 2013;77:959e67.
[27] Salthammer T, Fauck C, Schripp T, Meinlschmidt P, Willenborg S, Moriske H-J.Effect of particle concentration and semi-volatile organic compounds on thephenomenon of ‘black magic dust’ in dwellings. Build Environ 2011;46:1880e90.
[28] Morawska L, Salthammer T. Indoor environment: airborne particles andsettled dust. Weinheim: WILEY-VCH; 2003. pp. 341e55.
[29] Camuffo D. Wall temperature and the soiling of murals. Mus Manag Curatorsh1991;10:373e83.
[30] Bellan LM, Salmon LG, Cass GR. A study on the human ability to detect sootdeposition onto works of art. Environ Sci Technol 2000;34:1946e52.
[31] Massey D, Kulshrestha A, Masih J, Taneja A. Seasonal trends of PM10, PM5.0,PM2.5 & PM1. 0 in indoor and outdoor environments of residential homeslocated in North-Central India. Build Environ 2012;47:223e31.
[32] Lai ACK, Chen F. Modeling particle deposition and distribution in a chamberwith a two-equation Reynolds-averaged NaviereStokes model. Aerosol Sci2006;37:1770e80.
[33] Spilak MP, Frederiksen M, Kolarik B, Gunnarsen L. Exposure to ultrafine par-ticles in relation to indoor events and dwelling characteristics. Build Environ2014;74:65e74.
[34] Morawska L, Jamriska M, Guo H, Jayaratne ER, Cao M, Summerville S. Varia-tion in indoor particle number and PM2.5concentrations in a radio stationsurrounded by busy roads before and after an upgrade of the HVAC system.Build Environ 2009;44:76e84.
[35] Christopher YH, Chao MPW, Cheng ECK. Penetration coefficient and deposi-tion rate as a function of particle size in non-smoking naturally ventilatedresidences. Atmos Environ 2003;37:4233e41.