An Examination of Social Presence in Video Conferencing vs. an Augmented Reality Conferencing
83
Purdue University Purdue e-Pubs College of Technology Masters eses College of Technology eses and Projects 4-30-2010 An Examination of Social Presence in Video Conferencing vs. an Augmented Reality Conferencing Application Travis B. Faas [email protected] Follow this and additional works at: hp://docs.lib.purdue.edu/techmasters is document has been made available through Purdue e-Pubs, a service of the Purdue University Libraries. Please contact [email protected] for additional information. Faas, Travis B., "An Examination of Social Presence in Video Conferencing vs. an Augmented Reality Conferencing Application" (2010). College of Technology Masters eses. Paper 15. hp://docs.lib.purdue.edu/techmasters/15
Transcript of An Examination of Social Presence in Video Conferencing vs. an Augmented Reality Conferencing

Purdue UniversityPurdue e-Pubs
College of Technology Masters Theses College of Technology Theses and Projects
4-30-2010
An Examination of Social Presence in VideoConferencing vs. an Augmented RealityConferencing ApplicationTravis B. [email protected]
Follow this and additional works at: http://docs.lib.purdue.edu/techmasters
This document has been made available through Purdue e-Pubs, a service of the Purdue University Libraries. Please contact [email protected] foradditional information.
Faas, Travis B., "An Examination of Social Presence in Video Conferencing vs. an Augmented Reality Conferencing Application"(2010). College of Technology Masters Theses. Paper 15.http://docs.lib.purdue.edu/techmasters/15

Graduate School ETD Form 9 (Revised 12/07)
PURDUE UNIVERSITY GRADUATE SCHOOL
Thesis/Dissertation Acceptance
This is to certify that the thesis/dissertation prepared
By
Entitled
For the degree of
Is approved by the final examining committee:
Chair
To the best of my knowledge and as understood by the student in the Research Integrity and Copyright Disclaimer (Graduate School Form 20), this thesis/dissertation adheres to the provisions of Purdue University’s “Policy on Integrity in Research” and the use of copyrighted material.
Approved by Major Professor(s): ____________________________________
____________________________________
Approved by: Head of the Graduate Program Date
Travis Byron Faas
An Examination of Social Presence in Video Conferencing vs. an Augmented RealityConferencing Application
Master of Science
Ronald Glotzbach
James Mohler
Bill Watson
Ronald Glotzbach
Gary Bertoline 4/27/2010

Graduate School Form 20 (Revised 1/10)
PURDUE UNIVERSITY GRADUATE SCHOOL
Research Integrity and Copyright Disclaimer
Title of Thesis/Dissertation:
For the degree of ________________________________________________________________
I certify that in the preparation of this thesis, I have observed the provisions of Purdue University Teaching, Research, and Outreach Policy on Research Misconduct (VIII.3.1), October 1, 2008.* Further, I certify that this work is free of plagiarism and all materials appearing in this thesis/dissertation have been properly quoted and attributed.
I certify that all copyrighted material incorporated into this thesis/dissertation is in compliance with the United States’ copyright law and that I have received written permission from the copyright owners for my use of their work, which is beyond the scope of the law. I agree to indemnify and save harmless Purdue University from any and all claims that may be asserted or that may arise from any copyright violation.
______________________________________ Printed Name and Signature of Candidate
______________________________________ Date (month/day/year)
*Located at http://www.purdue.edu/policies/pages/teach_res_outreach/viii_3_1.html
AN EXAMINATION OF SOCIAL PRESENCE IN VIDEO CONFERENCING VS. AN AUGMENTED REALITY CONFERENCING APPLICATION
Master of Science
Travis Faas
04/01/2010

AN EXAMINATION OF SOCIAL PRESENCE IN VIDEO CONFERENCING VS. AN AUGMENTED REALITY CONFERENCING APPLICATION
A Thesis
Submitted to the Faculty
of
Purdue University
by
Travis Byron Faas
In Partial Fulfillment of the
Requirements for the Degree
of
Master of Science
May 2010
Purdue University
West Lafayette, Indiana

ii
To Claire, the originator of my studious life, and to Cheryl Faas, a mother who
made sure I was where I needed to be.

iii
ACKNOWLEDGMENTS
The author would like to thank Kellen Maicher for the time and effort he put into
the ideation and refinement of this document.

iv
TABLE OF CONTENTS
Page LIST OF TABLES .................................................................................................vi LIST OF FIGURES .............................................................................................. vii ABSTRACT ........................................................................................................ viii CHAPTER 1. THE PROBLEM .............................................................................. 1
1.1. Statement of the problem ........................................................................... 5 1.2. Significance of the problem ........................................................................ 5 1.3. Research Questions ................................................................................... 6 1.4. Statement of purpose ................................................................................. 6 1.5. Assumptions ............................................................................................... 6 1.6. Limitations .................................................................................................. 7 1.7. Delimitations ............................................................................................... 7 1.8. Definitions ................................................................................................... 7 1.9. Summary .................................................................................................... 9
CHAPTER 2. LITERATURE REVIEW ................................................................ 10 2.1. Distance Education................................................................................... 10 2.2. Computer supported collaborative learning .............................................. 12 2.3. Computer supported collaborative work ................................................... 15 2.4. Augmented Reality ................................................................................... 20 2.5. Effectiveness ............................................................................................ 27 2.6. Social presence in online education ......................................................... 28 2.7. Conclusion ................................................................................................ 33
CHAPTER 3. METHODOLOGY ......................................................................... 35 3.1. Hypotheses .............................................................................................. 35 3.2. Application Design .................................................................................... 36 3.3. Population ................................................................................................ 37 3.4. Sampling Size & Selection ....................................................................... 38 3.5. Testing Procedure .................................................................................... 38 3.6. Data Collection ......................................................................................... 39
CHAPTER 4. RESULTS ..................................................................................... 40 4.1. Copresence measures ............................................................................. 40 4.2. Social presence ........................................................................................ 42 4.3. Difference in combined systems ............................................................... 45 4.4. Power test ................................................................................................ 46 4.5. Summary .................................................................................................. 46
CHAPTER 5. CONCLUSIONS ........................................................................... 48

v
Page 5.1. Findings and discussion ........................................................................... 48 5.2. Recommendations ................................................................................... 52 5.3. Future work .............................................................................................. 53
LIST OF REFERENCES .................................................................................... 64 APPENDICES
Appendix A. Fiducial given to the participants ................................................. 63 Appendix B. Study Description ........................................................................ 64 Appendix C. Models Used in Google Sketchup ............................................... 65 Appendix D. Copresence Survey .................................................................... 66 Appendix E. Social presence survey ............................................................... 67 Appendix F. Demographics survey .................................................................. 68 Appendix G. Model viewed in ARchat ............................................................. 69 Appendix H. Post task interview questions ...................................................... 70

vi
LIST OF TABLES
Table Page Table 4.1 Copresence measures for ARchat ...................................................... 40 Table 4.2 Copresence measures for GoToMeeting ............................................ 41 Table 4.3 Two factor analysis of copresence ..................................................... 41 Table 4.4 Paired T-test of copresence ................................................................ 42 Table 4.5 Social presence measures for GoToMeeting ...................................... 43 Table 4.6 Social presence measures for ARchat ................................................ 43 Table 4.7 Two-factor analysis of social presence ............................................... 44 Table 4.8 Paired T-test of social presence ......................................................... 45 Table 4.9 Paired T-test of combined social presence and copresence .............. 46

vii
LIST OF FIGURES
Figure Page Figure 1.1 Human Pacman. .................................................................................. 2 Figure 1.2 Zugara Social Shopper. ....................................................................... 3 Figure 1.3 Adobe Connect, web conferencing system. ........................................ 4 Figure 1.4 Augmented reality videochat. .............................................................. 4 Figure 2.1 Milgram-Kashino Mixed-reality continuum. ........................................ 20 Figure 2.2 Construct3D: AR geometry education. .............................................. 23 Figure 2.3 Augmented molecule. ........................................................................ 24 Figure 2.4 Physics Playground. .......................................................................... 26 Figure 3.1 Example of the application. ............................................................... 37

viii
ABSTRACT
Faas, Travis Byron. M.S., Purdue University, May, 2010. An Examination of Social Presence in Video Conferencing vs. an Augmented Reality Conferencing Application. Major Professor: Ronald Glotzbach.
This study focused on the implications of augmented reality videochat when
used in an educational context. Traditional web conferencing systems are
impaired by limitations that inhibit their use for education, primarily due to their
difficulty in creating social presence. An augmented video chat system was
created that allowed two users to interact with a three dimensional models
displayed on top of paper markers called fiducials. This chat system was tested
to ascertain if it was able to create more social presence than a traditional web
conferencing system. The two systems were found to create similar amounts of
social presence during use. Implications for educational use and future web
conferencing systems are discussed.
1
CHAPTER 1. THE PROBLEM
Augmented reality applications are on the threshold of being ready for
practical, mainstream use. The term “augmented reality” was coined in 1990 by
University of Arizona professor Tomas Caudell during his time at Boeing (Chen,
2009). He used the term to describe a head-mounted display that could help
guide workers as they assembled parts for airplanes. In 1992, Milgram and
Kashino further refined the concept of augmented reality by placing it within their
mixed reality continuum. They defined augmented reality as a real-time
combination of the real world and digital world that contained a majority of data
from the real world. By 2008, hardware and software had advanced to the point
that users were able to run augmented reality applications in their web browsers
and cell phones. In 2009, some of the first augmented reality applications to
arrive for mainstream use were the “augmented reality browsers” WikiTude,
Layer, and NearestPipe. These applications run on mobile phones and overlay
information about the surrounding location on top of live video from the phone's
camera.
There is currently a lack of scholarly literature on the effectiveness of
applied augmented reality systems, especially concerning the social factors of
simultaneous users. The relatively small amount of work previously conducted
focused on the perception of mixed-reality space, usability, and educational
issues. Recently more systems are being built that have a distinctly social
component.

2
Figure 1.1 Human Pacman.
Human Pacman is one example of an augmented reality game with social
components (Cheok, Goh, Liu, Fabiz, Fong, Teo, Li, & Yang, 2003). In this
familiar game, users are given mobile computers and take the role of either
“Pacman” or an enemy “ghost.” (See Figure 1). As users move about, cameras
capture the surrounding environments, which then have game play elements
overlaid on top of them. By looking at the environment through the mobile
display, the user sees a combination of real and virtual elements that update
respectively as they move about in physical space. Similarly, the “ghost players”
see the environment from their own unique perspective. Ghosts players chase
the Pacman player around town, and must collaborate together in order to
capture the Pacman who is completing the level.
Similar games and applications are now being built that highlight the
capabilities of augmented reality for use in social ways, such as the Webcam
Social Shopper by Zugara shown in Figure 1.2. This program allows users to try

3
on different styles of clothing digitally, and to share the images of the results with
friends via FaceBook or email. The clothes are placed on top of the users
through computer vision, and users can cycle through different types of clothes
through an on-screen interface that is activated by motion detection. Once they
find a piece of clothing with which they are happy, they can take several
snapshots that can be shared with friends in asynchronous ways. Although the
Zugara program does not include real-time interaction with other users, one can
easily imagine the video of users trying on clothes being broadcast to others who
can provide immediate feedback.
Figure 1.2 Zugara Social Shopper.
Web conferencing systems, such as Adobe Connect and Citrix
goToMeeting, could benefit from integrated augmented reality elements.
Currently, online meeting systems combine live video with separate panels for
supplementary information (such as a PowerPoint presentation).

4
Figure 1.3 Adobe Connect, web conferencing system.
Figure 1.4 Augmented reality videochat.
A typical web conferencing system is set up much like that shown in
figure 1.3. In a setup like this, the user video becomes a secondary component,
and is used most often to confirm if participants are still paying attention or if they
are ready to move on. The loss of video primacy in these systems may lead to

5
less emotional connection between users. Figure 1.4 shows an example of an
augmented reality videochat system. These systems can combine both the
speaker and more of the complementary material such as graphics or text in the
same viewing range, possibly permitting better connection and communication
between users.
1.1. Statement of the problem
Video conferencing systems do not provide sufficient social presence
when used in an educational setting.
1.2. Significance of the problem
As more students move online to further their education, they need
software that supports distance learning. One aspect of many courses is when
projects and discussions are done in groups. Although nothing may reach the
effectiveness of meeting with group members in person, systems should be
developed that encourage users to share ideas and talk in ways that create the
highest levels of learning. A strong sense of social presence is required to
achieve these strong interactions (So & Brush, 2007). By and large, business
communication systems were not designed to provide a strong sense of this
presence and use of these systems may result in lessened learner group
performance.
Current web conferencing systems are generally not designed specifically
for students and educational purposes. Web conferencing systems and many
other collaborative technologies are built in order to support business needs
(Nari, Whittaker, & Bradner, 2000; Whittaker, Swanson, Kucan, & Sidner, 1997).
Often, these systems do not translate well to learning contexts and educational
environments. Unlike an office environment where productivity and efficiency is
key, educational applications need to create connections between users, allow
those users to discuss and explore ideas, and create a good sense of shared

6
knowledge between learners (Ahern et al., 2006). Much work has been done in
creating online spaces for learners but one area that has not been thoroughly
investigated is online meeting systems.
1.3. Research Questions
This study investigated two questions related to the use of augmented
reality and video conferencing applications in online education:
Does an augmented reality chat application create a stronger sense of
presence compared to web conferencing systems?
Are video conferencing systems or augmented reality conferencing
applications better for computer-supported collaborative learning?
1.4. Statement of purpose
This study served as a preliminary exploration of the effects of an
augmented reality web conferencing system on collaboration and social
presence. Specifically, it examined the amount of social presence generated by
an augmented reality conference system during its use.
1.5. Assumptions
These aspects of the study were assumed:
Participants will make an effort to finish assigned tasks in a timely manner.
Participants will answer questions accurately.
A sample drawn from Purdue will represent a general postsecondary
population.
CiTrix GoToMeeting is representative of the gamut of online conference
systems.

7
1.6. Limitations
The study was concerned with only these issues:
The communication efficiency and affective aspects of the two modes of
collaboration.
Collaboration between only two simultaneous users.
Less than ten-thousand polygons and flat-shaded three-dimensional
models used in the augmented reality system
Augmented reality using Adobe Flash technology.
A collaborative setting for the use of augmented reality.
Gestures used to communicate to others.
1.7. Delimitations
The study specifically will not consider:
Distance education lectures using augmented reality techniques.
Alternative recognition technologies such as Studierstube or Reactivision
to augment reality.
Specific content areas to be taught.
1.8. Definitions
Augmented Reality: A mixed reality with a higher combination of real data than
virtual data. (Milgram & Kishimo, 1994).
Common ground: a basis agreed to by all parties for reaching a mutual
understanding (Princeton wordnet).
Computer supported collaborative learning: “an emerging branch of the
learning sciences concerned with studying how people can learn together
with the help of computers” (Stahl, Koschmann, & Suthers, 2006).

8
Computer supported collaborative work: “a generic term, which combines the
understanding of the way people work in groups with the enabling
technologies of computer networking, and associated hardware, software,
services and techniques” (Wilson, 1991).
Constructivism: reality is constructed by the knower based upon mental activity
(Jonassen, 1991).
Embodied interaction: “the creation, manipulation, and sharing of meaning
through engaged interaction with artifacts“(Dourish, 2001).
Mixed Reality: "...anywhere between the extrema of the virtuality continuum."
(Milgram & Kishimo, 1994).
Rich Media: Personal media that contains a large amount of information
(Ngwenyama, & Lee, 1997).
Social Presence: “degree of salience of the other person in the interaction and
the consequent salience of the interpersonal relationships” (Short,
Wiliams, and Christie, 1978)
Telepresence: “an illusion that a mediated experience is not mediated”
(Lombard and Ditton, 1997)
Virtual learning environment: a package to help lecturers create a course
website with a minimum of technical skill, including tools for discussion
and document sharing (Morgan, 2003).
Virtuality Continuum: The range between the completely virtual and the
completely real (Milgram & Kishimo, 1994).
9
1.9. Summary
This chapter presented a brief overview of the problem of the lack of
presence in online education and one possible technology, augmented reality,
which may be useful in correcting it. The next chapter will delve into the literature
and explore the theories and definitions that inform the current realm of thought
on presence, collaboration, online learning, and augmented reality.
10
CHAPTER 2. LITERATURE REVIEW
As more students take advantage of the internet to learn, care must be
taken to investigate new technologies that will support them in their endeavors.
The following is a review of relevant literature on constructing educational
augmented reality technologies. These technologies have the potential to help
students collaborate with 3D models. Most of the literature is drawn from the
fields of computer-supported collaborative work-learning, with recent additions
addressing the potential benefit augmented reality has to bring to collaboration
and education.
2.1. Distance Education
An increased demand for distance education has underscored a need for
supplementary assistance in the form of online instruction. During the 2006 to
2007 school year, 65% of postsecondary institutions within the United States
offered online courses for credit (Parsad & Lewis, 2008). Additionally, 3.5 million
students enrolled in online courses in 2006, which was a 10 percent increase
from 2005 (Allen & Seaman, 2007). Currently, many of the communication
systems that students use are not specifically designed for class discussion and
instruction. More often than not, this includes software designed for commercial
and office use. The disparity between systems meant for work and those
intended for instruction can significantly reduce the efficiency of the learning
process (Ahern, Thomas, Tallent-Runnels, Lan, Cooper, Lu, & Cyrus, 2006).
With such a large amount of students enrolled in distance education classes
using these systems, there is a significant rationale for creating new systems that
11
are specifically targeted at teaching and learning online. Even with a lack of
digital communication systems specifically designed for learning, numerous
technologies are available for use in distance education. The most common form
of such technology is called a “learning content management system”, a “virtual
learning environment”, a “learning management system”, or a “course
management system”. A virtual learning environment (VLE) is a package of
technologies focused on disseminating information to students and aiding the
instructor in communicating with the students via grade books, message boards,
and online chat. Well-known course management systems include
BlackboardVista, Moodle, and Sakai (the last two being open-source
technologies that allow schools to customize the technology as they see fit).
Other programs may also be used in combination with these virtual learning
environments.
In addition to distance learning programs, some educators use other
types of educational software to help students learn and practice various tasks.
For instance, astronomy classes may use a virtual planetarium or a physics class
may make use of an online interactive homework system to provide immediate
feedback to students. These types of systems could fall under the blossoming
area of educational games. Such systems are meant to help students learn, but
they are not meant to aid in the corollary parts of instruction such as
administrative duties and communication between users. To aid in
communication, VLEs will often include a text-based chat or forum feature.
The richness of the communication between users of virtual learning
environments suffers because VLEs are primarily text-based web sites. The
reliance on text makes VLEs different than a traditional classroom, which has the
advantage of using face-to-face interaction to support any text used. To allow
educators to approximate this element of classroom interaction, distance
education is often supported by lectures that are recorded into a digital video
format and later disseminated through a VLE for student viewing. A complex
recording setup has previously been required for maintaining and controlling the

12
lecture recording equipment, but recent technologies such as Apresso
Classroom are making it easier to record and store the lectures institution-wide.
These videos can be stored and re-used as needed, but they may not create a
sense of instructor presence.
If a student taking a distance course desires to make direct contact with
other class participants in real time, apart from making the trip to physically meet,
video streaming services or online meeting systems may be used. Commonly
used video chat programs are Skype, AIM, and ooVoo. These video chat
services are used in combination with a web cam and microphone. Skype is the
most common application, perhaps due to its penetration as a standard voice-
over-IP (VOIP) software solution. (Pash, 2008). Web conferencing systems
place these live streams into a system that allows for other types of
communication, such as text chat, presentations, screen sharing, and digital
whiteboards. There are a number of web conferencing systems. Some better
known ones are Adobe Connect, Microsoft Office Live Meeting, and CiTrix
GoToMeeting. These conferencing systems are the underpinnings of computer
supported collaboration.
2.2. Computer supported collaborative learning
Computer-Supported Collaborative Learning (CSCL) is an approach to
education combining constructivist theory, multiple learners, and computers.
CSCL was first used as a term to describe a particular type of teaching in 1989 at
a conference in Maratea, Italy (Stahl, Koschmann, & Suthers, 2006). During the
1980s CSCL research was founded primarily on constructivist theory during the
teaching of the Logo programming language to students (Stahl, Koschmann, &
Suthers, 2006). CSCL is based on constructivist theory. Constructivism is a
theory that knowledge is constructed by the learner instead of being transferred
from teacher to student (Ertmer & Newby, 1993). Constructivism also theorizes
that the construction of knowledge is socially situated, or that learner’s creation of

13
internal knowledge is influenced by their interaction with other people and ideas
(Vygotsky, 1978; Bruner, 1990). Computers can play an important role in
constructivist-based education. First, by giving students access to a large amount
of information, learners are able to construct their knowledge of a subject by
consulting a number of different sources on a subject. The socially-situated
nature of constructivist learning, one that suggests students cannot form a piece
of knowledge without interacting with another’s viewpoint, also stresses the
importance of using computers to connect two individuals in an act of
collaborative learning. With or without a collaborator, the learning technology
employed must lead to contingencies, or a concept that challenges a learner’s
current views of a concept and forces them to construct a new meaning for
themselves that integrates the contingency they are dealing with into their body
of knowledge about the subject.
CSCL has shown some promise for motivating students to learn. In
Finland a CSCL curriculum was tested in their secondary education system
(Lipponen, 1999). The curriculum combined exercises and the CSILE
collaboration environment. The CSILE environment, similar to today’s wikis,
allowed students to create nodes of content, and collaboratively edit and link the
content within those nodes. The CSCL system was tested without guidance or
training on the computer technologies. The educators produced learning tasks for
their students that were not well-defined, and were unable to help when
questions arose. By the end of the first year, the students had started to act in
self-regulating ways and took initiative to define and complete their assignments.
The student independence came with a tradeoff: the students would ‘collaborate’
by asking each other factual questions (“What is the answer to…”), and stayed
away from deeply understanding the concepts. The researchers noted a distinct
gender difference in the adoption of CSCL; boys tended to take a major part in
the collaborative activities. There were great benefits for the boys who were very
passive in the traditional classroom; during the CSCL segments these males
were some of the most active and productive in their classes. Lipponen

14
concludes by warning that while their particular implementation of CSCL was
very good at bringing out first-order (basic) learning effects in the students, the
CSCL system studied in Finland was not able to produce second-order (deep
understanding) effects, resulting in a system that did not have the intended
benefits of CSCL: the deep understanding of material built by collaborative
learning.
What the Finnish study may have lacked that is necessary for effective
CSCL is genuine interdependence (Fjuk, & Krange, 1999). Genuine
interdependence is the sharing of information, joint thinking, and a division of
labor during collaboration. Fjuk and Krange recommend CSCL programs to
assign tasks over time to achieve genuine interdependence by forcing students
to collaborate efficiently. Limiting the time in such a manner requires that the
software used should be as efficient as possible to allow for the best possible
collective and educational interaction. A critical component of an efficient
collaborative technology is up-to-date workspace awareness. Finally, the
researchers state that a balance of distance and closeness to peers is the
preferred way to implement CSCL. Distance in this context refers to time when
users are not aware of, or directly interacting with, other users. When "distant,"
students spend time working on personal assignments and thinking
introspectively. When “close,” students interact with the other users and
encounter new ideas they may integrate into acquired knowledge.
While distance is essential for personal tasks and reflection, collaborative
learning technologies require that students interact with each other. Collaborative
interaction requires some shared space to provide students a way to
communicate with each other. To create this shared space, distance educators
often employ technologies such as wikis or interactive whiteboards that allow
multiple uses to contribute simultaneously. When distance learners wish to
interact with and discuss complex digital data at the same time, collaboration
becomes more complex.
15
2.3. Computer supported collaborative work
Fortunately, the field of computer-supported collaborative work (CSCW)
provides potential insight into how to create effective distance collaboration
software. The field of CSCW seeks innovation in computer systems built to aid in
distance collaboration. They often combine the physical and the digital into a
mixed-reality space. A good example of the mixed-reality CSCW system was a
digital presentation space designed to allow engineers to meet from a distance
(Regenbrecht, Lum, Kohler, Ott, Wagner, Wilke, & Mueller, 2004). Regenbrecht
constructed a space that placed web camera video onto 2D planes inside a 3D
space. The system tracked gaze and tilted a 2D plane as a user moved their
eyes to indicate what they were currently looking at. These tilted planes allowed
for users to know who was talking to them directly. During the meeting
engineering models and PowerPoint presentations could be displayed in a
common area. The system had very limited interaction between users and virtual
data beyond displaying and discussing information.
Previous research has indicated that the mode of communication has an
effect on cooperation and perception of collaborators. In 2000, Jensen, Farnham,
Drucker, and Kollack investigated the effects of communication modalities on
cooperation by varying the mode of communication between collaborative tasks.
Four modes of communication were used: no communication, text only, text-to-
speech (translating typed text into sound via computer synthesized speech), and
live audio. The subjects were asked to play a game of Prisoner’s Dilemma. In the
game, victory is gained by having the most ‘points’ at the end of a round. The
most effective way to get the most points is to trust and collaborate with the other
players. However, players may renege on promises, giving them the advantage
for the round. Depending on the players, this facet of the game may lead to an
atmosphere of distrust. The researchers found that the players had higher
opinions of their fellow players and gained more total points as the
communication mode moved up from no communication to full speech. The
players reported that the higher opinions resulted from a sense that the other

16
player was more intelligent, likeable, and cooperative than in the lower
modalities.
The effects of communication modality shares elements with the theory of
social presence. Social presence can be loosely defined as the feeling that an
individual is interacting with the user when they are actually quite far away. In
2001, Bradner and Mark investigated the effects of application sharing (two users
viewing and interacting with the same screen from remote locations) on
perceived social presence. By digitally observing users completing simple math
problems via video chat or application sharing, the researchers were able to
discern that perceived social presence is approximately the same in both
contexts. When subjects perceived this social presence their performance
suffered during the pre-collaborative (planning to speak) phase, possibly
because they felt they had to ‘perform’ for those who were watching them.
Bradner and Mark recommended giving users the option to suspend and resume
when collaborative contact is needed.
A possible component of social presence is the richness of the
communication mode used. Researchers in CSCL have been investigating the
utility of rich video conference applications starting with the ground-breaking work
of Chapanis in the 1970's. Chapanis conducted a series of studies to measure
the effects of video sharing on distance communication, with an emphasis on the
ability of video to convey nonverbal gestures known as cognitive cues (Chapanis,
Ochsman, Parrish, & Weeks, 1972). During the original study, the video focused
on the face and torso of the distant collaborator. Chapanis then compared the
efficiency of the video and audio-only communication. The author’s results
indicated that video did not serve as an effective method for transferring cognitive
cues; in many cases, the video channel performed only equally as well as the
audio-only communication mode.
Video does have some traits that allow it to serve as a preferred
communication channel. In 1995, Steve Whittaker observed that while face-to-
face video of another person during communication was not effective for

17
cognitive (turn-taking) cues, it was able to pass on affective (or emotional) cues
to other users. Whittaker also suggested another use of video, a concept he
termed "video-as-data". Video-as-data was live video sent to others to create a
"shared physical context", or a video image that all parties could assume to be
the same. Whittaker described four uses for video-as-data: coordination,
disambiguation, physical embodiment of progress, and education. In a
neurosurgery context, coordination was defined as the ability for the video to
allow the nurse to anticipate the surgeon’s next need by looking at the current
status of the operation. Disambiguation would allow the video to be broadcast to
consultants in other areas for real-time input. Physical embodiment allows for
distant operators who may be needed later to know where the operation is at and
approximately how soon they will be needed. Finally, education allows for
academics and trainees to view and learn from the surgery from outside the
operating theater.
Much of the research on the utility of video now focuses on the concept of
video-as-data, specifically the shared environment it can create. In recent years,
the most common situational study would use live video in a “worker-helper”
setup. The worker would be physically present with some object that needed to
be manipulated while the helper was a remote expert who has a live video of the
worker’s environment and the ability to talk with the worker. Case-studies
highlighted in the literature include an anesthesiologist watching a live surgery
(Nardi, Kuchinsky, Whittaker, Leichner, & Schwartz, 1995) and a master
mechanic advising a novice on site (Fussel, Kraut, & Siegel, 2000). Kraut,
Gergle, and Fussel have conducted a series of studies into the important
properties of a shared visual space, and how it influences collaboration, though
the use of a digital application that mimics screen-sharing technology. Their
application recreated the worker-and-expert setup by sharing a puzzle screen
between two users and allowed only the ‘worker’ to manipulate the pieces. The
'expert' user was provided a picture of the finished puzzle and had to guide the
worker to finishing the puzzle. The authors found that a shared visual space

18
reduced the number of words employed by the worker, and decreased the total
task time (Kraut, Gergle, & Fussel, 2002).
Kraut et al. also examined the ability of shared visual space to ground the
conversation. The theory of grounding, proposed by Clark and Brennan in 1991,
describes the process of reaching “common ground” (what a speaker can
assume everyone knows) during communication. For instance, certain cultural
ideas such as country colors or name brands, can be considered “grounded” and
require no explanation when used. The process of grounding happens
continuously and eventually leads to more efficient communication. The space
around speakers can be assumed to already be common ground, and quickly
grounded during conversation. Through the use of deictic expressions ('this one',
'that', 'there') and confirmatory messages ('I get it', 'ok') two speakers can quickly
confirm they are speaking about and manipulating the correct items without an
extraneous amount of speech. Shared video can mimic real space and allow for
similar common ground. During a series of tests with their puzzle application,
Kraut, Gergle, and Fussel found more deictic phrases and less confirmatory
messages were used when a shared video of the puzzle was present. The
researchers speculated this was due to the common ground the video created
between the two collaborators (Kraut, Gergle, & Fussel, 2002).
In addition to video creating shared space, it also can be used as a
medium for physical actions to replace spoken language, potentially leading to
more effective and natural communication. Kraut et al. observed sessions of their
puzzle tasks for instances where actions were used as a method of
communication. The researchers found that if workers made the correct action
(such as placing the right puzzle piece in the right area) the expert moved on to
the next set of instructions, reducing the need of confirmatory speech. The
researchers concluded that because the other user can view their actions, one's
actions spoke for themselves. With this, shared space dialogue is only needed to
present new instructions, clarify unclear instructions, or correct an improper
action (Kraut, Gergle, & Fussel, 2004).

19
In addition to removing the need for confirmatory messages, actions can
be used to communicate. To examine the ability for gestures to communicate
over distance Kirk, Rodden, and Fraser (2007) introduced hand gestures into a
worker-and-expert situation. During the study, the researchers projected the
expert's hands onto the worker's table, enabling the expert to indicate items and
communicate motion through moving their hands. The expert and worker were
placed at separate desks within the same room and an image of the other desk
was projected onto their own. The subjects were then asked to build a specific
Lego model. During the task the worker had the Lego pieces and the expert had
the assembly instructions. Two trials were run, one with projected hands, and
one without. When gestures were projected on the worker’s desk, the two
collaborators were able to complete the task more efficiently and with less
speech. The researchers observed that when the projected hands were not
present, the subjects had a tendency to speak at the same time. The researchers
proposed that the presence of the projected hands may create some amount of
social presence, allowing for cognitive cues to guide the flow of communication.
It should be noted that in this study both users were present in the room at the
same time, which could have contributed to the sense of the other person “being
there.” Another important point to note was that collaborators became faster at
completing the task the more they became familiar with it, eventually making the
projected gestures unnecessary. The researchers assumed that the conversation
was becoming grounded by virtue of the subject’s acquired expertise with the
task. Kirk et al. state that gestures may only be useful for the start of a
collaborative project or whenever a task is not routinely performed.
Recently, focus has shifted from investigating the effect of video on
collaborative processes to modeling the factors that lead to grounding between
two people. The eventual goal of this line of research is to construct a
computational model that will allow a computer to analyze whether a human
understands the system and provide more or less information based on the cues

20
given. Shared visual space, and the grounding it provides, is an important factor
in the creation of the computer models.
Consider a user who refers to an object nearby in the physical world. If he
says "It’s by that one,” the computer would not necessarily know what “that one”
means. If the computer has access to the current visual space, as well as a
visual memory, the chances for the computer to determine what the user was
talking about increases significantly compared to a speech-only computation
(Gergle, Rose, & Kraut, 2007).
2.4. Augmented Reality
Augmented Reality (AR) has the potential to bring the benefits of a shared
space, face-to-face interaction, and digital data together. The term augmented
reality is best understood in the Milgram-Kashino mixed reality framework. On
one side is augmented virtuality, which is predominately digital data and small
amounts of the real environment. The other side is augmented reality, which is a
combination of the real environment and a small amount of virtual data (Milgram
and Kishino 1994; Milgram, Takemura et al. 1994). Typically the 'real
environment' is presented to a user as video on a device. A common use for AR
is overlaying data spatially in the video. The tracking for placement of the 3D
data into the video stream can be done a number of ways, but one of the more
common techniques is the use of 'fiducials'.
Figure 2.1 Milgram-Kashino Mixed-reality continuum.
Fiducials are printed markers that allow a computer to quickly process the
rotation and distance of 2D plane in the video, and place digital data on top of

21
that plane. This type of marker identification is implemented by default in
ARtoolkit, and similar toolkits (Studierstube, Reactivsion). Augmented reality can
be displayed either on a computer screen, on a Head Mounted Display (HMD), or
on a mobile device. Screen-based AR presents the video data on a computer
monitor and often is setup like a “mirror” that reflects the world in front of the
screen with augmented data overlaid on top. An HMD is a set of goggles or
glasses that display the world at approximately where the user's eyes are, plus
the virtual data, on screens inside the HMD. This allows the user to move freely
about, and experience a true ‘augmented reality’. Mobile devices such as
smartphones combining the screen display, but show the world behind the device
instead of in front.
Augmented reality in Adobe Flash has received a lot of attention now that
FLARtoolkit has been out for over a year. Tools have appeared that allow for
developers to use FLARtoolkit faster and easier (most notably FLARmanager
and ARtisan).The basic ability to do fiducial tracking has been available to Flash
in the form of Reactivision and the TUIO interface for a number years. The major
problem with fiducial tracking in Reactivision was that it was limited to 2
dimensional (x and y) tracking. A number of very interesting demos have been
created using Reactivsion and Flash by developers who are very interested in
the area of tangible computing. Users are now beginning to explore the
possibilities of FLARtoolkit beyond simple tech demos. Some of the notable early
uses of FLARtoolkit are the GE Smartgrid demo, a number of AR business cards,
and an AR game titled RubberDuckzilla. Recently, Peter Kaptein mocked up an
interface similar to the one found in "Minority Report" using two fiducials to input
data and gestures. This interface has been claimed by some as the arrival of
developers who are beginning to use FLAR for more than novelty's sake. Prior to
FLARtoolkit, academics and companies developed augmented reality
applications with Artoolkit, NYARtoolkit, or studierstube. Some notable
applications include Construct3D, human pac-man, wikitude, and Eye of
Judgement.

22
One uncommon way to present augmented reality data is through
streamed video. In 2004 Barakonyi, Fahmy, and Schmalsteig created an
augmented reality chat system, resulting in each user seeing both their partner
and digital data that their partner could manipulate. To create a reliable system,
several technical factors were considered before completing the project. The
most important factor was the ability of the computer to recognize the fiducials on
compressed video. After a series of tests, the researchers determined that a
computer could recognize fiducials on the compressed video almost as well as
the uncompressed video. This rule holds true only when the fiducials being
placed a short distance from the camera. Compared to uncompressed video, the
computer recognition degrades quickly for compressed video. As such, there was
no need to pre-compute any data before sending the compressed video to the
other user's computer for processing and overlaying the 3D objects. After
determining the acceptability of the compressed video, the researchers created a
3D volumetric application for their chat system, and ran some preliminary tests
with potential users. For their augmented reality videochat system to work
efficiently, a sufficiently large and well-lit space was required to display both the
person and fiducial. Additionally, their AR chat system was inefficient for shared
applications due to the lag of video transfer. They attempted to create a user
interface for the system by 'floating' items in the video (placing them on top of the
video data, like sticking decal on a window in front of the video), but it was too
distracting to be useful. After presenting their application to a small sample of
potential users, the researchers received positive feedback about the
intuitiveness and potential usefulness of the application.
The speculated potential for augmented reality systems in aiding computer
supported collaboration stems from the idea of a “mixed reality” which refers to
the technique of combining physical and digital data in a form that feels “real”
(Milgram & Kishino, 1994). One good example is the concept of tangible bits,
which is described as technology that, "allows users to ‘grasp & manipulate' bits

23
in the center of users' attention by coupling the bits with everyday physical
objects and architectural surfaces" (Ishii & Ullmer, 1997).
While describing tangible bits, Ishii and Ullmer envisioned a new type of
computer with the standard UI of computer screen, icons, and desktop replaced
with physical items such as trays and instruments. Physical interaction with these
devices would achieve the same results as a standard computer UI, but in more
intuitive and distinctly physical way (Ishii & Ullmer, 1997). Ishi/Ulmer provide one
example that demonstrates how a tangible user interface (TUI) could be
achieved through the use of panes of glass as mobile screens, small objects as
stand-ins for files, and a room where the background noise is information about
coworker actions. These types of interactions are described by Paul Dourish as
“embodied interaction”. Embodied interaction is a way of thinking about and
creating the digital world in the way that humans evolved to interact with the
physical world (Dourish, 2001).
Figure 2.2 Construct3D: AR geometry education.

24
Coupling the digital and physical world has resulted in some useful
learning technology. One example is Construct3D, an AR spatial ability training
tool shown in Figure 2.2 (Kauffman, Steinbugl, Dunser, & Gluk, 2003). The
program mimicked many of the major functions of a 3D modeling package, but
was built only as a geometry education tool. In other words, there was no output
for the software. Construct3D allowed multiple users to interact with the program
in the same room by giving each user a HMD and their own interaction device,
called a PIP (personal interaction panel). The PIP displayed data and allowed
users to manipulate 3D objects using a pen, much like tablet PCs that are
currently on the market. Informal usability tests, based on an ISONORM usability
questionnaire, were run on Construct3D and users found it quite “easy to use”
and “well suited to the task”. The researchers found that for collaboration,
augmented reality provided a much more natural interface compared to standard
CAD-based workspaces.
Figure 2.3 Augmented molecule.

25
In addition to geometry, augmented reality has shown some promise in
chemistry education. Through interaction with four chemistry students using a
screen based AR system that displayed interactive 3D molecular models, Chen
(2006) found that an augmented-reality model can be nearly as useful for
chemistry education as a standard physical model. The major item that the four
students lacked was the physical feedback from the physical models. This was a
tradeoff, as AR has the benefits of interactivity and animation. The interaction
that was programmed for this study of AR models was a bit limited and buggy,
leading to insights into frustration points that should be addressed when
programming AR model manipulation. The most important of these was allowing
360 degrees of rotation in all three axes.
The study by Chen implies that the sense of touch, sometimes called
haptics, may be an important sense that is lacking in augmented reality. An
interesting approach to addressing this problem is to attach fiducials to physical
models as shown in Figure 2.3 (Gillet, Sanner, Stoffler, Goodsell, & Olson, 2004).
To test this approach, the researchers used auto-fabrication (3D-printing) devices
to make molecular models from their digital counterparts, and attached fiducials
to important areas of the model where digital data was desired. Potential points
for fiducials identified by Gillet et al. were: parts of a molecule that could have
different configurations, places where animation could be used to communicate,
or parts where interaction is desired beyond what a physical model can provide.
The researchers developed an augmented reality module to their molecular
modeling software, called PVM. During testing the first prototypes the model
would often obscure the fiducial, resulting in a loss of the digital overlay on the
computer screen. One solution that worked well was simply attaching several
fiducials to the model so that one would always be visible to the computer's
camera.
Augmented reality has also been used with some success in physics
education. Traditional physics lessons were recreated with digital models by
adding a software physics engine to the same framework used by Construct3D,

26
(Kaufmann & Meyer, 2008). The system (shown in Figure 2.4) was called
PhysicsPlayground, and allowed students to replace physical experiments with
similar digital experiments.
Figure 2.4 Physics Playground.
In an original version of a force-counterforce experiment, two students would
stand on wagons, and each would hold one end of a rope. The first student
would pull on the rope, then the second student, and finally both would pull on
the rope. Regardless of who was pulling, both wagons would move the same
distance. PhysicsPlaygound allowed the students to recreate the experiment by
creating simple digital models, and applying forces to the models. The
researchers mentioned that an advantage of using augmented reality to run a
physics experiment was the ability to display accurate, real-time graphs of
variables of interest.

27
2.5. Effectiveness
There are several barriers that limit the utility of both video chat and
augmented reality for collaboration. The majority of these barriers were identified
in the 1990's while many collaborative virtual environments (CVE) were built and
tested. “Beyond Being There” was a keystone paper that helped to define future
work in the area of CVEs (Hollan & Stornetta, 1992). In the paper, the authors
pointed out that any attempt at digitally recreating face-to-face interaction would
never fully recreate the real experience of being present with another. Instead of
recreating face-to-face interaction, Hollan and Stornetta proposed that a digital
communication medium should utilize its inherent strengths such as
asynchronicity and automatic backup. The reason real face-to-face interaction
may never be recreated digitally is that users of computer systems must keep
two different egocenters (senses of where they are), one for the digital space,
and the other for their physical space (Raskar, Welch, Cutts, Lake, Stesin, &
Fuchs, 1998).
A study in 2006 reinforced the preference of real life interaction over
virtual environments (Haubr, Regenbrecht, Billinghurst, & Cockburn, 2006). The
researchers created four collaborative setups using a standard computer monitor
and a touch-sensitive table display and asked the subjects to match pictures of
dogs with their owners. The four collaborative setups created were face-to-face,
spatial-local, spatial-remote, and 2D videoconferencing. Face-to-face was an
actual physical meeting between users; spatial-local was a full-screen image of
their collaborator and the pictures on the table display; 2D videoconferencing
displayed a videoconference application and a 2D photo sharing application on a
computer monitor; finally, spatial-remote displayed the collaborator's video within
a virtual environment, and placed the pictures on a virtual model of a table
between each user. After matching all the images to their potential owners, the
subjects filled out a questionnaire about the perceived presence of the other user
provided by each setup. The subjects answered questions about preference,
copresense (the sense of the other being there), and social presence (a feeling

28
of connection to the other user). In all the rankings, face-to-face interaction was
significantly higher than the other setups. The spatial-local, 2D
videoconferencing, and spatial-remote were not significantly different from each
other, although there was a slight preference for 2D videoconferencing over other
technologies.
In addition to the problems of recreating in-person meetings, augmented
reality creates a number of difficulties in referencing digital items during
conversation. Augmented reality systems either place data via a Cartesian
coordinate system (sometimes aided by GPS data), or via fiducials within a video
(Liarokapis & Newman, 2007). When using Cartesian coordinates and HMDs, the
digital data appears over other users present, obscuring some gestures, and
potentially changing the cohesiveness of the space (Fjeld, 2004). The opposite
occurs when using video tracking. When a physical object obscures the fiducial
in the video, the augmented data is lost until the tracked marker is unconcealed
and recognized again by the computer. In addition, most augmented reality is
presented with a single video feed. The lack of stereoscopy (presenting a slightly
different image to each eye) makes it difficult to perceive the depth of objects due
to the missing image parallax. One solution to the referencing problems is
providing multiple and redundant forms of referencing an item, such as through
speech, pointing, and digitally highlighting the object in question (Chastine & Zhu,
2008).
2.6. Social presence in online education
Gunawardena observed in 1995 that even with two-way video and high-
fidelity audio connections, interaction patterns differed from typical face-to-face
interactions. The study of how close a medium is to face-to-face interaction can
be termed social presence. The concept of social presence was first defined in
1976 by Short, Williams, and Christie as the “degree of salience of the other
person in the interaction and the consequent salience of the interpersonal

29
relationships.” They worked off of two areas of research to inform their theory of
social presence: Argyle and Dean’s concept of intimacy and Wiener and
Mehrabian’s ideas of interaction. These two concepts were major areas of
research from psychology and communication (Lowenthal, 2009). According to
Argyle and Dean, intimacy is communicated through social cues such as gaze
and proximity. Indications of intimacy online and offline are provided through
social norms and needs for affiliation (Gunawardena, 1995). Short et al.
theorized that a lack of expected visual cues may cause distance communicators
to overcompensate with stronger actions in the remaining modes of
communication, such as extra words spoken over the phone. The second theory
that informed the concept of social presence was immediacy, which is the
psychological distance a person puts between themselves and what they are
communicating with. This can be communicated through the body and language.
One could speak either in a disinterested way or in a friendly and close way in
order to change the amount of immediacy in their communication.
Short et al. were not the only researchers interested in the concept of
distance communication at the time. Four years after they coined the term social
presence, Minsky coined another: telepresence, which is the feeling that
someone else is actually in the same physical space even though they are
actually a far distance. One way to envision telepresence is to imagine 3D, full-
body hologram (like the ones in the Star Wars movies) used to communicate
from a distance. There are numerous other terms that deal with the sense of
something being present when they actually are distant.
Social presence and telepresence are just a few of the terms that are used
to speak about this concept of presence. Although defined first by Short,
Williams, and Christie, later researchers defined and named social presence in
differing ways. In 2007, as they attempted to compile a definitive list of
telepresence literature, Lombard and Jones noted that there existed a number of
terms and definitions for social presence. They reasoned this was primarily due
to the interdisciplinary nature of the research that spanned departments as

30
different as engineering and art. Some of the alternative definitions for social
presence they identified were "being there," “the actual or perceived physical
presence of objects and entities,” and “the psychological state or subjective
perception in which a person fails to accurately and completely acknowledge the
role of technology in an experience.” They also noted some other terms used that
were synonymous or extremely similar to telepresence: social presence, virtual
presence, presence, parasocial, perceived reality, and computers as social
actors. All of these terms were defined and used by a research group known as
the International Society for Presence Research.
In the year 2000 the International Society for Presence Research
attempted to define presence, and the many subsections of presence of which
social presence is just one. They stated that the feeling of presence, “occurs
when part or all of a person's perception fails to accurately acknowledge the role
of technology that makes it appear that s/he is communicating with one or more
other people or entities." This sense of presence can vary such that a person
can feel more or less “present,” and may even experience different amounts of
presence using the same technology at different times. They defined the sub-
components of presence in a similar way to the overarching concept of presence.
For example, they stated that social presence, “occurs when part or all of a
person's perception fails to accurately acknowledge the role of technology that
makes it appear that s/he is communicating with one or more other people or
entities.“ Some of the other components of presence related to social presence
were co-presence (the feeling of being in the same room as the other),
parasocial interaction (a feeling of two-way communication when in fact only the
media is communicating), and medium as social actor (a failure to realize one is
interacting with technology at all). Of these three, co-presence has been
suggested to have a potential influence on the perception of social presence.
Social presence has been suggested as a key ingredient in online
education. Another way of thinking about social presence is through the term
“psychological distance”. It is a way of talking about and measuring how far away

31
the other user feels, regardless of their actual distance. With less psychological
distance between learners and other class participants (both other learners and
instructors) comes an increased amount of course satisfaction and personal
connection between users (So & Brush, 2007). The increased personal
connection is important because it allows the users to view the others as “real
people” that they can communicate with in typical ways (Shea & Bidjerano,
2008). In other words, viewing others as a real person breaks some of the
formalism that is imposed on asynchronous text communication (So & Brush,
2007).
Real people have the ability to become close to users and teach them
more effectively because of their closeness. In the words of Wiener and
Mehrabian, real instructors can become more immediate to the learners. They
defined a construct of immediacy that measured the psychological distance
between instructor and student (Wiener & Mehrabian, 1968). The more
immediate the teacher is, the more motivated students may be to study, and the
more satisfied they may be with the course (Christophel & Gorham, 1995; Moore,
Masterson, Christophel, & Shea, 1996). Perhaps due to these benefits, students
also report a higher sense of learning from courses with higher levels of social
presence (Richardson & Swan, 2003). Connection between the learner and the
instructor is important, both online and offline.
Connection between students can be equally important for student
success and satisfaction. Students are more satisfied when interacting with other
students versus instructors (Jung, Choi, Lim, & Leeem, 2002). Conversely, a
lack of interpersonal connection to other students is often associated with
stressed and isolated students (Haythornthwaite, Kazmer, Robbins and
Shoemaker, 2000). Instead of isolated students, it is better to create a sense of
community among students so that they may be mutually interdependent and
share the same goals (Rovai, 2002). The students who participated the most in
the class community had a higher chance at receiving a good grade in a distance
course (Davies & Graff, 2005). Increased social presence also leads to higher

32
levels of perceived learning (Richardson & Swan, 2003). However, too much
connection can lead to distraction from the course content, resulting in too much
social interaction and not enough cognitive interaction (So & Brush, 2007).
Discourse is an important part of social learning (Lowenthal, 2009).
Creating good discourse is hard without having some good social connections
between the learners first. This social connection does not have to be created in
rich media such as video, even text-based computer mediated communication
will eventually lead to good social connections between the users
(Gunawardena, 1995; Gunawardena, 1997). In order to get to this point of strong
connections it is the task of the instructor to foster and sustain social presence
during online instruction and to design the course to encourage social interaction
(Anderson, Rourke, Garrison, & Archer, 2001; Gunawardena, 1997).
Measuring social presence is a difficult task due to its interdisciplinary
nature. While a majority of researchers are content to use the original
measurement instruments created by Short et al, a growing number are
developing new instruments that measure factors related to their different
definitions of social presence. Bioncca, Harms, and Burgoon identified at least 8
ways to measure social presence or closely related concepts that each focused
on different aspects of presence (such as the medium, the social interaction, or
the closeness of the communicators). Most of the tools developed to measure
social presence are pencil-and-paper questionnaires that measured using the
semantic differential technique (Osgood, Suci, et al, 1957). The questionnaire
has sets of terms on the side of a Likert scale for participants to choose where
the experience fell between. Some of the pairs of terms included by Short et al.
were “cold-warm,” “impersonal-personal,” and “unsociable-sociable.”
Another difficulty with presence research and study is the ambiguity and
complexity of the term. Bioncca, Harms, and Burgoon found fault with the state of
presence research in 2003. They noted that it was difficult to draw comparisons
across studies due to the differences in questionnaires, terms, and definitions.
There were a number of different aspects that factored into different types of

33
presence. The complexity of the term resulted in some researchers using the
term in a very loose way such as “being there”.
Social presence in online education is most typically measured through
the use of a specialized questionnaire developed by Gunawerda and Zitta which
asses a number of items that appear to be related effective use of presence in
online education. It is focused on the interactions between students, instructors,
and course content. Gunawerda used this questionnaire in 1995 to asses a
computer-mediated conference that involved several of his students. Since then
aspects of the test have been used in large numbers of studies covering online
learning (Lowenthal, 2009). Due to the aforementioned hazy nature of the term
social presence, these questionnaires actually cover the sense of social
presence, and some other related concepts such as instructor immediacy and
cognitive presence.
2.7. Conclusion
Computer supported collaboration could potentially be aided by the
addition of video. CSCL and CSCW are heavily dependent on interactions
between users. Video is able to foster connections between users in a better way
than text or audio. Additionally, collaborators who ascribe more human traits to
their peers tend to produce groups that perform better. The video format is also
useful for creating a shared space that collaborators can both reference during
their working time. This shared space produces conversation that can quickly be
grounded, leading to more efficient and effective communication. When given a
choice, collaborators always express a preference for meeting in person. This
may indicate that our most recent collaborative technology cannot create an
acceptable amount of social presence for the users. It may also indicate that a
user’s ego center is so grounded in the real world that it will be impossible to
recreate a face to face meeting. A number of technologies attempt to create a
sense of eye contact, one major facet missing in standard meeting systems.

34
Augmented reality has the ability to place digital models on top of real time
video in a way that has the ability to replace the physical models, if necessary.
By combining AR with a video chat application, it is possible that the users who
both do not have the same model will be able to pull it out and reference it with
an analogous fiducial and interact with that model in a way that they are used to
interacting with other, physical objects. This is in addition to the other benefits
that video chat already can supply by functioning as an ice-breaker (Tscholl,
Mcarthy, & Scholl, 2006), providing for gestures, and allowing for cognitive cues
during collaboration. The usefulness of an augmented chat system may only be
for sporadic “bursts,” as over time the video component may become
unnecessary due to task and collaborator familiarity.
35
CHAPTER 3. METHODOLOGY
Combining augmented reality spaces with video conferencing could
provide for increased perception of social presence and contribute to more
efficient communication. To test the differences between these two collaborative
softwares, an augmented reality video chat application was created using Adobe
Flash and Red 5 Media Server that allowed for 2 users to collaborate on an
open-ended grouping task, and compared to a combination of GoToMeeting and
Google Sketchup, a web conferencing system and 3D sketching system typical
of others in the market, for effectiveness in the terms of social presence and
efficiency. These systems were selected primarily because of their popularity
and high online user reviews for ease of use.
3.1. Hypotheses
This study examined whether a mixed-reality video chat system could be
more effective for distance learning groups than a traditional web conferencing
system. As defined in the literature review, two areas that are critical for creating
effective distance collaborative groups are social presence and copresence. The
hypothesis drawn from these three areas are:
H10: The augmented reality chat system and the representative traditional web
conferencing system generate a similar degree of measured social presence.
H1a: There is a significant difference in the measurement of social presence
created by the two systems.

36
H20: The augmented reality chat system and the representative traditional web
conferencing system generate a similar degree of measured copresence.
H2a: There is a significant difference in the measurement of copresence created
by the two systems.
3.2. Application Design
The augmented reality chat application shown in figure 3.1 was developed
using Adobe Flash to handle the display of video and the overlay of augmented
reality objects. The streaming of video and synchronizing of digital data between
clients was handled by the open-source flash server, Red5. The Red5 server
was installed close to the testing area in order to ensure low video latency (the
time between video being sent from one user, and received to the other) for the
users. Red5 is a video streaming/multi-user server that is similar to Flash Media
Server. The two systems are nearly identical for the purposes of this study as
they are able to transfer audio and video at the same rates.
The open-source FLARtoolkit Actionscript library was used in conjunction
with the Flash client to recognize the fiducials given to each user. Finally, the 3D
model was rendered to each client's screen using Papervision 2.0, a 3D engine
programmed in Actionscript 3.0. The Adobe Flash technology was chosen
because of its large market penetration and the flexibility it provides in designing
an intuitive interface (which is often a requirement of web conferencing systems).
In addition, many collaborative spaces are web-based, where the Flash web
plug-in penetration makes it a standard target for such rich media applications.
Adobe Flash does not render 3D particularly fast, nor can it run efficient fiducial
marker recognition due to the limitations of the ActionScript Virtual Machine that
currently runs only on the CPU. However, performance on light 3D models of
less than ten thousand polygons resulted in performance that was nearly equal to
solutions implemented in C++ and OpenGL. To get the most performance out of
the test Flash application, it was be run directly from the Flash player on the

37
computer, removing any processing overhead associated with running Flash
within a browser window. As future Flash players improve in performance this
application could easily be moved to the web by uploading it to a webserver.
Figure 3.1 Example of the application.
3.3. Population
The students who benefit the most from collaborative learning are
students who are most capable of collaborating within a constructivist learning
environment. These students are usually at a postsecondary to professional
level. As such, the population for this test was postsecondary education students
between 18 – 50 years of age.

38
3.4. Sampling Size & Selection
48 students (24 pairs) were sampled. Students from the Computer
Graphics Technology department at Purdue University were the primary
sampling space. These students needed to be comfortable with the use of
computers, familiar with the concepts of web conferencing systems (but haven’t
necessarily used them before), and familiar with 3D modeling packages. The
sample was recruited from an email campaign, flyers posted about campus, and
announcements made in undergraduate classes. Students were offered extra
credit for participation.
3.5. Testing Procedure
Following a similar design to the dog-and-owner matching study (Haubr,
Regenbrecht, Billinghurst, & Cockburn, 2006), the subjects brought a same-
gender friend to act as their teammate for the study. Same-sex pairs were
included to reduce any tensions that may arise from inter-gender interactions.
The test moderator began by presenting a brief walkthrough of the study to the
subjects, instructed both of them on the use of the software to be used during the
study, and gave them each their own fiducials for the augmented reality
conference (See appendix A). They were then taken to separate rooms and
seated at computer workstations. Once in front of the computer, the researcher
loaded either the augmented reality conference system, or CiTrix GoToMeeting
along with Google Sketchup. To control for learning and fatigue effects,
participants were randomly assigned to complete either the augmented or screen
sharing task first.
The two then completed an object matching task in GoToMeeting and an
object identification task within the augmented reality program, with a maximum
of five minutes in each system (see appendix B). In the Haubr, Regenbrecht,
Billinghurst, & Cockburn study users were asked to match dogs with owners, in
order to encourage discussion and deliberation. The task was changed to take

39
advantage of the 3D nature of augmented reality collaboration. In the
augmented reality conference system, subjects were each given a fiducial that,
when held to the camera, displayed an indistinct object they needed to indentify.
There was no correct answer to the model question, and the participants took
approximately the whole five minutes in discussion. Within Google Sketchup and
GoToMeeting participants viewed a Sketchup file that contained 10 models within
the 3D space to group (see appendix C). The models were different for the two
systems. The shapes were different combinations of primitives and colors, such
as a red cube and a green pyramid. The participants were instructed to ask for
help if the technology malfunctioned. Once done, participants verbally signaled to
the researcher that they had completed the task. The researcher then entered
and set up the new task and told them they may start. After both tasks were
completed (about ten minutes total), the researcher returned the participants to a
single room, where they completed a two surveys (see appendices D and E) and
were briefly interviewed.
3.6. Data Collection
Before the exercises, a questionnaire (see appendix F) was given to
collect demographic information such as age, gender, and familiarity with the
types of programs to be used during the test. After completing the two exercises,
three surveys were given to the participants. The first two surveys were adapted
from a similar study by Harbur, Regenbrecht, Billinghurst, and Cockburn. The
first survey (see appendix D) covered aspects of copresence, and asks questions
such as “It felt as if my partner and I were in the same room”. The second survey
(see appendix E) on social presence was measured with a semantic differential
technique defined by Short et al. This survey was measured on a seven point
scale between pairs of words meant to define the technology. Some of the pairs
were “formal – spontaneous” and “insensitive – sensitive”. Once these surveys
were complete, the researcher conducted a short interview with the pair.

40
CHAPTER 4. RESULTS
After the data had been gathered, it was entered into Microsoft Excel for
further analysis with SAS and Minitab in regards to copresence, social presence,
and the systems as a whole. The data was analyzed with descriptive measures,
factor analysis, paired-t tests, and power analysis.
4.1. Copresence measures
Tables 4.1 and 4.2 contain the descriptive statistics for the measured
copresence of the two systems. The standard deviations were never greater than
2 for each system. Additionally, the means for the GoToMeeting system were
generally higher than those for the augmented reality chat system.
Table 4.1 Copresence measures for ARchat
Variable N N* Mean SE Mean StDev Minimum Q1 Median Q3
location 48 0 1.958 0.232 1.611 1.000 1.000 1.000 2.750
presence 48 0 1.813 0.194 1.347 1.000 1.000 1.000 2.000
face 48 0 3.146 0.253 1.750 1.000 2.000 3.000 4.750
same 48 0 3.854 0.270 1.868 1.000 2.250 3.500 6.000
Seeing that each pair answered nearly the same (the standard deviation
was not above 2) the pair’s responses were averaged together to create a new
dataset of 24 samples. This was done to avoid artificially expanding the data.
Using the original 48 samples would not violate any statistical rules, but
averaging the data results in more accurate statistical interpretations. Using the

41
new dataset, a two-factor analysis was performed to verify the battery of
questions (see Appendix D) that targeted copresence were correlated and that
they were not related to the measures of social presence. Table 4.3 shows the
results of this two-factor analysis.
Table 4.2 Copresence measures for GoToMeeting
Variable N N* Mean SE Mean StDev Minimum Q1 Median Q3
location 48 0 2.229 0.260 1.801 1.000 1.000 1.000 3.000
presence 48 0 2.229 0.229 1.588 1.000 1.000 2.000 3.000
face 48 0 4.149 0.249 1.706 1.000 3.000 4.000 6.000
same 48 0 4.271 0.261 1.807 1.000 3.000 4.000 6.000
Table 4.3 Two factor analysis of copresence
Question Factor1 Factor2 Conference locations -0.46863 0.52710 Conference presence -0.47624 0.54314 Conference face -0.78550 0.23197 Conference same -0.68871 -0.20061 Augmented locations -0.09158 0.68750 Augmented presence 0.07138 0.51942 Augmented face -0.41806 -0.21074 Augmented same -0.55796 -0.52729
In general, the measures are correlated for factor one, leading to the
conclusion that the questions used to measure copresence measured a similar
concept. In addition, these numbers are generally negatively correlated with the
questions covering social presence, indicating that these two questionnaires
measured different concepts. The two-factor analysis served one last purpose: to
reduce a battery of questions to a single number that could be tested for each
pair.

42
Table 4.4 Paired T-test of copresence
N Mean StDev SE Mean
Conference 12 0.037 1.288 0.372
Augmented 12 -0.037 0.655 0.189
Difference 12 0.074 1.491 0.0856
95% CI for mean difference: (-0.873, 1.021)
T-Test of mean difference = 0 (vs not = 0): T-Value = 0.17 P-Value = 0.867
After verifying that the concepts measured were distinct and reducing the
measure of copresence to a single number, the researcher was ready to perform
a test of significance. The researcher was only interested in differences between
systems, not in one system being more highly rated. For this test, μ1 represented
the mean copresence factor scores for screen sharing and μ2 represented the
mean factor scores for ARchat. Therefore the null and alternative hypotheses
were:
Ho : μ1 = μ2 Ha : μ1 ≠ μ2
The t-test produced a value of .17 with 23 degrees of freedom, which yielded a
P-value of .867; it failed to be significant at the .05 level. This indicates that there
is no difference between the systems in terms of copresence.
4.2. Social presence
The same process applied to copresence measures was applied to the
social presence measured. Tables 4.4 and 4.5 contain the descriptive statistics
for the measured social presence of the two systems. The standard deviations
were never greater than 2 for each system. Neither system appears to have an
easily discernable difference in the means for the social presence measures.
Because the pair’s responses were similar, the data for each pair was averaged
together to create a new dataset of 24 samples.

43
Table 4.5 Social presence measures for GoToMeeting
Variable N N* MeanSE
MeanStDev Minimum Q1 Median Q3
impersonal 48 0 4.083 0.220 1.528 1.000 3.000 4.000 5.000
cold 48 0 3.937 0.209 1.450 1.000 3.000 4.000 5.000
ugly 48 0 3.771 0.179 1.242 1.000 3.000 4.000 4.000
small 48 0 4.063 0.213 1.479 1.000 3.000 4.000 5.000
insensitive 48 0 4.375 0.183 1.265 2.000 3.250 4.000 5.000
colorless 48 0 4.958 0.191 1.320 2.000 4.000 5.000 6.000
unsociable 48 0 4.896 0.221 1.533 2.000 4.000 5.000 6.000
closed 48 0 4.583 0.220 1.528 2.000 3.000 5.000 6.000
passive 48 0 5.042 0.244 1.688 1.000 4.000 5.000 6.000
Table 4.6 Social presence measures for ARchat
Variable N N* MeanSE
MeanStDev Minimum Q1 Median Q3
impersonal 48 0 5.229 0.231 1.601 1.000 5.000 6.000 6.000
cold 48 0 4.813 0.162 1.123 2.000 4.000 5.000 6.000
ugly 48 0 4.333 0.156 1.078 2.000 4.000 4.000 5.000
small 48 0 4.188 0.197 1.363 1.000 3.000 4.000 5.000
insensitive 48 0 4.792 0.186 1.288 1.000 4.000 5.000 6.000
colorless 48 0 4.917 0.176 1.217 2.000 4.000 5.000 6.000
unsociable 48 0 5.375 0.222 1.539 1.000 4.000 6.000 7.000
closed 48 0 5.083 0.216 1.499 1.000 4.000 5.000 6.000
passive 48 0 5.687 0.181 1.257 2.000 5.000 6.000 6.750
After averaging the paired data, a factor analysis was performed on the
data to simplify the battery of questions relating to social presence and
copresense to just two factors and verify they were measuring distinct properties.
A factor analysis takes a battery of questions, and returns a single number for

44
each question for a specified number of “factors”. This number indicates how
much that question influences the variance in that factor. This study was
concerned with the concepts of presence and copresence, therefore a two-factor
analysis was chosen. More factors could have been determined and examined if
there had been no prior assumptions about the nature of the data. Table 4.6
contains the results of the factor analysis and the loadings of each question on
two factors for social presence. The questions that measured presence generally
load negatively on copresense, while those that targeted copresense were
generally negative for presence. This implies that the two surveys were
measuring two different variables.
Table 4.7 Two-factor analysis of social presence
Question Factor1 Factor2 Conference imper 0.71326 -0.31258 Conference cold 0.55816 -0.53829 Conference ugly 0.58028 -0.22645 Conference small 0.41610 -0.09709 Conference insen 0.30636 -0.47543 Conference cololess 0.34564 0.27657 Conference unsociable 0.79420 -0.19308 Conference closed 0.70034 -0.06414 Conference passive 0.54256 -0.42689 Augmented imper 0.10483 0.39860 Augmented cold 0.39975 0.29074 Augmented ugly 0.60783 0.23643 Augmented small 0.71984 0.23108 Augmented insen 0.46702 0.30110 Augmented cololess 0.60451 0.32411 Augmented unsociable 0.44932 0.43010 Augmented closed 0.82431 0.34421
Using the scores of social presence (how much a sample influenced the
factor analysis), a paired t-test was performed to determine if any of the
differences between the two systems were significant at an alpha value of .05.
For this test, μ1 represented the mean social presence factor scores for screen

45
sharing and μ2 represented the mean factor scores for ARchat. Therefore the null
and alternative hypotheses were:
Ho : μ1 = μ2 Ha : μ1 ≠ μ2
Table 4.8 Paired T-test of social presence
N Mean StDev SE Mean
Conference 12 -0.068 1.074 0.310
Augmented 12 0.068 0.963 0.278
Difference 12 -0.135 1.523 0.440
95% CI for mean difference: (-1.103, .832)
T-Test of mean difference = 0 (vs not = 0): T-Value = -0.31 P-Value = 0.764
The t-test produced a value of -.31 with 23 degrees of freedom, which
yielded a p-value of .764; it failed to be significant at the .05 level. This means
that participants did not indicate a difference between either system in terms of
social presence.
4.3. Difference in combined systems
The researcher then combined the totals for the social presence and
copresence factors to determine if there was a difference between the systems
that was not apparent from the copresence and social presence specific
statistics. Table 4.7 contains the results of the test.
For this test the researcher was only interested in basic differences
between the set of software packages. The μ1 represented the mean factor
scores for screen sharing and μ2 represented the mean factor scores for ARchat.
Therefore the null and alternative hypotheses were: Ho : μ1 = μ2 and Ha : μ1 ≠
μ2.
The t-test produced a value of -.23 with 23 degrees of freedom, which
yielded a p-value of .826; it failed to be significant at the .05 level. This indicates

46
that the users did not feel like there was a difference in total presence between
the two systems.
Table 4.9 Paired T-test of combined social presence and copresence
N Mean StDev SE Mean
Conference 12 -0.052 1.142 0.372
Augmented 12 0.051 0.885 0.189
Difference 12 -0.103 1.577 0.455
95% CI for mean difference: (-1.105, .900)
T-Test of mean difference = 0 (vs not = 0): T-Value = -0.23 P-Value = 0.826
4.4. Power test
Finally, three power analyses were performed to determine the accuracy
of the paired t-tests looking for significance at alpha of .05. The power for these
paired t-tests all were approximately .05. A power of .05 is quite low, as the
standard for acceptability in terms of power is .8 or above. These low values
indicate that when looking for a difference of .05 on the paired-t tests, there is a
high chance of accepting a null hypothesis when it should have been rejected. In
order to discern differences at this significance level, approximately 200 more
participants would be needed.
4.5. Summary
This chapter presented a summary of the data gathered and explained the
statistical processes used to reach initial conclusions on the data. The original
data was gathered over three weeks and had a total of 48 participants. After
gathering descriptive statistics on the data, it was assumed that each pair’s
experience of the system was correlated. Their answers were averaged together,
resulting in a new dataset of 24 samples. A factor analysis was performed on the

47
data that seemed to indicate the presence of two distinct factors. Using the factor
scores, three paired t-tests were performed for social presence, copresence, and
total presence. For all three tests, the null hypotheses were not rejected,
indicating a similar amount of presence in each system.

48
CHAPTER 5. CONCLUSIONS
The hypothesis that an augmented reality chat system would be able to
create a higher sense of presence than a screen sharing application was
rejected. Instead, both systems were rated as having similar amounts of
perceived presence. Conclusions and recommendations are drawn below in
regards to factors that may have influenced the sense of presence, educational
implications, and possible future work.
5.1. Findings and discussion
The similar amounts of perceived presence may have been influenced by
the sound communication medium. Both participants were using cell phones to
communicate while using the software. While this is not an uncommon way to
use web conferencing software, using speakers positioned around the computer
may positively influence the perception of presence. It is hypothesized that sound
may play a very important role in the perception of social presence from a
distance. Chapanis (1972) confirmed the video was not able to enhance
collaboration from a distance. However, during the prisoner’s dilemma
experiment, participants trusted and respected their fellow players more as
communication mode approached full speech (Jensen, Farnham, Drucker, &
Kollack, 2000). There remains a gap in the research that does not confirm if
playing the same game with live video of each player influences the final result of
the game. If it does not, audio may be a preferred distance collaboration tool.
Designers of distance instruction recognize that to create good distance learning

49
groups audio will be required. Technologies like VOIP or group calls should be
used in order to establish higher senses of presence within the course.
A program chosen for a CSCL endeavor should be best suited to the task.
When developing applications to be used for CSCL, care should be taken to
emphasize using video as data (Whittaker, 1995), creating useful shared spaces,
and focusing on the advantages that digital technology can provide over
traditional interaction. If a course requires a combination of a human body and
3D data, then an AR chat could be a useful technology. However, if it just
required the use of 3D data, a screen sharing application with an audio link would
be the preferred way of completing the work.
Observing students who used the technology, it appeared they used the
same amount of deictic phrases in both the augmented reality and the screen
sharing applications. It also appeared they used a minimum of hand gestures
while using the augmented reality system. This was primarily due to the
positioning involved in using the application. In order to properly see the 3D
model it was necessary for the fiducial to fill a large amount of the video,
restricting the participant’s access to the screen and not allowing them much
room to point without obscuring the fiducial (which would result in the loss of the
3D augmentation).
It may be that both packages do not create a familiar type of shared space.
While the augmented reality chat had the potential advantage of face-to-face
communication, it required holding fiducials in an awkward position that
occasionally obscured the user’s face. These limitations were encountered
previously by researchers testing their own augmented reality videochat
(Barakonyi, Fahmy, & Schmalsteig, 2004). The screen sharing application
allowed for a shared space that both users could manipulate, but they were
unable to manipulate different objects at the same time, requiring users to take
turns using the software. This turn taking setup often resulted in one person
doing all the manipulation and judgments while the second user merely agreed
upon the decisions made. The screen sharing application also took up a large
50
amount of the computer screen, resulting in a minimized area for the
collaborator’s video with reduced capability to convey cognitive cues.
One unforeseen complication in the study was the type of interactions
between participants that took place. Often the participants took up a “worker and
expert” type of interaction with one user doing most the work, and the other
advising (Kraut, Gergle, & Fussel, 2002). Occasionally one person did both the
deciding and work, creating an “expert and manager” situation. It may be good to
attempt to recreate the study in a real class that generates a sense of genuine
interdependence (Fjuk, & Krange, 1999).
If the collaborator’s video is assumed to not be “real life” data, then the
augmented reality chat system as created may have fell closer to an augmented
virtuality on the mixed reality continuum (Milgram & Kashino, 1994). If the ARchat
application was more of an augmented virtuality, the previously described
benefits of augmented realty would not necessary be applicable. This is not to
say they do not transfer over, as many of the findings within the field of CSCL
focused on augmented virtuality rather than augmented reality. However, any
benefits and senses of presence gained from this system may have been of a
qualitatively different nature than those found in the Studeirstube-based systems
such as Construct3D and Physics Playground. Within those systems, the
students were gathered in real life, instead of collaborating at a distance,
potentially leading to drastically different interactions.
While the hope was the ability of an ARchat to create a system that
allowed for tangible bits to be manipulated, it is possible that displaying 3D
objects overlaid on top of a fiducial is not an accurate interpretation of a tangible
bit. A paper fiducial is so distant from what is actually being displayed that the
users do not use natural interactions that drive the theories behind tangible bits
and embodied interaction (Ishii & Ulmer, 1997; Dourish, 2001). A similar result
was found by Chen (2006) who noted that some students did not prefer
augmented reality molecular models because they lacked the physicality of the
physical models they were used to.

51
There may have been a reason that the Barakonyi, Fahmy, and
Schmalsteig (2004) did not continue investigating the usefulness of an
augmented reality chat. Although their testing and initial feedback indicated
perceived usefulness for the application, the positions and conditions needed for
a smoothly running ARchat were uncommon. The Studierstube project that their
ARchat was built on top of was also responsible for other technologies, such as
Construct3D and Physics Playground (Kaufmann & Meyer, 2008; Kauffman,
Steinbugl, Dunser, & Gluk, 2003). It appears as if these applications of AR had a
stronger perception of usefulness than distance collaboration using augmented
reality.
The study conducted by Hauber et al. (2006) that was the template for this
current study, had similar results. There was not a major difference between any
distance collaboration system tested. Instead, there was a strong preference for
meeting in person. Since the questionnaires for this study were the same as the
one used by those researchers, the augmented reality chat may be a candidate
to be added to the list of systems that are identical in terms of presence. A large
amount of similarity in presence for distant systems points to the chance that
distance collaboration does not change much once video and audio is
introduced, no matter what setup they are placed in, including spatial-remote,
spatial-local, 2D, and augmented modes.
The fact that social presence is affected by immediacy (Short, Christie, &
Williams, 1972; Wiener & Mehrabian, 1968) may inform designers as to what
types of technology to focus on when creating new applications for social
presence and distance collaboration. Immediacy is affected by both language
(types of responses) and body language (how the conversant is acting). It may
be that the major hints we receive for immediacy are not so much from body
language, but the actual verbalizations from the other speaker.

52
5.2. Recommendations
Ultimately the supposed utility of AR chat rested on the ability of video to
convey cognitive cues resulting in users that felt closer together. The distance
between users may be so great that it is impossible to recreate natural
interaction. Instead, one may need to rely on audio communication and video
solely as data. Knowing the difficulty of recreating presence, future developers
may wish to focus on the best aspects of technology as described in “Beyond
Being There” (Hollan & Stornetta, 1992). Two of these aspects were
asynchronicity and the ability to store data for later use. Storing data from online
interactions, especially in an educational area where these interactions could
serve to inform other learners, is a key feature that should not be ignored by
those creating new virtual learning environments.
Gestures, one of the primary communication advantages, were lost in both
systems, resulting in the reduced advantages of increased deictic phrases and
efficiency of communication (Kirk, Rodden, & Fraser, 2007). This lost advantage
may have affected the sense of perceived presence when a participant was
using the system. This also indicates that both systems may have been slower
than they could have been in terms of efficiency of communication.
Both systems appeared to hinder the creation of common ground. The
augmented reality system did not really create a shared space for the students to
see in tandem, limiting their ability to assume that one knew what the other was
seeing. In contrast, the shared space allowed both users to see the same thing,
indicating they had some sense of shared space, but perhaps the oddity of what
they were seeing was strange enough to them they could not quite identify what
kind of space they shared at the time. The time it took to ground the conversation
may have effectively negated the effects of a shared space on grounding the
conversation, which resulted in a large number of non-deictic phrases used to
specify what exactly there was on the screen at the time.
As this implementation of AR was not an incredibly successful example,
one may wish to focus on augmented reality in its more typical manifestations,

53
such as HMDs and mobile devices. Some of the more common uses of AR are
on mobile devices and using it for games such as Human Pacman (Cheok et al.,
2004). A focus on the capability of mobile devices to create engaging augmented
reality experiences may lead to interesting insights as to how to apply those
same principles to those who are interacting from a distance.
The systems may also serve as a novel way to introduce fun into
collaboration, a subject that was outside of the scope of this investigation. As
many of the users indicated they had fun with the systems during the post-task
interview, these systems could aide in the introductory phase of collaboration by
breaking down the formalism that is normally associated with text-based
communication. More practically, this type of augmented reality chat may be best
for an instructor who has prepared to use the chat to demonstrate different ideas
without having different technology on hand, such as if they are away at a
meeting, or not able to buy expensive demonstration models. One potential side
effect of the fun that the systems create is that they could currently be too
distracting. It may be some time before general users are accustomed to
augmented reality and can look past it novelty to use it mainly as a tool for
communication and collaboration. Until then, it may negatively affect the
perception of presence by reducing the attention paid to one’s partner, resulting
in less attention being paid to collaborators and a reduced amount of perceived
closeness between users.
5.3. Future work
Augmented reality technology is quickly progressing as researchers and
developers take an increased interest in its possibilities. Soon it will be possible
to use hands as a replacement for the paper fiducials used in this study, allowing
for the creation of very real “embodied interaction” (Dourish, 2001) with computer
systems. Using hands as a marker does remove the advantages of having a
tangible item to manipulate, that may detract from its eventual usefulness. It

54
would be interesting to study if the loss of a tangible interface results in a system
that is more agreeable for interaction between two users on a video chat system.
Due to time limitations, it was not possible to directly measure deictic
phrases or gestures during the study. Thus, it is not known if the augmented
reality system was able to create more efficient conversation, nor is it known if
users overcompensated for the lack of visual cues when working inside of the
screen sharing application (Short et al., 1976). Further study of the augmented
reality chat would be needed to determine if it could be used as a good ice-
breaker or to get users comfortable with their tasks before switching to other
systems that may be more appropriate for expert users (Kirk, Rodden, & Fraser,
2007). These previously mentioned limitations also did not allow for analysis of
conversation that may have indicated if the conversations generated during use
of the augmented reality system would be useful inside an educational context.
The surveys could be improved in future studies. It appeared as if the
participants became less truthful when they answered the presence survey,
potentially because of the unusual semantic differential technique used.
Measuring a system on a scale between “warm” and “cold” did not appear to be
intuitive, and measuring two systems based on this odd scale may have caused
the participants to mentally resign when coupled with the numerous questions to
be answered. In addition, both surveys were measured on a seven point Likert
scale that may have encouraged the students to choose the middle value
frequently, instead of choosing one particular side of the scale. Future studies
may wish to choose a different approach to the measurement of presence and
keep the number of questions as low as possible.
Another problem with the study is the vagueness of the definition of
presence and the related concepts of copresence and social presence (Bioncca,
Harms, & Burgoon, 2003). The initial definition by Short, Christie, and Williams
(1976) certainly made sense, but their tool for measuring the subjective presence
of any one system has not been greatly improved, verified, or changed for use on
new developing systems. Typically, researchers merely reach back to the original
55
questionnaire to measure presence. Only recently has there been a focus on
creating more reliable questionnaires for presence (Lombard & Jones, 2007).
Further work on refining the measurement instrument could lead to a better
ability to measure differences in presence between different systems.
To adequately recreate presence more technological innovation may be
needed which simply may not be very feasible for the general user. The Office of
the Future (Raskar et al., 1998) was a project designed to create a good sense of
coworker presence, through the use of multiple projectors and software that
models the room and makes corrections in the display so that graphics may be
displayed perfectly on non-level surfaces. The drawbacks to this system are
immense, such as the need for ubiquitous projectors, and a darkened area for all
collaboration to take place. Even with this, it may be that the sense of presence
from visuals relies heavily on spatial aspects such as visual parallax.

LIST OF REFERENCES

56
LIST OF REFERENCES
Ahern, T., Thomas, J., Tallent-Runnels, M., Lan, W., Cooper, S., Lu, X., & Cyrus,
J. (2006). The effect of social grounding in a computer-mediated small
group discussion. Internet and Higher Education 9, 37-46.
Allen, I. & Seaman, J. (2007). Online nation: Five years of growth in online
learning. Retrieved 3/30/2010 from www.sloan-
c.org/publications/survey/pdf/online_nation.pdf
Anderson, T., Rourke, L., Garrison, D. R., & Archer, W. (2001). Assessing
teaching presence in a computer conferencing context. Journal of
Asynchronous Learning Networks, 5(2), 1- 17.
Barakonyi, I., Fahmy, T., Schmalstieg, D. (2004). Remote Collaboration Using
Augmented Reality Videoconferencing. Proceedings of Graphics Interface
2004, May 17-19, London, Ontario.
Bos, N., Olson, J., Gergle, Olson, G., & Wright, Z. (2002). Effects of Four
Computer-Mediated Communications Channels on Trust Development.
CHI 2002, Minneapolis, Minnesota, USA.
Bradner, E., & Mark, G. (2001). Social presence with video and application
sharing (pp. 154-161). Boulder, Colorado, USA: ACM. doi:
10.1145/500286.500310.
Bruner, J. (1990). Acts of Meaning. Cambridge, MA: Harvard University Press.
Chapanis, A., Ochsman, R., Parrish, R., & Gerald, D. (1972). Studies in
interactive communication. The effects of four communication modes on
the behavior of teams during cooperative problem-solving. Human
Factors. 14, 487-509.

57
Chen, B. (2009). "IF YOU’RE NOT SEEING DATA, YOU’RE NOT SEEING".
Wired Magazine. Retrieved 2009-08-26. From
HTTP://WWW.WIRED.COM/GADGETLAB/TAG/AUGMENTED-REALITY/.
Chen, Y. (2006). A study of comparing the use of augmented reality and physical
models in chemistry education. VRCIA 2006.
Cheok, A., Goh, K., Liu, W., Fabiz, F., Fong, S., Teo, S., Li, Y., & Yang, X.
(2004). Human Pacman: a mobile, wide-area entertainment system based
on physical, social, and ubiquitous computing. Personal and Ubiquitous
Computing 8(2), 71-81.
Christophel, D.M. and Gorham, J. (1995). A test-retest analysis of student
motivation, teacher immediacy, and perceived sources of motivation and
demotivation in college classes. Communication Education, 44, 292-306.
Clark, H & Brennan, S. (1991) Grounding in communication. Perspectives on
socially shared cognition, 127 – 149. American Psychological Association,
Washington, DC.
Davies, J. & Graff, M. (2005). Performance in e-learning: online participation and
student grades. British Journal of Educational Technology. 36(4), 657-663.
Dourish, P. (2001) Where the action is: the foundations of embodied interactions.
Cambridge, MA: MIT Press.
Dunser, A., Steinbugel, K., Gluck, J., & Kaufmann, H. Virtual and Augmented
Reality as Spatial Ability Training Tools. ( 2006 ) Proceedings from CHINZ
'06: 7th Annual Conference of the NZ ACM Special Interest Group.
Christchurch, New Zealand.
Ertmer, P & Newby, T. (1993). Behaviorism, Cognitivism, Constructivisim:
Comparing Critical Features from an Instructional Design Perspective.
Performance Improvement Quarterly 6(4), 50-71.
Fjeld, M. (2004). Usability and Collaborative Aspects of Augmented Reality.
Interactions, 11(6).

58
Fjuk, A., & Krange, I. (1999). The situated effects of awareness in distributed
collaborative learning: interactive 3D an example (p. 18). Palo Alto,
California: International Society of the Learning Sciences.
Fussell, S., Kraut, R., & Siegel, J. (2000).Coordination of communication: effects
of shared visual context on collaborative work. Proceedings of the 2000
ACM conference on Computer supported collaborative work. Philadelphia,
Pennsylvania.
Gergle, D., Kraut, R., & Fussel, S. (2004). Action as language in a Shared Visual
Space. CSCW 2004, Chicago, Illinois, USA.
Gergle, D., Rose, C., Kraut, R. (2007) Modeling the Impact of Shared Visual
Space on Collaborative Reference. CHI 2007, San Jose, California, USA.
Gillet, A., Sanner, M., Stoffler, D., Goodsell, D., & Olson, A. (2004). Augmented
Reality with Tangible Auto-Fabricated Models for Molecular Biology
Applications. VIS 2004.
Hauber, J., Regenbrecht, H., Billinghurst, M., & Cockburn, A. (2006). Spatiality in
videoconferencing: trade-offs between efficiency and social presence.
Proceedings of the 2006 20th anniversary conference on Computer
supported collaborative work. Alberta, Canada.
Haythornthwaite, C., Kazmer, M. M., Robbins, J. & Shoemaker, S. (2000).
Community development among distance learners: temporal and
technological dimensions. Journal of Computer Mediated Communication,
6, 1, 1–24.
Hollan, J. & Stornetta, S. (1992). Beyond being there. Proceedings of the SIGCHI
conference on Human factors in computing systems. Monterey, California.
International Society for Presence Research. (2000). The Concept of
Presence:Explication Statement. Retrieved 12/2/2009 from
HTTP://ISPR.INFO/
Ishii, H., & Ullmer, B. (1997). Tangible Bits: Towards Seamless Interfaces
between People, Bits and Atoms. CHI ‘97, Atlanta GA USA

59
Jennings, P. (2005). Tangible social interfaces: critical theory, boundary objects
and interdisciplinary design methods (pp. 176-186). London, United
Kingdom: ACM. doi: 10.1145/1056224.1056249.
Jensen, C., Farnham, S. D., Drucker, S. M., & Kollock, P. (2000). The effect of
communication modality on cooperation in online environments (pp. 470-
477). The Hague, The Netherlands: ACM. doi: 10.1145/332040.332478.
Jonassen, D. (1991). Objectivism vs constructivism: Do we need a new
philosophical paradigm? Educational Technology, Research and
Development, 39(3), 5-13.
Jung, I., Choi, S., Lim, C., Leem, J. (2002). Innovations in Education and
Teaching International. 39(2).
Kauffman, H., Steinbugl, K., Dunser, A., Gluk, J. (2003). Improving Spatial
Abilities by Geometry Education in Augmented Reality - Application and
Evaluation Design. "VRIC Laval Virtual 2005 Proceedings", IEEE, 2005,
25 - 34.
Kaufmann, H. & Meyer, B. (2008). Simulating educational physical experiments
in augmented reality. International Conference on Computer Graphics and
Interactive Techniques. Singapore.
King, F. (2002). A virtual student: not an ordinary joe. The Internet and Higher
Education. 5, 157-166.
Kirk, D., Rodden, T., & Fraser, D. (2007). Turn it this way: grounding
collaborative action with remote gestures. Proceedings of the SIGCHI
conference on Human factors in computing systems. San Jose, California.
Kraut, R., Gergle, D., Fussel, S. (2002). The Use of Visual information in Shared
Visual Space: Informing the Development of Virtual Co-Presence. CSCW
2002, New Orleans, Louisiana, USA.
Liarokapis, F., & Newman, R. (2007) Design experiences of multimodal mixed
reality interfaces. Proceedings of the 15th annual ACM international
conference on Design of communication. El Paso, Texas.

60
Lin, G. (2004). Social Presence Questionnaire of Online Collaborative
Learning:Development and Validity. Association for Educational
Communications and Technology, 27th, Chicago, IL, October 19-23.
Lipponen, L. (1999). The challenges for computer supported collaborative
learning in elementary and secondary level: Finnish perspectives (p. 46).
Palo Alto, California: International Society of the Learning Sciences.
Lombard, M. & Ditton, T. (1997). At the Heart of It All: The Concept of Presence.
Journal of Computer-Mediated Communication. 3(2).
Milgram, P. & Kishino, F. (1994). A taxonomy of mixed reality Visual Displays.
IEICE Transactions on Information and Systems. 77(12), 1321-1329.
Milgram, P., Takemura, H., Utsumi, A., Kishino, F. (1994). Augmented Reality: A
class of displays on the reality-virtuality continuum. Telemanipulator and
Telepresence Technologies. Boston, MA.
Minsky, M. (1980). Telepresence. Omni, June, 45–51. MIT Press Journals. (n.d.).
Presence. Retrieved April 29, 2008, from
HTTP://WWW.MITPRESSJOURNALS.ORG/LOI/PRES
Moore, A., Masterson, J.T., Christophel, D.M., and Shea, K.A. (1996). College
teacher immediacy and student ratings of instruction. Communication
Education, 45, 29-39.
Morgan, G. (2003). Faculty Use of Course Management Systems. 2, Retrieved
November 27, 2005 from
www.la.edu/include/learning_resources/online_course.../ekf0302.pdf
Nakano, Y. I., Reinstein, G., Stocky, T., & Cassell, J. (2003). Towards a model of
face-to-face grounding. In Proceedings of the 41st Annual Meeting on
Association for Computational Linguistics - Volume 1 (pp. 553-561).
Sapporo, Japan: Association for Computational Linguistics.
Nardi, B., Kuchinsky, A., Whittaker, S., Leichner, R., Schwartz, H. (1995) Video-
as-data: technical and social aspects of a collaborative multimedia
application. Computer supported collaborative work. 4(1).

61
Nari, B., Whittaker, S., & Bradner, E. (2000). Interaction and outeraction: Instant
messaging in action. Proceedings of CSCW’00 Association of Computer
Machinery.
Ngwenyama, O. & Lee, A. (1997). Communication Richness in Electronic Mail:
Critical Social Theory and the Contextuality of Meaning. MIS Quarterly,
21(2).
Parsad, B. & Lewis, L. (2008). Distance education at Degree-granting
Postsecondary Institutions: 2006-07. Retrieved November 13th, 2008 from
http://nces.ed.gov/pubsearch/pubsinfo.asp?pubid=2009044
Pash, A. (2008). Five Best Videochat Applications. Retrieved March 8th, 2010
from http://lifehacker.com/5088083/five-best-video-chat-applications.
Raskar, R., Welch, G., Cutts, M., Lake, A., Stesin, L., & Fuchs, H. (1998) The
office of the future: a unified approach to image-based modeling and
spatially immersive displays. Proceedings of the 25th annual conference
on Computer graphics and interactive techniques.
Regenbrecht, H., Lum, T., Kohler, P., Ott, C., Wagner, M., Wilke, W., & Mueller,
E. (2004). Using augmented virtuality for remote collaboration. Presence:
Teleoperators and Virtual Environments. 13(3), 338 – 354.
Richardson, J. C. & Swan, K. S. (2003, February). Examining social presence in
online courses in relation to students’ perceived learning and satisfaction.
Journal of Asynchronous Learning Networks. 7(1), 21-40.
Rovai, A. P. (2002). Sense of community, perceived cognitive learning, and
persistence in asynchronous learning networks. Internet and Higher
Education. 5, 319–332
Shea, P. & Bidjerano, T. (2008). Community of inquiry as a theoretical framework
to foster “espistemic engagement” and “cognitive presence” in online
education. Computers & Education. 52, 543 – 553.
Short, J., Williams, E., & Christie, B. (1976) The social psychology of
telecommunications. Wiley, London.

62
So, H. & Brush, T. (2007). Student perceptions of collaborative learning, social
presence and satisfaction in a blended learning environment:
Relationships and critical factors. Computers & Education. 51(1), 318-336.
Stahl, G., Koschmann, T., & Suthers, D. (2006). "Computer-supported
collaborative learning: An historical perspective". In R. K. Sawyer (Ed.),
Cambridge handbook of the learning sciences (pp. 409–426). Cambridge,
UK: Cambridge University Press.
Tscholl, M., McCarthy, J., & Scholl, J. (2005). The effect of video-augmented
chat on collaborative learning with cases. Proceedings of the 2005
conference on Computer support for collaborative learning. Taipei,
Taiwan.
Vygotsky, L. (1978) Mind in Society: The Development of Higher Psychological
Processes. Cambridge: Harvard University Press.
Whittaker, S. (1995). Rethinking video as a technology for interpersonal
communications: theory and design implications. International Journal of
Human-Computer Studies. 42, 501-529.
Whittaker, S., Swanson, J., Kucan, J., & Sidner, C. (1997). Telenotes: Managing
lightweight interactions in the desktop. ACM Transactions on Computer–
Human Interaction, 4(2), 137–168.
Wiener, M. and Mehrabian, A. (1968). Language within Language: Immediacy, a
channel in verbal communication. New York: Appleton-Century-Crofts.
Wilson, P. (1991). Computer Supported Cooperative Work: An Introduction.
Norwell, MA: Kluwer Academic Pub.

APPENDICES

63
Appendix A. Fiducial given to the participants

64
Appendix B. Study Description
Purpose of this study
This study is analyzing the ability of two different systems to create natural
interactions between users. The goal is to analyze how each system makes a
user feel like they are interacting with a real person, and how much it seems they
are not interacting through technology, but in a physically present situation.
These types of interactions could lead to better collaboration amongst learning
groups.
Introduction
In a moment, the researcher will explain how to use two different sets of
software. You will then be given a set of cards with printed icons on them. These
are called ‘fiducials’ and will be used for half of the study. After any last questions
have been answered, you and your partner will be lead to separate rooms and
asked to complete the first task.
Task 1
With Google Sketchup and GoToMeeting open, sort the blocks present in
the sketchup file into groupings that appear appropriate. Take time to discuss
your reasoning with your partner. You have up to 15 minutes to complete this
task. When agreement has been reached, write down the groupings on the
supplied sheet of paper marked “GoToMeeting”. Once finished, close both
programs and wait for the researcher to enter and setup the second task.
Task 2
With the augmented reality conference system open, use the fiducials to
present different shapes, and again sort them in a logical fashion. Take time to
discuss this sorting with your partner. When agreement has been reached, write
down the groupings on the supplied paper marked “augmented reality”. When
finished, close the program and wait for the researcher to bring you back to the
conference room.

65
Appendix C. Models Used in Google Sketchup

66
Appendix D. Copresence Survey
Copresence survey
Please rate the GoToMeeting conference for these questions.
I was always aware that my partner and I were at different locations.
Strongly agree 1 2 3 4 5 6 7 Strongly disagree
I was always aware of my partner’s presence
Strongly agree 1 2 3 4 5 6 7 Strongly disagree
It was just like being face to face with my partner
Strongly agree 1 2 3 4 5 6 7 Strongly disagree
It felt as if my partner and I were in the same room.
Strongly agree 1 2 3 4 5 6 7 Strongly disagree
Please rate the Augmented Reality conference for these questions.
I was always aware that my partner and I were at different locations.
Strongly agree 1 2 3 4 5 6 7 Strongly disagree
I was always aware of my partner’s presence
Strongly agree 1 2 3 4 5 6 7 Strongly disagree
It was just like being face to face with my partner
Strongly agree 1 2 3 4 5 6 7 Strongly disagree
It felt as if my partner and I were in the same room.
Strongly agree 1 2 3 4 5 6 7 Strongly disagree

67
Appendix E. Social presence survey
Social Presence Survey
Please rate the GoToMeeting conference between these sets of words.
Please rate the Augmented Reality conference between these sets of words.
Impersonal 1 2 3 4 5 6 7 Personal
Cold 1 2 3 4 5 6 7 Warm
Ugly 1 2 3 4 5 6 7 Beautiful
Small 1 2 3 4 5 6 7 Large
Insensitive 1 2 3 4 5 6 7 Sensitive
Colourless 1 2 3 4 5 6 7 Colourful
Unsociable 1 2 3 4 5 6 7 Sociable
Closed 1 2 3 4 5 6 7 Open
Passive 1 2 3 4 5 6 7 Active
Impersonal 1 2 3 4 5 6 7 Personal
Cold 1 2 3 4 5 6 7 Warm
Ugly 1 2 3 4 5 6 7 Beautiful
Small 1 2 3 4 5 6 7 Large
Insensitive 1 2 3 4 5 6 7 Sensitive
Colourless 1 2 3 4 5 6 7 Colourful
Unsociable 1 2 3 4 5 6 7 Sociable
Closed 1 2 3 4 5 6 7 Open
Passive 1 2 3 4 5 6 7 Active
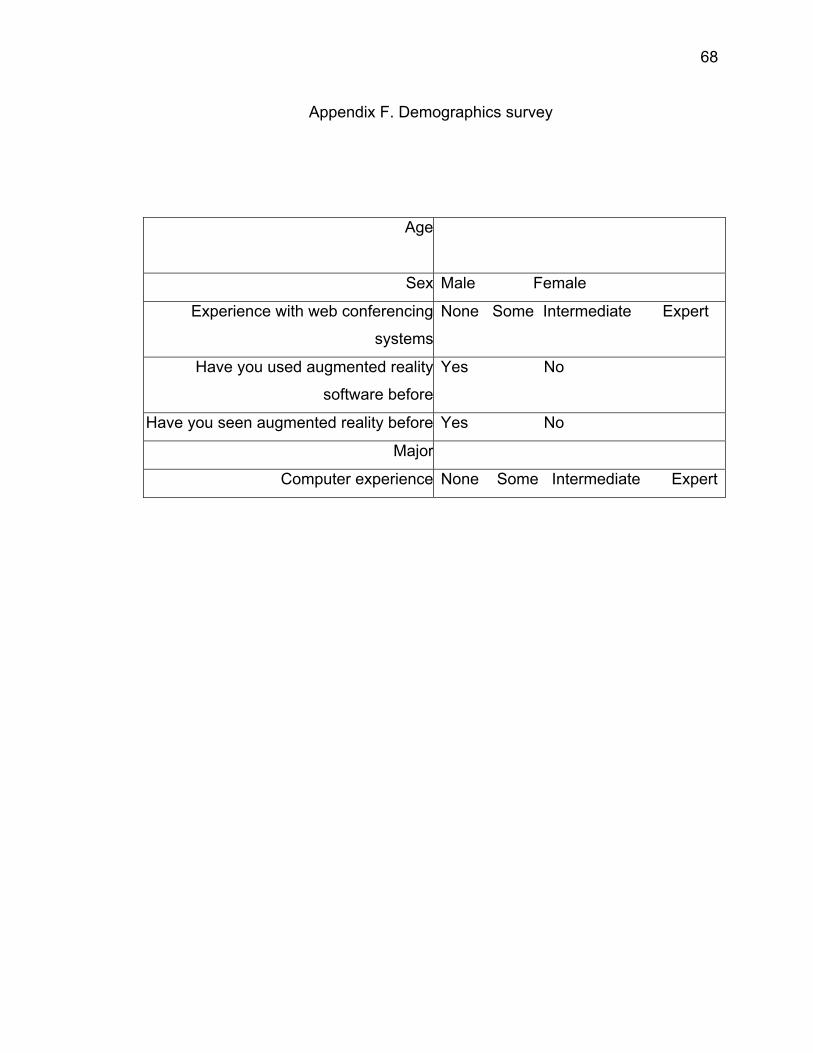
68
Appendix F. Demographics survey
Age
Sex Male Female
Experience with web conferencing
systems
None Some Intermediate Expert
Have you used augmented reality
software before
Yes No
Have you seen augmented reality before Yes No
Major
Computer experience None Some Intermediate Expert

69
Appendix G. Model viewed in ARchat

70
Appendix H. Post task interview questions
Social presence interview questions What was annoying with each system?
What was good about each system?
If you could change one thing in each, what would it be?
Did using the augmented system feel more natural?
If you had to do a similar task again, which system would you prefer?