
An epigenetic breeding system in soybean for increased ... · type Col-0 with met1 or ddm1 DNA...
37
1 An epigenetic breeding system in soybean for increased yield and stability Sunil Kumar Kenchanmane Raju, Mon-Ray Shao, Robersy Sanchez 1 , Ying-Zhi Xu, Ajay Sandhu 2 , George Graef and Sally Mackenzie 1,3 . Department of Agronomy and Horticulture, University of Nebraska-Lincoln, Lincoln, Nebraska, USA 68588 1 Current address: Departments of Biology and Plant Science, Pennsylvania State University, University Park, PA 16802 2 Current address: Syngenta, Woodland, California, USA. 3 Corresponding author: Sally Mackenzie [email protected] . CC-BY-NC-ND 4.0 International license peer-reviewed) is the author/funder. It is made available under a The copyright holder for this preprint (which was not . http://dx.doi.org/10.1101/232819 doi: bioRxiv preprint first posted online Dec. 12, 2017;
Transcript of An epigenetic breeding system in soybean for increased ... · type Col-0 with met1 or ddm1 DNA...

1
An epigenetic breeding system in soybean for increased yield and
stability
Sunil Kumar Kenchanmane Raju, Mon-Ray Shao, Robersy Sanchez1, Ying-Zhi Xu, Ajay
Sandhu2, George Graef and Sally Mackenzie
1,3.
Department of Agronomy and Horticulture, University of Nebraska-Lincoln, Lincoln, Nebraska, USA 68588
1 Current address: Departments of Biology and Plant Science, Pennsylvania State University, University Park, PA
16802
2 Current address: Syngenta, Woodland, California, USA.
3Corresponding author: Sally Mackenzie [email protected]
.CC-BY-NC-ND 4.0 International licensepeer-reviewed) is the author/funder. It is made available under aThe copyright holder for this preprint (which was not. http://dx.doi.org/10.1101/232819doi: bioRxiv preprint first posted online Dec. 12, 2017;
2
ABSTRACT
Epigenetic variation has been associated with a wide range of adaptive phenotypes in
plants, but there exist few direct means for exploiting this variation. RNAi suppression of the
plant-specific gene, MutS HOMOLOG1 (MSH1), in multiple plant species produces a range of
developmental changes accompanied by modulation of defense, phytohormone, and abiotic
stress response pathways. This msh1-conditioned developmental reprogramming is retained
independent of transgene segregation, giving rise to transgene-null ‘memory’ effects. An
isogenic memory line crossed to wild type produces progeny families displaying increased
variation in adaptive traits that respond to selection. This study investigates amenability of the
MSH1 system for inducing epigenetic variation in soybean that may be of value agronomically.
We developed epi-line populations by crossing with msh1-acquired soybean memory lines.
Derived soybean epi-lines showed increase in variance for multiple yield-related traits including
pods per plant, seed weight, and maturity time in both greenhouse and field trials. Selected epi-
F2:4 and epi-F2:5 lines showed an increase in seed yield over wild type. By epi-F2:6, we observed a
return of MSH1-derived enhanced growth back to wild type levels. Epi-populations also showed
evidence of reduced epitype-by-environment (e x E) interaction, indicating higher yield stability.
Transcript profiling of the soybean epi-lines identified putative signatures of enhanced growth
behavior across generations. Genes related to cell cycle, abscisic acid biosynthesis, and auxin-
response, particularly SMALL AUXIN UP RNAs (SAURs), were differentially expressed in epi-
F2:4 lines that showed increased yield when compared to epi-F2:6. These data support the potential
of MSH1-derived epigenetic variation in plant breeding for enhanced yield and yield stability.
INTRODUCTION
Plants respond to changing environments through phenotypic plasticity that derives from
both genetic and epigenetic factors (Bossdorf et al., 2010; Kooke et al., 2015). Epigenetic
variation can, to some extent, be monitored via cytosine DNA methylation repatterning (Becker
et al., 2011; Schmitz et al., 2011) that can be transgenerationally heritable (Quadrana and Colot,
2016). Arabidopsis epigenetic recombinant inbred lines (epiRILs), derived from crossing wild
type Col-0 with met1 or ddm1 DNA methylation mutants, show segregation and heritability of
novel methylation patterns together with phenotypic diversity (Johannes et al., 2009; Reinders et
al., 2009; Roux et al., 2011). The epiRILs show variation in biomass productivity, especially
when challenged with weed competitors and biotic stress, driven partly by complementarity
among epigenotypes (Latzel et al., 2013). Variation in complex traits like flowering time and
root length is also influenced by epigenetic variation of segregating DNA methylation changes
(Cortijo et al., 2014). These observations advance the hypothesis that induced epigenetic
variation can be exploited effectively for selection in crop improvement.
.CC-BY-NC-ND 4.0 International licensepeer-reviewed) is the author/funder. It is made available under aThe copyright holder for this preprint (which was not. http://dx.doi.org/10.1101/232819doi: bioRxiv preprint first posted online Dec. 12, 2017;

3
MutS HOMOLOG1 (MSH1) is a plant-specific homolog of the bacterial DNA repair gene
MutS (Abdelnoor et al., 2003). MSH1 is a nuclear-encoded protein that is dual-targeted to
mitochondria and plastids, and depletion of MSH1 influences both mitochondrial and plastid
properties (Xu et al., 2011). In Arabidopsis msh1 T-DNA insertion lines, phenotypes include leaf
variegation, reduced growth rate, delayed flowering, extended juvenility, altered floral
morphology, aerial rosettes, and enhanced secondary growth (Xu et al., 2012). These mutants
also show tolerance to heat, high light and drought stress (Shedge et al., 2010; Virdi et al., 2016;
Xu et al., 2011). These pleiotropic phenotypes are largely attributed to depletion of MSH1 from
plastids, evidenced by hemi-complementation analysis (Xu et al., 2012), and the msh1-triggered
plastid changes condition genome-wide methylome repatterning (Virdi et al., 2015). Similarly,
detailed transcriptome analysis of msh1 mutants reveals wide-ranging changes in gene
expression related to defense response, abiotic stress, MAPK cascade, circadian rhythm, and
phytohormone pathways (Shao et al., 2017).
RNAi suppression of MSH1 in monocot and dicot species produces an identical range of
developmental phenotypes (de la Rosa Santamaria et al., 2014; Xu et al., 2012; Yang et al.,
2015). The altered phenotypes are somewhat attenuated but stable after segregation of the RNAi
transgene, producing msh1 ‘memory’. In sorghum, crossing msh1 memory lines with isogenic
wild type gives rise to enhanced vigor phenotypes that appear to respond to selection in small-
scale studies (de la Rosa Santamaria et al., 2014). In tomato, MSH1-derived vigor phenotypes are
heritable in greenhouse and field conditions, graft transmissible and obviated by treatment with
5-azacytidine, further implicating DNA methylation in this phenomenon (Yang et al., 2015).
Soybean (Glycine max (L.) Merr.) is the most widely grown legume in the world, second
only to grasses in economic importance. Synergistic interactions between advances in breeding
and agronomic practices have steadily increased soybean yields in the past century (Rowntree et
al., 2013). Further improvement will face challenges from climate instability and limited genetic
diversity, which calls for the implementation of novel tools and methodologies to benefit
soybean performance over a broad range of environments (Rincker et al., 2014). In this study, we
used the well-known soybean variety ‘Thorne’ (McBlain et al., 1993) to investigate amenability
of the MSH1 system in exploiting epigenetic breeding potential. Greenhouse and large-scale
multi-location field trials showed enhanced yield in selected F2:4 and F2:5 epi-lines. We document
tapering of MSH1-derived vigor in these lines by F2:6, and show evidence of buffering effects in
epi-populations across environments, thus reducing epitype-by-environment interaction and
possibly stabilizing yield across locations. Transcriptome studies of epi-lines from F2:4, F2:5 and
F2:6 generations revealed genes and pathways that participate in the MSH1-derived enhanced
growth and its waning by later generations.
.CC-BY-NC-ND 4.0 International licensepeer-reviewed) is the author/funder. It is made available under aThe copyright holder for this preprint (which was not. http://dx.doi.org/10.1101/232819doi: bioRxiv preprint first posted online Dec. 12, 2017;

4
RESULTS:
MSH1 suppression in soybean induces a characteristic pleiotropic phenotype that persists
after transgene segregation
RNAi suppression of MSH1 in soybean produces phenotypic changes that include
reduced growth rate, male sterility, enhanced branching, and altered leaf and floral morphology
(Fig 1A), similar to earlier reports in Arabidopsis, tomato, and tobacco (Sandhu et al., 2007; Xu
et al., 2011). Severely affected plants grow slower than wild type (Fig 1B), and show delayed
flowering, extended juvenility and enhanced branching. The soybean MSH1-RNAi T0 population
did not produce visible variegation and/or male sterility, although 10 – 20% of progeny from
these lines (T1) showed wrinkled and puckered leaves. Almost 50% of the T1 plants were semi-
sterile, with increased flower drop and partially filled or empty seed pods. In subsequent
generations, plants displayed a variable range of phenotypic severity.
Following transgene segregation, a proportion of progeny retained their acquired
phenotypes of dwarfing, delayed flowering and altered leaf morphology for seven self-pollinated
generations tested to date (Fig 1C). The transgene-null lines, retaining altered phenotype while
restored in MSH1 transcript levels (Fig 1D), comprise the memory lines used in this study.
Memory lines were classified based on their phenotype into intermediate (i) and extreme (e)
designated iMSH1 and eMSH1 respectively, while the remaining did not show any visible MSH1
phenotype and were categorized nMSH1 (Fig S1A).
Transcript profiling of soybean MSH1-RNAi lines shows correspondence of gene
expression changes with phenotype severity
To evaluate the association of transcriptome changes with severity of MSH1 phenotype,
two soybean MSH1-RNAi lines (transgene positive) differing in their phenotype severity were
assayed by gene expression profiling with the Affymetrix Soybean Genome Array (GPL4592)
(Xu et al., 2011). We used a stringent cutoff (p-value < 0.05 and |log2(value)| > 1) to call
differentially expressed genes (DEGs) relative to wild type controls.
The severe phenotype plants showed differential expression of 2589 genes, whereas mild
phenotype plants showed 154 DEGs, 114 of which were shared in common (Fig S2A). Both
classes had far more up-regulated genes, with severe showing 1656 up-regulated and 933 down-
regulated genes, and mild showing 145 up-regulated and only nine down-regulated genes (Fig
S2B, Table S1). The photosystem II-related genes PsbP-like 2, PsbQ-like 2 and PS II reaction
center PSB28 (Glyma.10g290700, Glyma.12g215100, Glyma.13g127200) were significantly
down-regulated, similar to what was described in Arabidopsis msh1 mutants (Shao et al., 2017).
We also observed significant down-regulation of histone H3, H4 and H2B.3 proteins
(Glyma.15g032300, Glyma.20g083800, and Glyma.12g179100), consistent with plant stress
response (Logemann et al., 1995).
.CC-BY-NC-ND 4.0 International licensepeer-reviewed) is the author/funder. It is made available under aThe copyright holder for this preprint (which was not. http://dx.doi.org/10.1101/232819doi: bioRxiv preprint first posted online Dec. 12, 2017;

5
Gene Ontology (GO) analysis with AgriGO (Du et al., 2010) classified differences
between the two phenotypic classes. While mild-phenotype plants showed predominantly abiotic
stress response, severe-phenotype plants were more broadly affected in phytohormone, defense,
immune, abiotic and biotic stress response pathways, reflecting a greater global stress response
with increased phenotype severity. A similar effect was seen in Arabidopsis (Shao et al., 2017),
implicating a broader effect than would be conferred by organelle perturbation alone (Fig 2A).
Visualizing GO terms associated with enriched pathways using REVIGO (Supek et al., 2011),
genes related to stress and calcium signaling were upregulated (Fig S2C), while photosynthesis
and chromatin/cell cycle factors were down-regulated, again reflecting global stress behavior
(Fig S2D, Table S2).
Cross-species comparison of MSH1-RNAi soybean transcriptome data with Arabidopsis
msh1 T-DNA mutant (Shao et al., 2017) and tomato MSH1-RNAi lines (Yang et al., 2015)
showed that while individual genes did not necessarily overlap for differential expression
between species, respective GO categories showed high coincidence (Table S3, Fig 2B).
Defense, immune response, phytohormone, MAPKKK cascade, biotic and abiotic stress response
categories were shared among the three species. We also found differential expression in
soybean for orthologs of seven of the 16 signatures belonging to the circadian clock, stress
hormone and light-response pathways previously identified through the integration of
methylome, RNAseq and network-based enrichment analysis in Arabidopsis msh1 memory lines
(Yang et al. 2017 submitted; Table S4). Vitamin metabolism and senescence-related genes
comprised two categories that were enriched in the soybean MSH1-RNAi line but not in tomato
and Arabidopsis, reflecting a species-specific response to the msh1-associated perturbation. The
results indicate that MSH1 suppression confers strikingly similar changes in soybean, tomato,
and Arabidopsis in gene expression changes and associated phenotypes.
Crossing soybean msh1 memory lines to wild type produces epi-lines with increased
variation in adaptive traits
Recent studies have shown that crossing msh1 memory lines to their isogenic wild type
counterpart can influence growth vigor in Arabidopsis, sorghum, and tomato (de la Rosa
Santamaria et al., 2014; Virdi et al., 2015; Yang et al., 2015). To investigate the potential of
msh1-derived vigor in epi-lines of soybean, assess inheritance, and determine the longevity of
enhanced growth behavior through self-pollination, we performed reciprocal crosses of msh1
memory lines with wild type Thorne (Fig S3). Plants in the F1 generation were restored to the
normal phenotype, ruling out cytoplasmic genetic changes for the msh1 memory phenotype (de
la Rosa Santamaria et al., 2014).
Derived epi-F2 lines displayed a broader range of phenotypic variation than wild type for
agronomic traits including number of pods (PP) and seeds per plant (SP), seed weight (SW), 100
seed weight (100SW), days to flowering (R1), and days to maturity (R8, Table S5). There was a
.CC-BY-NC-ND 4.0 International licensepeer-reviewed) is the author/funder. It is made available under aThe copyright holder for this preprint (which was not. http://dx.doi.org/10.1101/232819doi: bioRxiv preprint first posted online Dec. 12, 2017;

6
significant difference in within-genotype variance for number of pods per plant among wild type
and the reciprocal F2 populations (Fig 3A, Bartlett test, p-value 0.013). The variance estimate for
wild type was 103.03, while for WT x T9 F2 and T8 x WT F2 it was 213.72 and 364.38
respectively. F2 populations also differed significantly in flowering time and maturity time, with
a small proportion showing higher pod number per plant and delayed maturity (Table S5, Fig
3C).
We subsequently developed epi-F2 populations by crossing wild type with three different
phenotypic classes of non-transgenic memory lines, extreme, intermediate and normal phenotype
(Fig S1A, B), as pollen donors. Similar to the previous reciprocal crosses, there were significant
differences in variance between wild type and the three epi-F2 populations for number of pods
per plant (Fig 3B, Bartlett test, p-value 0.0011). Increased variance for the measured traits was
also observed among the three epi-F2 populations. For example, epi-F2 WT x eMSH1 showed
lower variance than wild type for pods per plant and plant height, but higher variance for days to
flowering (Table S6). Epi-F2 WT x iMSH1 had higher variance for pods per plant, and days to
flowering, while epi-F2 WT x nMSH1 showed higher variance than wild type for all three
measured traits (Table S6). These results suggest that MSH1 epi-populations represent different
conditions, perhaps impacting the strategy for selection.
To investigate variation among derived epi-lines and wild type under standard field
conditions, we tested 30 F2:4 lines from each of the three populations, including 30 wild type sub-
lines as shown in Supplemental Figure S1B. These 120 lines were grown as random complete
blocks (RCBD) in four Nebraska locations, Lincoln (SC), Clay Center (CC), Phillips (PH), and
Mead (MD), with three replications per location for a total of 12 replications of two-row, ten-
foot plots, with rows 3 m long and spaced 0.76 m apart. Data were collected on days to maturity,
plant height, protein and oil concentration, and total yield (Table 1).
Similar to greenhouse results for epi-F2, we observed differences in variance components
for total yield. Epi-F2:4 nMSH1 showed ten times higher variance than wild type for total yield,
while epi- F2:4 eMSH1 showed variance similar to wild type (Table S7). We recorded single
plant measurements for pod number per plant, number of branches, and plant height, from ten
randomly selected epi-lines in each population along with ten wild type sub-lines from the multi-
location field trial. Data were collected from five randomly selected plants from a plot, with two
replicates in two locations, Mead and Clay Center. These two locations represent different agro-
ecological zones in Nebraska with contrasting soil types. From ANOVA tests, we saw no
significant variation among strains or plants within strains for number of branches. For plant
height, we saw significant variation among strains in F2:4 iMSH1 (p-value = 0.0096) and F2:4
nMSH1 (p-value = 0.0075). Epi-F2:4 iMSH1 also showed significant variation among strains for
pods per plant (p-value = 0.03), while wild type showed significant difference among plants
.CC-BY-NC-ND 4.0 International licensepeer-reviewed) is the author/funder. It is made available under aThe copyright holder for this preprint (which was not. http://dx.doi.org/10.1101/232819doi: bioRxiv preprint first posted online Dec. 12, 2017;

7
within strains (p-value = 0.007, Table S8). These observations again indicate that epi-lines may
differ significantly in their msh1 effects.
Selected MSH1 epi-lines show increased yield compared to wild type in multi-year field
trials
To evaluate field performance of MSH1 epi-lines, F2:4 lines were derived from an upper
6% selection for number of pods per plant in the F2 generation. Thirty plants each from the
selected F2:3 lines were grown in the greenhouse and the upper half of these 30 plants, based on
number of pods per plant was bulked to form the ‘top 50% selection (S)’. In addition, equal
numbers of seeds from all thirty plants were bulked to form the F2:4 ‘bulk composite’ (Figure
S3). These F2:4 lines and wild type were grown as ten-foot two-row plots in the field at Havelock
farm in Lincoln, Nebraska, during 2014.
Wild type Thorne showed a mean yield of 4284.65 kg/ha, whereas bulk epi F2:4 line
yields ranged from 4419.82 kg/ha to 4834.89 kg/ha and top 50% selection epi-F2:4 line yields
ranged from 4758.33 kg/ha to 5016.7 kg/ha. F2:4 R10S yielded significantly better than wild type
(Welch two-sample t-test, p-value 0.02, Fig 4A) with a 95% confidence interval for yield gain
between 283.3 and 1180.8 kg/ha. As a population, T8 x WT F4 yielded 4618.38 kg/ha and WT x
T9 F4 yielded 4657.85 kg/ha compared to wild type, which yielded 4284.65 kg/ha.
Derived F2:5 epi-lines (Fig S3) were grown in four different Nebraska locations in the
summer of 2015, Lincoln (SC), Clay Center (CC), Phillips (PH) and Mead (MD), with three
replications at each site. Mean yield data pooled across locations showed that grain yield for F2:5
P37 was significantly higher than wild type by 301.8 kg/ha (t-test, p-value 0.00931, Fig 4B), an
increase of seven percent. Except for F2:5 R38, all lines showed increased grain yield from 27
kg/ha to 301.8 kg/ha. Regression over an environmental index to visualize any epitype-by-
environment (e x E) interactions showed F2:5 P34 to have a higher slope than wild type, but not
significant by ANOVA. F2:5 P37 showed consistently higher yield than wild type across all
environmental indices (Fig 4C).
To confirm that there was no penalty for enhanced seed yield in seed quality parameters,
we measured seed protein concentration and oil concentration. There was no significant
difference in seed protein concentration and 100 seed weight, but epi-lines derived from T8 x
WT crosses showed lower oil concentration compared to wild type. F2:5 lines from this
population also showed earlier maturity compared to wild type (p-value 0.0164). Lodging score
did not show variation among the lines tested (Table S9).
F2:6 lines, developed from a greenhouse seed increase of 2014-grown epi-F2:4, showed no
significant difference in mean yield compared to wild type (Fig S4), indicating that the enhanced
.CC-BY-NC-ND 4.0 International licensepeer-reviewed) is the author/funder. It is made available under aThe copyright holder for this preprint (which was not. http://dx.doi.org/10.1101/232819doi: bioRxiv preprint first posted online Dec. 12, 2017;

8
growth effects taper back to wild type levels by F6. Consequently, these experiments demonstrate
strongest yield enhancement at F2:4 and F2:5 generations, with the growth performance returning
to wild type levels by F2:6, similar to the reported dissipation of epigenetic effects over
generations in ddm1 epiRILs (Cortijo et al., 2014; Roux et al., 2011).
Progenies of wild type scion grafted on MSH1-RNAi show increased yield in field trials
We tested whether enhanced growth could also be observed from msh1-grafted progenies
in soybean, drawing on previous reports in Arabidopsis and tomato (Virdi et al., 2015; Yang et
al., 2015). For this experiment, we grafted three different phenotypic classes of MSH1-RNAi
rootstocks with wild type Thorne scions (Fig S5A), collected seeds from the graft plants, and
self-pollinated them for one generation before planting in the 2015 multi-location field trial.
Results showed significant yield increase in S2 grafted progenies over wild type (Fig S5B). The
type of MSH1-RNAi phenotype used as rootstock appeared to make a difference, with WT /
nMSH1-RNAi lines showing significantly higher yield compared to WT / WT graft (t-test, p-
value 0.040) or WT (t-test, p-value 0.019), whereas the WT / iMSH1 S2 line was marginally
better than WT (t-test, p-value 0.052), and WT / eMSH1 was not significantly different from
wild type (Fig S5B). These results further support the non-genetic nature of enhanced growth
and the involvement of mobile signals in the process.
MSH1-derived epi-lines are more stable across environments
Epi-F2:4 populations developed by crossing wild type with the three different phenotypic
classes (eMSH1, iMSH1, and nMSH1) of non-transgenic memory lines were grown together with
thirty wild type sub-lines in four locations. The experiment involved a total of 12 replications of
two-row, ten-foot plots.
We performed ANOVA tests for interaction between strain and location within
populations. As expected, wild type showed strain x location interaction (t-test, p-value 0.0142),
but the epi-F2:4 populations showed no significant interaction (Fig 5A). To understand this
outcome, we plotted the strain means across locations, showing more cross-over interaction for
wild type lines, particularly between SC and PH locations (Fig 5B). PH is a higher yielding site,
with a mean yield of 4639.9 kg/ha, compared to SC, with a mean yield of 4403.04 kg/ha. Most
lines from the epi-population showed an increase in yield from SC to PH, while many of the wild
type sub-lines declined. There was also a higher spread of values for wild type sub-lines at the
MD location, which may be driving the interaction effects. Epi-lines generally demonstrated
higher yield consistency, with F2:4 iMSH1 lines showing tighter grouping in both AMMI plots
(Fig S6) and reaction norms (Fig 5B), and performing well in good environments as shown by
performance in PH.
.CC-BY-NC-ND 4.0 International licensepeer-reviewed) is the author/funder. It is made available under aThe copyright holder for this preprint (which was not. http://dx.doi.org/10.1101/232819doi: bioRxiv preprint first posted online Dec. 12, 2017;

9
From the variance component estimation, we see that wild type had more than eight fold
higher G x E variance estimate than epi-F2:4 populations for total yield (Table S7). There was no
significant difference in G X E variance component for other traits like maturity date, height, and
protein and oil concentrations. From the analysis of single plant measurements for among-strain
variation, wild type did not show any significant difference while epi-lines, particularly from F2:4
iMSH1, showed significant variation in plant height (p-value 0.0096) and number of pods per
plant (p-value 0.03), while F2:4 nMSH1 showed significant variation among strains for plant
height (p-value 0.007, Table S8). This inherent variation partly explains the buffering capacity
for these epi-lines in different environments, leading to reduced e x E interaction. These results
imply that MSH1-derived vigor and phenotypic plasticity can provide higher yield stability
across different environments, although more extensive testing would be necessary to quantify
this effect.
Putative expression signatures in MSH1-derived, enhanced growth epi-lines
To investigate biological processes underlying the MSH1-derived enhanced yield
phenotypes in epi-lines, we performed RNAseq analysis with the two epi-lines R10 and P37 in
F2:4, F2:5, and F2:6 generations and their respective wild type controls. These epi-lines showed
increased yield in F2:4 and F2:5 generations, while this enhancement diminished by F2:6. We
utilized this gradual reversion phenomenon to identify signatures of enhanced growth and their
change across generations.
To eliminate the possibility of seed contamination in the epi-lines, we analyzed the
RNAseq data with the genome analysis toolkit (GATK) pipeline to identify SNPs from the
alignment files. Plotting SNPs across the lines showed no haplotype blocks co-segregating with
the enhanced yield lines (Fig S7A, B). When total numbers of SNPs were considered, variation
between different epi-lines and wild type was equal to variation within the wild type lines. These
data rule out the possibility of seed contamination and are consistent with our hypothesis of
epigenetic regulation in MSH1-derived epi-lines in the absence of genetic changes.
RNAseq results show R10 F2:4 with the greater mean yield gain, to display the highest
number of DEGs compared to wild type, with 3048 DEGs, 1259 up-regulated and 1789 down-
regulated. R10 F2:5 and R10 F2:6 showed 955 and 887 DEGs, respectively (Table S10, Fig 6A).
We detected 682 DEGs in common between the two epi-lines R10 F2:4 and P37 F2:4, accounting
for 65% of DEGs in P37 F2:4 (Fig S8A). GO enrichment (SoyBase) and REVIGO analysis from
these DEGs showed up-regulation of stress response pathways (innate immune response,
defense, abscisic acid signaling pathway) and down-regulation of metabolism (protein
phosphorylation, cellular response to phosphate and magnesium starvation, phosphate ion
homeostasis, and galactolipid biosynthesis) (Fig S8B). Several genes related to plastid function
and development (Plastid organization, PS II assembly, bilateral symmetry, adaxial/abaxial
.CC-BY-NC-ND 4.0 International licensepeer-reviewed) is the author/funder. It is made available under aThe copyright holder for this preprint (which was not. http://dx.doi.org/10.1101/232819doi: bioRxiv preprint first posted online Dec. 12, 2017;

10
pattern specificity, response to far-red light, and signal transduction) were differentially
expressed only in R10 F2:4. Since R10 F2:4 was derived from crosses with msh1 memory line as
female parent, these changes are likely remnants of the msh1 memory effect.
To identify signature gene expression changes underlying the enhanced growth effect in
epi-F2:4 lines and the return to wild type levels by epi-F2:6, we compared gene expression changes
between F2:4 and F2:6 within the same lineage. To ensure direct comparison, we omitted genes
that were differentially expressed in epi-F2:6 vs WTF6 and WTF4 vs WTF6 comparisons. This
resulted in a filtered set of 545 DEGs in R10 and 454 DEGs in P37.
Auxin response genes were consistently modulated in both R10 and P37 epi-lines. In R10
F2:4 vs F2:6 comparisons, we detected changes predominantly in sucrose biosynthesis as well as
gravitropism and auxin stimulus response pathways (Fig 6B, Table 2), whereas in P37 F2:4 vs F2:6
comparisons, genes related to auxin response and protein phosphorylation were enriched (Table
2). A total of 40 DEGs (ca 8%) were common between the two epi-lines. These genes
represented auxin response, cell wall and cell cycle, and stress related genes (Table 3). The 40
genes were not necessarily modulated in the same direction in the two epi-lines, perhaps
emphasizing the role of circadian regulators in modulating the expression of these genes (Yang
et al. 2017, submitted).
Auxin response genes include IAA19, a positive regulator of plant growth (Kohno et al.,
2012) required for PIF4-mediated modulation of auxin signaling (Sun et al., 2013). SMALL
AUXIN UP RNAs (SAURs) were differentially expressed in both epi-lines. SAUR genes are
involved in cell expansion and development, particularly for integrating hormonal and
environmental signals that regulate plant growth (Li et al., 2015; Ren and Gray, 2015). These
data provide candidate pathways underpinning the growth behavior in MSH1 epi-lines.
DISCUSSION
Previous studies have shown the influence of MSH1 perturbation for altering growth in
Arabidopsis, sorghum, and tomato (de la Rosa Santamaria et al., 2014; Virdi et al., 2015; Yang et
al., 2015). The present study exploits epigenetic variation induced by MSH1 perturbation in
soybean to develop epi-lines that displayed an increase in seed yield from selected F4 and F5
families, subsiding by the F6 generation, under large-scale field conditions. Epi-lines showed
reduced epitype-by-environment interaction, inferring contribution of the MSH1 effect to
buffering across environments. Gene expression profiling within the derived epi-lines uncovered
pathways modulated in the enhanced growth F4 and F5 cycles that returned to wild type levels by
F6. Effects were particularly pronounced in auxin response pathways, suggesting their possible
utility as candidate markers in early selection. Observation of auxin response pathway
modulation in tomato epi-lines further strengthens this argument (Yang et al., 2015).
.CC-BY-NC-ND 4.0 International licensepeer-reviewed) is the author/funder. It is made available under aThe copyright holder for this preprint (which was not. http://dx.doi.org/10.1101/232819doi: bioRxiv preprint first posted online Dec. 12, 2017;

11
Disruption of MSH1 in both monocot and dicot plant species produces remarkably similar
developmental reprogramming phenotypes that are independent of transgene segregation (Xu et
al., 2012). Apart from conditioning a similar phenotypic response, MSH1 disruption in various
plant species show similar transcriptome behavior, including changes in immune and defense,
circadian rhythm, phytohormone, and abiotic stress response pathways (Fig 2B). Methylome
behavior in msh1 memory lines of Arabidopsis and tomato are also consistent (Yang et al. 2017,
submitted), further reiterating cross-species conservation for the MSH1 effect.
In Arabidopsis, epigenome disruption through crossing wild type Col-0 with met1-
derived epiRILs triggers reprogramming of DNA methylation and changes in gene expression
patterns in the F1 epi-hybrids (Rigal et al., 2016). Similarly, crossing soybean msh1 memory
lines to isogenic wild type brings together two genetically identical genomes varying in DNA
methylation patterns, creating conditions for widespread changes in DNA methylation and gene
expression. The increased phenotypic variation in agronomic traits seen in F2 populations may be
a consequence of segregation of these novel methylation patterns and chromatin changes.
Derived F2:4 epi-lines showed significant variation for agronomically important traits like
yield and days to maturity. Increasing variation in the population is considered beneficial under
challenging conditions (Herman et al., 2014). Similar to bet hedging under different
environments, epigenetically variable lines should be favored, since a portion of the individuals
are more suited to the prevailing environmental conditions, providing buffering capacity for the
population (Herman et al., 2014). Our data, albeit early-stage, support this notion by displaying
reduced epitype-by-environment interaction than was observed in isogenic wild type across
environments.
All six lines selected from top performing F2 plants showed a reduction of enhanced
growth by F2:6, further confirming the epigenetic nature of MSH1-derived growth changes, with
similar dissipation patterns described previously in Arabidopsis ddm1 epiRILs (Cortijo et al.,
2014; Roux et al., 2011). A recent study has suggested that stability and switching of acquired
epigenetic states are influenced by DNA sequence composition and repetitiveness (Catoni et al.,
2017). It is also speculated that methylation variation not linked to a causal genetic variant tends
to be less stable than when directly linked to genetic change (Schmitz et al., 2013). We deployed
a strict top 6% selection in the F2 generation from each population for further evaluation. We
assume that a more relaxed selection from these populations might show sustained enhanced
growth for extended generations beyond F2:6.
GO enrichment analysis of DEGs in derived epi-lines with increased yield showed
changes in genes associated with photosynthesis, plastid organization, defense, immune
response, light response, and phytohormones. These pathways are also differentially modulated
in msh1 mutants (Shao et al., 2017), and similar gene expression changes in stress and
phytohormone pathways are seen in MSH1-derived epi-F3 lines of tomato (Yang et al., 2015).
.CC-BY-NC-ND 4.0 International licensepeer-reviewed) is the author/funder. It is made available under aThe copyright holder for this preprint (which was not. http://dx.doi.org/10.1101/232819doi: bioRxiv preprint first posted online Dec. 12, 2017;
12
Soybean epi-line R10 F2:4 (msh1 memory line as female parent) showed greater correspondence
with the gene expression patterns of msh1 mutants than did epi-line P-37 F2:4 (wild type as
female parent). These observations suggest that the msh1 mutant profile represents both
organellar and epigenetic contributions to a global gene expression repatterning, and we are
seeking to further dissect this phenomenon.
Immune and defense response genes were consistently upregulated in the two soybean
epi-lines, in contrast to their repression in Arabidopsis F1 plants from ecotype hybrids
(Groszmann et al., 2015; Miller et al., 2015), perhaps reflecting a fundamental difference
between MSH1 derived enhanced growth and heterosis. Comparison of gene expression changes
in F2:4 vs. F2:6 within a single lineage offers a unique system to understand the pathways
associated with enhanced growth in the MSH1 system. By this analysis, auxin response genes
emerge in both epi-lines tested to date, consistent with previous reports from Arabidopsis
ecotype hybrids (Groszmann et al., 2015; Wang et al., 2017) and with previous studies in MSH1-
derived tomato epi-F3 lines (Yang et al., 2015).
SAUR genes are implicated in regulating plant growth through sensing hormone and
environmental cues (Li et al., 2015; Ren and Gray, 2015). These genes encode small proteins
unique to plants that are found in tandem arrays or as segmental duplications of closely related
genes (McClure and Guilfoyle, 1987) so that assigning a function to each SAUR gene is
challenging. Recent evidence suggests an emerging relationship between phytohormones and
epigenetic changes like histone modification, chromatin remodeling, and DNA methylation
repatterning. Thus, coordinated changes in epigenomes may be one of the outcomes of plant
hormone cross talk (Yamamuro et al., 2016).
Sucrose biosynthetic pathway genes were also differentially expressed in R10 F2:4
relative to R10 F2:6. Starch metabolism changes in Arabidopsis serve as a means to enhance
biomass and oil-seed production while maintaining oil quality parameters (Liu et al., 2015).
Sucrose synthase (SUS) enzymes play an important role in storage-reserve accumulation in
Arabidopsis (Fallahi et al., 2008) and, similarly, fructokinases (FRKs) are important for storage-
reserve accumulation and embryo carbon catabolism (Stein et al., 2016). Whether these
molecular signatures, both phytohormonal and metabolic, can be exploited in early-generation
selection to predict superior epi-lines needs to be investigated further.
We provide evidence that novel epigenetic variation induced by MSH1 suppression,
following crossing and F2 segregation, can be inherited for at least three generations and bred for
crop improvement with few rounds of selection to enhance and stabilize crop yield. It is unclear
whether enhanced phenotypic plasticity will extend beyond this generational timeframe. This is
a particularly intriguing question as relates to grafting, where no crossing is involved. These
findings have interesting implications for plant breeding, epigenetics, and transgenerational
inheritance of non-genetic variation within plant genomes. The observed outcomes portend the
.CC-BY-NC-ND 4.0 International licensepeer-reviewed) is the author/funder. It is made available under aThe copyright holder for this preprint (which was not. http://dx.doi.org/10.1101/232819doi: bioRxiv preprint first posted online Dec. 12, 2017;
13
utility of induced epigenetic variation within elite inbred lines, exploiting this variation to further
enhance and stabilize agronomically important traits. One limitation of our study was that all the
lines tested in the multi-location and multi-year experiments were derived from only five
different crosses and a similarly limited number of graft events, making it difficult to assess the
frequency and effect of msh1 memory and MSH1 suppression phenotypes on crossing and large-
scale grafting outcomes. More work is now needed on molecular signatures of the ideal msh1
suppression and memory lineages that will predict downstream performance and durability of the
epigenetic effect.
MATERIALS AND METHODS
RNAi Constructs and Transformation
A 557-bp segment encoding amino acids 945 to 1131, which represents the region
following the ATPase domain (V) and spanning to the end of the GIY-YIG homing
endonuclease domain (VI) of the soybean MSH1 gene was PCR-amplified using primers Soy-
MSF4 (5’-ATCAGTTGGTTTATGCTAAGGAAATGCT-3’) and Soy-3Rbam (5’-
TATGTATACAGGTTGGAAGTGCCAAAATTCCTATG-3’). The PCR-amplified fragment
was cloned in forward and reverse orientation flanking the second intron of the Arabidopsis
small nuclear riboprotein (At4g02840) in the pUCRNAi vector provided by Dr. H. Cerutti
(University of Nebraska-Lincoln) and later transferred into pPTN200 (pPZP family binary
vector), which carries the BAR gene with nopaline synthase promoter and 3’UTR terminator. The
hairpin sequences were placed under the control of 35S Cauliflower Mosaic Virus (CaMV)
promoter with a duplicated enhancer and terminated by its 3′ UTR. The final vector CIPB-7 was
used to transform soybean by the cotyledonary node method of Agrobacterium-mediated
transformation (Xing et al., 2000; Zhang et al., 1999), and the herbicide Basta was used for
selection of transformants.
Plant Material and Growth Conditions
For greenhouse studies, seeds were sown into moist peat pots containing standard potting
mix, and transferred to 8” pots after two weeks. Plants were grown under 16-hr light/dark cycle
at 280C. Days-to-flowering (R1) was measured as number of days from sowing to one open
flower at any node on the stem. Days-to-maturity (R8) was measured as number of days from
sowing until 95% of pods were mature and brown. Plant height was taken at R8 developmental
stage as distance between the soil surface and the apical meristem of the main stem. All plants
were hand-harvested individually, and number of pods was recorded before threshing to obtain
number of seeds per plant. Near infrared (NIR) technology was used to determine protein
concentration, oil concentration, and moisture content of the seeds. Total seed weight was
normalized to 13% moisture level.
.CC-BY-NC-ND 4.0 International licensepeer-reviewed) is the author/funder. It is made available under aThe copyright holder for this preprint (which was not. http://dx.doi.org/10.1101/232819doi: bioRxiv preprint first posted online Dec. 12, 2017;

14
Grafting was performed in the greenhouse on MSH1-RNAi and msh1 memory lines. Wild
type seedlings at 12-14 days after sowing were used as scion and grafted onto 10-day-old root
stocks of wild type control or MSH1 lines by the wedge grafting technique (Bezdicek et al.,
1972; Kiihl et al., 1977) with necessary modifications. Seeds were collected from the grafted
scion and 30 plants from each graft was grown for one generation (S1) in the green house and
bulk harvested to obtain S2 seeds. Graft-S2 lines were grown as two-row, ten foot plots in multi-
location field trials with three reps in each location for a total of 12 replications per graft.
During 2014 summer, twelve epi F2:4 lines with wild type were grown as four row plots
(3m long and 0.76m apart). All data, including plot yield, were collected on the center two rows
of each plot. Emergent seedlings in each plot were counted two weeks after sowing to determine
seed density and four epi-lines which had lower than 24 seeds per meter were discarded from
further analysis. All lines were grown in a completely randomized design with two replicates.
Rows were hand-harvested and threshed on site, and grain yield measured as total seed weight
for the plot adjusted to 13% moisture and converted to Kg/ha.
In 2015, a multi-location trial was conducted at four different Nebraska locations:
Lincoln, Mead, Clay Center and Phillips. Lines were grown as two-row plots (2.9m long and
0.76m apart) with 24-26 seeds per meter. In separate experiments, 12 F2:5 lines and six F2:6 lines
from the reciprocal cross experiment were grown as random complete blocks (RCBD) with three
replications at each location. In another experiment, 30 epi-lines each from three epi-F2:4
populations were grown along with 30 wild type sub-lines in RCBD with three replicates in four
locations. Grain yield was measured as combined harvestable seed yield adjusted to 13%
moisture. Height was recorded as average length of the main stem from soil surface to tip of the
plant, expressed as the average of three individual plants in a uniform section of the row.
Maturity date was recorded as number of days from planting until R8 stage, and lodging was
scored from 1 to 5, with 1 indicating all plants in the plot erect, 3 indicating a plot average of
plants at a 45 degree angle, and 5 showing all plants prostate on the ground. Single plant
measurements were recorded from ten randomly selected lines in each population in two
locations, Mead and Clay Center, with two replicates. In each plot, five randomly selected plants
were marked and measurements were taken for pods per plant, number of branches, number of
nodes, and height.
Phenotypic data analysis
For ANOVA analysis of main effects and interactions in 2014 and 2015 field
experiments, trait values were first fitted using the "lm" function in R with the linear model yijk ~
linei + envj + (line*env)ij + (rep/env)kj + eijk, where linei is the main effect of line i, envj is the
main effect of environment j, (line*env)ij is the interaction between line i and environment j,
(rep/env)kj is the effect of replicate k nested within environment j, and eijk is the residual error; all
independent variables were treated as fixed effects. Tests for significant effects and interactions
.CC-BY-NC-ND 4.0 International licensepeer-reviewed) is the author/funder. It is made available under aThe copyright holder for this preprint (which was not. http://dx.doi.org/10.1101/232819doi: bioRxiv preprint first posted online Dec. 12, 2017;

15
were then performed using the ANOVA function within the “car” R package. In the 2015 multi-
location trial, outliers for grain yield were identified based on a threshold of more than 2x the
interquartile range below the first quartile or above the third quartile (resulting in 4 observations
removed).
For phenotypic analysis within and across multiple environments (2015 multi-location
trial), mean trait values and corresponding confidence intervals were estimated for each line
using the “lme4” R package with the linear mixed model yijk ~ linei + envj + (line*env)ij +
(rep/env)kj + eijk, where linej was treated as a fixed effect and (rep/env)kj was treated as a random
effect. Tests for significant differences in line means were performed using general linear
hypothesis tests with the “multcomp” R package, with p-values adjusted using the Benjamini-
Hochberg method. After fitting the model, variance components were extracted using
“VarCorr()” function in R. For analysis of single plant measurements in the field to look at strain
variance and within line variance, data analysis was done using proc glm in SAS.
Joint regression analysis (Finlay and Wilkinson, 1963) was performed to assess
individual line performance relative to the grand population performance across environments
(i.e. environmental index). Trait data values for each line were regressed over the mean trait
performance of all lines within that environment, excluding the line being estimated to avoid bias
(Wright, 1976); the resulting slope of each line is an indicator of its response to environmental
change compared to the population mean (Lynch and Walsh, 1998). AMMI plots were generated
using the “agricolae” R package.
Microarray, RNA-seq and SNP analysis
RNA preparation and processing for microarray assay has been described previously (Xu
et al., 2011). We performed Gene Ontology (GO) analysis by converting the Affy probe ID into
Soybean Genome ID (Phytozome) using a custom script in R. AgriGO (Du et al., 2010) analysis
was performed on this list of differentially expressed genes. For comparative analysis, the best
Arabidopsis BLAST hit for each differentially expressed orthologous gene in MSH1-RNAi
tomato (Yang et al., 2015) and severe MSH1-RNAi soybean was used to generate GO
enrichment and plotted as a heat map using custom R scripts.
For RNAseq, leaves from four-week-old plants were harvested and frozen in liquid N2.
Three biological replicates for each epi-line, R10 and P37 from F2:4, F2:5 and F2:6 generations
were sampled along with three generations of wild type (WTF4, WTF5, and WTF6). RNA was
isolated with TRIzol (Invitrogen), followed by RNeasy (Qiagen) column purification.
Sequencing was performed by BGI, generating 2x100 bp paired-end reads with a mean of 25.6
million pairs per sample. After trimming bases below a quality score of 20, reads were aligned to
the Glycine max reference obtained from Phytozome (cv. Williams 82, assembly v2.0) using
STAR 2-pass method (Dobin et al., 2013) and allowing a mismatch rate of 0.04*(read length).
.CC-BY-NC-ND 4.0 International licensepeer-reviewed) is the author/funder. It is made available under aThe copyright holder for this preprint (which was not. http://dx.doi.org/10.1101/232819doi: bioRxiv preprint first posted online Dec. 12, 2017;

16
This resulted in a mean unique mapping rate of 93.2%, or 97.3% when including multi-mapped
reads. From STAR 2-pass alignment files, SNP detection was performed using the Genome
Analysis Toolkit (GATK) pipeline. SNP information from all samples was combined to create a
total possible SNP list, filtered to only include SNPs supported by an alternate allele frequency
of ≥ 0.75 and a read depth of ≥ 10. For every sample, if a SNP was not detected in a given
position, it was assumed to be equal to the reference nucleotide. Only positions declared as SNPs
in at least two of the 27 samples sequenced were retained as variable sites. Next, every sample
was compared against the wild type samples of the other generations as the control, so that the
wild type samples could also be evaluated, e.g. WTF4 , R-10F2:4, and P-37F2:4 were compared
against WTF5 and WTF6. If a position had a different nucleotide than the wild type samples (only
positions with agreement amongst the wild type controls were considered), then it was
considered a SNP relative to the wild type Thorne in our material.
All such SNPs were then plotted as depicted in Supplemental Fig S7. Putative SNP
haplo-blocks did not co-segregated with higher performance. For differentially expressed genes,
reads were mapped to annotated genes (assembly 2, version 1, release 275), then counted with
strand-specificity enforced. The Bioconductor package ‘sva’ was used to identify and remove a
single surrogate variable related to sequencing lane batch effect. DESeq2 (Love et al., 2014) was
used to normalize counts, estimate gene expression, and identify differentially expressed genes
(absolute log2 fold-change ≥ 0.5 and a FDR < 0.05). SoyBase (http://soybase.org/) was used for
GO enrichment analysis and heat maps generated using custom R scripts.
ACKNOWLEDGMENTS
We thank the UNL transformation core facility for soybean transformation and Travis
Scheuler, Daniel Jaber, Aaron Hoagland, and John Rajeswki for help with field experiments.
This work was partially supported by grants from National Science Foundation (IOS1126935)
and The Bill and Melinda Gates Foundation (OPP1088661) to S.M.
AUTHOR CONTRIBUTIONS Conceptualization: SM and SKKR; Performed experiments: SKKR, YZX, and AS; Data
Analysis: SKKR, MSR, GG, and RS; Writing – Original Draft: SKKR; Writing – Review and
Editing: SM and GG; All authors read and approved the final manuscript.
.CC-BY-NC-ND 4.0 International licensepeer-reviewed) is the author/funder. It is made available under aThe copyright holder for this preprint (which was not. http://dx.doi.org/10.1101/232819doi: bioRxiv preprint first posted online Dec. 12, 2017;

17
REFERENCES
Abdelnoor, R.V., Yule, R., Elo, A., Christensen, A.C., Meyer-Gauen, G. and Mackenzie, S.A. (2003) Substoichiometric shifting in the plant mitochondrial genome is influenced by a gene homologous to MutS. Proceedings of the National Academy of Sciences 100, 5968-5973.
Becker, C., Hagmann, J., Müller, J., Koenig, D., Stegle, O., Borgwardt, K. and Weigel, D. (2011) Spontaneous epigenetic variation in the Arabidopsis thaliana methylome. Nature 480, 245-249.
Bezdicek, D., Magee, B. and Schillinger, J. (1972) Improved reciprocal grafting technique for soybeans (Glycine max L.). Agronomy Journal 64, 558-558.
Bossdorf, O., Arcuri, D., Richards, C.L. and Pigliucci, M. (2010) Experimental alteration of DNA methylation affects the phenotypic plasticity of ecologically relevant traits in Arabidopsis thaliana. Evolutionary Ecology 24, 541-553.
Catoni, M., Griffiths, J., Becker, C., Zabet, N.R., Bayon, C., Dapp, M., Lieberman‐Lazarovich, M., Weigel, D. and Paszkowski, J. (2017) DNA sequence properties that predict susceptibility to epiallelic switching. The EMBO Journal.
Cortijo, S., Wardenaar, R., Colomé-Tatché, M., Gilly, A., Etcheverry, M., Labadie, K., Caillieux, E., Aury, J.-M., Wincker, P. and Roudier, F. (2014) Mapping the epigenetic basis of complex traits. Science 343, 1145-1148.
de la Rosa Santamaria, R., Shao, M.R., Wang, G., Nino-Liu, D.O., Kundariya, H., Wamboldt, Y., Dweikat, I. and Mackenzie, S.A. (2014) MSH1-induced non-genetic variation provides a source of phenotypic diversity in Sorghum bicolor. PLoS One 9, e108407.
Dobin, A., Davis, C.A., Schlesinger, F., Drenkow, J., Zaleski, C., Jha, S., Batut, P., Chaisson, M. and Gingeras, T.R. (2013) STAR: ultrafast universal RNA-seq aligner. Bioinformatics 29.
Du, Z., Zhou, X., Ling, Y., Zhang, Z. and Su, Z. (2010) agriGO: a GO analysis toolkit for the agricultural community. Nucleic acids research, gkq310.
Fallahi, H., Scofield, G.N., Badger, M.R., Chow, W.S., Furbank, R.T. and Ruan, Y.-L. (2008) Localization of sucrose synthase in developing seed and siliques of Arabidopsis thaliana reveals diverse roles for SUS during development. Journal of experimental botany 59, 3283-3295.
Finlay, K. and Wilkinson, G. (1963) The analysis of adaptation in a plant-breeding programme. Australian journal of agricultural research 14, 742-754.
Groszmann, M., Gonzalez-Bayon, R., Lyons, R.L., Greaves, I.K., Kazan, K., Peacock, W.J. and Dennis, E.S. (2015) Hormone-regulated defense and stress response networks contribute to heterosis in Arabidopsis F1 hybrids. Proc Natl Acad Sci U S A 112, E6397-6406.
Herman, J.J., Spencer, H.G., Donohue, K. and Sultan, S.E. (2014) How stable ‘should’epigenetic modifications be? Insights from adaptive plasticity and bet hedging. Evolution 68, 632-643.
Johannes, F., Porcher, E., Teixeira, F.K., Saliba-Colombani, V., Simon, M., Agier, N., Bulski, A., Albuisson, J., Heredia, F. and Audigier, P. (2009) Assessing the impact of transgenerational epigenetic variation on complex traits. PLoS Genet 5, e1000530.
Kiihl, R., Hartwig, E. and Kilen, T. (1977) Grafting as a tool in soybean breeding. Crop Science 17, 181-183.
.CC-BY-NC-ND 4.0 International licensepeer-reviewed) is the author/funder. It is made available under aThe copyright holder for this preprint (which was not. http://dx.doi.org/10.1101/232819doi: bioRxiv preprint first posted online Dec. 12, 2017;
18
Kohno, M., Takato, H., Horiuchi, H., Fujita, K. and Suzuki, S. (2012) Auxin-nonresponsive grape Aux/IAA19 is a positive regulator of plant growth. Molecular biology reports 39, 911-917.
Kooke, R., Johannes, F., Wardenaar, R., Becker, F., Etcheverry, M., Colot, V., Vreugdenhil, D. and Keurentjes, J.J.B. (2015) Epigenetic Basis of Morphological Variation and Phenotypic Plasticity in Arabidopsis thaliana. The Plant Cell 27, 337-348.
Latzel, V., Allan, E., Silveira, A.B., Colot, V., Fischer, M. and Bossdorf, O. (2013) Epigenetic diversity increases the productivity and stability of plant populations. Nature communications 4.
Li, Z.-G., Chen, H.-W., Li, Q.-T., Tao, J.-J., Bian, X.-H., Ma, B., Zhang, W.-K., Chen, S.-Y. and Zhang, J.-S. (2015) Three SAUR proteins SAUR76, SAUR77 and SAUR78 promote plant growth in Arabidopsis. Scientific reports 5, 12477.
Liu, F., Zhao, Q., Mano, N., Ahmed, Z., Nitschke, F., Cai, Y., Chapman, K.D., Steup, M., Tetlow, I.J. and Emes, M.J. (2015) Modification of starch metabolism in transgenic Arabidopsis thaliana increases plant biomass and triples oilseed production. Plant biotechnology journal.
Logemann, E., Wu, S.C., Schröder, J., Schmelzer, E., Somssich, I.E. and Hahlbrock, K. (1995) Gene activation by UV light, fungal elicitor or fungal infection in Petroselinum crispum is correlated with repression of cell cycle‐related genes. The Plant Journal 8, 865-876.
Love, M.I., Huber, W. and Anders, S. (2014) Moderated estimation of fold change and dispersion for RNA-seq data with DESeq2. Genome Biol 15.
Lynch, M. and Walsh, B. (1998) Genetics and analysis of quantitative traits:Sinauer Sunderland, MA.
McBlain, B., Fioritto, R., St Martin, S., Calip-Dubois, A., Schmitthenner, A., Cooper, R. and Martin, R. (1993) Registration of ‘Thorne’soybean. Crop science 33, 1406-1406.
McClure, B.A. and Guilfoyle, T. (1987) Characterization of a class of small auxin-inducible soybean polyadenylated RNAs. Plant molecular biology 9, 611-623.
Miller, M., Song, Q., Shi, X., Juenger, T.E. and Chen, Z.J. (2015) Natural variation in timing of stress-responsive gene expression predicts heterosis in intraspecific hybrids of Arabidopsis. Nat Commun 6, 7453.
Quadrana, L. and Colot, V. (2016) Plant Transgenerational Epigenetics. Annual Review of Genetics 50, 467-491.
Reinders, J., Wulff, B.B., Mirouze, M., Marí-Ordóñez, A., Dapp, M., Rozhon, W., Bucher, E., Theiler, G. and Paszkowski, J. (2009) Compromised stability of DNA methylation and transposon immobilization in mosaic Arabidopsis epigenomes. Genes & Development 23, 939-950.
Ren, H. and Gray, W.M. (2015) SAUR proteins as effectors of hormonal and environmental signals in plant growth. Molecular plant 8, 1153-1164.
Rigal, M., Becker, C., Pelissier, T., Pogorelcnik, R., Devos, J., Ikeda, Y., Weigel, D. and Mathieu, O. (2016) Epigenome confrontation triggers immediate reprogramming of DNA methylation and transposon silencing in Arabidopsis thaliana F1 epihybrids. Proc Natl Acad Sci U S A 113, E2083-2092.
Rincker, K., Nelson, R., Specht, J., Sleper, D., Cary, T., Cianzio, S.R., Casteel, S., Conley, S., Chen, P. and Davis, V. (2014) Genetic improvement of US soybean in maturity groups II, III, and IV. Crop Science 54, 1419-1432.
.CC-BY-NC-ND 4.0 International licensepeer-reviewed) is the author/funder. It is made available under aThe copyright holder for this preprint (which was not. http://dx.doi.org/10.1101/232819doi: bioRxiv preprint first posted online Dec. 12, 2017;

19
Roux, F., Colomé-Tatché, M., Edelist, C., Wardenaar, R., Guerche, P., Colot, V., Jansen, R.C. and Johannes, F. (2011) Genome-wide epigenetic perturbation jump-starts patterns of heritable variation found in nature. Genetics 188, 1015-1017.
Rowntree, S.C., Suhre, J.J., Weidenbenner, N.H., Wilson, E.W., Davis, V.M., Naeve, S.L., Casteel, S.N., Diers, B.W., Esker, P.D. and Specht, J.E. (2013) Genetic gain× management interactions in soybean: I. Planting date. Crop Science 53, 1128-1138.
Sandhu, A.P., Abdelnoor, R.V. and Mackenzie, S.A. (2007) Transgenic induction of mitochondrial rearrangements for cytoplasmic male sterility in crop plants. Proc Natl Acad Sci U S A 104.
Schmitz, R.J., He, Y., Valdés-López, O., Khan, S.M., Joshi, T., Urich, M.A., Nery, J.R., Diers, B., Xu, D. and Stacey, G. (2013) Epigenome-wide inheritance of cytosine methylation variants in a recombinant inbred population. Genome research 23, 1663-1674.
Schmitz, R.J., Schultz, M.D., Lewsey, M.G., O’Malley, R.C., Urich, M.A., Libiger, O., Schork, N.J. and Ecker, J.R. (2011) Transgenerational epigenetic instability is a source of novel methylation variants. Science 334, 369-373.
Shao, M.-R., Kumar Kenchanmane Raju, S., Laurie, J.D., Sanchez, R. and Mackenzie, S.A. (2017) Stress-responsive pathways and small RNA changes distinguish variable developmental phenotypes caused by MSH1 loss. BMC Plant Biology 17, 47.
Shedge, V., Davila, J., Arrieta-Montiel, M.P., Mohammed, S. and Mackenzie, S.A. (2010) Extensive rearrangement of the Arabidopsis mitochondrial genome elicits cellular conditions for thermotolerance. Plant physiology 152, 1960-1970.
Stein, O., Avin-Wittenberg, T., Krahnert, I., Zemach, H., Bogol, V., Daron, O., Aloni, R., Fernie, A.R. and Granot, D. (2016) Arabidopsis fructokinases are important for seed oil accumulation and vascular development. Frontiers in plant science 7.
Sun, J., Qi, L., Li, Y., Zhai, Q. and Li, C. (2013) PIF4 and PIF5 transcription factors link blue light and auxin to regulate the phototropic response in Arabidopsis. The Plant Cell 25, 2102-2114.
Supek, F., Bošnjak, M., Škunca, N. and Šmuc, T. (2011) REVIGO summarizes and visualizes long lists of gene ontology terms. PloS one 6, e21800.
Virdi, K.S., Laurie, J.D., Xu, Y.Z., Yu, J., Shao, M.R., Sanchez, R., Kundariya, H., Wang, D., Riethoven, J.J., Wamboldt, Y., Arrieta-Montiel, M.P., Shedge, V. and Mackenzie, S.A. (2015) Arabidopsis MSH1 mutation alters the epigenome and produces heritable changes in plant growth. Nat Commun 6, 6386.
Virdi, K.S., Wamboldt, Y., Kundariya, H., Laurie, J.D., Keren, I., Kumar, K.S., Block, A., Basset, G., Luebker, S. and Elowsky, C. (2016) MSH1 is a plant organellar DNA binding and thylakoid protein under precise spatial regulation to alter development. Molecular Plant 9, 245-260.
Wang, L., Wu, L.M., Greaves, I.K., Zhu, A., Dennis, E.S. and Peacock, W.J. (2017) PIF4-controlled auxin pathway contributes to hybrid vigor in Arabidopsis thaliana. Proceedings of the National Academy of Sciences, 201703179.
Wright, A. (1976) Bias in the estimation of regression coefficients in the analysis of genotype-environmental interaction. Heredity 37, 299-303.
.CC-BY-NC-ND 4.0 International licensepeer-reviewed) is the author/funder. It is made available under aThe copyright holder for this preprint (which was not. http://dx.doi.org/10.1101/232819doi: bioRxiv preprint first posted online Dec. 12, 2017;

20
Xing, A., Zhang, Z., Sato, S., Staswick, P. and Clemente, T. (2000) The use of the two T-DNA binary system to derive marker-free transgenic soybeans. In Vitro Cellular & Developmental Biology-Plant 36, 456-463.
Xu, Y.Z., Arrieta-Montiel, M.P., Virdi, K.S., de Paula, W.B., Widhalm, J.R., Basset, G.J., Davila, J.I., Elthon, T.E., Elowsky, C.G., Sato, S.J., Clemente, T.E. and Mackenzie, S.A. (2011) MutS HOMOLOG1 is a nucleoid protein that alters mitochondrial and plastid properties and plant response to high light. Plant Cell 23, 3428-3441.
Xu, Y.Z., Santamaria Rde, L., Virdi, K.S., Arrieta-Montiel, M.P., Razvi, F., Li, S., Ren, G., Yu, B., Alexander, D., Guo, L., Feng, X., Dweikat, I.M., Clemente, T.E. and Mackenzie, S.A. (2012) The chloroplast triggers developmental reprogramming when mutS HOMOLOG1 is suppressed in plants. Plant Physiol 159, 710-720.
Yamamuro, C., Zhu, J.-K. and Yang, Z. (2016) Epigenetic modifications and plant hormone action. Molecular plant 9, 57-70.
Yang, X., Kundariya, H., Xu, Y.Z., Sandhu, A., Yu, J., Hutton, S.F., Zhang, M. and Mackenzie, S.A. (2015) MutS HOMOLOG1-derived epigenetic breeding potential in tomato. Plant Physiol 168.
Zhang, Z., Xing, A., Staswick, P. and Clemente, T.E. (1999) The use of glufosinate as a selective agent in Agrobacterium-mediated transformation of soybean. Plant Cell, Tissue and Organ Culture 56, 37-46.
.CC-BY-NC-ND 4.0 International licensepeer-reviewed) is the author/funder. It is made available under aThe copyright holder for this preprint (which was not. http://dx.doi.org/10.1101/232819doi: bioRxiv preprint first posted online Dec. 12, 2017;

Figure 1. Characteristic phenotypes of MSH1 suppression in soybean
A) Characteristic MSH1-RNAi phenotypes, dwarfing, wrinkled leaves, alterations of pod
emergence and altered floral morphology showing flower with two stigmas. B) Growth-curve
based on plant height in cm (measured weekly after 3 weeks of sowing) showing MSH1-RNAi
and transgene-null msh1 memory lines with reduced growth rate and higher variability within
lines compared to wild type. C) Similar range in plant height and leaf morphology variation from
T7 MSH1-RNAi (with transgene) and T10 msh1 memory (without transgene) compared to wild
type. D) Gene expression profiling of MSH1-RNAi and msh1 memory lines for suppression of
MSH1 transcript level. Gene expression normalized to soybean actin levels and error bars
represent SEM from three biological replicates.
.CC-BY-NC-ND 4.0 International licensepeer-reviewed) is the author/funder. It is made available under aThe copyright holder for this preprint (which was not. http://dx.doi.org/10.1101/232819doi: bioRxiv preprint first posted online Dec. 12, 2017;

Figure 2. Transcriptome changes in soybean MSH1-RNAi lines and cross species
comparison of MSH1-RNAi gene expression changes
A) Heat map differentiating significant GO terms associated with severe and mild MSH1-RNAi
phenotypes (AgriGO, GO term enrichment tool [p-value < 0.05]). B) Heat map for conserved
and distinct GO terms associated with the MSH1-RNAi lines in soybean, tomato, and T-DNA
insertion mutant in Arabidopsis. (AgriGO, GO enrichment [p-value < 0.05] was performed on
the best Arabidopsis BLAST hit [e-value < e-10] for each soybean and tomato DEG). Heat maps
were generated using custom scripts in R.
.CC-BY-NC-ND 4.0 International licensepeer-reviewed) is the author/funder. It is made available under aThe copyright holder for this preprint (which was not. http://dx.doi.org/10.1101/232819doi: bioRxiv preprint first posted online Dec. 12, 2017;

Figure 3. Increased variation for number of pods per plant in different epi-F2 populations
in the greenhouse
A) Enhanced variation for pods per plant in two epi-F2 populations compared to wild type grown
under greenhouse conditions. B) Variation in F2 performance for number of pods per plant in the
greenhouse for populations derived from a range of msh1 memory phenotypes (eMSH1, iMSH1,
and nMSH1). C) WT x T9 epi-F2 lines P-37 and P34 showing increase in number of pods per
plant and delayed maturity compared to wild type.
.CC-BY-NC-ND 4.0 International licensepeer-reviewed) is the author/funder. It is made available under aThe copyright holder for this preprint (which was not. http://dx.doi.org/10.1101/232819doi: bioRxiv preprint first posted online Dec. 12, 2017;

Figure 4. MSH1-derived enhanced growth in field trials
A) Enhanced growth measured as total seed weight in kg/ha normalized to 13% moisture for
selected epi-F2:4 lines in field experiments (n=2). Asterisks represent statistical significance based
on Welch two-sample t-test (p-value 0.02) B) Mean yield data from pooled locations showing
enhanced yield in P37 F2:5 epi-line compared to wild type (yield data pooled from three replicates
each from four locations). Asterisks denote statistical significance based on t-test (p-value
0.00931) C) Reaction norm plots showing superior yield performance of F2:5 P37 across
environmental index for yield in kg/ha.
.CC-BY-NC-ND 4.0 International licensepeer-reviewed) is the author/funder. It is made available under aThe copyright holder for this preprint (which was not. http://dx.doi.org/10.1101/232819doi: bioRxiv preprint first posted online Dec. 12, 2017;

Figure 5. Reduced epitype-by-environment interaction in epi-lines
A) Test of significant epitype x environment interaction in wild type sub-lines by ANOVA. B)
Reaction norm plots based on environmental index for wild type and three different MSH1 epi-
populations with higher cross-over interaction in wild type.
.CC-BY-NC-ND 4.0 International licensepeer-reviewed) is the author/funder. It is made available under aThe copyright holder for this preprint (which was not. http://dx.doi.org/10.1101/232819doi: bioRxiv preprint first posted online Dec. 12, 2017;

Figure 6. Gene expression changes and associated pathways in msh1-derived epi-lines with
increased yield
A) Venn diagram showing overlap of DEGs in enhanced growth epi-line R-10. B) REVIGO plot
showing non-redundant GO terms associated with DEGs in epi-line R-10, enhanced growth epi-
F2:4 compared to epi-F2:6, which showed yield similar to wild type. GO terms (p-value < 0.05)
obtained from SoyBase were used in REVIGO tool from AgriGO with modified R script for
plotting.
.CC-BY-NC-ND 4.0 International licensepeer-reviewed) is the author/funder. It is made available under aThe copyright holder for this preprint (which was not. http://dx.doi.org/10.1101/232819doi: bioRxiv preprint first posted online Dec. 12, 2017;

Table 1. Summary of phenotypic data analysis for total yield, maturity, plant height, protein concentration, and oil concentration in wild type and
epi-F2:4 lines.
* Different epi-population (F2:4 eMSH1, F2:4 iMSH1, and F2:4 nMSH1) were developed from crossing wild type Thorne with msh1 memory lines varying in phenotypic
severity (Supplemental Figure 1B).
^ Yield was measured as total machine harvestable seed weight normalized to 13% moisture.
# Maturity was measured as days from planting when 95% pods turn brown in color.
$ Plant height was measured as distance from ground to topmost growing tip at R8 stage.
% Seed composition traits (protein and oil concentration) were measured with NIR and normalized to 13% moisture.
Yield^ (kg/ha) Maturity# (DAP) Plant Height
$ (cm) Protein concentration
% (percent) Oil concentration
% (percent)
Population* Mean SD Range Mean SD Range Mean SD Range Mean SD Range Mean SD Range
Wild type (Thorne) 4374.5 361.4 3267-5220 117.83 4.98 108-124 87.7 2.2 81-92 36.7 0.5 35.3-37.9 19.1 0.27 18.5-20.0
F2:4 eMSH1 4336.2 379.2 3049-5143 117.5 6.79 107-127 87.1 2.12 82-91 36.7 0.57 35.0-38.1 19 0.25 18.3-19.7
F2:4 iMSH1 4408.6 373.5 3471-5303 118.64 6.04 107-126 88.5 2.39 83-93 36.9 0.48 35.6-38.3 18.8 0.2 18.2-19.4
F2:4 nMSH1 4390.9 378.5 3377-5447 116.84 4.88 108-124 86.8 2.33 82-93 36.8 0.51 35.3-38.1 18.9 0.24 18.3-19.5
.CC-BY-NC-ND 4.0 International licensepeer-reviewed) is the author/funder. It is made available under aThe copyright holder for this preprint (which was not. http://dx.doi.org/10.1101/232819doi: bioRxiv preprint first posted online Dec. 12, 2017;

Table 2. Enriched GO terms associated with MSH1 derived enhanced growth in R10 and P37 epi-lines.
Type GO_id GO_count Expressed Expected P_adj GO_desc
R-10F4 vs R-10F6* GO:0005986 35 6 0.5 0.0049 sucrose biosynthetic process
GO:0009629 23 5 0.3 0.0083 response to gravity
GO:0009733 1020 31 14.3 0.0408 response to auxin stimulus
P-37F4 vs P-37F6# GO:0009733 1020 26 10.4 0.0127 response to auxin stimulus
GO:0006468 2386 7 24.4 0.038 protein phosphorylation
* Represents DEGs between enhanced growth epi-line R-10 F2:4 (derived from epi-population with msh1 memory line as female parent) compared to R-10 F2:6 line with yield similar to
wild type.
# Represents DEGs between enhanced growth epi-line P-37 F2:4 (derived from epi-population with msh1 memory line as pollen donor) compared to P-37 F2:6 line with yield similar to wild
type.
.CC-BY-NC-ND 4.0 International licensepeer-reviewed) is the author/funder. It is made available under aThe copyright holder for this preprint (which was not. http://dx.doi.org/10.1101/232819doi: bioRxiv preprint first posted online Dec. 12, 2017;

Table 3: Common DEGs in two enhanced growth epi-F2:4 lines, R-10 and P-37 compared to its
respective epi-F2:6.
Auxin biosynthesis related Glyma.03G158700 AT4G14550 IAA14 indole-3-acetic acid inducible 14
Glyma.04G006900 AT5G18060 SAUR-like auxin-responsive protein family
Glyma.06G281800 AT4G38840 SAUR-like auxin-responsive protein family
Glyma.06G282000 AT4G38840 SAUR-like auxin-responsive protein family
Glyma.06G282100 AT4G38840 SAUR-like auxin-responsive protein family
Glyma.06G282600 AT5G18020 SAUR-like auxin-responsive protein family
Glyma.06G282700 AT4G38840 SAUR-like auxin-responsive protein family
Glyma.07G034200 AT3G15540 IAA19 indole-3-acetic acid inducible 19
Glyma.12G141000 AT5G54510 GH3.6 Auxin-responsive GH3 family protein
Glyma.12G226600 AT3G15210 ERF4 ethylene responsive element binding factor 4
Cell cycle/growth related Glyma.01G035600 AT1G70210 CYCD1;1 CYCLIN D1;1
Glyma.03G171400 AT5G59970 Histone superfamily protein
Glyma.04G166700 AT1G26550 FKBP-like peptidyl-prolyl cis-trans isomerase family
Glyma.05G002500 AT3G01640 ATGLCAK glucuronokinase G
Glyma.07G133800 AT5G02220 SMR4 Cyclin dependant kinase inhibitor
Glyma.08G277700 AT5G13420 Aldolase-type TIM barrel family protein
Glyma.08G287500 AT1G70370 PG2 polygalacturonase 2
Glyma.09G073600 AT3G43190 SUS4 sucrose synthase 4
Glyma.09G189700 AT5G53250 AGP22 arabinogalactan protein 22
Glyma.11G011000 AT3G04500 RNA-binding (RRM/RBD/RNP motifs) family protein
Glyma.14G219100 AT1G75750 GASA1 GAST1 protein homolog 1
Glyma.15G093700 AT4G18340 Glycosyl hydrolase superfamily protein
Glyma.15G109800 AT4G04470 PMP22 Peroxisomal membrane 22 kDa (Mpv17/PMP22) family
Glyma.17G140000 AT4G12510 Seed storage 2S albumin superfamily protein
Glyma.18G206000 AT2G38310 PYL4 PYR1-like 4, ABA Signalling
Glyma.19G069200 AT1G07430 HAI2 highly ABA-induced PP2C gene 2
Glyma.19G206300 AT1G03470 Kinase interacting (KIP1-like) family protein
Stress response related Glyma.01G060300 AT1G13740 AFP2 ABI five binding protein 2
Glyma.04G003300 AT2G47140 NAD(P)-binding Rossmann-fold superfamily protein
Glyma.04G003700 AT4G38580 ATFP6 farnesylated protein 6
Glyma.05G149400 AT4G10340 LHCB5 light harvesting complex of photosystem II 5
Glyma.05G153200 AT5G13930 CHS Chalcone and stilbene synthase family protein
Glyma.11G179100 AT1G08440 Aluminium activated malate transporter family protein
Glyma.14G093100 AT3G09390 MT2A metallothionein 2A
Glyma.15G251500 AT1G78380 GST8 glutathione S-transferase TAU 19
Glyma.16G121900 AT2G17730 NIP2 NEP-interacting protein 2
Glyma.16G215800 AT5G54300 Chloroplast membrane protein unknown function
Glyma.17G140700 AT4G16520 ATG8F Ubiquitin-like superfamily protein, plastid autophagy
Glyma.18G111300 AT2G30860 GSTF9 glutathione S-transferase PHI 9
Glyma.20G140400 AT4G05200 CRK25 cysteine-rich RLK (RECEPTOR-like protein kinase) 25
.CC-BY-NC-ND 4.0 International licensepeer-reviewed) is the author/funder. It is made available under aThe copyright holder for this preprint (which was not. http://dx.doi.org/10.1101/232819doi: bioRxiv preprint first posted online Dec. 12, 2017;

Figure S1. Classification of MSH1 memory phenotypes into extreme (eMSH1), intermediate
(iMSH1) and normal phenotype (nMSH1)
A) The msh1 memory lines were classified into categories; nMSH1 for plants without visible
phenotype distinguishing them from wild type, iMSH1 for plants with intermediate phenotype
(leaf, floral alterations and delayed flowering but normal height), eMSH1 for extreme plants
showing dwarfing along with other described phenotypes. B) Schematic representation of
crossing strategy used to develop epi-populations derived from crossing wild type with three
different msh1 memory lines (eMSH1, iMSH1, and nMSH1)
.CC-BY-NC-ND 4.0 International licensepeer-reviewed) is the author/funder. It is made available under aThe copyright holder for this preprint (which was not. http://dx.doi.org/10.1101/232819doi: bioRxiv preprint first posted online Dec. 12, 2017;

Figure S2. Gene expression changes and ReviGO terms associated with soybean severe
MSH1-RNAi lines
A) Venn diagram showing number of DEGs (p-value < 0.05 and |log2(value)| > 1) in severe and
mild MSH1-RNAi lines. B) Table showing number of up and down-regulated genes in severe
and mild MSH1-RNAi lines (p-value < 0.05 and |log2(value)| > 1). C) REVIGO terms associated
with up-regulated and down-regulated genes (D) in severe MSH1-RNAi. GO terms (p-value <
0.05) obtained from SoyBase were used for REVIGO analysis using default parameters in
agriGO. REVIGO summarizes list of GO terms into semantic similarity based scatter plots.
.CC-BY-NC-ND 4.0 International licensepeer-reviewed) is the author/funder. It is made available under aThe copyright holder for this preprint (which was not. http://dx.doi.org/10.1101/232819doi: bioRxiv preprint first posted online Dec. 12, 2017;

Figure S3. Schematic representation of crossing scheme in msh1 derived epigenetic
breeding
Schematic representation showing MSH1-RNAi lines and development of msh1 memory lines
from plants segregating for the transgene. These transgene-null plants (msh1 memory) with or
without phenotype were crossed to wild type in both directions and the F1 self-pollinated to
obtain further filial generations. In the F2 generation, upper 6% selection was performed on the
two populations along with wild type based on number of pods per plant. Another round of
selection for upper 50% was done in F2:3 lines and forwarded to field experiments.
.CC-BY-NC-ND 4.0 International licensepeer-reviewed) is the author/funder. It is made available under aThe copyright holder for this preprint (which was not. http://dx.doi.org/10.1101/232819doi: bioRxiv preprint first posted online Dec. 12, 2017;

Figure S4. Bar graph showing reduction in MSH1-derived enhanced growth in epi F2:6
Bar graph showing yield measured as total seed weight in kg/ha normalized to 13% moisture
from F2:6 lines compared to wild type (data pooled from three replicates each from four
locations).
.CC-BY-NC-ND 4.0 International licensepeer-reviewed) is the author/funder. It is made available under aThe copyright holder for this preprint (which was not. http://dx.doi.org/10.1101/232819doi: bioRxiv preprint first posted online Dec. 12, 2017;
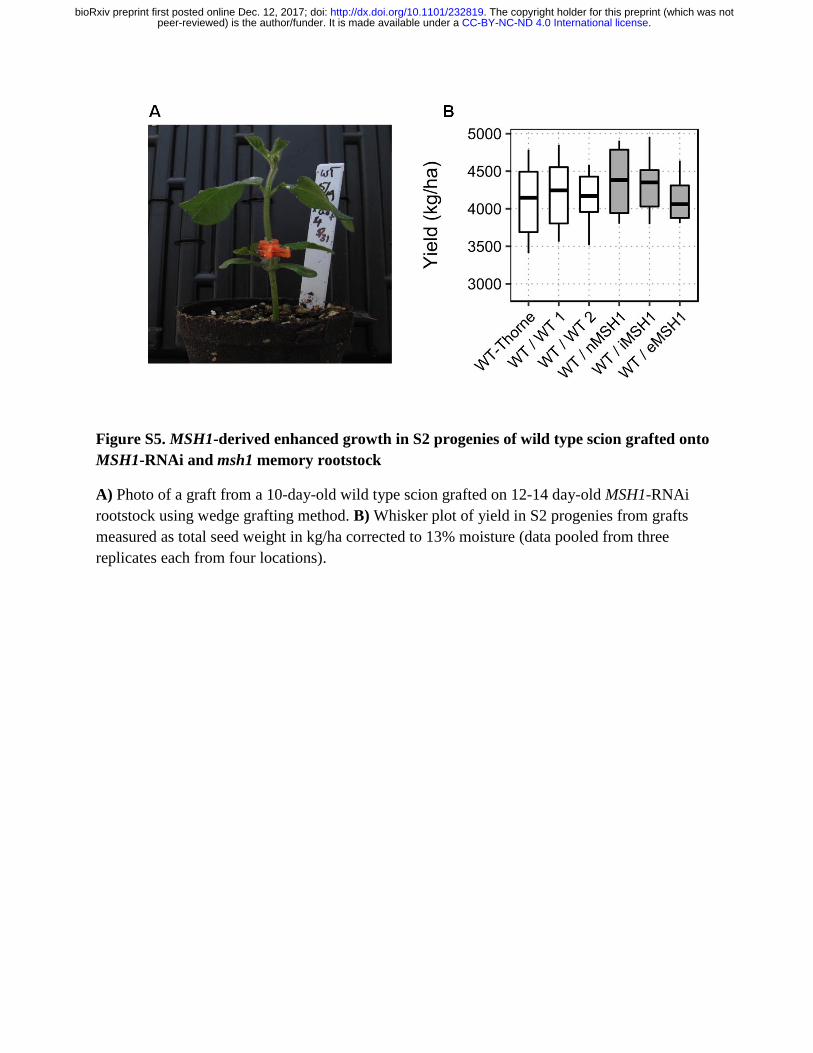
Figure S5. MSH1-derived enhanced growth in S2 progenies of wild type scion grafted onto
MSH1-RNAi and msh1 memory rootstock
A) Photo of a graft from a 10-day-old wild type scion grafted on 12-14 day-old MSH1-RNAi
rootstock using wedge grafting method. B) Whisker plot of yield in S2 progenies from grafts
measured as total seed weight in kg/ha corrected to 13% moisture (data pooled from three
replicates each from four locations).
.CC-BY-NC-ND 4.0 International licensepeer-reviewed) is the author/funder. It is made available under aThe copyright holder for this preprint (which was not. http://dx.doi.org/10.1101/232819doi: bioRxiv preprint first posted online Dec. 12, 2017;
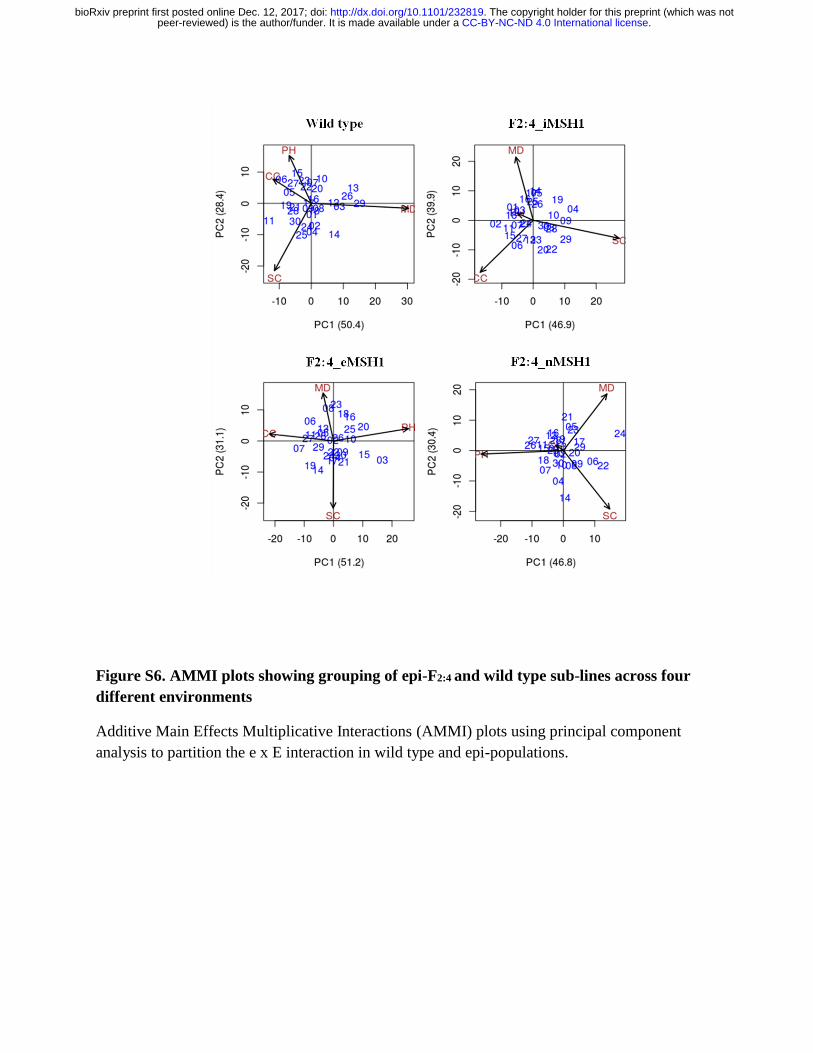
Figure S6. AMMI plots showing grouping of epi-F2:4 and wild type sub-lines across four
different environments
Additive Main Effects Multiplicative Interactions (AMMI) plots using principal component
analysis to partition the e x E interaction in wild type and epi-populations.
.CC-BY-NC-ND 4.0 International licensepeer-reviewed) is the author/funder. It is made available under aThe copyright holder for this preprint (which was not. http://dx.doi.org/10.1101/232819doi: bioRxiv preprint first posted online Dec. 12, 2017;

Figure S7. Genetic distance profiles using SNPs from transcriptome data of wild type and
epi-lines
A) SNP profiles created from RNAseq dataset using the GATK toolkit for wild type and epi-
lines showing no evidence of genetic contamination / unintentional hybridization in the enhanced
growth epi-lines. B) Genetic dissimilarity plot confirming lack of evidence for genetic
contamination in the experimental lines
.CC-BY-NC-ND 4.0 International licensepeer-reviewed) is the author/funder. It is made available under aThe copyright holder for this preprint (which was not. http://dx.doi.org/10.1101/232819doi: bioRxiv preprint first posted online Dec. 12, 2017;

Figure S8. Overlap of genes and associated pathways in two epi-lines R-10 and P-37 with
enhanced growth
A) Venn diagram showing overlapping DEGs between enhanced growth epi-line R-10 F2:4 and
P-37 F2:4 (p-value < 0.05 and |log2(value)| > 0.5). B) REVIGO terms associated with 682 genes
common between R-10 F2:4 and P-37 F2:4. GO terms (p-value < 0.05) obtained from SoyBase
were used for REVIGO analysis using default parameters in agriGO.
.CC-BY-NC-ND 4.0 International licensepeer-reviewed) is the author/funder. It is made available under aThe copyright holder for this preprint (which was not. http://dx.doi.org/10.1101/232819doi: bioRxiv preprint first posted online Dec. 12, 2017;