An Application of Lexicographic Goal Programming to ... · An Application of Lexicographic Goal...
19
Agricultural Systems 41 (1993) 349 367 An Application of Lexicographic Goal Programming to Resolve the Allocation of Water from the Rakaia River (New Zealand) M. J. McGregor" & J. B. Dent h " Rural Resource Management Department, The Scottish Agricultural College, Edinburgh, UK, EH9 3IG h Institute of Ecology and Resource Management, The University of Edinburgh, UK, EH9 3JG ABSTRACT Resource managers are constanth' Jaced with the need to resoh,e cot~ict over .finite resources. Multiple objective programming techniques have beet, identiJied as a means of resoh,ing resource conflict, hut to date vet3' few examples have been reported #t the literature. This paper describes the development of a muhiple objective programming model, using the lexico- graphic goal prograntming technique, to help resoh, e the cot!flict over water abstraction J}'om the Rakaflt River itt Central Canterbut3,, New Zealand. Development of the computer model was aimed at attalysing the consequences oJ" various water abstraction scenarios and develophtg an understanding of the trade-qff]s" that were availabh, between each of the hTterest groups compethtg Jbr the resource. The difficulties of model]big real worm problems are h~hlighted," in par- titular the lack of detailed in/brmation on the ~flbcts of vatting river flows on the htstream users (fish, wihtlffe and recreation) q[" the river. The model was Jound to be effective #l determining how resources shouhl he utilised to meet specified goals and h7 determining the itnpacts and trade- qff;s' that would oeeur as a resuh oJ varying decisions about the resource. INTRODUCTION Competition for finite resources is a major consideration, and often a cause of conflict, in any agricultural development programme. This is true at farm level, where competition occurs between factors of production, or 349 Agricultural Systems 0308-521X/93/$06.00 ~ 1993 Elsevier Science Publishers Ltd, England. Printed in Great Britain
Transcript of An Application of Lexicographic Goal Programming to ... · An Application of Lexicographic Goal...

Agricultural Systems 41 (1993) 349 367
An Application of Lexicographic Goal Programming to Resolve the Allocation of Water from the Rakaia River
(New Zealand)
M. J. M c G r e g o r " & J. B. D e n t h
" Rural Resource Management Department, The Scottish Agricultural College, Edinburgh, UK, EH9 3IG
h Institute of Ecology and Resource Management, The University of Edinburgh, UK, EH9 3JG
A B S T R A C T
Resource managers are constanth' Jaced with the need to resoh,e cot~ict over .finite resources. Multiple objective programming techniques have beet, identiJied as a means of resoh,ing resource conflict, hut to date vet 3' few examples have been reported #t the literature. This paper describes the development of a muhiple objective programming model, using the lexico- graphic goal prograntming technique, to help resoh, e the cot!flict over water abstraction J}'om the Rakaflt River itt Central Canterbut3,, New Zealand. Development of the computer model was aimed at attalysing the consequences oJ" various water abstraction scenarios and develophtg an understanding of the trade-qff]s" that were availabh, between each of the hTterest groups compethtg Jbr the resource.
The difficulties of model]big real worm problems are h~hlighted," in par- titular the lack of detailed in/brmation on the ~flbcts of vatting river flows on the htstream users (fish, wihtlffe and recreation) q[" the river. The model was Jound to be effective #l determining how resources shouhl he utilised to meet specified goals and h7 determining the itnpacts and trade- qff;s' that would oeeur as a resuh oJ varying decisions about the resource.
I N T R O D U C T I O N
Compet i t ion for finite resources is a major considerat ion, and often a cause o f conflict, in any agricultural deve lopment programme. This is true at farm level, where compet i t ion occurs between factors o f product ion, or
349
Agricultural Systems 0308-521X/93/$06.00 ~ 1993 Elsevier Science Publishers Ltd, England. Printed in Great Britain
350 M. J. Mc(ireL, or. J. B. DeHt
at regional and national level where conflict may occur over utilisation of finite resources. Decision making tk)r agricultural development is charac- terised by the need to resolve multiple, conflicting goals and objectives.
The weighting method (Cohon, 1978), compromise programming (Dal- lenbach, e t al . , 1983), the constraint method (Louie, e t al . , 1982) and goal programming (EI-Shishiny, 1988: Rehman & Romero, 1987) have all been used to solve multiple objective problems. These multiple objec- tive programming techniques seek to identify the feasible set containing efficient (non dominated or Pareto optimum) solutions rather than locat- ing a single optimum solution. Each approach produces acceptable solu- tions if the decision maker can meet the input requirements and if the formulation fits the problem at hand.
Goal programming has been found to correspond well with the usual conceptions of the manager's decision making process: those of goal setting and goal ranking (Price, 1976). Large problems can be accommodated and the method can be easily adapted for a wide range of problems. The major drawback is lack of interactive opportunity. The aim of goal pro- gramming is to minimise the weighted deviations of multiple objectives from desired goals. This is achieved by transforming the objective func- tions into constrained equations, setting the equations equal to a desired goal level and allowing for under and over attainment. The form of the problem is an objective function (minimising the devi-ation from desired goals) with constraints which can be solved using the Simplex method.
This paper describes the development of a multiple objective program- ming model, using the lexicographic goal programming (LGP) approach (Bartlett, e t al . , 1978), to resolve the conflict over water abstraction from the Rakaia River in Central Canterbury, New Zealand (see McGregor, 1986). Development of the computer model was aimed not only at analysing the consequences of various water abstraction scenarios, but also at developing an understanding of the trade-offs that were available between each of the interest groups competing for the resource.
BACKGROUND TO THE RAKA1A DEBATE
The Rakaia River catchment is used heavily by a wide and diverse range of groups. These include; river birds, swamp birds, invertebrates, native and introduced fish, anglers, farmers for irrigation, boaters, tourists, elec- tricity authorities for hydro-electric power generation and scientists; all of whom want to carry out a range of activities within the confines of the catchment, or demand the use of its resource base. Each group has a particular set of requirements for the resources of the catchment which

Conflict resolution using lexicographic goal programming 351
have no common unit of measurement. The less tolerant groups have many critical factors, e.g. the feeding and breeding of salmon, while other users have a wide range of tolerance and are therefore able to ac- cept changes e.g. the human users. This had led to substantial conflict over the management and allocation of water from the river.
This conflict has been heightened by proposals to implement a number of new irrigation schemes in the area which would abstract water from the river. Planning for these schemes has come about because the dry- land capability of the soils on the Plains has reached its potential under existing farming practices, and the ability of farms to withstand the eco- nomic effects of drought has diminished. Irrigation is not judged by plan- ners as a drought reducing strategy but as a means of facilitating intensification and diversification of land use.
A total of seven irrigation schemes could, or do, draw water from the Rakaia River. Feasibility studies have shown that the potential area irri- gated, by water abstracted from the river or the underground aquifers that it feeds, could increase from the current 6 284 ha to a total area of 114 410 ha. Collectively and individually these irrigation schemes will ab- stract considerable amounts of water from the river to the detriment of the other user groups. The amount of water required by each scheme varies between seasons and within seasons. This occurs because of the wide range of soil types present in the area.
The catchment area is also used extensively for recreation and has been identified as a wildlife habitat of world importance (O'Donnell, 1983). The impact of water abstraction (for irrigation) on recreational opportunities and wildlife are:
(a) Inadequate water depth for the passage of large salmon or jet boats. (b) Changes in the recreation fishing capacity of the river. (c) Damage to fish and bird feeding and rearing areas. (d) Possible closure of the river mouth. (e) Damage to fishing areas and loss of scenic quality. (f) Reduce braiding and flood flows in the river.
A requirement in the resolution of the conflict over the use of the water from the river is that irrigation use must not overstep the mini- mum requirements of the other river users.
THE RAKAIA RIVER MODEL
A generalised view of the structure of the model is shown in Fig. 1. Details of the full model structure, which includes 420 activities, 500

352 M. J. McGregor, J. B. Dent
o
<
.~o
_o b
~J
u j ~
0 ~ _z
rc
zg o ~ 7
7
-+
,+
2
2,8
7
T
7
2 ~ ~ ~, ~,I ~ i~ i z
• ~ Z ~ Z~_
7
7
©
~b o
©
>. ©
,.A

cot~ict resolution us#tg lexicographic goal programming 353
constraints and 5 categories of goals, can be found in McGregor (1986). The following discussion summarises the main features of the model.
Goals and objectives
Given these conflicts over the Rakaia River water, a trade-off process through which competing uses could be judged was needed. The initial steps in the model development were to identify the competing objectives which would allow an objective function to be specified. The objective function used in the model is to minimise the weighted deviations of the multiple objectives from the desired goal levels (shown in Table 1). The solution generated is not the optimum but that which best satisfies the stated policy levels set for goal attainment. The lexicographic goal pro- gramming algorithm used in this study requires that goal priority levels (shown in Table 2) be assigned to the goals. The algorithm satisfies the highest priority goals first then considers lower priority goals subsequently.
The goals and goal attributes used in the model are shown in Table 1. The irrigation goals used are to maximise national, regional, and farmer income in addition to minimising off- and on-farm capital expenditure. Maximisation of the income goals is achieved by setting the goal levels at
TABLE I Summary of Goals and Goal Attributes
Goal description Type o/ Deviation Goal level equality alhm'ed
Irrigation Goals: National
National income Maximum Under NZ$200m Off-farm capital Minimum Over NZ$ 0
Regional Regional income Maximum Under NZ$200m
Farmer Farmer income Maximum Under NZ$200m On-farm capital Minimum Over NZ$ 0
Instream Users: River flow Minimum Over 65 cumecs Water depth Minimum Over 025 meters
Social: Direct employment Maximum Under 1000 jobs Total employment Maximum Under 1000 jobs

354 M. J. McGregor. J, B. Dent
TABLE 2 Goal Priority Levels and Goal Attainment Levels Used in the Model Runs
Goal Goal priori O" h, vels Jbr r u n
description A B C D
Irrigation Goals: National
National income 1(20) 3(20) 3(20) 1(1) Off-farm capital 1 ( 1 ) 3( 1 ) 3( 1 ) 5( 1 )
Regional Regional income 6( 1 ) 6( 1 ) 4( 1 ) 0(0)
Farmer Farmer income 5(20) 5(20) 1 (20) 3(1 ) On-farm capital 5(1) 5(1) 1(1) 5(1)
Instream Users: River flow 2(1) 1(1) 5(1) 2(1) Water depth 3(1) 2(1) 6(1) 0(0)
Social: Employment 4(1) 4(1) 2(1) 4(1)
Notes: Goal priorities are expressed as the non bracketed digits. Goal values are shown in Table 1. Values in brackets are the relative weighting assigned for goals within the same goal level.
artificially high levels (NZ$200 million) and allowing under achievement of the goal. The initial high level of goal attainment was necessary to maximise the income level, and under achievement allows a lesser value to be accepted. This allows trade-offs to occur with other objectives. In order to reflect the objectives of minimum expenditure for maximum in- come the goal levels for capital expenditure are set at zero, and over achievement of the goal was permitted.
The instream user goals have been set to reflect the needs of recre- ational users and wildlife in the river. The minimum river flow goals was initially set at 65 m3/s (cumecs), for the whole of the irrigation season, with over attainment allowed. This goal level reflects the minimum flow required to maintain a viable river mouth and was varied, in various runs of the model, to reflect aspects such as the recreation fishing capacity of the river. The water depth goal reflects the minimum water depth in the main channel required to allow the passage of large salmon up the river for spawning. The goal of 0.25 m was also seen to be appropriate for other recreation activities in the river.
The only social indicator available was the creation, or loss, o f era-

Cot!flict resolution using lexicographic goal programming 355
ployment as a result of the options under consideration. The values used in the model relate to the additional employment opportunities afforded by irrigation development and salmon farming. The desired social objec- tive is to maximise new employment opportunities. This is reflected in the artificially high level set for the goal and the allowance of under achieve- ment of this goal.
Water supply activities
The reach of the River between the Gorge and the mouth is supplied by two main sources of water. They are:
(1) Flow at the Gorge modified by Lake Coleridge. This water em- anates in the mountains and hill country of the upper catchment. In addition, some water is routed through, and collected by, Lake Coleridge for electricity production before being returned to the main river channel.
(2) Flows from the Highbank Power Station. The Highbank flow orig- inates from the Rangitata River (to the south) and is carried over- land in the Rangitata Diversion Race to the Highbank Power Station. Only water in excess of irrigation demands (in the area served by the Rangitata Diversion Race) is spilled into the Rakaia River system. Consequential Highbank flows are small over the irrigation season and in some months no flow occurs at all.
Each of these water sources has been allocated a separate activity and coefficients are included for monthly flows for the irrigation season: September to April. Three irrigation seasons were modelled. These were chosen in order to reflect:
(a) A typically average river flow through the irrigation season (1962 3).
(b) The year with the lowest recorded irrigation season flow in the river (1970 1). The return period of the flows recorded in this irri- gation season was 1:3 years.
(c) The irrigation season with the lowest recorded rainfall (1963-4).
Details of the coefficients used in the model are shown in Table 3.
Instream use activities
The minimum water depth in the main channel of the river was found to be the only measure that could be adequately used to represent instream user values, fish and wildlife habitat, and recreation activities. The rela-

356 M. J. McGregor, J. B. Dent
TABLE 3 Detached Coefficient Matrix Showing the Water Supply Activities and Related Constraints
Gorge Flow tlighhank F l o w
1970 1 1962 3 1963~4 1970 1 1962 3 1963 4
September 532 176 225 16.79 23.36 23.19 October 189 281 161 0.00 13.50 13.15 November 246 323 229 0.00 6.42 4.71 December 232 205 176 0-00 5.56 6.25 January 148 172 349 0.00 4.63 2.01 February 125 240 173 0.00 3-00 0.00 M arch 101 191 260 0- 79 2.23 0.00 April 93 145 152 9.63 6.99 0.00
tionship between the minimum water depth and water flows at the Rakaia Gorge discharge have been described by Mosley (1982, 1983). These were further modified by Anderson, e t al. (1984) to give the dis- charge to minimum water depth relationship as shown in Fig. 2.
The curvilinear relationship exhibited by the water depth to flow data has been apportioned by linear segmentation into 6 groups: less than 20 cumecs, 21-70 cumecs, 71-100 cumecs, 101-160 cumecs, 161-240 cumecs and greater than 240 cumecs. Each group was further split into 8 sepa-
0.4
0.3
0.2
0.1
Water Depth (m)
/
/ /
,1
/ I
6
I
1 !
i
0 50 100 150 200 250 300 350 400
River Flow (cumecs)
Fig. 2. Water depth-to-flow relationship (after Anderson el al., 1984).

Conflict resolution using lexicographic goal programming 357
rate activities representing the monthly periods over the irrigation sea- son. A series of maximum flow constraints ensure that the non-linearity exhibited by the water depth to flow relationship is maintained.
A successful commercial salmon farming industry has only recently been developed in the Rakaia River Catchment. Any major changes in the river flows would have significant effects on the income and employ- ment opportunities derived from this fledgling industry. The commercial salmon farming industry is important because it results in:
(1) Increased export earnings: these have been assessed by Leathers e t
al. (1983) as providing a primary impact of NZ$5.7 m and a total impact (including secondary effects) of NZ$14.5 m.
(2) Increased employment opportunities: commercial salmon farming activities have the potential of creating 30 jobs directly and a total of 100 jobs when secondary effects are added (Leathers e t al. ,
1983). (3) Enhancement of the recreational fishery; no information was avail-
able on the expected level of this effect and its relationship with flow. It is expected that future research work will be able to pro- vide values which could be introduced to the model.
The income and employment data in (1) and (2) has been allocated on a linear basis assuming a typical river flow of 1791 cumecs (the average annual flow). This assumption may prove to be an over simplification of the problem in the future but at present no quantitative information is available which relates flow levels to these activities. The same assump- tion has also been used to represent the income derived from instream recreational users. Leathers et al. (1983) estimated that the direct value of recreation in the Rakaia Catchment was approximately NZ$5-06m.
Water allocation and transfer activities
The available water supply needs to be allocated between instream and irrigation activities. The allocation rule used in this case study was set at 1:1 which means that for every cumec of water allocated to irrigation (above the minimum flow requirement), one cumec will also be allocated to instream users. This ratio can be varied to explore the effects that dif- ferent allocation rules would have on the two competing interests: in- stream and irrigation. Any water which has been allocated to agricultural use but not used for irrigation is transferred back for instream activities. In practice, this water would not be removed from the river. A minimum flow level of 20 cumecs has been set to represent the flow below which the river would cease to exist in the reach below the State Highway 1 bridge.

358 M. J. McGregor, J. B. Dent
Agricultural activities
Investigations into the feasibility of irrigation development in Central Canterbury have identified seven irrigation schemes which could draw all, or part of their water supply from the Rakaia River. The schemes considered in this model include all those which either currently, or could potentially, draw water from the Rakaia (Table 4). Each scheme has a varying demand for water and within each scheme there are a series of factors that determine total demand. Those factors which have a major effect on water demands are soil type, assumed land use and method of irrigation.
The soils present in the area likely to be affected by irrigation in Cen- tral Canterbury were classified into four classes according to their water holding capacity. Class 1 soils have a water holding capacity of 140 mm whereas Class 4 has 50 mm water holding capacity. Each soil class was then assigned a typical land use such that two soil classes (Classes 1 and 2) were assumed to be cropped and the remaining two were assumed to be in pasture. Class 1 soils were assumed to be 60'7,, crop and 40% pas- ture, Class 2 soils were assumed to be 50% of each. Five crops; wheat, barley, peas, white clover (for seed) and rye-grass (for seed) are assumed to be grown on the crop areas. The crop rotation includes a pasture phase and a greenfeed crop.
Each scheme has separate activities representing the land use and soil
TABLE 4 Summary of the Land Use and Numbers of Activities Representing each Irrigation Scheme
Scheme Crop Pasture Total Land use~Soil elassi/ication g.lrf_'a area area
(ha) ( tl(1 ) (ha) Dryland Irrigated
Proposed: Central Plains 15 377 52 123 67 500 15 15 Barrhill 7 187 5 313 12 500 7 10 Lower Rakaia 13 235 11 765 25 000 4 6 Te Pirita 3 126 3 126 1 1
Existing South Rakaia 1 001 1 001 1 North Rakaia 2 000 2 000 1 Fereday 3 283 3 283 1
Total 38 830 81 930 114 410 27 35
Note: The crop area includes pasture in the rotation.

Con.[tict resolution using lexicographic goal programming 359
classification groupings relevant to that scheme. These are further broken up into dry-land and irrigated-land which is further split into border strip and spray irrigation. A total of 62 soil type classifications are used in the model to account for land use, climatic influences, whether the land is dry-land or irrigated and the type of irrigation used (see Table 4). The adoption of a large number of classification units was necessary to account for the variability of pasture and crop production, the differing efficiency associated with the two irrigation methods and water demand coefficients (see Figs 3(a d)).
The water demand and production coefficients for farming systems on each soil type, in each of the three different seasons, were generated using an irrigation simulation model which was responsive to soil type, land use and climate (Heiler, 1981). The simulation model uses a daily water balance approach to simulate the growth of crops and pasture through each season using the historical climate data for each season. The basis of the approach is that plateau yields, which are less than maximum po- tential yield, are calculated for each crop and pasture activity. These are modified downwards relative to the level of water shortage that is experi- enced by the assumed land use. Dryland yields are calculated using rain- fall data. Details of the crop yield functions used in the model can be found in Heiler (1981 ).
The total dryland and irrigated area for each scheme is reconciled by individual reconciliation rows. Similar reconciliations are also used to total the respective dryland and irrigated areas for each individual irriga- tion scheme. It is assumed that 80% of the gross area is irrigated, the re- mainder is lost to distribution works, head races, roads and other non-irrigated uses.
Costs and benefits
Scheme and on-farm capital costs have been included to reflect the rela- tive costs of development for each of the schemes under consideration. This was necessary because the costs of development varied according to the soil type and land-use assumed. Scheme capital costs varied from NZ$1100-1400 per hectare and on-farm development costs from NZ$1150-2500 per hectare.
Income has been valued at three levels; national, farmer and regional. National income was valued at free on board (f.o.b.) prices using shadow prices provided by the Ministry of Agriculture and Fisheries (MAF, 1986) and farmer income at farm gate. The regional income is derived using the income multipliers discussed below.

360 M. J. McGregor, J. B. Dent
~nnull Plature Production (tonnoe DM/h=) 14
12 ? ? \ ~ Y ' . . ~ _#..,v ~ . . # ~ ' - - ~ ~ -..-"" ~ -~
10 ~ ~ "!~ '~1
1960 1966 197o 1976 196o
Dryland (Class-I) ~% Dryland (Class-4)
" * : Irr igated (Class-I) 7Z Irrigated (Cla88,4)
(a)
Y~eld ilonnea/h~)
7
6 ' , . .- x ~ *.
\
5 ~
4 ' t ' ~ '~ / ~ ! 1 & ~ ~ '
i ' \ f
3
L
L ~
2 [ 1960
I . ~ . . . . i I ] , ] ] ]
1966 1970 1975 1980
Dryland Wheat ~ Dryland Peas
^ ~rrlgated Wheat ~: ~rrigated Peas
(b)
Montllly Water Demand [xi0-4 cumece/haJ 8
Monthly Wlter Demand (x10-4 cumeca/hs,) 1 0 ~
!I, ~ /, i I
i
I' i I
2
S N J M M S
1 9 6 1 - 6 2
~' Bo rde r S t r i p
i ~r I: I / / I
i / !l
61 ̧ /i ':'
,̧ ,:,
~ T
J/ "T r~
i,
i
'l . . . . . g . ¢
J M M S N J M M S N J M M S N J M M S N J M M 1 9 6 3 - 6 4 1 9 7 0 - 7 1 1 9 6 1 - 6 2 1 9 6 3 - 6 4 1 9 7 0 - 7 1
cJ Spray '!~ Soi l C lass 4 ~ Soi l C lass 1
(c) (d)
F i g . 3 . Comparison between: (a) dryland and irrigated pasture production for soils classified 1 and 4: (b) dryland and irrigated arable crop yields for a class 1 soil: (c) monthly water demands for border strip and spray irrigation on class 2 soil: (dl the
monthly water demands for soils with irrigation suitability classifications of 1 and 4.

Conflict resolution using lexicographic goal programming 361
Secondary effects
An important aspect of irrigation development is the secondary effects that are generated. The most significant effects that could be measured in this case are the income and employment generated from commercial salmon farming and agriculture. It is recognised that recreation activities also provide important secondary effects but no research has been done to determine what the magnitude of these effects are. The secondary effects derived from the commercial salmon fishery have been outlined above. Agricultural income and employment multipliers were used to generate regional income, and marginal changes in employment levels respectively. The income multipliers used were 2.7 per NZ$ of capital expenditure and the employment multiplier at 0.00656 per hectare irrigated (Brown, 1983).
RESULTS
The model was solved using a lexicographic weighted goal programming formulation developed at Colorado State University (Bartlett et al., 1978). The output from this package provided a significant amount of in- formation, not all of it useful in the decision making process. The results presented here relate to experimentation with the model into the effects of varying the goal priority and the minimum flow attainment levels.
The effects of varying the goal priority levels
Four runs of the model were carried out using the goal levels shown in Table 1 and priority levels shown in Table 2. The goal priority levels were altered in an effort to reflect the priority that would be assigned by the major resource user interest groups. (The priority levels were set on the basis of an analysis of evidence given in planning hearings which were completed during the course of this study.) Farmers for instance, would want to maximise farmer income while minimising both off- and on-farm capital costs (Run C). On the other hand instream users would want to maximise the river flow and water depth available for instream pursuits (Runs B). Runs A and D emphasise national interests. By varying the priorities and the goal levels it is possible to determine the trade-offs between interest groups.
The results show that the changes in priority levels assigned to each goal has minor effects on the area irrigated (Fig. 4). This is illustrated by:
(1) No change in the area irrigated when the national income goal and the two instream goals are interchanged (Runs A and B).

362
" 2 i !
100
,9 0
( i O
4 ~,
2 ,)
M. J. McGregor, J. B. Dent
H e - b : , r o s , r r i g q : o 0 ':[ ,; ;( ':~;]
P l : r , ,, [Z:l i [ j i', f: l[ r , , ! j
~ 1.,,¢ /~ :~ i ' l f , i l : ! ,+~z ,Jr
Fig. 4. Effect of varying goal priority levels on area irrigated. Runs A and D represent national goals, Run B represents instream goals, and Run C represents farmer goals.
(2)
(3)
When the national income goal was dropped to third priority and instream goals given lowest priority the area irrigated increased slightly (Run C). A larger increase in area irrigated was obtained by reducing the capital goals to the lowest goal level and assigning highest priority to national income (Run D). In this case the total potential area was irrigated. This suggests that assigning high priority to the capital goals was the reason for excluding the areas not irrigated in the other runs.
The effects of varying the minimum flow goal attainment levels
Area irrigated Changes in the min imum flow left in the river for instream activities had the most significant effect on the area irrigated. This result was sensitive to the prevailing seasonal condit ions (Fig. 5). In the average season (1961 2) the area that could be irrigated was constant over all min imum flow levels up to 145 cumecs for the whole season. January and April were found to be the most constraining months. However, in the low flow (1970-71) and low rainfall (1963-4) seasons; at m in imum flows less

Conflict resolution using lexicographic goal programming 363
H e c t a r e s I r r i g a t e d ( , 0 0 0 ) 1 2 0 _ _ _ ~ _ ~ / ~. ~ .~ ....
k ~k "k
\
4 I-i
i
:% i ! ~ i i 1
F5 7 5 A ~, t-)5:, I~ }5 : ' ,-, ' 2 5
M i ' ,r; tJql ~l,3~% ( 9 3 a l 0-:_,rq---zs)
- - A v e r a g e ~ l o w m a r ~ I 9w F o,,,, fea r
+ L o w R a i n f a , i Tear
! :3 ", 14 b
E ,< is t lng I r r i g a t e d
Fig. 5. Effect of varying the minimum goal flow on the total area irrigated.
t han 77.5 cumecs and 105 cumecs respect ively, the a rea i r r igated was
h igher t han tha t in the ave r age season. T h e m i n i m u m flow goals b e c a m e
l imit ing on the a rea i r r igated in b o t h the low flow, and rainfal l , seasons
at 92.5 and 105 cumecs respect ively. F e b r u a r y was the crit ical m o n t h in
b o t h cases.
TABLE 5 Marginal Value Products per Cumec of Minimum Flow
Marginal value product Valid range ( NZ$ million/cumec) (cumecs)
Low Flow Season (1970-1) National income 2.198 79-95 Regional income 2.907 79-95 Farmer income 1.384 79-95
Low Rainfall Season (1963-4) National income 0-926 112-145 Regional income 1.215 112-145 Farmer income 0.579 112-145
364 M. J. McGregor, J. B. Dent
National, regional and farmer hwome The effect on the total gross national, regional and farmer income of varying the minimum flow levels reflected the trends found for the area irrigated. The marginal value products per cumec of minimum flow were calculated for both the low flow and rainfall seasons (Table 5).
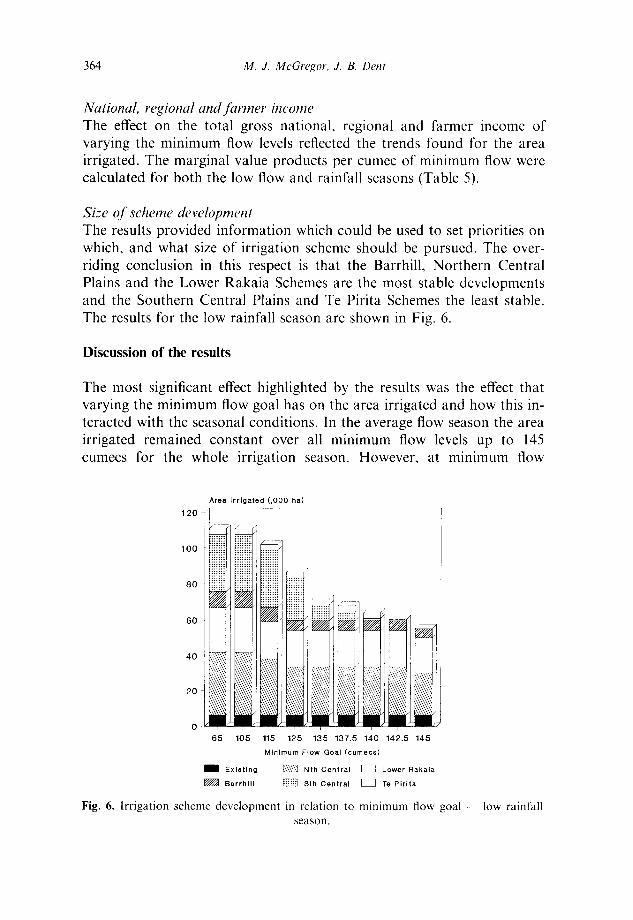
Size of scheme development The results provided information which could be used to set priorities on which, and what size of irrigation scheme should be pursued. The over- riding conclusion in this respect is that the Barrhill, Northern Central Plains and the Lower Rakaia Schemes are the most stable developments and the Southern Central Plains and Te Pirita Schemes the least stable. The results for the low rainfall season are shown in Fig. 6.
Discussion of the results
The most significant effect highlighted by the results was the effect that varying the minimum flow goal has on the area irrigated and how this in- teracted with the seasonal conditions. In the average flow season the area irrigated remained constant over all minimum flow levels up to 145 cumecs for the whole irrigation season. However, at minimum flow
Area Irrigated ( ,000 ha}
120
100
80
60
40
20
0 65 105 115 125 135 137,5 140 142.5 145
Minimum Flow Goal (curnecs)
1 Existing L%~ Nth Central ~ ] Lower Rakaia
Barrhlll ~"-~ Sth Central ~ Te Pirita
Fig. 6. I rr igat ion scheme development in relat ion to min imum flow goal low rainfall season.

Co~!flict resolution using lexicographic goal programming 365
requirements of less than 77.5 cumecs, the area irrigated in the low flow season (1970-1) was higher than that in the average flow season. Clearly any decisions regarding the use of the Rakaia River's water resource must account for the seasonality of demand and supply of water in the catchment, and as such should be flexible.
The major benefit derived from the results is that trade-offs are seen to be available in the decisions on the use of the water resource. These can be presented in such a way that the decision maker could readily explore possible options and also be able to make informed decisions on the effects of different policy options. This can be illustrated by presenting the decision maker with information on the effects of marginal changes in flow (Table 5). Increasing the minimum flow requirement by one cumec in the low rainfall season (1963M), above a minimum flow of 79 cumecs, meant a drop in national income of NZ$0-926 million. In the low flow season the loss in income was NZ$2.198 million/cumec for in- cremental minimum flows above 112 cumecs. The decision is then one of subjectively judging whether the likely gains from this incremental in- crease in minimum flow, within the valid ranges, are worth the conse- quential drop in income.
DISCUSSION
The representation of a real world problem in a goal programming framework presented all the real world problems that normally occur in the planning process. The major problem was the lack of data on the effects of flow restrictions in the instream uses of the river. Too much data was found in other areas, in particular the volume of data available in the agricultural sector. This, however, has only become available as a result of a well structured research and monitoring programme which has been in place for a number of years.
Model development was also characterised by the need to make inter- mediate decisions whilst developing the model. This is highlighted by the assumptions made concerning the flow to water depth relationships, and those about the effect of flow on income from recreation and commercial salmon farming. Other factors that might enhance the models efficacy are the inclusion of discounted cash flow techniques, hydro-electric power generating alternatives and options which would provide supplementary river flows in periods of shortage, e.g. increasing the storage level of Lake Coleridge of damming the Gorge.
A further refinement is the expansion of the modelling framework to include uncertainty. The effects of decision making in an uncertain

366 M. J. McGregor, J. B. Dent
environment could be explored using M O T A D (Dent et al., 1986). River flow, water demand by agriculture, agricultural yield, product prices, capital costs of development and the uncertainty surrounding the value of instream uses for the river would all lend themselves to such an approach.
Despite the problems of developing such a model the modelling ap- proach was found to be effective in determining how resources should be utilised to meet specified goals and in determining the impacts and trade- offs that would occur if certain decisions were made. The effectiveness of the model was shown by:
(1) The output explicitly lists the resources used and the impacts and trade-offs that occur when varying policy decisions are made, e.g. the effect of setting minimum flow levels.
(2) The development of the model allowed the writers to gain valuable insights into the inter-relationships that exist and the nature of the trade-offs that have to take place. This resulted in the development of a much more realistic model.
R E F E R E N C E S
Anderson, A. R., Anderson, P. R., Arulambalam, A. M., Barker, P. S., Bertand, I. I., Blake-Kelly, A. M., Borton, E. K., Chung, C., Irving, P. C., Levine, P. C., Kilby, C. E., Lovegrove, D. J., Lucking, G. W., McIntyre, S. J., Mur- ray, W. M., Peacy, I. P., Rasmussen, N. F., Thorn, K. J. and Thornton, S. J. (1984). Resolving Conflict in Resource Allocation: A Discussion Based on Examb~ation of the Rakaia River Debate. Discussion Paper, Centre for Re- source Management, University of Canterbury.
Bare, B. B. & Mendoza, G. (1988). Multiple objective forest land management planning: An illustration. European J. Op. Res., 34, 44-55.
Bartlett, E. T., Bottons, K. E. & Pope, R. P. (1978). Goal: Multiple Objective Programming. Range Science Series No. 27. Range Science Department, College of Forestry and Natural Resources, Colorado State University.
Brown, W. A. N. (1983). The uptake of irrigation by farmers, the secondary effect on irrigation and the use of water from Lake Heron for irrigation. Rakaia River National Water Conservation Order Application, Volume II. Submission by the Minister of Works and Development, pp. 145-53.
Cohon, J. L. (1978). Multiobjective Programming and Planning. Academic Press, New York.
Dallenbach, H. G., George, J. A. & McNichol, D. (1983). Introduction to Oper- ations Research Techniques (2nd ed.). Allyn and Bacon, Inc., Boston.
Dent, J. B., Harrison, S. R. & Woodford, K. B. (1986). Farm Planning with Lin- ear Programming: Concept and Practice. Butterworths, Sydney.
E1-Shishiny, H. (1988). A goal programming model for planning the develop- ment of newly reclaimed lands. Agric. Systems, 26, 245 61.
Cot~ict resohltion using lexicographic goal programming 367
Heiler, T. D. (1981). Simulation-Based Design of Water Harvesting Schemes for Irrigation. PhD Thesis, Lincoln College, University of Canterbury, New Zealand.
Leathers, K. L., Sharp, B. M. H., Brown, W. A. N., Laing, M. T., Lochhead, L. E., Williams, D., Cree, A. M., Knowles, I. S. & Gough, J. (1983). Water and Choice in Canterbury: Review and Assessment of Research Priorities for Lower Rakaia and Central Plahzs h'rigation Planning. Research Report No. 135. Agricultural Economics Research Unit, Lincoln College, Canterbury.
Louie, P. W. F., Yeh, W. W-G. & Hsu, N. S. (1982). An Approach to Solving a Basin-wide Water Resources Management Planning Problem with Multiple Objectives. California Water Resources Centre, University of California. Contribution No. 184.
McGregor, M. J. (1986). A Multiple Objective Planning Framework for the Analysis of Water and Soil Resource Conflict in New Zealand. PhD Thesis, Lincoln College, University of Canterbury, New Zealand.
MAF (1986). Product Price Assumptions. Technical Paper 2/86. Ministry of Agriculture and Fisheries, Economics Division, Palmerston North.
Mendoza, G. A., Campbell, G. E. & Rolfe, G. E. (1986). Multiple objective pro- gramming: An approach to planning and evaluation of agroforestry systems - - Part 1: Model description and development. Agric. Systems, 22, 243 53.
Mendoza, G. A., Campbell, G. E. & Rolfe, G. E. (1987). Multiple objective pro- gramming: An approach to planning and evaluation of agroforestry systems - - Part 2: An illustrative example and analysis. Agric. Systems, 23, 1-18.
Mosley, M. P. (1982). Critical depths for passage in braided rivers, Canterbury, New Zealand. New Zealand JI. Marine and Freshwater Research, 16, 351-7.
Mosley, M. P. (1983). Prediction of changes in the physical character of braided rivers in response to changing discharge. J. Hydrology (New Zealand). 22, 18 67.
O'Donnell, C. F. J. (1983). Wildlife considerations. Rakaia River National Water Conservation Order Application, Volume II. Submission by the Min- ister of Works and Development, pp. 27-79.
Price, W. L. (1976). An interactive objective function generator for goal pro- grammes. In Multiple Criteria Decision Making - - Lecture Notes in Eco- nomics and Mathematical Systems, eds. S. Zionts & H. Thiriez. Springer Verlag.
Rehman, T. & Romero, C. (1987). Goal programming with penalty functions and livestock ration formulation. Agric. Systems, 23, 117 32.


![[hal-00676294, v1] Dirêjî Kurdî : a lexicographic ...people.scs.carleton.ca/~armyunis/projects/KAPI/resources/A... · basic needs and methods. ... A lexicographic environment for](https://static.fdocuments.net/doc/165x107/5a7fd2b57f8b9a682c8bcea4/hal-00676294-v1-dirj-kurd-a-lexicographic-armyunisprojectskapiresourcesabasic.jpg)