AMU Quarterly Report Page 1 of 21 Applied …science.ksc.nasa.gov/amu/fy07/AMU_Q1_07.pdf ·...
21
1980 N. Atlantic Ave., Suite 230 Coca Beach, FL 32931 (321) 783-9735, (321) 853-8202 (AMU) Applied Meteorology Unit (AMU) Quarterly Report First Quarter FY-07 Contract NAS10-01052 31 January 2007 Executive Summary Distribution: NASA HQ/M/AA/W. Gerstenmaier NASA KSC/AA/W. Parsons NASA KSC/MK/L. Cain NASA KSC/LX/J. Talone NASA KSC/PH/ M. Wetmore NASA KSC/PH-A2/D. Lyons NASA KSC/PH/M. Leinbach NASA KSC/PH/S. Minute NASA KSC/VA/S. Francois NASA KSC/VA-2/C. Dovale NASA KSC/KT/D. Bartine NASA KSC/KT-C/R. Nelson NASA KSC/KT-C-H/J. Madura NASA KSC/KT-C-H/F. Merceret NASA KSC/KT-C-H/J. Ward NASA JSC/MA/W. Hale NASA JSC/MS2/C. Boykin NASA JSC/WS8/F. Brody NASA JSC/WS8/R. Lafosse NASA JSC/WS8/B. Hoeth NASA MSFC/EV13/D. Edwards NASA MSFC/EV13/B. Roberts NASA MSFC/EV13/S. Deaton NASA MSFC/EV13/R. Decker NASA MSFC/MP71/G. Overbey NASA MSFC/SPoRT/W. Lapenta NASA DFRC/RA/E. Teets 45 WS/CC/M. Bedard 45 WS/DO/G. Kubat 45 WS/DOU/M. Gaston 45 WS/DOU/M. McAleenan 45 WS/DOR/K. Nordgren 45 WS/DOR/P. Phan 45 WS/DOR/F. Flinn 45 WS/DOR/ T. McNamara 45 WS/DOR/J. Tumbiolo 45 WS/DOR/K. Winters 45 WS/SY/M. Gauthier 45 WS/SYA/B. Boyd 45 WS/SYR/W. Roeder 45 RMS/CC/M. Wasson 45 RMS/LGP/R. Fore 45 SW/SESL/D. Berlinrut 45 SW/XPR/R. Hillyer 45 OG/CC/D. Thompson CSR 4500/H. Herring CSR 7000/M. Maier SMC/RNP/S. Exum SMC/RNP/T. Knox SMC/RNP/R. Bailey SMC/RNP (PRC)/K. Spencer HQ AFSPC/A3FW/J. Carson HQ AFWA/DN/M. Surmeier HQ AFWA/DNXT/G. Brooks HQ AFWA/XOR/M. Treu HQ USAF/XOW/J. Murphy HQ USAF/A30-WX/M. Zettlemoyer NOAA “W/NP”/L. Uccellini NOAA/OAR/SSMC-I/J. Golden NOAA/NWS/OST12/SSMC2/J. McQueen NOAA Office of Military Affairs/M. Babcock NWS Melbourne/B. Hagemeyer NWS Melbourne/D. Sharp NWS Melbourne/S. Spratt NWS Melbourne/P. Blottman NWS Melbourne/M. Volkmer Continued on Page 2 This report summarizes the Applied Meteorology Unit (AMU) activities for the fourth quarter of Fiscal Year 2006 (October - December 2007). A detailed project schedule is included in the Appendix. Task Objective Lightning Probability Tool: Phase II Goal Update the lightning probability forecast equations used in 45th Weather Squadron (45 WS) operations with new data and create a graphical user interface (GUI) in the Meteorological Interactive Data Display System (MIDDS) that automatically gathers the data needed as input to the equations developed in Phase I of this task. The new data may improve the performance of the equations, and the automated tool will increase forecaster efficiency. Milestones Calculated 10 stability parameters from the Cape Canaveral Air Force Station (CCAFS) sounding (XMR) to be used as candidate predictors in the equation development. Began developing equations with new predictors and data sets. Discussion Preliminary results from the equation development show that the flow regime lightning probability was the second-most important predictor of lightning occurrence in all five warm season months. The most important predictors for each month were one of the XMR stability parameters. Task Peak Wind Tool for General Forecasting Goal Develop a tool to forecast the peak wind speed for the day from the surface to 300 ft on Kennedy Space Center (KSC)/CCAFS during the cool season (October – April). The tool should be able to forecast the timing of the peak wind speed and the background average wind speed, based on observational data available for the 45 WS 0700L weather briefing. Milestones Acquired data from the KSC/CCAFS wind tower network for four cool seasons, October 2002 – April 2006. The database includes 5-minute average and peak wind speed and direction observations from 47 wind towers at altitudes from 12 to 495 ft. Completed a preliminary analysis of tower peak wind speeds on days when the morning radiosonde observation (RAOB) indicated a surface-based temperature inversion. Discussion The tower-peak-wind-speed-of-the-day (TPWSD) exceeded 35 kt on 57 of 466 days (12.2%) with surface-based temperature inversions. A comparison between the TPWSD and the wind speed profile from the morning RAOB showed that the TPWSD exceeded the highest wind speed in the lowest 5000 ft of the morning RAOB on 51 of the 57 days. This result was somewhat unexpected, based on general forecast guidelines. Continued on Page 2
-
Upload
trinhduong -
Category
Documents
-
view
217 -
download
0
Transcript of AMU Quarterly Report Page 1 of 21 Applied …science.ksc.nasa.gov/amu/fy07/AMU_Q1_07.pdf ·...
t Page 1 of AMU Quarterly Repor 21
1980 N. Atlantic Ave., Suite 230 Coca Beach, FL 32931 (321) 783-9735, (321) 853-8202 (AMU) 7
Distribution: NASA HQ/M/AA/W. Gerstenmaier NASA KSC/AA/W. Parsons NASA KSC/MK/L. Cain NASA KSC/LX/J. Talone NASA KSC/PH/ M. Wetmore NASA KSC/PH-A2/D. Lyons NASA KSC/PH/M. Leinbach NASA KSC/PH/S. Minute NASA KSC/VA/S. Francois NASA KSC/VA-2/C. Dovale NASA KSC/KT/D. Bartine NASA KSC/KT-C/R. Nelson NASA KSC/KT-C-H/J. Madura NASA KSC/KT-C-H/F. Merceret NASA KSC/KT-C-H/J. Ward NASA JSC/MA/W. Hale NASA JSC/MS2/C. Boykin NASA JSC/WS8/F. Brody NASA JSC/WS8/R. Lafosse NASA JSC/WS8/B. Hoeth NASA MSFC/EV13/D. Edwards NASA MSFC/EV13/B. Roberts NASA MSFC/EV13/S. Deaton NASA MSFC/EV13/R. Decker NASA MSFC/MP71/G. Overbey NASA MSFC/SPoRT/W. Lapenta NASA DFRC/RA/E. Teets 45 WS/CC/M. Bedard 45 WS/DO/G. Kubat 45 WS/DOU/M. Gaston 45 WS/DOU/M. McAleenan 45 WS/DOR/K. Nordgren 45 WS/DOR/P. Phan 45 WS/DOR/F. Flinn 45 WS/DOR/ T. McNamara 45 WS/DOR/J. Tumbiolo 45 WS/DOR/K. Winters 45 WS/SY/M. Gauthier 45 WS/SYA/B. Boyd 45 WS/SYR/W. Roeder 45 RMS/CC/M. Wasson 45 RMS/LGP/R. Fore 45 SW/SESL/D. Berlinrut 45 SW/XPR/R. Hillyer 45 OG/CC/D. Thompson CSR 4500/H. Herring CSR 7000/M. Maier SMC/RNP/S. Exum SMC/RNP/T. Knox SMC/RNP/R. Bailey SMC/RNP (PRC)/K. Spencer HQ AFSPC/A3FW/J. Carson HQ AFWA/DN/M. Surmeier HQ AFWA/DNXT/G. Brooks HQ AFWA/XOR/M. Treu HQ USAF/XOW/J. Murphy HQ USAF/A30-WX/M. Zettlemoyer NOAA “W/NP”/L. Uccellini NOAA/OAR/SSMC-I/J. Golden NOAA/NWS/OST12/SSMC2/J. McQueen NOAA Office of Military Affairs/M. Babcock NWS Melbourne/B. Hagemeyer NWS Melbourne/D. Sharp NWS Melbourne/S. Spratt NWS Melbourne/P. Blottman NWS Melbourne/M. Volkmer
Continued on Page 2
Applied Meteorology Unit (AMU) Quarterly Report First Quarter FY-07 Contract NAS10-01052 31 January 200
This report summarizes the Applied Meteorology Unit (AMU) activities for the fourth quarter of Fiscal Year2006 (October - December 2007). A detailed project schedule is included in the Appendix.Task Objective Lightning Probability Tool: Phase II Goal Update the lightning probability forecast equations used in 45th Weather
Squadron (45 WS) operations with new data and create a graphical userinterface (GUI) in the Meteorological Interactive Data Display System (MIDDS) that automatically gathers the data needed as input to the equations developed in Phase I of this task. The new data may improve the performance of the equations, and the automated tool will increase forecaster efficiency.
Milestones Calculated 10 stability parameters from the Cape Canaveral Air Force Station (CCAFS) sounding (XMR) to be used as candidate predictors in the equation development. Began developing equations with new predictors and data sets.
Discussion Preliminary results from the equation development show that the flow regime lightning probability was the second-most important predictor of lightning occurrence in all five warm season months. The most important predictors for each month were one of the XMR stability parameters.
Task Peak Wind Tool for General Forecasting Goal Develop a tool to forecast the peak wind speed for the day from the
surface to 300 ft on Kennedy Space Center (KSC)/CCAFS during the cool season (October – April). The tool should be able to forecast the timing of the peak wind speed and the background average wind speed, based on observational data available for the 45 WS 0700L weather briefing.
Milestones Acquired data from the KSC/CCAFS wind tower network for four cool seasons, October 2002 – April 2006. The database includes 5-minute average and peak wind speed and direction observations from 47 wind towers at altitudes from 12 to 495 ft. Completed a preliminary analysis oftower peak wind speeds on days when the morning radiosonde observation (RAOB) indicated a surface-based temperature inversion.
Discussion The tower-peak-wind-speed-of-the-day (TPWSD) exceeded 35 kt on 57 of 466 days (12.2%) with surface-based temperature inversions. A comparison between the TPWSD and the wind speed profile from the morning RAOB showed that the TPWSD exceeded the highest wind speed in the lowest 5000 ft of the morning RAOB on 51 of the 57 days. This result was somewhat unexpected, based on general forecast guidelines.
Continued on Page 2
Executive Summary
AMU Quarterly Report Page 2 of 21
Executive Summary, continued Distribution (continued from Page 1) NWS Southern Region HQ/“W/SR”/ S. Cooper NWS Southern Region HQ/“W/SR3” D. Billingsley NWS/“W/OST1”/B. Saffle NWS/”W/OST12”/D. Melendez NSSL/D. Forsyth 30 WS/DO/J. Kurtz 30 WS/DOR/M. Barnhill 30 WS/DOR/S Storr 30 WS/SY/M. Schmeiser 30 WS/SYR/D Vorhees 30 SW/XPE/R. Ruecker 88 WS/WES/K. Lehneis 88 WS/WES/G. Marx 46 WS//DO/J. Mackey 46 WS/WST/C. Chase 412 OSS/OSWM/P. Harvey UAH/NSSTC/W. Vaughan FAA/K. Shelton-Mur FSU Department of Meteorology/H. Fuelberg ERAU/Applied Aviation Sciences/ C. Herbster ERAU/CAAR/I. Wilson NCAR/J. Wilson NCAR/Y. H. Kuo NOAA/FRB/GSD/J. McGinley NOAA/FRB/GSD/S. Koch Office of the Federal Coordinator for Meteorological Services and Supporting Research/R. Dumont Boeing Houston/S. Gonzalez Aerospace Corp/T. Adang ACTA, Inc./B. Parks ITT/G. Kennedy Timothy Wilfong & Associates./T. Wilfong ENSCO, Inc./E. Lambert ENSCO, Inc./A. Yersavich ENSCO, Inc./S. Masters
Task Stable Low Cloud Phase II: Nocturnal Event Feasibility Study Goal Conduct a study on rapidly-developing low cloud ceiling events at the
Shuttle Landing Facility (SLF) during the nighttime hours in the cool season months and determine if representative meteorological conditions can be identified to assist in forecasting these events. Cloud ceilings are one of the greatest forecast challenges identified by Spaceflight Meteorology Group (SMG) and 45 WS forecasters. The ability to forecast low cloud ceilings at night will improve support to nighttime shuttle launches and landings.
Milestones Analyzed infrared satellite imagery for 86 possible rapidly developing stable low cloud events that occurred in the years 2000 to 2005. Assessed the atmospheric characteristics of the rapidly developing events and the non-events, and completed the final report.
Discussion Of the 86 possible events, only 6 were considered to be stable low cloud events with rapid cloud development. Composite results of the meteorological characteristics of the 6 events and 80 non-events indicated no distinguishable characteristics between them.
Task Situational Lightning Climatologies for Central Florida, Phase II Goal Create the climatological probability of lightning occurrence and mean
number of strikes for each flow regime as in Phase I for the two 12-hour periods 0000–1200 and 1200–2400 UTC, and in 5-, 10-, 20-, and 30-n mi circles surrounding the SLF in 1-, 3-, and 6-hour increments. The 12-hour climatologies will be used by the forecasters at the National Weather Service in Melbourne, FL (NWS MLB) to update their daily lightning threat index map. The SLF climatologies will aid in the aviation forecast requirements at NWS MLB, and provide a tool to SMG that will assist them in making forecasts for Flight Rule violations of lightning occurrence during a shuttle landing.
Milestones Reviewed the documents describing the results from Phase I, and began reviewing the FORTRAN code that will be modified for Phase II.
Discussion The code modification will begin in the next quarter.
Task Anvil Threat Corridor Forecast Tool in AWIPS Goal Migrate the Anvil Threat Corridor Forecast Tool from MIDDS to the
Advanced Weather Interactive Processing System (AWIPS). This tool is used in launch and landing operations to determine the threat from natural or triggered lightning due to flight through anvil cloud. The SMG is depending more on AWIPS for operations and the 45 WS plans to replace MIDDS with AWIPS. The 45 WS and SMG requested that the AMU transition the anvil tool to AWIPS to ensure it will remain available for operations.
Milestones Tested the anvil forecast tool after installing it on the AWIPS systems at the AMU and SMG. Wrote a report that described all bugs and needed improvements discovered during testing.
Discussion The AMU and SMG conducted extensive testing of the tool. It was modified based on that testing, resulting in a much-improved product. Most of the software bugs were related to improper data initialization and incorrect map labels.
Continued on Page 3
t Page 3 of 21AMU Quarterly Repor
Executive Summary, continued
TABLE of
CONTENTS SHORT-TERM FORECAST IMPROVEMENT
Objective Lightning Probability Tool: Phase II........................... 4
Peak Wind Tool for General Forecasting ..................... 5
Stable Low Cloud Phase II: Nocturnal Event Feasibility Study............................... 7
Situational Lightning Climatologies for Central Florida, Phase II.............. 8
INSTRUMENTATION AND MEASUREMENT
Anvil Forecast Tool in AWIPS ............................ 9
Volume Averaged Height Integrated Radar Reflectivity (VAHIRR).... 11
MESOSCALE MODELING
Weather Research and Forecasting (WRF) Model Sensitivity Study............ 13
AMU CHIEF’S TECHNICAL ACTIVITIES...................................... 15
AMU OPERATIONS ..... 15
REFERENCES ............. 16
LIST OF ACRONYMS .. 17
APPENDIX A ................ 18
Task Volume Averaged Height Integrated Radar Reflectivity (VAHIRR)Goal Transition the VAHIRR algorithm into operations using NWS Weather
Surveillance Radar 1988 Doppler (WSR-88D) data. The previous lightning launch commit criteria (LLCC) for anvil clouds to avoid triggered lightning were restrictive and lead to unnecessary launch delays and scrubs. The VAHIRR algorithm was developed as a result of the Airborne Field Mill program as part of a new LLCC for anvil clouds. This algorithm will assist forecasters in providing fewer missed launch opportunities with no loss of safety compared with the previous LLCC.
Milestones Installed and configured all of the necessary software to produce VAHIRR radar products in real-time, using a live radar data feed in the 45 WS, SMG, and AMU. Wrote a VAHIRR installation guide and test plan. Assisted SMG in creating an automated procedure that will send VAHIRR radar products to AWIPS in real-time.
Discussion The test plan describes how the VAHIRR radar product will be tested for accuracy, reliability, and efficiency. The results will help determine whether the product is ready to be used in launch operations. The 45 WS and SMG provided feedback on the test plan and it is in the process of being updated based on that feedback. After the test plan is approved by the AMU, SMG, and 45 WS, the test will be conducted in the AMU.
Task Weather Research and Forecasting (WRF) Model Sensitivity Study
Goal Conduct several WRF sensitivity case studies to determine the best configuration to use operationally at SMG and NWS MLB for predicting warm season convective initiation. Determining the best model configuration will assist forecasters in their short-term thunderstorm forecasting for the general public and evaluating flight rules and launch commit criteria.
Milestones Compiled and archived data for five convective initiation and two non-convective initiation days with different flow regimes over East Central Florida. Completed all Advanced Regional Prediction System (ARPS) Data Analysis System (ADAS)/ Advanced Research WRF (ARW) model runs within the WRF- Environmental Modeling System (EMS) framework. Continued to install and configure the Local Analysis and Prediction System (LAPS) software to initialize the WRF model.
Discussion Five convective initiation and two non-convective initiation days were chosen to run tests on each combination of the WRF initializations. The next step is completing all model runs for the ADAS/ Non-hydrostatic Mesoscale Model (NMM) configuration. Work continues on converting raw satellite data to a form ingestible by LAPS. Conversion of all other data to a form ingestible by LAPS is complete.
AMU Quarterly Report Page 4 of 21
Special Notice to Readers Applied Meteorology Unit (AMU) Quarterly Reports are now available on the Wide World Web (www) at http://science.ksc.nasa.gov/amu/.
The AMU Quarterly Reports are also available in electronic format via email. If you would like to beadded to the email distribution list, please contact Ms. Winifred Lambert (321-853-8130,[email protected]). If your mailing information changes or if you would like to be removedfrom the distribution list, please notify Ms. Lambert or Dr. Francis Merceret (321-867-0818,[email protected]).
Background The AMU has been in operation since September 1991. Tasking is determined annually with reviews atleast semi-annually. The progress being made in each task is discussed in this report with the primaryAMU point of contact reflected on each task.
AMU ACCOMPLISHMENTS DURING THE PAST QUARTER
SHORT-TERM FORECAST IMPROVEMENT Objective Lightning Probability Tool: Phase II (Ms. Lambert)
The 45th Weather Squadron (45 WS) forecasters include a probability of lightning occurrence in their daily morning briefings. This information is used by personnel involved in determining the possibility of violating launch commit criteria (LCC), evaluating flight rules (FR), and planning for daily ground operation activities on Kennedy Space Center (KSC) and Cape Canaveral Air Force Station (CCAFS). The AMU developed a set of logistic regression equations that calculate the probability of lightning occurrence in Phase I of this task (Lambert and Wheeler 2005). These equations outperformed several standard forecast methods used in operations. The graphical user interface (GUI) developed in Phase I allows forecasters to interface with the equations by entering parameter values to output a probability of lightning occurrence. The forecasters must gather data from the morning sounding and other sources, then manually input that data into the GUI. The 45 WS requested that a tool be developed on the Meteorological Interactive Data Display System (MIDDS) that retrieves the required parameter
values automatically for the equations to calculate the probability of lightning for the day. This will reduce the possibility of human error and increase efficiency, allowing forecasters to do other duties. The 45 WS requested that warm season data from the years 2004 and 2005 be added to the Phase I 15-year 1989–2003 data set. They also requested modifications to the data that are input to the equations in the hope of improving their accuracy.
Predictors
Ms. Lambert calculated 10 stability and moisture parameters from the 1000 UTC CCAFS (XMR) soundings that were used as candidate predictors in the equation development. They are
• Total Totals (TT), • Cross Totals (CT), • K-Index (KI), • Lifted Index (LI), • Thompson Index (TI; KI – LI), • Severe Weather ThrEAT (SWEAT) Index, • Showalter Index (SI), • Temperature at 500 mb (T500), • Mean Relative Humidity in the 825–525
mb layer (RH85), and • Precipitable Water up to 500 mb (PW).

AMU Quarterly Report Page 5 of 21These were added to the three predictors described in the last AMU Quarterly Report (FY06 Q4) for a total of 13 candidate predictors:
• Daily climatological lightning frequency, • 1-day persistence, and • Flow regime lightning probability.
Equation Development and Testing
Ms. Lambert also began developing the new logistic regression equations using the procedure described in the Phase I final report (Lambert and Wheeler 2005). The preliminary results show that the flow regime lightning probability was the second-most important predictor of lightning
occurrence in all months. The most important predictor for June, July, and August was TI. For May and September, the most important predictors were KI and RH85, respectively. In the Phase I set of equations, persistence and the daily climatology were important predictors for every month. In the current study, persistence was chosen as a predictor in all months except August, and the daily climatology was only chosen for May, August, and September. More tests will be done to determine the final predictor set for each month.
Contact Ms Lambert at 321-853-8130 or [email protected] for more information.
Peak Wind Tool for General Forecasting (Dr. Short and Ms. Lambert)
The expected peak wind speed for the day is an important element in the daily morning forecast for ground and space launch operations at KSC and CCAFS. The 45 WS must issue forecast advisories for KSC/CCAFS when they expect peak gusts to exceed 35 kt, 50 kt, and 60 kt thresholds at any level from the surface to 300 ft. However, the 45 WS forecasters indicate that peak wind speeds are a challenging parameter to forecast, regardless of their value. They requested that the AMU develop a tool that will help them forecast the daily average and highest peak non-convective wind speed, and the timing of the peak speed, from the surface to 300 ft on KSC/CCAFS for the cool season (October-April). The AMU will use a 4-year database of high resolution soundings and other observational data available by the morning weather briefing at 0700 local time to develop a tool that provides a forecast of the peak wind speed for the day, its timing, and the average wind speed at the time of the peak.
AFWA Meteorological Techniques
The Air Force Weather Agency (AFWA) publication on Meteorological Techniques (AFWA 2005) provides general guidelines on forecasting surface wind speed in Chapter 1, Section III. One method of particular interest for this task involves an analysis of the morning sounding to forecast wind speed later in the day. The guidelines suggest that low-level temperature inversions can shield the surface from higher wind speeds aloft until the inversion breaks due to surface heating. One guideline reads as follows: “If winds increase above the inversion (and the inversion is below 5,000 feet), expect maximum gusts during
maximum heating to be 80 percent of the 5,000 feet wind speed.” This AFWA publication also provides the caveat that this and other guidelines are only general estimates. Actual values may differ widely due to local terrain, and should be determined locally from forecast studies.
Wind Tower Network Data
Dr. Short acquired a 4-year database of 5-minute wind tower data from Mr. Wahner of Computer Sciences Raytheon (CSR). The data are from the cool seasons in the period 1 October 2002 – 10 April 2006 and include average and peak wind speed and direction observations from the 47 towers in the KSC/CCAFS network. The analysis was restricted to the cool season, October – April, and to the 34 towers used by the 45 WS to verify Weather Watches, Weather Advisories, and wind observations from levels at and below 300 ft. The combination of wind tower data and XMR morning radiosonde observations (RAOBs), discussed in the previous AMU Quarterly Report (Q4 FY06), resulted 703 days available for the analysis. This represents 85% of the 829 days in the period.
The wind tower data were quality controlled (QC) using a simplified algorithm, pending the development of an improved AMU wind tower QC process. The simplified QC excluded any wind speed reports where the peak speed was more than 2.5 times greater than the average wind speed. The factor of 2.5 was adopted from the previous AMU QC process.
Initial Analysis of Wind Tower Data
Dr. Short performed an initial analysis of the wind tower data on days for which the high-resolution (100-ft) sounding data showed the existence of a surface-based temperature

AMU Quarterly Report Page 6 of 21inversion. Approximately 65% of the available morning soundings had a surface-based inversion where the temperature at the 100 ft level was higher than the surface temperature. However, on only about 12% of those days did the tower peak-wind-speed-of-the-day (TPWSD) exceed 35 kt.
Figure 1 shows the maximum wind speeds observed in the lowest 5000 ft from the XMR RAOB versus the TPWSD for all days with a surface-based temperature inversion. The TPWSD frequently exceeded the RAOB maximum speed and almost always exceeded 80% of its value. The wind tower data have not yet been screened for convective events. Convective event screening will likely eliminate some of the high peak wind speed events, but convective events in the cool season are rare.
RAOBs with Surface-Based
Temperature Inversion
05
1015202530354045505560
0 5 10 15 20 25 30 35 40 45 50 55 60
RAOB (Highest Wind Speed below 5000 ft; kt)
Tow
er (P
WSD
; kt)
Figure 1. Highest wind speed (kt) in the lowest 5000 ft of the morning RAOB vs. peak wind-speed-of-the-day for cool season profiles with a surface-based inversion. The dashed line represents an 80% rule-of-thumb for estimating the TPSWD from the RAOB.
Figure 2 shows the time of occurrence of the TPWSD for days with a surface-based temperature inversion. The TPWSD usually
occurred in the early afternoon at 1800 UTC (1300 local), just after the time of maximum surface heating. There was also a secondary maximum of occurrence just after 1200 UTC (0700 local) just after sunrise.
Time of Peak Wind Speed
(w Surface-based Inversion)
0
5
10
15
20
25
30
35
40
0 3 6 9 12 15 18 21 24
UTC Hour of Max Wind Speed
Num
ber o
f Day
s
Figure 2. Time of peak wind speed vs. number of occurrences on days with surface-based temperature inversions.
Dr. Short and Ms. Lambert will investigate wind speed data from the morning XMR RAOB and the tower network on KSC/CCAFS to determine characteristics of the near-surface environment that accompany peak wind speed events. They will also incorporate synoptic analyses and surface observations from the Shuttle Landing Facility to screen out convective events and to identify large-scale features and trends in the pressure and wind fields.
Contact Dr. Short at [email protected] or 321-853-8105 for more information.

AMU Quarterly Report Page 7 of 21
Stable Low Cloud Phase II: Nocturnal Event Feasibility Study (Mr. Barrett and Dr. Bauman)
For all shuttle missions, the Spaceflight Meteorology Group (SMG) issues 30 to 90 minute forecasts for low cloud ceilings at the Shuttle Landing Facility (SLF). Cloud ceilings are one of the greatest forecast challenges identified by SMG forecasters, especially rapid ceiling development below 8000 ft in a stable environment. The first phase of this work (Wheeler and Case 2005) analyzed the onset, location, and dissipation times of low clouds in a stable environment during daylight hours for the cool season months of November through March. The AMU determined that the mean inversion height and strength were similar between event and non-event days, while the mean relative humidity was slightly higher on the event days. The main discerning factor between the event and non-event days was the wind profile. On 85% of the event days the winds veered with height through 8000 ft, while the winds veered with height on only 17% of the non-event days. The objective of Phase II is to determine if representative meteorological conditions can be identified that are conducive for the sudden development of low cloud ceilings in the nighttime during the cool season months. If such conditions can be identified, they will be used to support cloud ceiling forecasts for nighttime shuttle launches and landings.
Analysis Results
Mr. Barrett and Dr. Bauman completed their analysis of SLF surface observations and radiosonde data. After they received the additional satellite imagery that Mr. Barrett ordered from the from NOAA Comprehensive Large Array-data Stewardship System (CLASS), Dr. Bauman analyzed infrared satellite imagery for the 86 possible events that they identified. Examination of the satellite imagery was the only way to distinguish between an in-place rapidly developing low ceiling and cloud advection. Mr. Barrett first restored locally archived infrared satellite imagery onto MIDDS, then loaded the CLASS satellite imagery onto MIDDS. All imagery was viewed with MIDDS software and images were saved in JPEG format. After examining loops of the satellite imagery on MIDDS, Dr. Bauman identified only 6 of the possible 86 events as rapid low ceiling formation events. The remaining 80 were clearly advection situations.
It is important to note that it was difficult to analyze nighttime infrared satellite imagery since low clouds tend to be close to the same temperature as the ground. Dr. Bauman found this to be true regardless of the color enhancement used. However, he found it much easier to identify advection cases than in-place rapid low ceiling development cases.
In the first phase of this work (Case and Wheeler 2005), which considered only daytime events, nearly 30% of the 68 possible daytime events were identified as rapid low ceiling development cases. In contrast, only 7% of all nighttime possible low-ceiling events were identified as rapidly-developing events. The other 93% were identified as advection situations. This implies that nighttime rapidly developing low cloud events do not occur very often, and certainly not as often as the daytime events.
Event Characteristics
The meteorological characteristics of the six nighttime events are given in Table 1. The inversion strengths in Table 1 may be under-estimates of the actual magnitudes because the sounding data interpolated to 1000 ft levels were used to obtain the values. In some instances, the inversions may have been less than 1000 ft deep and the interpolated sounding data may have smoothed out the magnitude of the inversions, especially for those based above the surface. Because there were only six events, any statistics generated from the data in Table 1 would not be considered robust or significant.
Dr. Bauman compiled composite values of the meteorological parameters for all 86 possible events to compare and contrast the events and non-events. Table 2 shows a summary of meteorological parameters for the 6 events versus 80 non-events. Unfortunately, there are no significant distinguishable characteristics between the events and non-events. However, the vertical wind profile from the surface to 15,000 ft indicates a veering wind profile 83% of the time for events and 61% of the time for non-events. Such a profile represents a warm advection pattern that favors rising motion, and thus, cloud formation in a moist environment. Therefore, when a clear cloud advection event is not in progress, a forecaster should be aware of the fact that nighttime rapid low cloud development is more likely to occur with winds veering with height.

AMU Quarterly Report Page 8 of 21
Table 1. Summary of the 6 rapid low ceiling development events and their meteorological characteristics. The mean quantity of relative humidity (RH) is given for all levels at and below the inversion, if one existed. The wind direction change with height was determined by examining the sounding data from the surface to 15,000 ft.
Event Date Onset Time (UTC)
Dissipation Time (UTC)
Highest Inversion Height (ft)
Inversion Strength
(ºC)
Mean RH (%)
∆ Wind Direction w/Height
01/29/2002 0200 0400 none - - veering 11/12/2002 1038 1400 5000 1.1 92 backing 11/27/2003 0545 0700 none - - veering 01/08/2004 0215 0600 4000 3.7 84 veering 03/11/2005 1100 1600 4000 2.1 89 veering 11/12/2005 1004 1500 6000 2.7 82 veer → back
Final Report
Dr. Bauman and Mr. Barrett completed the final report for this task. They are awaiting final approval from NASA in order to distribute the report, and expect to do so in January 2007.
Contact Mr. Barrett at 321-853-8205 or [email protected] or Dr. Bauman at 321-853-8202 or [email protected] for more information.
Table 2. The meteorological parameters associated with the 6 event and 80 non-event cases.
Parameter Events Non Events
Frequency of inversions 67% 76% Mean inversion base height of highest inversion 5000 ft 4400 ft Mean inversion strength of highest inversion 2.5ºC 2.1ºC Mean RH below highest inversion 87% 79% Frequency of events with winds veering with height 83% 61% Situational Lightning Climatologies for Central Florida, Phase II (Dr. Bauman)
The threat of lightning is a daily concern during the warm season in Florida. Recent research has revealed distinct spatial and temporal distributions of lightning occurrence that are strongly influenced by large-scale atmospheric flow regimes. In Phase I, Ms. Lambert created gridded lightning density and frequency climatologies based on the flow regime that the forecasters at the National Weather Service in Melbourne, FL (NWS MLB) use to issue daily lightning threat maps for their county warning area (Lambert et al. 2006). Phase II of this work consists of three parts. In the first part, Dr. Short created climatological soundings of wind speed, wind direction, temperature, and dew point at Jacksonville (JAX), Tampa (TBW), Miami (MFL),
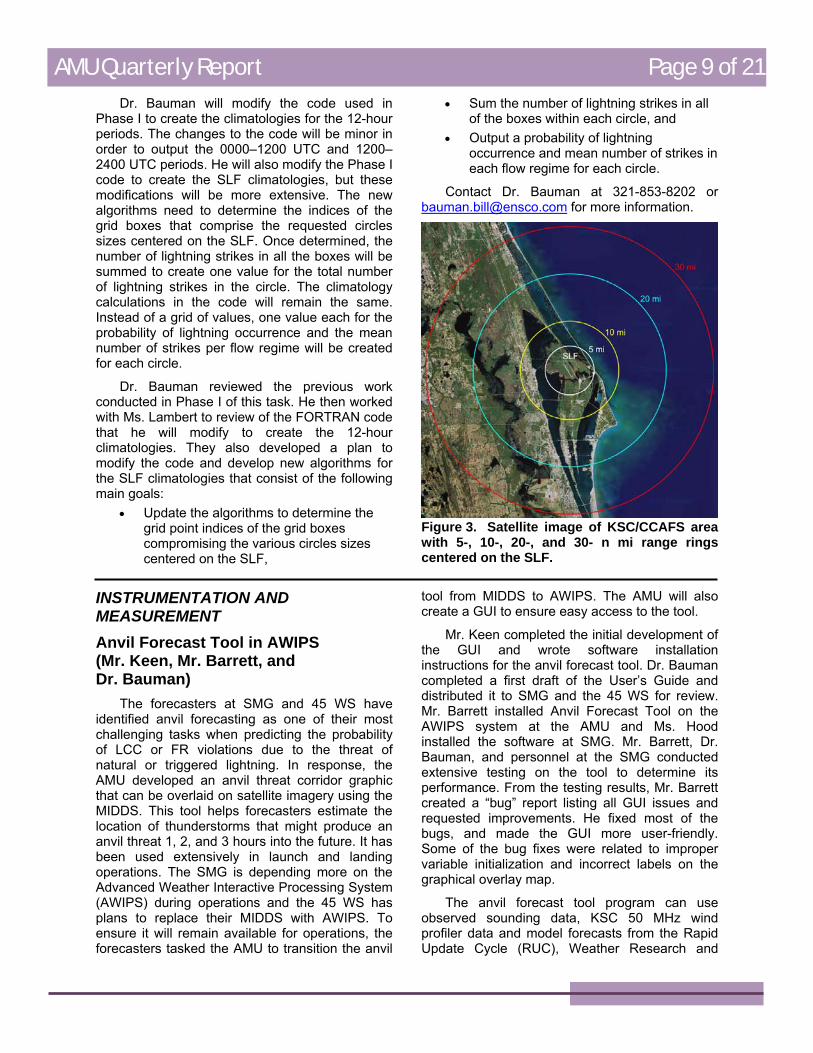
and XMR for each of eight flow regimes from a 16 year database of soundings (Short 2006). In the second part of the Phase II work, Dr. Bauman will calculate the same climatologies as in Phase I for the two 12-hour periods 0000–1200 UTC and 1200–2400 UTC. In the third part of the Phase II work, Dr. Bauman will create the flow regime climatologies for 5-, 10-, 20-, and 30-n mi circles around the SLF as shown in Figure 3 in 1-, 3-, and 6-hour increments. The 5- and 10-n mi circles are consistent with the aviation forecast requirements at NWS MLB. The code from this task will be delivered to them so they can create the climatologies for the other airports at which they have forecast responsibilities. The 20- and 30-n mi circles at the SLF were chosen to create the climatologies that will assist SMG in making forecasts for FR violations of lightning occurrence during a shuttle landing.
AMU Quarterly Report Page 9 of 21Dr. Bauman will modify the code used in
Phase I to create the climatologies for the 12-hour periods. The changes to the code will be minor in order to output the 0000–1200 UTC and 1200–2400 UTC periods. He will also modify the Phase I code to create the SLF climatologies, but these modifications will be more extensive. The new algorithms need to determine the indices of the grid boxes that comprise the requested circles sizes centered on the SLF. Once determined, the number of lightning strikes in all the boxes will be summed to create one value for the total number of lightning strikes in the circle. The climatology calculations in the code will remain the same. Instead of a grid of values, one value each for the probability of lightning occurrence and the mean number of strikes per flow regime will be created for each circle.
Dr. Bauman reviewed the previous work conducted in Phase I of this task. He then worked with Ms. Lambert to review of the FORTRAN code that he will modify to create the 12-hour climatologies. They also developed a plan to modify the code and develop new algorithms for the SLF climatologies that consist of the following main goals:
• Update the algorithms to determine the grid point indices of the grid boxes compromising the various circles sizes centered on the SLF,
• Sum the number of lightning strikeof the boxes within each circle, and Output a probability of lightning
s in all
• occurrence and mean number of strikes in each flow regime for each circle.
Contact Dr. Bauman at 321-853-8202 or [email protected] for more information.
Figure 3. Satellite image of KSC/CCAFS area with 5-, 10-, 20-, and 30- n mi range rings centered on the SLF.
INSTR
ers at SMG and 45 WS have iden
tool from MIDDS to AWIPS. The AMU will also
n inst
ta, KSC 50 MHz wind pro
UMENTATION AND
MEASUREMENT Anvil Forecast Tool in AWIPS (Mr. Keen, Mr. Barrett, and Dr. Bauman)
The forecasttified anvil forecasting as one of their most
challenging tasks when predicting the probability of LCC or FR violations due to the threat of natural or triggered lightning. In response, the AMU developed an anvil threat corridor graphic that can be overlaid on satellite imagery using the MIDDS. This tool helps forecasters estimate the location of thunderstorms that might produce an anvil threat 1, 2, and 3 hours into the future. It has been used extensively in launch and landing operations. The SMG is depending more on the Advanced Weather Interactive Processing System (AWIPS) during operations and the 45 WS has plans to replace their MIDDS with AWIPS. To ensure it will remain available for operations, the forecasters tasked the AMU to transition the anvil
create a GUI to ensure easy access to the tool.
Mr. Keen completed the initial development of the GUI and wrote software installatio
ructions for the anvil forecast tool. Dr. Bauman completed a first draft of the User’s Guide and distributed it to SMG and the 45 WS for review. Mr. Barrett installed Anvil Forecast Tool on the AWIPS system at the AMU and Ms. Hood installed the software at SMG. Mr. Barrett, Dr. Bauman, and personnel at the SMG conducted extensive testing on the tool to determine its performance. From the testing results, Mr. Barrett created a “bug” report listing all GUI issues and requested improvements. He fixed most of the bugs, and made the GUI more user-friendly. Some of the bug fixes were related to improper variable initialization and incorrect labels on the graphical overlay map.
The anvil forecast tool program can use observed sounding da
filer data and model forecasts from the Rapid Update Cycle (RUC), Weather Research and

AMU Quarterly Report Page 10 of 21Forecasting (WRF) and Global Forecast System (GFS) models to calculate the layer-averaged wind velocity. It also contains code that determines the latitude/longitude points to plot the graphical threat sector in AWIPS. The GUI code, layer-averaged wind velocity calculation, and latitude/longitude plotting routine make up the AWIPS Anvil Forecast Tool.
The anvil forecast tool GUI is accessible from the Tools dropdown menu in AWIPS (Figure 4). Wh
MHz). After sel mak
WhStation en these three
a new gra
or baren the tool is selected, the GUI in Figure 5 is
displayed. In the GUI, the user can select from three data source types for the wind velocity calculations:
• Observed sounding data (RAOB), • Model forecasts (Models), or KSC 50-MHz wind profiler data (50•
ecting the data source type, the user thenes three selections: • Date and time (Date-Time), • Site location for the display (Site), and • Location of the data source (Station or
Forecast Hour). en the Date-Time is chosen, The Site and
lists are populated. Whselections have been made, the tool automatically calculates the layer averaged wind velocity as shown in the lower text area in Figure 6.
The user has the option of creating a new map with the Make button, or adding
phic to an existing map with the Append
button. Figure 7 shows the resulting anvil threat graphic for the settings chosen in Figure 6 using the Make button. Figure 8 shows an anvil threat sector for Tampa using the Tampa sounding added to the XMR sector in Figure 7. It is also possible to overlay the RAOB, 50 MHz, and Models maps in one image. Figure 9 shows anvil threat sectors created from model and profiler data overlaid on the threat sector in Figure 7.
Contact Mr. Barrett at [email protected], or Dr. Bauman at 321-
853-8202 or [email protected] for more information on this task.
Figure 4. The Anvil Tool GUI is accessed from the “Tools” dropdown menu on the AWIPS Main Menu.
Figure 5. This is the GUI that is displayed when the Anvil Tool GUI is selected in the AWIPS Tools dropdown menu.
Figure 6. Display of the layer-averaged wind velocity (lower text area) for the XMR RAOB at 1200 UTC on January 19, 2007 in the GUI.

AMU Quarterly Report Page 11 of 21
Figure 7. AWIPS display showing the anvil threat sector based on the XMR sounding, created with the Make button.
Figure 8. AWIPS display showing the anvil threat sector based on the XMR and TBW soundings, created with the Append button.
Figure 9. AWIPS display showing three anvil threat sectors using model, XMR sounding, and 50-MHz profiler data centered on the SLF.
Volume Averaged Height Integrated Radar Reflectivity (VAHIRR) Algorithm (Mr. Keen, Ms. Miller, Mr. Gillen, and Dr. Merceret)
Lightning LCC (LLCC) and FR are used for all launches and landings, whether Government or commercial, using a Government or civilian range (Willett et al. 1999). These rules are designed to avoid natural and triggered lightning strikes to space vehicles, which can endanger the vehicle, payload, and general public. The current LLCC for anvil clouds, meant to avoid triggered lightning, have been shown to be overly restrictive. They ensure safety, but falsely warn of danger and lead to costly launch delays and scrubs. A new LLCC for anvil clouds, and an associated radar algorithm needed to evaluate that new LLCC, were developed using data collected by the Airborne Field Mill research program managed by KSC (Dye et al. 2006). Dr. Harry Koons of Aerospace Corporation conducted a performance analysis of the VAHIRR algorithm from a safety perspective. The results suggested that the LLCC based on this algorithm would assist forecasters in providing a lower rate of missed launch opportunities with no loss of safety compared with the previous LLCC.
Mr. Barrett and Ms. Miller completed the installation and configuration of an Open Radar Product Generator (ORPG) clone machine at the AMU. The ORPG-clone is a RedHat Linux machine that has the Common Operations and Development Environment (CODE) and ORPG software installed. The CODE and ORPG software are used to develop and test new algorithms for the NWS Weather Surveillance Radar 1988 Doppler (WSR-88D). The Unidata Local Data Manager (LDM) program and compiled VAHIRR source code were also installed on the AMU’s ORPG-clone. The ORPG-clone can be used to create the VAHIRR radar product using a live feed of Level II data from the NWS MLB WSR-88D. Mr. Barrett wrote the VAHIRR Installation Guide, which describes how to install all the software associated with the ORPG-clone as well as how to install the VAHIRR software. He also assisted with the installation of ORPG-clones at SMG and 45 WS. With assistance from Mr. Barrett, SMG created an automated procedure to send VAHIRR radar products to AWIPS.

AMU Quarterly Report Page 12 of 21Mr. Barrett, Ms. Miller, Dr. Merceret, and Dr.
Bauman wrote a VAHIRR test plan that describes how the VAHIRR radar product will be tested for accuracy, reliability, and efficiency. The results of the test will help determine whether the VAHIRR radar product is ready to be used in launch operations. The AMU subsequently received feedback on the test plan from SMG and the 45 WS. Mr. Barrett is in the process of updating the test plan based on that feedback. After the test plan is approved by the AMU, SMG, and 45 WS, the test will be carried out using the AMU’s ORPG-clone.
To create VAHIRR radar products in real-time, the user first starts up the LDM program, which begins the feed of radar data into the user’s Linux workstation. Next, the user starts the ORPG program so that radar products can be created with the incoming radar data. A program called read_ldm is executed next, which automatically
feeds the VAHIRR radar algorithm with live radar data. Radar products, including VAHIRR, are then created automatically. To view radar products, the user enters “cvg” at a terminal window to start the CODEview Graphics (CVG) application. On the main page of CVG, the user can view a list of all the VAHIRR products in the database by typing “153” in the entry box labeled “Pcode”, and selecting the Update List and Filter buttons (Figure 10). An individual VAHIRR product (Figure 11) can be viewed by selecting the product from the VAHIRR product list.
For more information on this task, contact Ms. Miller at [email protected] or 321-783-9735 ext. 221; Mr. Gillen at 321-783-9735 ext. 210 or [email protected]; Mr. Barrett at 321-853-8205 or [email protected], or Dr. Merceret at [email protected] or 321-867-0818.
Figure 10. Main page of the CODEview Graphics application. The product list has been filtered to only show the VAHIRR radar products. The left-most column shows the date and time of product creation.
Figure 11. VAHIRR output product centered over East Central Florida. The VAHIRR values in the legend at right have units dBZ-kilofeet.

AMU Quarterly Report Page 13 of 21
MESOSCALE MODELING Weather Research and Forecasting (WRF) Model Sensitivity Study (Dr. Watson)
The WRF model is the next generation community mesoscale model designed to enhance collaboration between the research and operational sectors. The SMG and the NWS MLB are moving forward with implementing the WRF model operationally into their AWIPS systems. The WRF model has two dynamical cores – the Advanced Research WRF (ARW) and the Non-hydrostatic Mesoscale Model (NMM). There are also two options for the initialization of the WRF model – the Local Analysis and Prediction System (LAPS) and the Advanced Regional Prediction System (ARPS) Data Analysis System (ADAS). Having a series of initialization options and WRF cores, as well as many options within each core, provides SMG and NWS MLB with a lot of flexibility as well as challenges. This includes determining which configuration options are best to address specific forecast concerns. The goal of this task to assess the different configurations available and to determine which configuration will best predict warm season convective initiation. To accomplish this, the AMU was tasked to
• Compare the WRF model performance using ADAS versus LAPS for the ARW and NMM model cores,
• Compare the impact of using a high-resolution local forecast grid with 2-way, 1-way, and no nesting, and
• Examine the impact of assimilating soil moisture sensor data on WRF model performance.
ADAS/WRF Model Configuration
Dr. Watson chose five convective initiation days based on the timing of the onset of convection, the flow regime of the day, and availability of data. During the months July-September, twenty days were missing data. Of the days with available data, she examined 34 as potential convective initiation days. Of the 34, she chose 5 as convective initiation days, and 2 as null cases, or non-convective initiation days.
Code fixes for the “hot-start” initialization of the WRF Environmental Modeling System (EMS) were made available to the public in December from the Cooperative Program for Operational Meteorology, Education, and Training (COMET).
Dr. Watson downloaded and installed the upgraded software to the local cluster. Scripts written by Mr. Case were used to initialize the WRF model with output from ADAS. This suite of scripts formed the core for running ADAS to initialize the WRF-EMS. Dr. Watson completed all model runs using ADAS to initialize the WRF-ARW core within the WRF-EMS framework. Each model run created 12 hour forecasts with three runs per day, at 0900, 1200, and 1500 UTC. She used data from the 40-km North American Model (NAM) for the initial and boundary conditions.
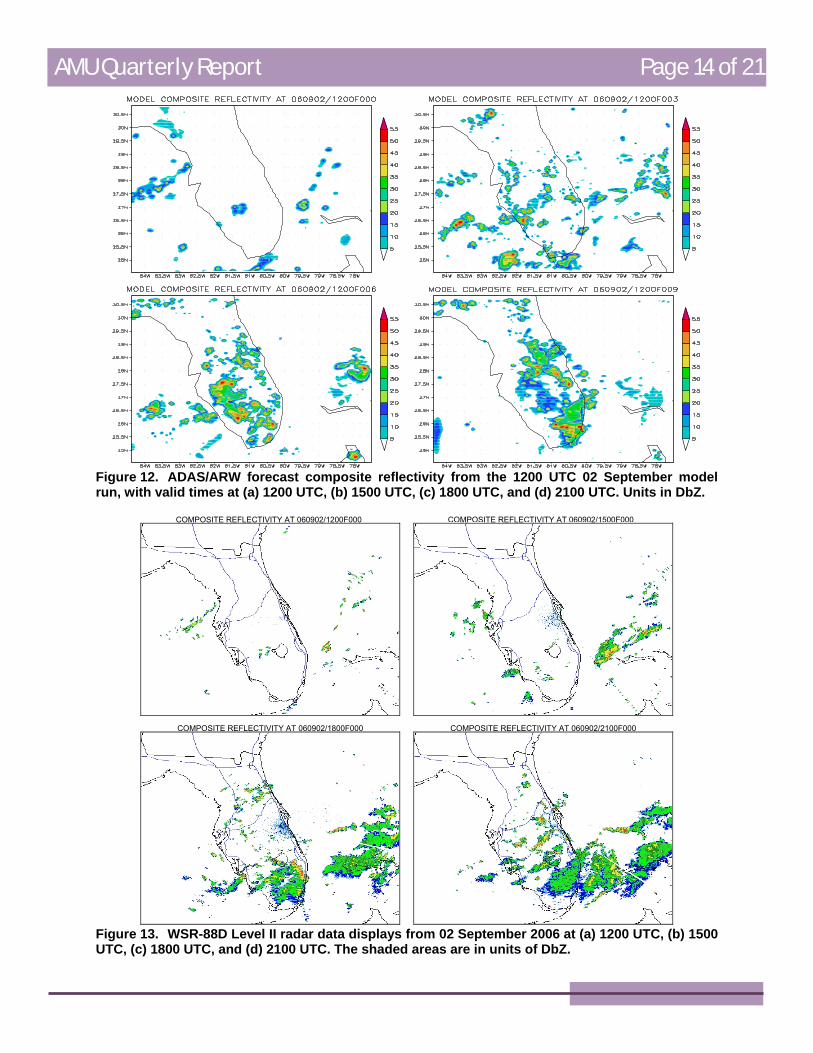
Figure 12 shows the three-hourly composite reflectivity from an ADAS/ARW simulation at 1200 UTC 2 September 2006, and Figure 13 shows the corresponding three-hourly images of WSR-88D Level II radar reflectivity data. A preliminary comparison between the two figures shows that the ADAS/ARW model spins up too much convection during the first three hours of the simulation. In particular, it develops too much precipitation over the central and southern areas of the Florida peninsula and over the Gulf of Mexico. It also fails to capture the area of strong precipitation directly northwest of Grand Bahama Island. By forecast hours 6 to 9, the model does a reasonable job of simulating the convection over the peninsula. Dr. Watson will continue to run the ADAS/WRF configuration of the NMM core for the convective initiation and null case days.
LAPS/WRF Model Configuration
Dr. Watson is continuing the process of setting up and configuring the LAPS software. The largest task in configuring LAPS is working with the ingest code. This ingest code is only supported if the raw data has the same configuration and format as the NOAA Earth System Research Laboratory Global Systems Division’s (GSD) raw data. Dr. Watson configured and tested software she received from GSD to convert raw WSR-88D Level II radar data to Network Common Data Form (NetCDF) format and software to convert model Gridded Binary (GRIB) data to NetCDF format. She also wrote code to convert the available surface data to a form ingestible by LAPS.
Dr. Watson corresponded with personnel from GSD and the University of Wisconsin about the issue of converting raw satellite data to NetCDF format for ingest into LAPS. She is still working to resolve this issue.
For more information, contact Dr. Watson at [email protected] or 321-853-8264.
AMU Quarterly Report Page 14 of 21
Figure 12. ADAS/ARW forecast composite reflectivity from the 1200 UTC 02 September model run, with valid times at (a) 1200 UTC, (b) 1500 UTC, (c) 1800 UTC, and (d) 2100 UTC. Units in DbZ.
COMPOSITE REFLECTIVITY AT 060902/1200F000 COMPOSITE REFLECTIVITY AT 060902/1500F000
COMPOSITE REFLECTIVITY AT 060902/1800F000 COMPOSITE REFLECTIVITY AT 060902/2100F000
Figure 13. WSR-88D Level II radar data displays from 02 September 2006 at (a) 1200 UTC, (b) 1500 UTC, (c) 1800 UTC, and (d) 2100 UTC. The shaded areas are in units of DbZ.
AMU Quarterly Report Page 15 of 21
AMU CHIEF’S TECHNICAL ACTIVITIES (Dr. Merceret) Dr. Merceret and the Airborne Field Mill
(ABFM) science team held a teleconference to develop an action plan for additional analysis of ABFM data that could lead to further LLCC revisions. He began examining ABFM data relating to the behavior of electric fields external to electrified anvil clouds to determine the possibility of safety reducing the stand-off distances in the LLCC. He also made revisions to a manuscript he prepared for the Journal of Applied Meteorology that presents ABFM data relating to the magnitude of the electric field as a function of distance from cloud edge.
Dr. Merceret and ENSCO, Inc. personnel conducted temperature-controlled vacuum
chamber tests of GEMSTONE sensors at the KSC engineering laboratories. This work was done under the GEMSTONE contract, not the AMU contract. GEMSTONE is a NASA-ENSCO collaboration to develop miniaturized disposable solar-powered balloon-sondes that can remain at a constant altitude for days while reporting standard radiosonde variables to the ground via satellite.
Dr. Merceret attended the Weather Radar Replacement Project Kickoff Meeting representing NASA and the KSC Weather Office. He also worked VAHIRR issues related to the AMU VAHIRR task and STS-116 operations.
AMU OPERATIONS Current and former AMU team members were
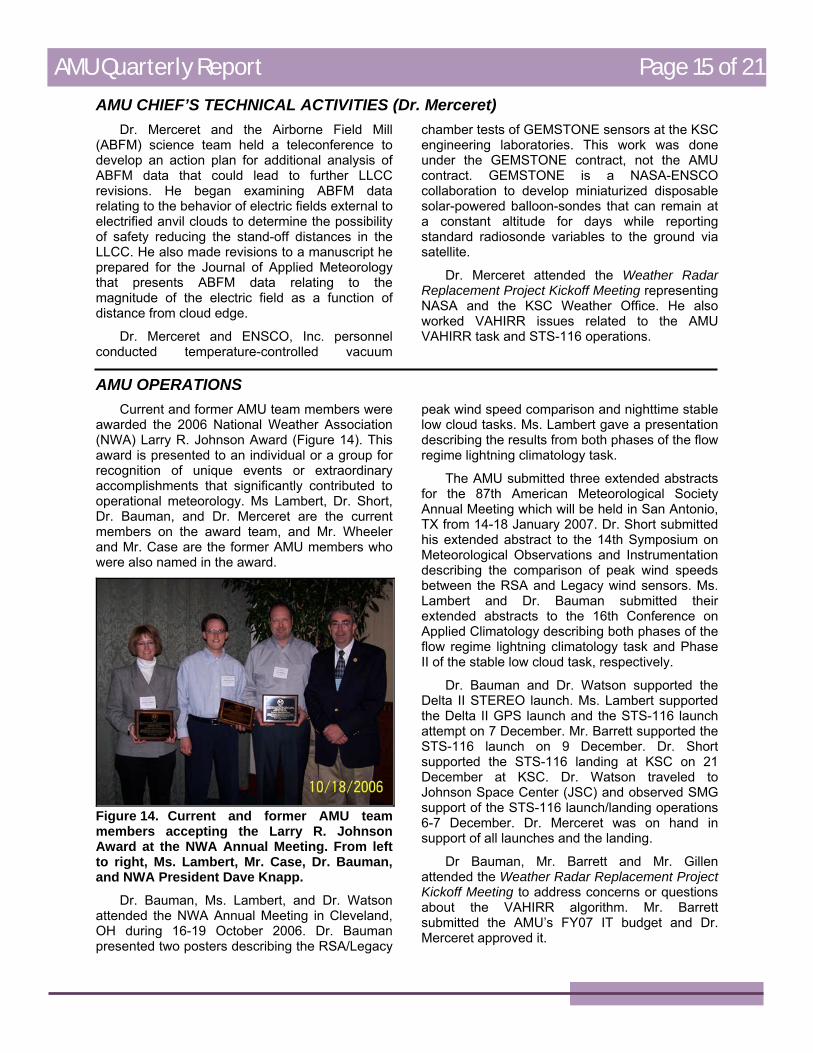
awarded the 2006 National Weather Association (NWA) Larry R. Johnson Award (Figure 14). This award is presented to an individual or a group for recognition of unique events or extraordinary accomplishments that significantly contributed to operational meteorology. Ms Lambert, Dr. Short, Dr. Bauman, and Dr. Merceret are the current members on the award team, and Mr. Wheeler and Mr. Case are the former AMU members who were also named in the award.
Figure 14. Current and former AMU team members accepting the Larry R. Johnson Award at the NWA Annual Meeting. From left to right, Ms. Lambert, Mr. Case, Dr. Bauman, and NWA President Dave Knapp.
Dr. Bauman, Ms. Lambert, and Dr. Watson attended the NWA Annual Meeting in Cleveland, OH during 16-19 October 2006. Dr. Bauman presented two posters describing the RSA/Legacy
peak wind speed comparison and nighttime stable low cloud tasks. Ms. Lambert gave a presentation describing the results from both phases of the flow regime lightning climatology task.
The AMU submitted three extended abstracts for the 87th American Meteorological Society Annual Meeting which will be held in San Antonio, TX from 14-18 January 2007. Dr. Short submitted his extended abstract to the 14th Symposium on Meteorological Observations and Instrumentation describing the comparison of peak wind speeds between the RSA and Legacy wind sensors. Ms. Lambert and Dr. Bauman submitted their extended abstracts to the 16th Conference on Applied Climatology describing both phases of the flow regime lightning climatology task and Phase II of the stable low cloud task, respectively.
Dr. Bauman and Dr. Watson supported the Delta II STEREO launch. Ms. Lambert supported the Delta II GPS launch and the STS-116 launch attempt on 7 December. Mr. Barrett supported the STS-116 launch on 9 December. Dr. Short supported the STS-116 landing at KSC on 21 December at KSC. Dr. Watson traveled to Johnson Space Center (JSC) and observed SMG support of the STS-116 launch/landing operations 6-7 December. Dr. Merceret was on hand in support of all launches and the landing.
Dr Bauman, Mr. Barrett and Mr. Gillen attended the Weather Radar Replacement Project Kickoff Meeting to address concerns or questions about the VAHIRR algorithm. Mr. Barrett submitted the AMU’s FY07 IT budget and Dr. Merceret approved it.

AMU Quarterly Report Page 16 of 21
REFERENCESAFWA, 2005: Meteorological Techniques. AFWA
TN-98/002, Revised 10 January 2005. Air Force Weather Agency/DNT, Offutt Air Force Base, Nebraska 68113.
Dye, J. E., M. G. Bateman, D. M. Mach, C. A. Grainger, H. J. Christian, H. C. Koons, E. P. Krider, F. J. Merceret, and J. C. Willett, 2006: The scientific basis for a radar-based lightning launch commit criterion for anvil clouds. Preprint 8.4, 12th Conf. on Aviation, Range, and Aerospace Meteorology, Atlanta, GA, Amer. Meteor. Soc., 4 pp. [Available online at: http://ams.confex.com/ams/pdfpapers/100563.pdf]
Lambert, W., D. Sharp, S. Spratt, and M. Volkmer, 2006: Using Cloud-to-Ground Lightning Climatologies to Initialize Gridded Lightning Threat Forecasts for East Central Florida. Preprints, Second Conf. on Meteorological Applications of Lightning Data, Paper 1.3, Atlanta, GA, Amer. Meteor. Soc., 4 pp.
Lambert, W. and M. Wheeler, 2005: Objective Lightning Probability Forecasting for Kennedy Space Center and Cape Canaveral Air Force Station. NASA Contractor Report CR-2005-212564, Kennedy Space Center, FL, 54 pp. [Available from ENSCO, Inc., 1980 N. Atlantic Ave., Suite 230, Cocoa Beach, FL 32931 and http://science.ksc.nasa.gov/amu/final.html.]
Short, D., 2006: Situational Lightning Climatologies for Central Florida, Phase II. Applied Meteorology Unit Memorandum, 8 pp. [Available from ENSCO, Inc., 1980 N. Atlantic Ave., Suite 230, Cocoa Beach, FL 32931]
Wheeler, M. and J. Case, 2005: Analysis of Rapidly Developing Low Cloud Ceilings in a Stable Environment. NASA Contractor Report CR-2006-214193, Kennedy Space Center, FL, 29 pp. [Available from ENSCO, Inc., 1980 N. Atlantic Ave., Suite 230, Cocoa Beach, FL 32931 and online at http://science.ksc.nasa.gov/amu/final.html.]
Willett, J. C., H. C. Koons, E. P. Krider, R. L. Walterscheid, and W. D. Rust, 1999: Natural and Triggered Lightning Launch Commit Criteria (LLCC), Aerospace Report A923563, Aerospace Corp., El Segundo, CA, 23 pp.

AMU Quarterly Report Page 17 of 21
List of Acronyms 30 SW 30th Space Wing 30 WS 30th Weather Squadron 45 RMS 45th Range Management Squadron 45 OG 45th Operations Group 45 SW 45th Space Wing 45 SW/SE 45th Space Wing/Range Safety 45 WS 45th Weather Squadron ABFM Airborne Field Mill Experiment ADAS ARPS Data Analysis System AFSPC Air Force Space Command AFWA Air Force Weather Agency AMU Applied Meteorology Unit ARPS Advanced Regional Prediction System ARW Advanced Research WRF AWIPS Advanced Weather Interactive
Processing System CCAFS Cape Canaveral Air Force Station CLASS Comprehensive Large Array-data
Stewardship System CODE Common Operations and Development
Environment CSR Computer Sciences Raytheon EMS Environmental Modeling System FR Flight Rules FSU Florida State University FY Fiscal Year GSD Global Systems Division GUI Graphical User Interface JAX Jacksonville, FL 3-letter identifier JSC Johnson Space Center KI K-Index KSC Kennedy Space Center LAPS Local Analysis and Prediction System LCC Launch Commit Criteria LDM Local Data Manager LLCC Lightning LCC McBASI McIDAS BASIC Language Interpreter McIDAS Man Computer Interactive Data Access
System MFL Miami, FL 3-letter identifier
MIDDS Meteorological Interactive Data Display System
MSFC Marshall Space Flight Center NAM North American Mesoscale model NASA National Aeronautics and Space
Administration NCAR National Center for Atmospheric
Research NetCDF Network Common Data Form NMM Non-hydrostatic Mesoscale Model NOAA National Oceanic and Atmospheric
Administration NSSL National Severe Storms Laboratory NWS National Weather Service NWS MLB NWS in Melbourne, FL ORPG Open Radar Product Generator QC Quality Control RAOB RAdiosonde OBservation RH Relative Humidity RH85 RH in the 825–525 mb layer RSA Range Standardization and Automation SLF Shuttle Landing Facility SMC Space and Missile Center SMG Spaceflight Meteorology Group SPoRT Short-term Prediction Research and
Transition SRH NWS Southern Region Headquarters TBW Tampa, FL 3-letter identifier TI Thompson Index TPWSD Tower Peak Wind Speed of the Day USAF United States Air Force UTC Universal Coordinated Time VAHIRR Volume Averaged Height Integrated
Radar Reflectivity WRF Weather Research and Forecasting
Model WSR-88D Weather Surveillance Radar 1988
Doppler XMR CCAFS 3-letter identifier
AMU Quarterly Report Page 18 of 21
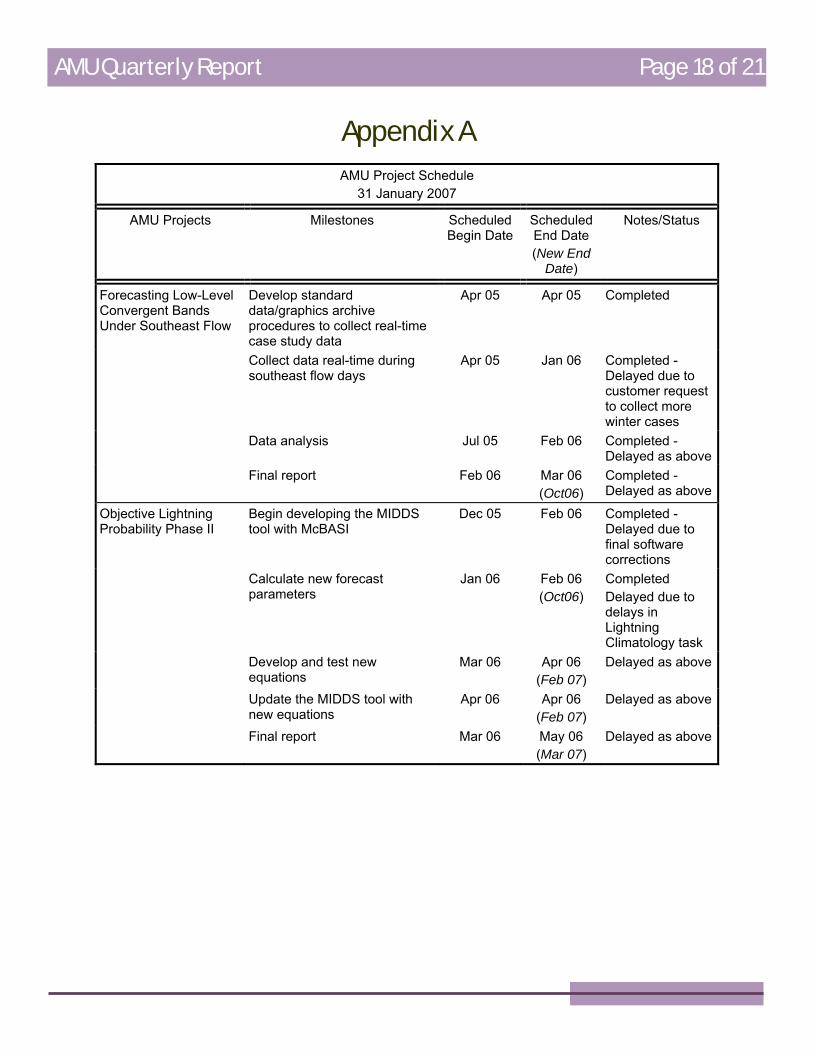
Appendix A AMU Project Schedule
31 January 2007
AMU Projects Milestones Scheduled Begin Date
Scheduled End Date (New End
Date)
Notes/Status
Forecasting Low-Level Convergent Bands Under Southeast Flow
Develop standard data/graphics archive procedures to collect real-time case study data
Apr 05 Apr 05 Completed
Collect data real-time during southeast flow days
Apr 05 Jan 06 Completed - Delayed due to customer request to collect more winter cases
Data analysis Jul 05 Feb 06 Completed -Delayed as above
Final report Feb 06 Mar 06 (Oct06)
Completed -Delayed as above
Objective Lightning Probability Phase II
Begin developing the MIDDS tool with McBASI
Dec 05 Feb 06 Completed - Delayed due to final software corrections
Calculate new forecast parameters
Jan 06 Feb 06 (Oct06)
Completed Delayed due to delays in Lightning Climatology task
Develop and test new equations
Mar 06 Apr 06 (Feb 07)
Delayed as above
Update the MIDDS tool with new equations
Apr 06 Apr 06 (Feb 07)
Delayed as above
Final report Mar 06 May 06 (Mar 07)
Delayed as above

AMU Quarterly Report Page 19 of 21
AMU Project Schedule 31 January 2007
AMU Projects Milestones Scheduled Begin Date
Scheduled End Date (New End
Date)
Notes/Status
Peak Wind Tool for General Forecasting
Data collection: wind towers, XMR 100-ft soundings, 915-MHz profilers
Sep 06 Oct 06 (Jan 07)
Delayed to obtain 915-MHz profiler data
Software development: wind tower data QC, sounding inversion detection, 915 MHz total power display
Sep 06 Dec 06 (Jan 07)
Delayed to modify the AMU wind tower QC software
Data analysis Dec 06 Feb 07 On Schedule Interim evaluation Feb 07 Mar 07 On Schedule Forecast tool development, if
approved Mar 07 May 07 On Schedule
Final report Jun 07 Jul 07 On Schedule Stable Low Cloud Phase II: Nocturnal Events
Data Collection: surface obs, soundings, IR satellite imagery
Apr 06 July 06 (Oct 06)
Completed
Data Analysis May 06 Aug 06 (Oct 06)
Completed
Final report Aug 06 Sep 06 (Jan 07)
Delayed to wait for NASA approval to distribute report
Situational Lightning Climatologies for Central Florida: Phase II
Modify code and develop algorithms needed to create climatologies
Nov 06 Mar 07 On Schedule
Calculate number of lightning strikes in all boxes and output one value for each circle size for each flow regime
Mar 07 May 07 On Schedule
Final memorandum May 07 Jun 07 On Schedule Anvil Forecast Tool in AWIPS
AWIPS training at GSD Jul 05 Nov 05 (Apr 06)
Ongoing as needed
Develop software for calculation and display of anvil threat corridor
Dec 05 Apr 06 (Oct 06)
Completed - Delayed due to delay in training
Test and evaluate performance of the software
Apr 06 May 06 (Jan 07)
Delayed as above
Final memorandum May 06 June 06 (Feb 07)
Delayed as above
AMU Quarterly Report Page 20 of 21
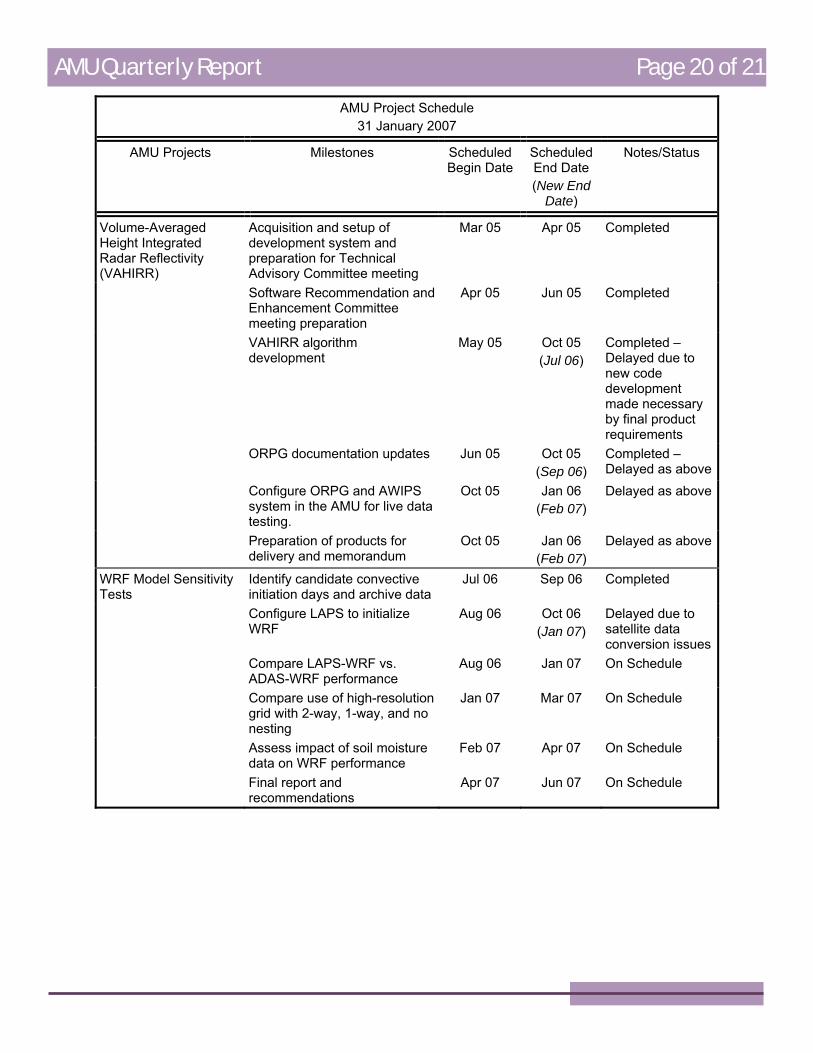
AMU Project Schedule 31 January 2007
AMU Projects Milestones Scheduled Begin Date
Scheduled End Date (New End
Date)
Notes/Status
Volume-Averaged Height Integrated Radar Reflectivity (VAHIRR)
Acquisition and setup of development system and preparation for Technical Advisory Committee meeting
Mar 05 Apr 05 Completed
Software Recommendation and Enhancement Committee meeting preparation
Apr 05 Jun 05 Completed
VAHIRR algorithm development
May 05 Oct 05 (Jul 06)
Completed – Delayed due to new code development made necessary by final product requirements
ORPG documentation updates Jun 05 Oct 05 (Sep 06)
Completed – Delayed as above
Configure ORPG and AWIPS system in the AMU for live data testing.
Oct 05 Jan 06 (Feb 07)
Delayed as above
Preparation of products for delivery and memorandum
Oct 05 Jan 06 (Feb 07)
Delayed as above
WRF Model Sensitivity Tests
Identify candidate convective initiation days and archive data
Jul 06 Sep 06 Completed
Configure LAPS to initialize WRF
Aug 06 Oct 06 (Jan 07)
Delayed due to satellite data conversion issues
Compare LAPS-WRF vs. ADAS-WRF performance
Aug 06 Jan 07 On Schedule
Compare use of high-resolution grid with 2-way, 1-way, and no nesting
Jan 07 Mar 07 On Schedule
Assess impact of soil moisture data on WRF performance
Feb 07 Apr 07 On Schedule
Final report and recommendations
Apr 07 Jun 07 On Schedule

AMU Quarterly Report Page 21 of 21
NOTICE
Mention of a copyrighted, trademarked, or proprietary product, service, or document does not constitute endorsement thereof by the author, ENSCO, Inc., the AMU, the National Aeronautics and Space Administration, or the United States Government. Any such mention is solely for the purpose of fully informing the reader of the resources used to conduct the work reported herein.