Amtrak: America’s Railroad - hsrail.org
15
Amtrak: America’s Railroad Amtrak Government Affairs
Transcript of Amtrak: America’s Railroad - hsrail.org

Amtrak: America’s Railroad
Amtrak Government Affairs

2
The Amtrak System
• Amtrak operates America’s national intercity passenger rail system: – 305 weekday trains – 21,200 route-miles – 46 States, 3 Canadian provinces, and Washington,
DC • FY2014, system ticket revenue record, several
individual services set ridership records • Amtrak recovers 93% of its operating costs • This is a very busy and exciting time • Major challenges:
– Funding – Reauthorization (last reauth in 2008, new one in
works)

3
Types of Amtrak services
• Northeast Corridor – 457 miles – Washington-New York-Boston – 11.6 million riders in FY 2014
• Long Distance services – 15 routes – Up to 2,438 miles – 4.5 million riders in FY 2014
• State-supported trains – 29 routes – 19 partner states – Up to 750 miles – 14.7 million riders in FY 2014
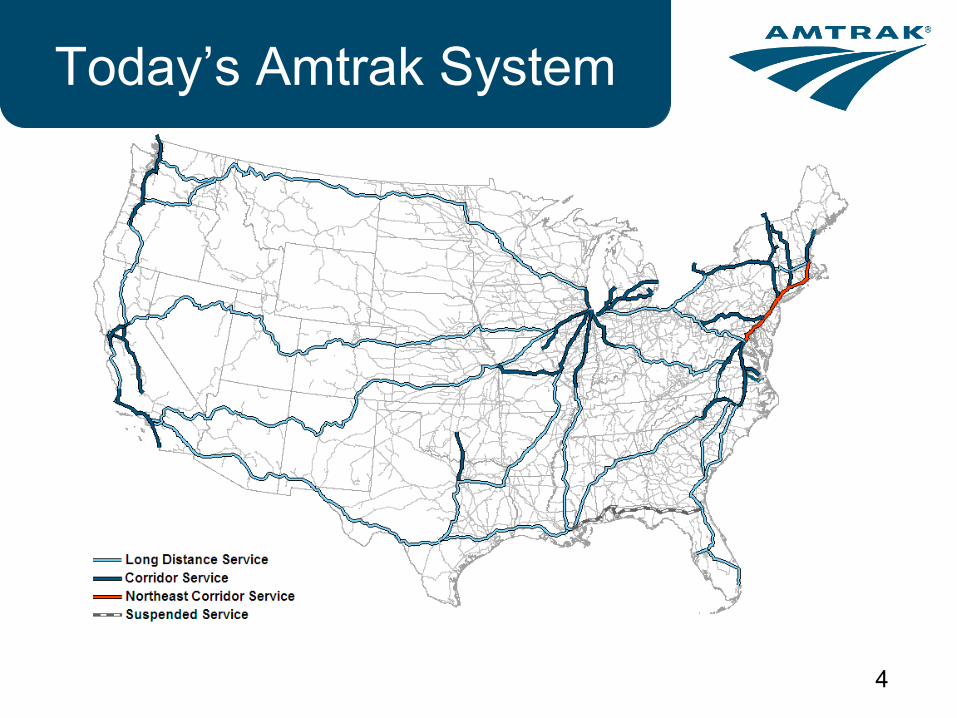
Northeast Corridor
Long Distance
State- supported
4
Today’s Amtrak System
5
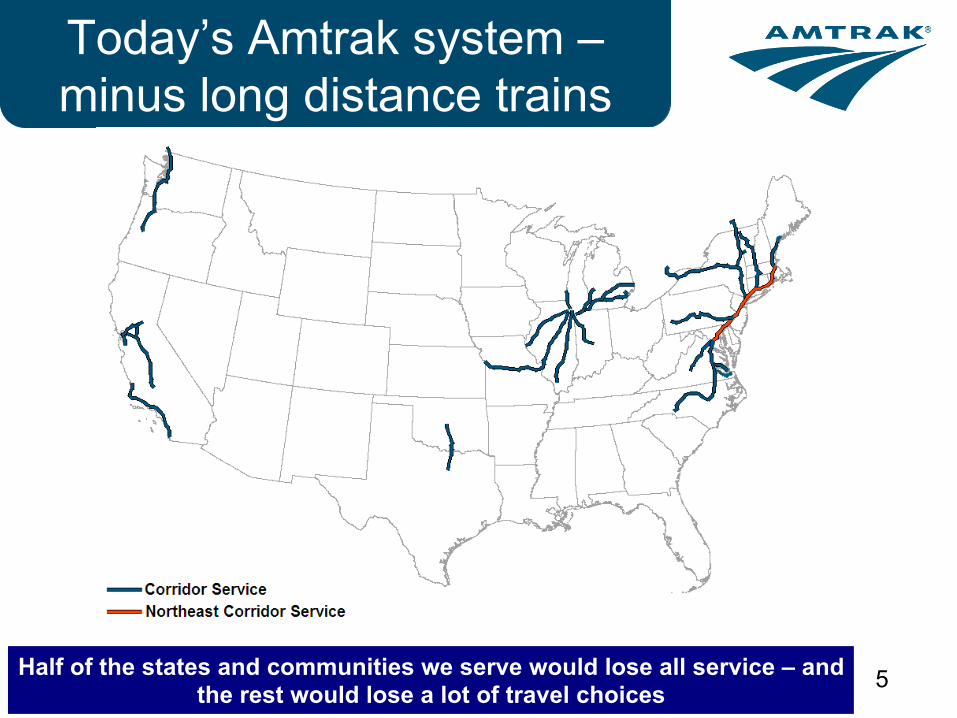
Today’s Amtrak system – minus long distance trains
Half of the states and communities we serve would lose all service – and the rest would lose a lot of travel choices

6
Long distance trains provide a vital public service
• A public service: – 41% of passenger-miles – 15% of ridership, but 23% of
ticket revenues – 42% of identified passengers
with disabilities who use Amtrak – Only Amtrak service at
• Half our stations • Half the states we serve • 70% of our route-miles
• Serve about 40% of America’s rural population
• More than half of adult passengers are age 55 or older
• In many places, only remaining scheduled intercity transportation (bus services served 11% fewer Americans in 2011 than 2005)
Intercity Bus Coverage
State Name
% of rural residents served,
2005
% of rural residents served,
2010
Change (%)
Alabama 92.4% 60.9% -34%
Georgia 92.4% 66.1% -28%
Kansas 71.8% 52.6% -26.7%
Kentucky 70.7% 50.2% -28.9%
Louisiana 91.2% 72.7% -20.3%
Mississippi 93.8% 62.8% -33%
Missouri 80.4% 69.6% -13%
Nevada 85.3% 66.1% -22.5%
New Mexico 84.3% 61.0% -27.6%
North Carolina 95.0% 72.9% -23.3%
North Dakota 50.7% 35.2% -30.1%
Virginia 89.2% 68.0% -23.8%
West Virginia 75.7% 46.2% -38.9%
Source: USDOT

7
Ten annual ridership records in twelve years
15,000,000
17,000,000
19,000,000
21,000,000
23,000,000
25,000,000
27,000,000
29,000,000
31,000,000
33,000,000
Tota
l Rid
ersh
ip
Fiscal Year
Amtrak Total Ridership, 1972-2014

8
Ridership and Revenues are up
• FY 2014 system ridership totaled 30.9M
• Record ticket revenues of more than $2.1B
• Northeast Corridor had a record year
49% growth since 1998
Almost 12% growth since 1998 89.8% growth since1998

9
NEC Air-Rail Market Shares
37%45%
56%
50%50%
51%55%
56%63%
61%69%
75%76%
76%78%
0%10%20%30%40%50%60%70%80%90%100%
Air-
Rail
Mar
ket S
hare
Fiscal Year
Washington to New York Air-Rail Market
Air
Rail
20%27%
41%
35%
39%
38%36%
41%49%
50%53%
54%54%
54%59%
0%10%20%30%40%50%60%70%80%90%100%
Air-
Rail
Mar
ket S
hare
Fiscal Year
New York to Boston Air-Rail Market
Air
Rail

10
Federal subsidies are down
In real terms, value of 2014 operating grant was less than half of 2004
$300.00
$400.00
$500.00
$600.00
$700.00
$800.00
$900.00
$1,000.00
Mill
ions
of 2
014
dolla
rs
Fiscal Year
Amtrak Operating Funding Level, 2004-Present

11
$1,000
$1,500
$2,000
$2,500
$3,000
$3,500
$4,000
$4,500
In m
illio
ns o
f dol
lars
Year
Debt is down Amtrak Corporate Debt
Total indebtedness is less than half of the 2002 level
12
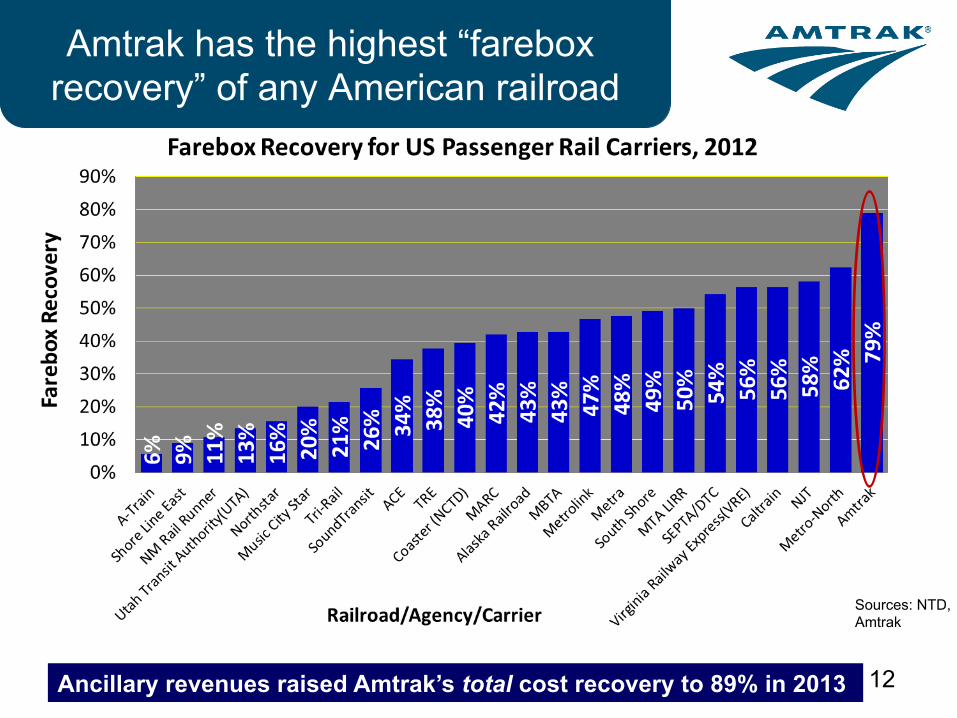
Amtrak has the highest “farebox recovery” of any American railroad
Sources: NTD, Amtrak
Ancillary revenues raised Amtrak’s total cost recovery to 89% in 2013

13
Problems with OTP are a serious challenge
0.0%
10.0%
20.0%
30.0%
40.0%
50.0%
60.0%
70.0%
80.0%
90.0%
Long Distance Train Av
erage OTP
Month
Long Distance On-‐Time Performance by month, FY12-‐14
FY 2012
FY 2013
FY 2014
FY 2015
14
Court case and OTP issue
• SCOTUS ruled against the AAR 9-0 that Amtrak is government entity
• Returned the issue of the rule to lower court for further review of the rulemaking process
• Amtrak has established Blue Ribbon to review Chicago Gateway congestion issues and recommend a course of action
15
HR 5449 Passenger Rail Reauthorization Bill
• Recognizes need to support the national system
• Bipartisan effort • Senate has yet to take action, but will • Investment levels are not sufficient to fund
the full range of identified needs