Amsterdam’s Green Infrastructure - rivm.nl · Natuur in de stad, zoals parken, grachten en groene...
82
Amsterdam’s Green Infrastructure Valuing Nature’s Contributions to People RIVM Letter report 2019-0021 M. Paulin │ R. Remme │ T. de Nijs
Transcript of Amsterdam’s Green Infrastructure - rivm.nl · Natuur in de stad, zoals parken, grachten en groene...

Amsterdam’s Green Infrastructure Valuing Nature’s Contributions to People
RIVM Letter report 2019-0021 M. Paulin │ R. Remme │ T. de Nijs


Amsterdam’s Green Infrastructure Valuing Nature’s Contributions to People
RIVM Letter Report 2019-0021 M. Paulin │ R. Remme │ T. de Nijs

RIVM Letter report 2019-0021
Page 2 of 79
Colophon
© RIVM 2019 Parts of this publication may be reproduced, provided acknowledgement is given to the: National Institute for Public Health and the Environment, and the title and year of publication are cited.
DOI 10.21945/RIVM-2019-0021
M. Paulin (author), RIVM R. Remme (author), Stanford University T. de Nijs (author), RIVM
Contact: Ton de Nijs Centre for Sustainability, Environment and Health (DMG) [email protected]
This investigation was performed by order of the City of Amsterdam in the project “The Value of Amsterdam’s Green” and the Ministry of Agriculture, Nature and Food Policy (LNV) in the project “Doorontwikkeling TEEB-Stad” (M360013).
This is a publication of: National Institute for Public Health and the Environment P.O. Box 1 | 3720 BA Bilthoven The Netherlands www.rivm.nl/en

RIVM Letter report 2019-0021
Page 3 of 79
Synopsis
Amsterdam’s Green Infrastructure Valuing Nature’s Contributions to People The Municipality of Amsterdam developed a strategy to enable its growing population to better enjoy the benefits provided by nature, while endowing it with a more attractive living environment. The strategies in the Quality Impulse Green (KwaliteitsImpuls Groen) were translated into four scenarios that describe how the city’s green infrastructure will be expanded and improved. For every scenario, RIVM quantified and mapped the benefits that ‘green and blue’ generate for human health and well-being, as well as for mitigating the impacts of climate change, for instance by storing rainwater and excess heat. While the values quantified vary per scenario, the benefits are considerable, between 1 and 5 €/m2 additional green per year. Benefits were found to be most prominent in densely populated areas with relatively low amounts of green space. Urban green, such as parks, canals, and green roofs, can lead to benefits that improve the quality of the living environment. While some of the benefits are not difficult to envision, such as the use of parks as recreation sites, green also contributes to complex processes, such as enhanced air quality, cooling temperatures in cities, more biodiversity, and the storage of water in the soil, which leads to reduced pressure on sewer systems. Scenarios contain different aspects from the green infrastructure strategy. The scenario ‘Green Neighbourhoods’ entails an increase in the amount of green within the city centre, for instance, by increasing the amount of green roofs and trees. In the ‘Green Networks’ scenario, the tree structure is strengthened and the connections between Amsterdam’s network of recreational areas is improved. In the scenario ‘Urban Parks’, the size and quality of existing parks is enhanced, and new parks are created. Finally, in the scenario ‘Metropolitan Parks’, metropolitan areas in the outskirts of the city are optimized for recreational use by expanding the cycling and walking network, making such areas more accessible. In order to quantify the value generated by green and blue, the Natural Capital Model, developed by RIVM, Wageningen Environmental Research (WEnR), and the Netherlands Environmental Assessment Agency (PBL), was implemented. Keywords: urban ecosystem services, green infrastructure, Natural Capital Model, social cost benefit analysis, SCBA, indicator

RIVM Letter report 2019-0021
Page 4 of 79

RIVM Letter report 2019-0021
Page 5 of 79
Publiekssamenvatting
Amsterdam’s Groen Waardering van de bijdrage van de natuur aan de mens De gemeente Amsterdam heeft een strategie ontworpen om de waarde van natuur en water in de stad beter te benutten en zo het groeiende aantal inwoners een aantrekkelijke leefomgeving te bieden. In deze KwaliteitsImpuls Groen zijn vier scenario’s opgesteld om de groene infrastructuur van Amsterdam uit te breiden en te verbeteren.
Het RIVM heeft per scenario in kaart gebracht wat investeringen in ‘groen en blauw’ opleveren voor de gezondheid en het welzijn van de stedelingen en om de gevolgen van klimaatverandering, zoals wateroverlast en hitte, op te vangen. Dat varieert van minder zieken, minder ziekteverzuim en meer lichamelijke activiteit, tot een betere luchtkwaliteit, minder kosten voor de waterzuivering en een hogere vastgoedwaarde. De baten verschillen per scenario maar blijken aanzienlijk, tussen de 1 en 5 €/m2 extra groen per jaar. De baten zijn het hoogst in wijken waar nu weinig groen is en veel mensen wonen.
Natuur in de stad, zoals parken, grachten en groene daken, kunnen de kwaliteit van de leefomgeving verbeteren. Sommige vormen zijn duidelijk zichtbaar, zoals parken en recreatiegebieden. Maar al het groen draagt ook bij aan complexere processen, zoals een betere luchtkwaliteit, verkoeling van de stad, biodiversiteit en de berging van water in de bodem waardoor het riool minder wordt belast.
De scenario’s verschillen van opzet. Het scenario Groen Dichtbij betreft meer groen in de binnenstad, bijvoorbeeld met behulp van groene daken en meer bomen. In het scenario Groenblauwe Verbindingen worden de boomstructuur in de straten hersteld en in de hele stad recreatieve fiets- en wandelpaden aangelegd. In het scenario Stadsparken worden bestaande parken verbeterd en nieuwe aangelegd. Ten slotte worden in het scenario Metropolitane Parken de grote parken aan de rand van de stad ontsloten voor recreatief gebruik door de uitbreiding van het fiets- en wandelnetwerk.
Om de waarde van groen en blauw te kunnen kwantificeren is in deze studie gebruikgemaakt van het Natuurlijk Kapitaal Model, dat is ontwikkeld door het RIVM, Wageningen Environmental Research (WEnR) en het Planbureau voor de Leefomgeving (PBL). Kernwoorden: stedelijke ecosysteemdiensten, groene infrastructuur, Natuurlijk Kapitaal Model, maatschappelijke kosten-batenanalyse, MKBA, indicator

RIVM Letter report 2019-0021
Page 6 of 79

RIVM Letter report 2019-0021
Page 7 of 79
Contents
Summary — 9
1 Introduction — 11
2 Methods — 15 2.1 Social cost-benefit analysis — 15 2.2 Scenarios — 15
Business-As-Usual — 16 2.2.1 Green Neighbourhoods — 16 2.2.2 Green Network — 21 2.2.3 Urban Parks — 21 2.2.4 Metropolitan Landscape — 21 2.2.5
2.3 Green Benefit Planner — 21 2.4 Ecosystem services and their benefits — 22
Air quality — 23 2.4.1 Health — 25 2.4.2 Physical activity — 25 2.4.3 Property value — 26 2.4.4 Recreation — 26 2.4.5 Urban cooling — 26 2.4.6 Water storage — 27 2.4.7
2.5 Input data — 27 Housing Plans Map — 28 2.5.1 Inhabitants Map — 28 2.5.2 Land Cover Map — 28 2.5.3 Vegetation Maps — 29 2.5.4 Further input data — 30 2.5.5
3 Results — 31 3.1 Business-As-Usual — 31
Air quality — 31 3.1.1 Health — 32 3.1.2 Physical activity — 35 3.1.3 Property value — 37 3.1.4 Recreation — 37 3.1.5 Urban cooling — 37 3.1.6 Water storage — 40 3.1.7
3.2 Changes in ecosystem service values across scenarios — 42 Air quality — 42 3.2.1 Health — 45 3.2.2 Physical activity — 46 3.2.3 Property value — 49 3.2.4 Recreation — 49 3.2.5 Urban cooling — 51 3.2.6 Water storage — 51 3.2.7
3.3 Associations between ecosystem services — 54
4 Discussion and conclusions — 57 4.1 Supply and demand — 57
Supply — 57 4.1.1

RIVM Letter report 2019-0021
Page 8 of 79
Demand — 58 4.1.24.2 Limitations — 58
Qualitative assessment — 58 4.2.1 Aggregation — 58 4.2.2 Monetization — 59 4.2.3 Model uncertainty — 59 4.2.4
4.3 Uses and recommendations — 61 4.4 Implications for Amsterdam’s Structural Vision — 61
Quality Impulse Green strategy 1: Urban Parks — 61 4.4.1 Quality Impulse Green strategy 2: Climate and biodiversity — 62 4.4.2 Quality Impulse Green strategy 3: Green Neighbourhoods — 62 4.4.3 Quality Impulse Green strategy 4: Green Networks and 4.4.4
accessibility — 63
References — 65
Appendix 1 Social cost-benefit analysis — 67
Appendix 2 Additional models — 68 A2.1 Health — 68 A2.2 Physical activity — 69 A2.3 Recreation — 76 A2.4 Water storage — 78

RIVM Letter report 2019-0021
Page 9 of 79
Summary
Amsterdam’s ‘Structural Vision 2040’ (Structuurvisie 2040) comprises the roadmap for the city’s spatial development until the year 2040 (Gemeente Amsterdam, 2011). Its main objectives include enhancing the attractiveness and quality of public spaces, increasing the availability and use of natural capital, and reducing Amsterdam’s contribution to climate change. Addressing these challenges, Amsterdam’s Green Agenda 2015-2018 (Agenda Groen 2015-2018) laid out strategies for the accomplishment of these objectives, namely by strengthening the city’s green infrastructure (Gemeente Amsterdam, 2015). Its successor, the ‘Quality Impulse Green’ (Kwaliteitsimpuls Groen), will further outline the implementation approach of the city’s green infrastructure strategy, additionally considering the pressures entailed by increasing population growth (Gemeente Amsterdam, 2017). To inform this initiative, this study explores the potential impact of the implementation of green strategies envisioned in the Quality Impulse Green on natural capital and its contributions to human health and well-being. The strategies presented within the Quality Impulse Green were translated into four spatial scenarios, expressed as maps, by urban design firm ‘De Urbanisten’. These maps were used as input to quantify ecosystem services within a Business-As-Usual situation in 2025, where no change other than the anticipated population and residential growth takes place, and within the four scenarios. By comparing ecosystem service quantities in the Business-As-Usual (reference) scenario against the four scenarios, it is possible to determine the costs and benefits that would result from the implementation of different green infrastructure measures. This information can be adopted for its inclusion in social cost-benefit analyses, conform the ‘General guidelines for social cost-benefit analyses’ (Algemene leidraad voor maatschappelijke kosten-batenanalyse) and the ‘Nature Guideline’ (Werkwijzer Natuur). These guidelines describe the steps that must be fulfilled prior to the implementation of policy strategies that affect the quantity and quality of natural capital within the Netherlands (Arcadis & CE-Delft, 2018; Romijn & Renes, 2013). Seven ecosystem services were quantified, expressed in 17 physical, social, and monetary indicators. The Green Benefit Planner, a spatial decision-support tool from RIVM, was used to quantify ecosystem services and evaluate fluctuations in values associated with the implementation of every spatial-strategy developed by De Urbanisten. The Green Benefit Planner makes use of models from the Natural Capital Model (NK-Model) (Remme et al., 2018), a collaborative modelling platform from RIVM, Wageningen Environmental Research (WEnR), and The Netherlands Environmental Assessment Agency (Planbureau voor de Leefomgeving, PBL), to quantify ecosystem services. Additional models were developed to generate a general overview of the benefits of ecosystem services produced by Amsterdam’s green infrastructure to human health and well-being, and to evaluate the linkages that exist among them. It was found that substantial benefits can be accrued through the enhancement of Amsterdam’s green infrastructure. The values vary per scenario between 1 and 5 €/m2 additional green per year. Two scenarios

RIVM Letter report 2019-0021
Page 10 of 79
generally seem to accrue the highest benefits within the Amsterdam region, namely the ‘Green Neighbourhoods’ and the ‘Green Network’ scenarios. The Green Neighbourhoods scenario entails enhancing the amount of green in the near vicinity of households, homogeneously distributed across Amsterdam’s most populated areas, including areas where green is currently scarce. Relative to other scenarios, this one was found to yield high potential improvements in terms of increased physical activity, less visits to general practitioners and increased property value. The ‘Green Network’ scenario entails strengthening Amsterdam’s ecological network, including adding trees in segments connecting existing green areas. This scenario was found to yield substantial benefits in terms of enhanced physical activity, reduced visits to general practitioners, temperature regulation, and water storage within the city. The ‘Urban Parks’ scenario includes expanding and enhancing the quality of existing parks, and creating new. It was found to lead to relatively high potential improvements in air quality and to more opportunities for recreational visits to green areas. The ‘Metropolitan Landscape’ scenario did not entail any alterations in Amsterdam’s green infrastructure but rather an enhancement in the accessibility to green areas through the addition of walking and cycling paths. This scenario was found to lead to relatively large potential increases in physical activity and greater opportunities for recreational visits to green areas. Regarding ecosystem service demand and supply, it was found that the supply of ecosystem services is mainly determined by the amount, type, and distribution of vegetation, while the demand is mainly determined by the population density. Population density is the main determinant for ecosystem service demand since it is an indicator for the number of ecosystem service beneficiaries in an area and the environmental pressures they exert. Across scenarios, more green generally entails a higher delivery of ecosystem services, yet the distribution of green also plays an important role. For instance, adding green homogeneously across large areal extents, especially in areas where green is currently scarce, leads to a higher total increase in ecosystem service delivery per spatial unit than adding green within specific locations, especially those that already contain substantial amounts of green. In addition, trees often lead to higher ecosystem service benefits compared to other categories of green, namely shrubs and grass. Future research should focus on the further development of models for quantifying and mapping ecosystem services at different scales. For instance, models for quantifying and mapping water storage by vegetation and recreational opportunities in green and blue areas within cities, were not readily available. Models tailored to the Netherlands and more specifically to different regions or levels of urbanization could also lead to more accurate results and conclusions. This would enhance the explanatory and predictive capability of such models to support spatial planning. Participatory semi-quantitative models could also be adopted to identify stakeholder preferences and their knowledge gaps regarding ecosystem services. This could shed light on niches that require further attention by decision-makers involved in spatial planning, contributing to inclusive and legitimized decision-making.
RIVM Letter report 2019-0021
Page 11 of 79
1 Introduction
“Amsterdam: economically strong and sustainable” (Gemeente Amsterdam, 2011, p.9), is the motto of Amsterdam’s Structural Vision 2040 (Structuurvisie 2040), which lays out the roadmap for the city’s spatial development until the year 2040. The Structural Vision recognizes the challenge of maintaining a robust economy in the face of a rapidly growing population and the environmental pressures it entails. It envisions Amsterdam as the core of an internationally competitive, sustainable, and European metropole (Gemeente Amsterdam, 2011). The main objectives include enhancing the attractiveness and quality of public spaces, increasing the availability and use of natural capital, and reducing Amsterdam’s contribution to climate change. Amsterdam’s Green Agenda 2015-2018 (Agenda Groen 2015-2018) laid out strategies for the accomplishment of these objectives, namely by strengthening the city’s green infrastructure (Gemeente Amsterdam, 2015). Its successor, the ‘Quality Impulse Green’ (Kwaliteitsimpuls Groen), will further outline the implementation approach of the city’s green infrastructure strategy, additionally considering the pressures entailed by a growing population (Gemeente Amsterdam, 2017). Green and blue elements (also ‘green infrastructure’), such as parks, canals, and green roofs, possess more than economic and recreational qualities. While some of the benefits that green infrastructure generates are not difficult to envision (e.g. parks as recreation sites), ecosystems fulfil a gamma of complex functions within cities, crucial for human survival and well-being (e.g. vegetation that contributes to the retention of air pollution and to heat mitigation). Despite significant advances, knowledge on the benefits generated by green infrastructure remains fragmented and hence tends to be overlooked within decision-making. In order to build a case for the implementation of green infrastructure measures, it is necessary to identify and quantify the environmental costs and benefits that would result from their implementation. Measurements can be integrated within social cost-benefit analyses (SCBA) (Romijn & Renes, 2013; Arcadis & CE-Delft, 2018) to evaluate the contributions of green infrastructure to society. By making nature’s contributions to people tangible, it is possible to build a scientific basis for the implementation of nature-based solutions within cities, and to get policy-makers and investors aboard this mission. A promising concept for measuring nature’s contributions to people is the ecosystem services concept. ‘Ecosystem services’ (MA, 2005), or ‘nature’s contributions to people’ (Diaz et al., 2018), are the benefits that natural capital generates for humans. Similar to goods and services in an economy, ecosystem services can be tangible or intangible, and are classified into three categories, conform the Common International Classification of Ecosystem Services (CICES): provisioning, regulating, and cultural services. ‘Provisioning services’ are the material benefits nature provides to humans, such as trees for timber or food for feeding the rapidly growing human population. ‘Regulating services’ are natural processes

RIVM Letter report 2019-0021
Page 12 of 79
that fulfil different functions that benefit humans, such as the role vegetation plays within carbon sequestration and air quality regulation. While often crucial for human survival, regulating services are often intangible or invisible. This leads to a general lack of awareness of their existence and significance, and often results in their overexploitation. ‘Cultural services’ are non-material benefits provided to humans by natural capital, such as the spiritual or recreational value people assign to different natural elements (TEEB, 2010). Often neglected within markets, these benefits are essential for human well-being and form a core element of everyday life.
Figure 1.1: Forest ecosystem services (source: De Urbanisten) The ecosystem services concept adds to our understanding of fundamental ecological structures and processes by assigning labels to their ‘usefulness’ in maintaining and enhancing human well-being, including our survival needs (Burkhard & Maes, 2017). While natural capital provides us with the preconditions required for human existence, their accrued benefits materialize in various forms, including enhanced health, recreation, and higher property values. The delivery of these final ‘benefits’ often requires additional human or built capital inputs, such as human labour for the extraction of resources and roads for their transportation to the end-user (Burkhard & Maes, 2017). The Green Benefit Planner is a tool developed to deepen decision-makers’ understanding on the effects of spatial planning on ecosystem services and how this, in turn, affects a city’s inhabitants. It does so by
RIVM Letter report 2019-0021
Page 13 of 79
quantifying ecosystem service indicators associated with green and blue elements found in the area under assessment, and identifying potential fluctuations in ecosystem service values given the application of different scenarios. Ecosystem service indicators adopted can reflect physical quantities (e.g. particulate matter retention by plants), social quantities (e.g. the effects of particulate matter retention on human health), and monetary quantities (e.g. the reduced health costs associated with increased particulate matter retention) (Remme et al., 2018). This study explores the potential impact of the implementation of strategies from the Quality Impulse Green on natural capital and its contributions to human health and well-being (ecosystem services). It does so by making use of the Green Benefit Planner, which adopts models from the Natural Capital Model (NK-Model) (Remme et al., 2018). In order to depict a wide-ranging and diverse set of ecosystem services, an additional set of models were designed for this study’s purpose. The aim of the study is to generate insights on the value that green and blue generates for the City of Amsterdam and provide quantitative information that can be integrated into SCBAs, endorsing the scientifically-sound and sustainable management of Amsterdam’s natural capital. Ultimately, this will contribute to the achievement of the green and blue objectives envisioned within Amsterdam’s Structural Vision. Section 2 presents the methods used within this study to quantify ecosystem services within the Business-As-Usual (no-change) situation in 2025, and within envisioned green infrastructure scenarios. Detailed information is provided on the ecosystem services quantified, and the models, indicators, and input data used for their quantification. Section 3 presents the results of this study, including ecosystem service quantities and maps the year 2025. Section 4 discusses this study’s results and concluding remarks, including the implications of implementing green infrastructure strategies from the Quality Impulse Green on the well-being of Amsterdam’s citizens.

RIVM Letter report 2019-0021
Page 14 of 79

RIVM Letter report 2019-0021
Page 15 of 79
2 Methods
2.1 Social cost-benefit analysis Social cost-benefit analyses (SCBA) weigh the marketed and non-marketed costs and benefits associated with recommended policies against each other to endorse objective decision-making (Romijn & Renes, 2013). In the Netherlands, policy-related SCBAs are required to follow a set of guidelines, which were published by the Central Planning Office (Centraal Planbureau, CPB) as the ‘General guidelines for social cost-benefit analyses’ (Algemene leidraad voor maatschappelijke kosten-batenanalyse) . The ‘Nature Guideline’ (Werkwijzer Natuur) is a subset of guidelines for conducting SCBAs concerning policies that lead to changes in natural capital and the subsequent effect on human well-being (Arcadis & CE-Delft, 2018). The Nature Guideline emphasizes the need to measure the changes in ecosystem services and biodiversity that result from policies that affect natural capital. A reference alternative (nulaternatief), here referred to as the ‘Business-As-Usual’ alternative, is used as a benchmark to compare the costs and benefits that would result from the implementation of a strategy, relative to a situation where no changes other than the anticipated occur. Within study, four scenarios were developed comprising strategies from Amsterdam’s Quality Impulse Green, to evaluate how changes in natural capital resulting from the implementation of such strategies will affect ecosystem service delivery. Solutions considered within the Nature Guideline to address policy-related questions come in two forms: investments and policy-instruments. Investments lead to improvements in the size or quality of natural capital, whereas policy-instruments set boundaries or restrictions to endorse the sustainable use of natural capital. This study focuses on how changes in the quantity and quality of natural capital (investment solutions) affect ecosystem service delivery. The study evaluates how changes in Amsterdam’s natural capital due to the implementation of the Structural Vision’s green objectives, affect ecosystem services. Various steps required to conduct a SCBA conform the Nature Guideline, are covered. These steps are described in Appendix 1, along with the location in this report (or otherwise) where different aspects from the guideline are addressed.
2.2 Scenarios The strategies envisioned by the Quality Impulse Green (Gemeente Amsterdam, 2017) were translated into four green infrastructure scenarios by ‘De Urbanisten’, an innovative consultancy firm for urban research, design, and landscape based in Rotterdam, The Netherlands. Scenarios illustrate the potential alterations to Amsterdam’s green infrastructure conform strategies from the Quality Impulse Green. A Business-As-Usual (BAU) scenario was also developed, illustrating ecosystem service values in the year 2025, considering only residential expansion and population growth as the main change. By comparing ecosystem service values resulting from the implementation of green

RIVM Letter report 2019-0021
Page 16 of 79
infrastructure strategies, to ecosystem services values generated in a BAU situation, light is shed on the benefits (and costs) generated by green infrastructure. A brief description of each scenario is provided hereunder.
Business-As-Usual 2.2.1The ‘Business-As-Usual’ scenario projects the changes in natural capital that would occur in the City of Amsterdam by 2025 if the city continued to expand but green infrastructure strategies were not implemented. This scenario serves as a benchmark to compare the benefits (or losses) that would result from the implementation of different strategies from the Quality Impulse Green. The main changes considered consist of the expected growth of residential areas in Amsterdam, and the estimated population increase of approximately 70,000 people.
Green Neighbourhoods 2.2.2The ‘Green Neighbourhoods’ scenario (Figure 2.1) entails a general increment in the amount of green within areas where there is little green space, such as the city centre, and improving the quality of green in areas where green is relatively abundant, such as in peripheral neighbourhoods. The set of strategic actions designed to meet these objectives include:
• In the historical city centre and along the urban canal, turning 100 % of all parking places into green surfaces, including trees;
• Along the first city extensions and extensions made in the 40s, turning 50% of all parking places into green surfaces, including trees;
• In the historic centre, turning grey roofs into green roofs, including 50% in the first extensions and extensions made in the 40s, and 15% along urban canals;
• Implementing water sensitive design in areas that experience a high flood-risk, according to ‘Amsterdam Rainproof’ (www.rainproof.nl), including creating new green areas that implement water sensitive technologies, such as Bioswales, wadis, and raingardens.

RIVM Letter report 2019-0021
Page 17 of 79
Figure 2.1: Green Neighbourhoods base map, developed and mapped by De Urbanisten

RIVM Letter report 2019-0021
Page 18 of 79
Figure 2.2: Green Network base map, developed and mapped by De Urbanisten

RIVM Letter report 2019-0021
Page 19 of 79
Figure 2.3: Urban Parks base map, developed and mapped by De Urbanisten

RIVM Letter report 2019-0021
Page 20 of 79
Figure 2.4: Metropolitan Landscape base map, developed and mapped by De Urbanisten

RIVM Letter report 2019-0021
Page 21 of 79
Green Network 2.2.3The ‘Green Network’ scenario (Figure 2.2) entails investing in a recreational network of cycling, sports and hiking trails. This includes completing the main tree structure of Amsterdam’s network connecting green areas, thereby strengthening the ecological structure. The set of strategic actions designed to meet these objectives include:
• Adding trees to the main tree structure to ensure its continuity; • Adapting the main tree structure to store rainwater in areas that
experience a high flood-risk, according to Amsterdam Rainproof (www.rainproof.nl).
• Altering the ecological structure by turning grass lawns into richer landscape typologies, such as meadows and different types of shrubs;
• Formalizing Amsterdam’s Green Net (Groennet), or Amsterdam’s network of recreational areas, by improving the quality of various segments and adding new walking- and cycling-paths between areas that are not connected.
Urban Parks 2.2.4Strategic actions for the scenario ‘Urban Parks’ (Figure 2.3) were suggested by the Amsterdam Municipality. These actions entail creating new parks, expanding existing parks, and transforming parks of extensive use into intensive use parks. The set of strategic actions designed to meet these objectives include:
• Creating new city parks by adding more grass, more shrubs and more trees to existing recreational areas;
• Transforming green areas into city parks by (1) opening private green areas (mainly allotment gardens) into public areas, (2) making them accessible by expanding biking- and walking-paths (25km extra), and by (3) raising the maintenance rate from no-maintenance to C-level maintenance;
• Expanding walking- and cycling-paths (198km extra) within extensive-use park to attract more people, reducing the pressure in intensive-use parks;
• Improving city parks by improving the maintenance level
Metropolitan Landscape 2.2.5Metropolitan parks are large green and blue representative landscapes that surround the city. These areas are already rich in green and blue elements, which is why strategic aspects in the ‘Metropolitan Landscape’ scenario (Figure 2.4) aim to bring these elements closer to Amsterdam’s residents. The strategic actions designed to meet these objectives include expanding the walking- and cycling-paths linking metropolitan areas with the city, and designing programs and routes to access these areas.
2.3 Green Benefit Planner The Green Benefit Planner was used to quantify several ecosystem services within this report. The Green Benefit Planner is a spatial decision-support tool for calculating the effects of spatial changes on natural capital, to support spatial planning. Through the use of the Green Benefit Planner, it is possible to calculate the effect of different scenarios on ecosystem services and the accrued societal benefits. The
RIVM Letter report 2019-0021
Page 22 of 79
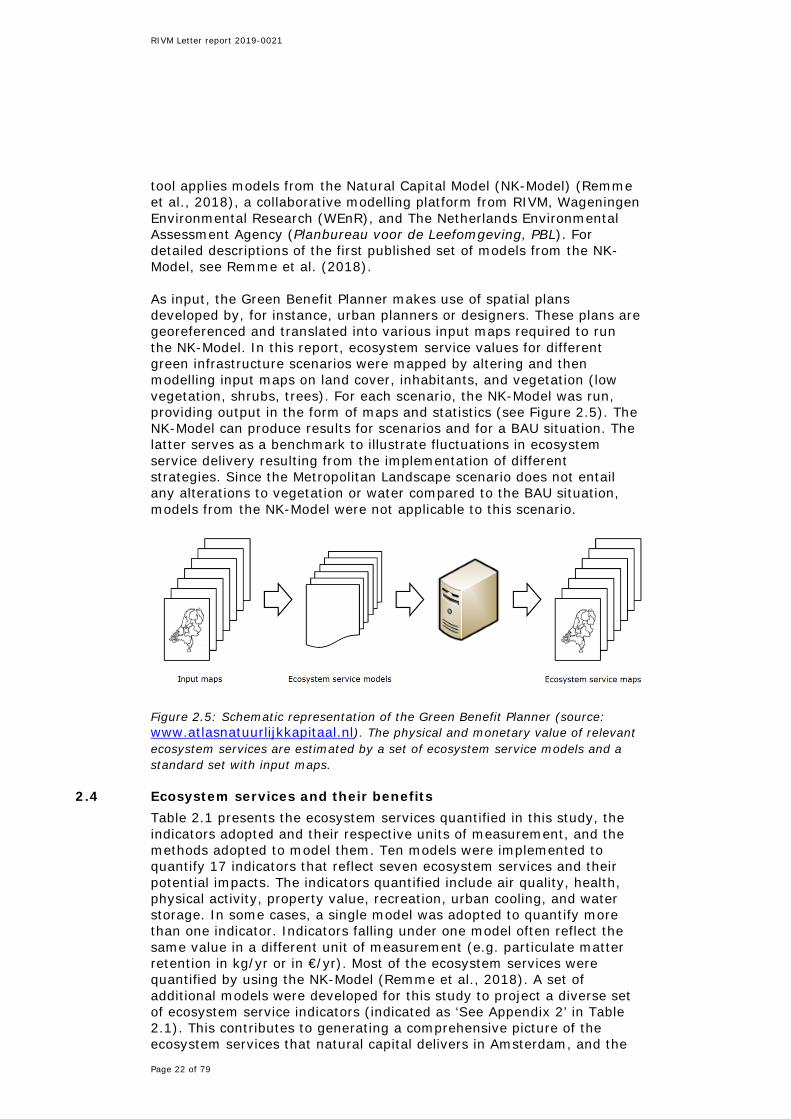
tool applies models from the Natural Capital Model (NK-Model) (Remme et al., 2018), a collaborative modelling platform from RIVM, Wageningen Environmental Research (WEnR), and The Netherlands Environmental Assessment Agency (Planbureau voor de Leefomgeving, PBL). For detailed descriptions of the first published set of models from the NK-Model, see Remme et al. (2018). As input, the Green Benefit Planner makes use of spatial plans developed by, for instance, urban planners or designers. These plans are georeferenced and translated into various input maps required to run the NK-Model. In this report, ecosystem service values for different green infrastructure scenarios were mapped by altering and then modelling input maps on land cover, inhabitants, and vegetation (low vegetation, shrubs, trees). For each scenario, the NK-Model was run, providing output in the form of maps and statistics (see Figure 2.5). The NK-Model can produce results for scenarios and for a BAU situation. The latter serves as a benchmark to illustrate fluctuations in ecosystem service delivery resulting from the implementation of different strategies. Since the Metropolitan Landscape scenario does not entail any alterations to vegetation or water compared to the BAU situation, models from the NK-Model were not applicable to this scenario.
Figure 2.5: Schematic representation of the Green Benefit Planner (source: www.atlasnatuurlijkkapitaal.nl). The physical and monetary value of relevant ecosystem services are estimated by a set of ecosystem service models and a standard set with input maps.
2.4 Ecosystem services and their benefits Table 2.1 presents the ecosystem services quantified in this study, the indicators adopted and their respective units of measurement, and the methods adopted to model them. Ten models were implemented to quantify 17 indicators that reflect seven ecosystem services and their potential impacts. The indicators quantified include air quality, health, physical activity, property value, recreation, urban cooling, and water storage. In some cases, a single model was adopted to quantify more than one indicator. Indicators falling under one model often reflect the same value in a different unit of measurement (e.g. particulate matter retention in kg/yr or in €/yr). Most of the ecosystem services were quantified by using the NK-Model (Remme et al., 2018). A set of additional models were developed for this study to project a diverse set of ecosystem service indicators (indicated as ‘See Appendix 2’ in Table 2.1). This contributes to generating a comprehensive picture of the ecosystem services that natural capital delivers in Amsterdam, and the

RIVM Letter report 2019-0021
Page 23 of 79
potential trade-offs and synergies that exist among them. Additional calculations made are described in detail in Appendix 2.
Air quality 2.4.1Air pollution is a common problem and challenge within industrialized countries all over the world. It is caused by sources such as car traffic, industry, and livestock farming. One of the most common forms of pollution found in cities is particulate matter, which is associated with respiratory, cardiovascular diseases, and mortality. Vegetation, especially trees, can behave as a means of particulate matter retention, by affecting its deposition, the airflow, and turbidity. Particulate matter retention and the monetary benefits generated by the ecosystem service, were modelled through the use of the NK-Model (Remme et al., 2018). The model focuses on the retention by vegetation of particulate matter up to 10 micrograms (PM10). Despite the potential air quality regulation benefits that vegetation can generate, recent studies have shown that trees may also have the opposite effect when located along street canyons, streets with significant amounts of buildings, traffic, and human activity (Wesseling et al., 2011). Hence, the ecosystem service was not quantified for the scenario ‘Green Network’, where a significant amount of trees is added to the main tree structure along streets. While the ecosystem service was quantified for the remaining scenarios, the results are to be used with precaution since they constitute a high degree of uncertainty. These indicators rather serve as a means to reify nature’s contributions to people in a holistic fashion, enabling the consideration and the comparison of the ecosystem service ‘air quality’ with other ecosystem services considered in this study.

RIVM Letter report 2019-0021
Page 24 of 79
Table 2.1: Ecosystem services modelled, indicators used, and methods applied Ecosystem Service Model Indicator Unit Method
Air quality 1 PM10 retention kg/yr NK-Model PM10 retention €/yr NK-Model
Health
2 Reduction in probability of being overweight % See Appendix 2 3 Reduced number of visits to general practitioner visits/yr NK-Model Reduced health costs due to urban green €/yr NK-Model
Reduced health-related labour costs due to urban green €/yr NK-Model
Physical activity
4 Additional time spent on outdoor physical activity min/yr See Appendix 2 5 Cycling km/inhabitant/yr See Appendix 2 6 Time spent cycling to-from work min/yr See Appendix 2
Avoided premature deaths from cycling to-from work lives/yr See Appendix 2
Avoided premature deaths from cycling to-from work €/yr See Appendix 2
Property value 7 Contribution to property value € NK-Model
Recreation 8 Visits to recreation areas visits/yr See Appendix 2 Visitation expenditures €/yr See Appendix 2
Urban cooling 9 Decrease in temperature °C NK-Model
Water storage 10 Reduced rainwater in sewers m3/yr See Appendix 2 Reduced water treatment costs €/yr See Appendix 2

RIVM Letter report 2019-0021
Page 25 of 79
Health 2.4.2A positive relationship exists between urban green spaces and human health. This report uses the NK-Model (Remme et al., 2018) and a Dutch study produced by RIVM (Klompmaker et al., 2017) to translate some of the various health benefits generated by green elements into four indicators describing health impacts and costs. Based on Klompmaker et al. (2017), the effect of the percentage of green space surrounding a household on the general probability of being overweight (BMI ≥ 25 kg/m2), was modelled. Through the use of the NK-Model, the effect of urban green on three human health indicators was modelled. The NK-Model extrapolates the effect of urban green on general health by considering the effect of green space on the mitigation of nine diseases (KPMG, 2012; Remme et al., 2018). It also models the effect of urban green on the number of visits paid to general practitioners by patients (Maas, 2008). Finally, the NK-Model quantifies the effect of urban green on health-related labour costs. Health-related labour costs considered include three main factors: absenteeism, labour productivity, and job losses (Steenbeek et al., 2010). The associations adopted to quantify this ecosystem service were obtained from studies conducted at the national scale, which is why the results obtained in this study are not meant to be used for purposes such as forecasting or analysing the actual cell-by-cell distribution of health benefits in Amsterdam.
Physical activity 2.4.3Evidence on the association between green space and physical activity (e.g. walking, cycling) is mixed (Staatsen et al., 2017). For instance, research conducted within the Netherlands found a positive relationship between the percentage of green space in a household’s vicinity and the amount of time its dwellers spend on outdoor physical activity, for instance cycling to-from work (Klompmaker et al., 2018; Maas et al., 2008). For this study, a model capturing the effect of green space on outdoor physical activity and cycling for commuting purposes, was developed (Appendix 2). The HEAT Tool (Kahlmeier et al., 2017) was applied to determine the effect of cycling on human lifespans (reduced risk of all-cause mortality) and the associated economic benefits (Appendix 2). The HEAT Tool, developed by the World Health Organization, measures the effects of walking and cycling on human health (Kahlmeier et al., 2017). The effect of cycling-network size on cycling is not an ecosystem service in theory, since cycling lanes do not constitute natural capital elements. However, strategies envisioned in the Quality Impulse Green include vast expansions in the cycling-lane network as a means to improve the quality and accessibility of green and blue areas. Hence, the inclusion of ‘kilometres cycled’ as a result of the size of the cycling network, was requested. Since no readily available scientific research was found providing information on the relationship between the length of cycling lanes and cycling within the Netherlands, a basic extrapolation was made. The extrapolation is based on trends from reported cycling statistics for Amsterdam and projected increases in bike-lanes within every scenario (see Appendix 2).

RIVM Letter report 2019-0021
Page 26 of 79
Uncertainties associated with physical activity indicators considered in this study result mainly from (1) the lack of quantitative evidence capturing the hypothesized relationship between explanatory variables, and (2) the failure to integrate socio-cultural elements that play a crucial role on people’s decision to engage in physical activity. For instance, indicators reflecting the relationship between green space and the time individuals engage in general outdoor physical activity or cycling for commuting purposes, only considers the percentage of green space and population growth as explanatory factors. Socio-cultural and other demographic aspects (e.g. age, socio-economic background, neighborhood safety level) were not considered, due to the lack of quantitative evidence reflecting these relationships. Further research should address these relationships in order to enable the integration of additional demographic and socio-cultural factors within the models adopted in this study.
Property value 2.4.4Natural elements, such as trees, gardens, parks, and water, have a positive influence on property values within urban areas (Czembrowski & Kronenberg, 2016; Franco & McDonald, 2017; Luttik & Zijlstra, 1997). To model the influence of green infrastructure on property prices in the city of Amsterdam, the NK-Model was used (Remme et al., 2018; Luttik & Zijlstra, 1997; Ruijgrok, 2006). The model captures the contribution to property prices by vegetation and water, based on their availability and accessibility. Uncertainties within this calculation result mainly from the date of the associations that were used as input for the model (Luttik & Zijlstra, 1997) and from common uncertainties relating to the use of benefit transfer techniques (i.e. transposing quantitative associations from a different site to the site under assessment). These uncertainties should be taken into consideration when adopting the results obtained from this model’s implementation to inform policy-making.
Recreation 2.4.5Aside from playing a crucial role on human survival, green spaces serve an important function as sites for recreation. Due to the lack of readily available tools and scientific research required to model the relationship between green spaces and recreation within the Netherlands, a basic extrapolation was made (see Appendix 2). The extrapolation is based on reported visits to a number of Amsterdam’s green recreational areas of different configurations (e.g. size, vegetation types, cycling/walking network size, access to water), and population growth in the region. Further research on the relationship between recreational area configurations and visitation rates/expenditures, is required to enable the development of a model that reflects these relationships with a lower degree of uncertainty.
Urban cooling 2.4.6Cities around the world increasingly experience higher temperatures than their surrounding rural areas, a phenomenon commonly referred to as the ‘urban heat island effect’. This often results from human activity and infrastructure that enhances heat storage while inhibiting its release. This includes the use of materials such as asphalt and concrete,

RIVM Letter report 2019-0021
Page 27 of 79
which increase sunlight absorption while delaying its release, reduced wind speed between buildings, and reduced natural evaporation due to soil sealing (Remme et al., 2018). The effect of vegetation in mitigating the urban heat island effect was estimated through the implementation of the NK-Model (Remme et al., 2018; Lauwaet et al., 2018), which combines information on population, wind speed, vegetation, and soil sealing to model the ecosystem service.
Water storage 2.4.7Soils and vegetation play an influential role in water retention, a largely ignored but crucial function contributing to human well-being. Soils and vegetation behave as a sponge that absorbs water from rainfall, reducing the risk of flooding while also filtering unwanted pollutants from water. Water itself carries nutrients that are essential for plant growth, which in turn contributes to the delivery of other ecosystem services. Due to the absence of a water storage model within the NK-Model, the supply of water storage by natural elements was calculated based on a simple model. The model makes use of a reference value (www.sbrcurnet.nl) to estimate the amount of precipitation (rainfall) that can be stored by vegetation in the City of Amsterdam. The reduced costs of sewage treatment are used as a proxy for the avoided costs associated with enhanced water storage. Appendix 2 provides an overview of the method adopted to extrapolate the potential water storage by vegetation and the associated monetary benefits. The main uncertainties from this calculation stem from common issues associated with benefit transfer techniques (i.e. transposing quantitative associations from a different site to the site under assessment). As such, the results obtained from this model’s implementation can be adopted as a means to inform policy-makers of the benefits vegetation delivers for water retention rather than to analyse the cell-by-cell value of water storage across Amsterdam.
2.5 Input data The models from the NK-Model make use of a standardized set of input maps and tables (Remme et al., 2018). These maps also served as input for the additional models developed for this study. Input maps provide spatial information that, combined with formulas and look-up tables, can be incorporated into ecosystem service maps. Look-up tables provide information necessary for reclassifying the information from input maps. Generally, standard input maps and tables from the NK-Model were used in this study. However, some input maps were adapted to reflect predicted changes (i.e. residential expansion and population growth) based on information provided by the Municipality of Amsterdam, and changes based on the spatial strategies developed by De Urbanisten. The most important input maps adapted were the Land Cover Map (Ecosystem Unit map), Inhabitants Map, and vegetation maps (i.e. Trees Map; Shrubs Map; Low Vegetation Map). The following sub-sections provide information on the input maps that were used to model ecosystem services, and the alterations that were made to these maps to develop scenarios.

RIVM Letter report 2019-0021
Page 28 of 79
Housing Plans Map 2.5.1Some of the main adaptations to input maps used in the NK-Model were based on data from the Housing Plans Map from the City of Amsterdam (maps.amsterdam.nl). This spatial dataset shows areas where new residential areas have been planned for the upcoming years, including the number of units that are expected to be built. The version of the dataset here used dates to 20-12-2017. Any subsequent alterations made to the dataset by the City of Amsterdam, have not been considered within this report. Additional information on the average number of inhabitants per housing was provided by the City of Amsterdam.
Inhabitants Map 2.5.2The Inhabitants Map used contains spatial information on the number of inhabitants living in the Municipality of Amsterdam during the year 2016. In 2025, it is expected that approximately 70,000 additional inhabitants will live within the municipality, compared to 2016. To extrapolate the additional number of inhabitants, the Housing Plans data from the Municipality of Amsterdam was used. Plans that fell within the phases ‘investment decision taken’ and ‘in construction’ with planned completion in the period 2018-2025, were included. Gross inhabitant values from the dataset were applied (number of housing units multiplied by the average number of inhabitants for a particular type of neighbourhood). This filtering provided a spatially disaggregated map of the new inhabitants, close to the expected number of additional inhabitants (final count 75,137). The inhabitants of a single building site were allocated evenly over the entire site. For instance, if a new building block of 100 10x10m cells houses 200 people, each cell would house 2 people. The map with the predicted (gross) number of inhabitants per cell was combined with the current Inhabitants Map by overlaying values in the original map with all non-zero values from the map with the predicted additional inhabitants. This resulted in an Inhabitants Map for Amsterdam for 2025. The new Inhabitants Map was used as input for all scenarios, including the Business-As-Usual scenario.
Land Cover Map 2.5.3To develop a new Land Cover Map for each future scenario, the current Land Cover Map (Ecosystem Unit Map 2013, Statistics Netherlands), was adapted based on the maps for each scenario developed by De Urbanisten. Within every scenario, the current land cover was altered for certain areas into six land cover types: forest, grassland, shrubs, water, housing, and roads. All areas that were indicated to become ‘forest’ within a scenario, were altered to ‘deciduous forest’ in the Ecosystem Unit map, as this is the dominant forest type in the Amsterdam metropolitan region. All areas that were indicated to become ‘low vegetation,’ were altered to ‘natural grassland’ in the Ecosystem Unit Map. All areas indicated to become ‘shrubs’ were, altered to ‘other unpaved terrain’ for the Ecosystem Unit Map, as there is no separate class for shrubs in the Ecosystem Unit map. All additional water bodies and roads were altered to the ‘water’ and ‘road’ land cover classes, respectively. Finally, all areas where additional housing is expected (see 2.5.1) were altered to the ‘housing’ land cover type.

RIVM Letter report 2019-0021
Page 29 of 79
Vegetation Maps 2.5.4Three vegetation maps were used: tree cover, shrub cover and low vegetation cover with scale 0 to 1, where 1 represents full cover. See Remme et al. (2018) for a detailed description of the maps. The vegetation cover maps were updated individually for each scenario and then revised to ensure that there were no inconsistencies once different vegetation cover maps were aggregated. Table 2.2 shows the changes in the number of units of various natural elements across different scenarios, with the Business-As-Usual scenario serving as a benchmark. Alterations made are described below. Table 2.2: Difference (+/-) in the number of green elements within green infrastructure scenarios
Green/blue element Unit Green
Neighb. Green Netw.
Metro. Lands.
Urban parks
Trees units/ha 124 522 - 258 Shrubs units/ha - 571 - -79 Grass units/ha 125 -653 - 138 Total units/ha 249 440 - 316
Tree cover The tree cover map was updated first. All areas that were indicated as forest in a respective scenario, received a tree cover of 1. All areas that were altered to shrubs or low vegetation were set to 0 in the tree cover map. All areas that were altered to new housing areas (see 2.5.1) were set to 0.2, assuming that 20% of new residential areas would be covered by trees. In the Green Network scenario tree cover in the network structure was increased from 10% average cover to 40% average cover (ranging from 0 to 0.82 cover), based on a random distribution within the network. Low vegetation cover Second, the low vegetation cover map was updated. All areas indicated as low vegetation in a respective scenario, received a low vegetation cover of 1. All areas that were altered to shrubs or trees were set to 0 in the low vegetation cover map. All areas that were altered to new residential areas (see 2.5.1) were set to 0.2, assuming that 20% of new residential areas would be covered by low vegetation. Table 2.3: Additional low vegetation at street level and on green roofs in the Green Neighbourhoods scenario for different city zones City zone Additional street-level
low vegetation Additional low vegetation on roofs
% of total street area % of residential roof area City centre 7 5 Canal belt 5 15 First extensions 10 50 1940s extensions 10 50
In the Green Neighbourhoods scenario additional low vegetation has been added in Amsterdam’s central neighbourhoods, both at street level, and as green roofs (Table 2.3).

RIVM Letter report 2019-0021
Page 30 of 79
Shrub cover Finally, the shrub cover map was updated. All areas indicated as shrubs in a respective scenario received a shrub cover of 1. All areas that were altered to low vegetation or trees were set to 0 in the shrub cover map. All areas that were altered to new housing areas (see 2.5.1) were set to 0, assuming that new housing areas would be partially covered only by trees and low vegetation. Total vegetation cover check Total vegetation cover cannot exceed 1 (100% cover). Therefore, after updating the tree separate Vegetation Maps for each scenario, a total vegetation cover map was made as a check, by adding up the tree cover, shrub cover and low Vegetation Maps.
Further input data 2.5.5All other input files (based on the current situation) were left equal in the current situation and all scenarios, even if future changes are likely. Examples of datasets that are likely to change in the future are housing prices, concentrations of particulate matter (PM10) and potentially average wind speed. As the future developments of these variables are unknown, they have been left unchanged, also making the effects of natural capital more visible in the results.
RIVM Letter report 2019-0021
Page 31 of 79
3 Results
This Section presents the predicted ecosystem service values for the City of Amsterdam, for the year 2025. Results for one Business-As-Usual (BAU) and four green infrastructure scenarios, are presented. For every scenario, seven ecosystem services were modelled, expressed in 17 indicators. Indicators describe physical impacts (e.g. water storage, temperature), well-being impacts (e.g. improved health), and the associated monetary benefits. The BAU scenario serves as a benchmark for the value that natural capital would generate in Amsterdam in 2025 if the green infrastructure strategies from the Quality Impulse Green were not implemented. The four green infrastructure scenarios reveal ecosystem service values after alterations in Amsterdam’s green infrastructure take place, due to the implementation of strategies form the Quality Impulse Green. Section 3.1 presents the ecosystem service quantities that would be produced in the year 2025 if Amsterdam’s Structural Vision were not implemented, and Section 3.2 expands on the fluctuations in ecosystem service delivery that would take place provided the implementation of each scenario. Section 3.3 provides a general overview on ecosystem service values within each scenario, also generating insights on ecosystem service trade-offs and interactions.
3.1 Business-As-Usual This Section presents the results showing the total values for the BAU scenario delivered by every ecosystem service. Here, ecosystem service values for the year 2025 are presented. Not all indicators modelled are presented as maps. This is the case since not all models here used are spatial models (i.e. recreation; cycling) and since some of the indicators modelled present similar information within different units of measurement (e.g. the value of PM10 retention in kg/yr and in €/yr). Despite no improvements in Amsterdam’s green infrastructure being considered for the period ranging from 2016-2025, demographic changes (i.e. expected growth of residential areas and population increase) will often lead to fluctuations in ecosystem service values throughout the period (e.g. through more beneficiaries).
Air quality 3.1.1The ecosystem service ‘air quality regulation’ was measured by observing the amount of particulate matter (PM10) retained by vegetation and water in kg/year, and the accrued economic benefits in €/year. The monetary benefits from increase particulate matter retention were calculated based on the assumption that reduced PM10 concentrations in the air lead to a lower incidence of air-pollution related diseases and related costs (CE Delft, 2017). It was estimated that green infrastructure captures more than 340 thousand kg of particulate matter per year in Amsteredam1, valued at €15 million in avoided health costs from air pollution related diseases. In 2025, the city’s population is 1 This calculation does not consider the inverse effect on PM10 retention that trees have in street canyons

RIVM Letter report 2019-0021
Page 32 of 79
predicted to increase sharply. The larger number of benefactors implies an even higher value generated from reduced health costs. Figure 3.1 presents the map for PM10 retention by vegetation within the BAU 2025 scenario in kg/year, showing the areas where the highest (blue) and lowest amounts (yellow) of PM10 are retained. The capture of PM10 relies on two main factors: the land cover type (i.e. trees, shrubs, grass, water) and the total concentration of PM10 within a specific cell. Trees have the highest capacity for PM10 retention, followed by shrubs, and grass (in descending order). Hence, areas with a high percentage of trees (e.g. Amsterdamse Bos) tend to show high values of PM10 retention. Moreover, the need for PM10 retention is dependent on PM10 concentrations within an area. Densely populated areas with a high degree of human activity tend to have higher particulate matter concentrations and thereby require a higher PM10 uptake. Areas in the northernmost part of Amsterdam (e.g. Waterland) experience lower PM10 uptake compared to green areas in populated areas, which can be seen in dark blue hues. This is the case since the vegetation in the outskirts of the city consist mainly of grass, which retains less PM10 than trees or shrubs, and also since the demand for PM10 retention in such areas is lower due to lower overall concentrations in less populated areas. Built-up and other paved areas with little to no vegetation, show lower amounts of PM10 retention, visible in yellow hues.
Health 3.1.2The percentage of green space in the near proximity of households is positively associated with improved health. For instance, a relationship exists between exposure to urban green and the number of visits to a general practitioner (GP). It is expected that the number of avoided visits to GPs in Amsterdam will increase from above 31,000 visits in 2016 to above 32,000 visits in 2025. The reduced costs from improved health related to green space are expected to increase from roughly €30.6 billion to €32.4 billion throughout the same period. This projection considers reduced costs based on reductions in the incidence of nine diseases related to urban green (Remme et al., 2018). The reduced labour costs associated with improved health were estimated by calculating the reduced costs of absenteeism, reduced labour productivity, and job losses (KPMG, 2012; Steenbeck et al., 2010). Reduced labour costs are predicted to increase from roughly €150 million in 2016 to €158 million in 2025.

RIVM Letter report 2019-0021
Page 33 of 79
Figure 3.1: Air quality regulation – Business-As-Usual – year: 2025

RIVM Letter report 2019-0021
Page 34 of 79
Figure 3.2: Health – Business-As-Usual – 2025

RIVM Letter report 2019-0021
Page 35 of 79
Figure 3.2 shows the distribution of reduced health costs due to urban green, based on the influence of green on the incidence of nine diseases (KPMG, 2012; RIVM, 2003; Maas, 2008). One of the main determining factors in this calculation is the population density within a 1km radius (buffer) around a cell, which is why dark blue areas cover most inhabited areas in a fairly homogeneous fashion. The percentage of green space within a 1km buffer of every household also plays a determining role in the extrapolation of this ecosystem service’s value, contributing to the fairly homogeneous hues of green, blue, and yellow here seen. Areas in the outskirts of Amsterdam are visible in yellow and white hues primarily, which is mainly attributed to the low population densities in such areas and thereby lower demand for the ecosystem service.
Physical activity 3.1.3Within the Netherlands, a positive relationship exists between green space and the amount of time individuals spend on physical activity (Klompmaker et al., 2017; Maas et al., 2008). Green space has a positive influence on the amount of time people are willing to spend on outdoor physical activity in general, and more specifically cycling to-from work. In Amsterdam, it is estimated that the contribution of green space to the time people decide to spend on outdoor physical activity will increase by 2.1% throughout the period 2016-2025, while the total amount of time people spend cycling for commuting purposes will increase by 0.1%. Figure 3.3 projects the distribution of the total amount of time people will spend cycling to-from work in 2025, based on the amount of urban green in their surroundings. The projected total amount of time cycled for commuting purposes is dependent both on the amount of green space in an area and on the number on inhabitants within each household. Figure 3.3 shows lower cycling values in the centre of Amsterdam (i.e. de Wallen) compare to the surrounding rings. This is the case since the ratio of households to green in the centre of Amsterdam is relatively low compared to its surrounding neighbourhoods. Within the outskirts of Amsterdam, the percentage of green increases but population also decreases, so the total amount of cycling for commuting purposes become less visible. Research has shown that cyclists have a lower risk of all-cause mortality compared to non-cyclists, even when considering the risks associated with active transport (e.g. exposure to air pollution or traffic injuries) (Kelly et al., 2014; Staatsen et al., 2017). It was estimated that the number of avoided premature deaths per year associated with cycling for commuting purposes will increase from approximately 192 in 2016 to 193 in 2025. The economic benefit due to increased lifespans was estimated at approximately €555 million for 2016 and €558 million for 2025. These economic benefits were obtained by translating the avoided premature deaths from increased cycling to the value of a statistical life, as suggested by the WHO HEAT Tool (https://www.heatwalkingcycling.org/). Default values for the WHO European region were used, which were set at €2.132 million per individual for 2015 (www.who.int/).

RIVM Letter report 2019-0021
Page 36 of 79
Figure 3.3: Physical activity – Business-As-Usual – 2025

RIVM Letter report 2019-0021
Page 37 of 79
Property value 3.1.4In the Netherlands, green infrastructure has a positive influence on property values. The effect of green infrastructure elements (e.g. trees, water, parks) on property values for the City of Amsterdam is expected to increase from €11.5 billion in 2016 and to €11.8 billion in 2025. Figure 3.4 shows the economic contribution of vegetation and water to property values, calculated as a fraction of the total property value. As such, areas which are generally defined by relatively higher prices (e.g. Amsterdam centre and old south) often experience higher net contributions to property value.
Recreation 3.1.5For the ecosystem service ‘recreation’, a non-spatial model was developed (Appendix 2). Based on statistics on visitations to recreational areas in Amsterdam, it is estimated that more than 174 million visits are made to recreational areas in Amsterdam (year=2016). This number is expected to increase to more than 210 million visits in 2025, with associated increased recreational expenditures valued at approximately €200,000 per year.
Urban cooling 3.1.6The effect of vegetation on urban cooling was extrapolated from the difference between the maximum potential urban heat island (UHI) effect and the actual urban heat island effect for a given area. The maximum potential UHI effect represents the total demand for urban cooling and the actual UHI effect as the unmet demand for urban cooling. The resulting value (maximum UHI effect - actual UHI effect) is thus the supply of urban cooling by green and blue. The maximum potential UHI effect is dependent on three main variables: soil sealing (including built-up areas), population density, and wind speed. Different natural (non-sealed) areas will lead to different percentage reductions in the UHI effect. In Amsterdam, it is expected that green infrastructure will increase its contribution to the reduction of the UHI effect by 1%. This estimate assumes an increase in the UHI effect due to an increase in population.

RIVM Letter report 2019-0021
Page 38 of 79
Figure 3.4: Property value – Business-As-Usual – 2025

RIVM Letter report 2019-0021
Page 39 of 79
Figure 3.5: Urban cooling - Business-As-Usual – 2025

RIVM Letter report 2019-0021
Page 40 of 79
Figure 3.5 illustrates the reduction of the UHI effect by green and blue, or the supply of urban cooling. Areas with low supply of the ecosystem service (yellow) consist of areas with very high population densities and vast sealing. Areas in blue are mainly characterized by larger extents of semi-natural and agricultural land, with lower population densities and less sealing, thus requiring a lower demand for urban cooling.
Water storage 3.1.7Vegetated areas play an influential role in storing water from rainfall, avoiding runoff into sewers and reducing the risk of flooding. In Amsterdam, water storage by vegetation leads to around 31 million m3 of reduced rainwater in sewers per year. The value accrued to reduced water treatment costs form increased storage is estimated at more than €24 million per year. Figure 3.6 illustrates the distribution of water retention in the city of Amsterdam, in m3 per year. Here, water storage is directly related to the amount of vegetation in inhabited areas, with highly vegetated areas visible in dark blue hues. The amount of water stored can be viewed as potential runoff stored by vegetation that would otherwise end up on streets and sewers.

RIVM Letter report 2019-0021
Page 41 of 79
Figure 3.6: Water storage - Business-As-Usual – 2025

RIVM Letter report 2019-0021
Page 42 of 79
3.2 Changes in ecosystem service values across scenarios To assess the value generated (or lost) through the implementation of strategies from Amsterdam’s Quality Impulse Green, the difference between ecosystem service values quantities obtained for each green infrastructure scenario were compared to those from the business-as-usual (BAU) scenario. Within Table 3.1, differences for seven ecosystem services are expressed in 17 indicators. The values presented consist of the difference between the total value for each indicator within the BAU scenario and the value for each indicator within the four green infrastructure scenarios. Since the Metropolitan Landscape scenario does not entail any alterations to vegetation or water compared to the BAU situation, several ecosystem service indicators do not experience any change. Table 3.2 presents the changes in ecosystem service values accrued to changes in green (green ha). This provides an overview of the average changes in ecosystem services resulting from the implementation of every strategy. The monetary benefits vary, between 1 and 5 €/m2 additional green per year. Aggregation of the different ecosystem services is strongly discouraged as there are overlaps within the elements covered by different indicators, giving way to double-counting. The strategies considered within each scenario are not meant to be viewed as alternatives to one another but as different elements of the Quality Impulse Green.
Air quality 3.2.1Two indicators were adopted to reflect fluctuations in particulate matter (PM10) retention and the associated benefits: the reduction of PM10 in kg per year and the reduction in health costs from the reduced incidence of related diseases. The model applied in this study was not applicable for the Green Network scenario, since a significant number of trees were added along streets for this scenario. The large number of trees within street canyons (i.e. narrow streets with significant infrastructure and human activity) often lead to dust getting trapped, which in turn leads to more PM10 in the air and has the opposite effect of the desired. Within the NK-Model, trees have the highest capacity for PM10 retention, which would lead to an overrepresentation of the ecosystem service within the Green Network scenario. While PM10 retention and the associated economic benefits do not differ largely for the Green Neighbourhoods and Urban Parks scenarios, the distribution of the ecosystem service significantly differs. The distribution of the changes in air quality regulation for these scenarios is presented in Figure 3.7, expressed in kg/yr. For the Green Neighbourhoods scenario, changes in vegetation are distributed all around the core of the city and surrounding rings in a somewhat homogeneous fashion, while in the Urban Parks scenario the main changes include alterations in vegetation within existing parks and expansions of existing green areas. This is clearly visible in Figure 3.7, where increases in PM10 retention are observed mainly in these areas. In the Urban Parks scenario, PM10 retention decreases in some areas (in red). These are areas where trees were replaced by shrubs or grass, which have a lower capacity for PM10 retention.

RIVM Letter report 2019-0021
Page 43 of 79
Table 3.1: Total changes in ecosystem service values compared to the BAU scenario (scenario-BAU2025). Aggregation of the different ecosystem services is strongly discouraged as there are overlaps within the elements covered by different indicators, giving way to double-counting. The strategies considered within each scenario are not meant to be viewed as alternatives to one another but as different elements of the Quality Impulse Green.
Ecosystem Service Indicator Unit Green
Neighbourhoods Green
Network Metropolitan Landscape
Urban parks
Air quality PM10 retention thousand kg/yr 2.4 - 0 2.7
PM10 retention million €/yr 0.13 - 0 0.15 Health Reduction in probability of being overweight % 0 1.0 2.0 3.0
Reduced number of visits to GP thousand visits/yr 3 2 0 1
Reduced health costs due to urban green million €/yr 2.4 1.9 0 1.0
Reduced health-related labor costs due to urban green million €/yr 11.8 9.0 0 5.0
Physical activity Additional time spent on outdoor physical activity million min/yr 0.3 0.3 - 0.2
Cycling million km/yr 143 49 214 199
Cycling km/person/yr 137 47 205 190
Time spent cycling to-from work million min/yr 0.5 0.4 - 0.1
Avoided premature deaths from cycling to-from work lives/yr 4 3 - 1
Avoided premature deaths from cycling to-from work million €/yr 12 9 - 3
Property value Contribution to property value million € 51 41 0 12 Recreation Visits to recreation areas million visits/yr 0 0 10 19
Visitation expenditures million €/yr 0 0 49 88 Urban cooling Decrease in temperature degrees C 0.0 0.0 0 0.0
Area with >1.5 degrees C cooling by green thousand ha 9 7 0 1
Area with >2 degrees C cooling by green thousand ha 9 8 0 4
Area with >2.5 degrees C cooling by green thousand ha 0 6 0 3 Water storage Reduced rainwater in sewers million m3/yr 1.2 1.1 0 0.8
Reduced water treatment costs million €/yr 0.9 1.1 0 0.6

RIVM Letter report 2019-0021
Page 44 of 79
Table 3.2: Changes in ecosystem service values compared to the BAU scenario (scenario-BAU2025). Changes are calculated per ha of green added. Changes in ecosystem service values not associated with changes in green space are not considered in this table. Aggregation of the different ecosystem services is strongly discouraged as there are overlaps within the elements covered by different indicators, giving way to double-counting. The strategies considered within each scenario are not meant to be viewed as alternatives to one another but as different elements of the Quality Impulse Green.
Ecosystem Service Indicator Unit Green
Neighborhoods Green
Network Metropolitan Landscape
Urban parks
Air quality PM10 retention kg/green ha/yr 9.6 - - 8.9
PM10 retention thousand €/green ha/yr 0.54 - - 0.47 Health Reduced number of visits to GP visits/green ha/yr 11 5 - 4
Reduced health costs due to urban green thousand €/green ha/yr 10 4 - 3
Reduced health-related labor costs due to urban green thousand €/green ha/yr 47 21 - 16
Physical activity Time spent on outdoor physical activity thousand min/green ha/yr 1.1 0.8 - 0.6
Time spent cycling to-from work thousand min/green ha/yr 2.2 0.9 - 0.5
Avoided premature deaths from cycling to-from work lives/green ha/yr 0.016 0.007 - 0.003
Avoided premature deaths from cycling to-from work thousand €/green ha/yr 46 20 - 9
Property value Contribution to property value thousand €/green ha 202 95 - 40 Recreation Visits to recreation areas thousand visits/green ha/yr - - - -
Visitation expenditures thousand €/green ha/yr - - - - Water storage Reduced rainwater in sewers thousand m3/green ha/yr 4.8 2.4 - 2.5
Reduced water treatment costs thousand €/green ha/yr 3.8 2.6 - 2.0

RIVM Letter report 2019-0021
Page 45 of 79
Figure 3.7: Difference between the value for ‘air regulation’ in the Business-As-Usual scenario compared to the green infrastructure scenarios
Health 3.2.2The health benefits generated by green infrastructure within every scenario are expressed as changes in four indicators, as visible in Table 3.2. First, the change in the probability for being overweight, depending on the percentage of green space surrounding a household, was modelled. Here, the Green Network scenario witnesses a higher overall benefit (a reduction of 14.3%) as compared to the Green Neighbourhoods and Urban Parks scenarios. This is possibly due to the modelling approach, which considers the percentage of green space within a 3km buffer as input (see Appendix 2). As such, the overall increase in green has a higher effect than the distribution of green. The Green Network scenario has the highest increase in vegetation, explaining the higher reduction in the probability of being overweight.

RIVM Letter report 2019-0021
Page 46 of 79
To measure changes in the contribution of green space to general health, health-related labour costs, and avoided visits to GPs, the NK-Model was implemented. Within the Model, the percentage of green within a buffer of 1km is considered as the main factor affecting urban health. As such, the distribution and distance to green space surrounding a household play an important role in the delivery of these benefits. Increases in green space in the Green Neighbourhoods scenario are homogeneously distributed throughout city’s centre and surrounding rings, leading to the highest increase in health benefits compared to other scenarios. Moreover, the changes in green infrastructure within this scenario take place within Amsterdam’s most densely populated areas, leading to more beneficiaries and a higher increase in the value generated. The distributions of the benefits accrued through the implementation of strategies in each green infrastructure scenario, estimated using the NK-Model, are illustrated in Figure 3.8.
Physical activity 3.2.3For the ecosystem service ‘physical activity’, mixed results were found. Fluctuations in the additional time spent on outdoor physical activity are mainly dependent on changes in the percentage of green space within a 1km buffer and changes in population density. Increases in the percentage of green space in an area lead to a more than proportional increase in outdoor physical activity. As such, the total amount of green is as important as its distribution within a buffer. For this indicator, the highest benefit is projected to occur within the Green Network scenario. When measuring the influence of green space on cycling to-from work, as well as its associated benefits (i.e. avoided premature deaths and reduced health costs), the Green Neighbourhoods scenario seems to accrue the highest benefit. This is likely the case since green space is introduced homogeneously across the city, including areas where there is currently little to no green and are thus areas where high amount of benefits can be accrued. The changes in the time spent cycling for commuting purposes resulting from increases in green space, are visible in Figure 3.9.

RIVM Letter report 2019-0021
Page 47 of 79
Figure 3.8: Difference between the value for ‘health’ in the Business-As-Usual scenario compared to the green infrastructure scenarios

RIVM Letter report 2019-0021
Page 48 of 79
Figure 3.9: Difference between the value for ‘physical activity’ in the Business-As-Usual scenario compared to the green infrastructure scenarios

RIVM Letter report 2019-0021
Page 49 of 79
Although the association between the lengths of cycling lanes and kilometres cycled does not reflect benefits generated by green infrastructure per se, its inclusion was requested since cycling-lane extensions reflect an improvement in the quality and accessibility of green and blue areas. To calculate fluctuations in total cycling due to the extension or creation of bike lanes, a simple estimate was made, whereby the increase in cycling is proportional to the increase in the length of bike lanes. Since the Metropolitan Landscape scenario includes a significant expansion in the length of bike lanes within the city, this scenario also witnesses the highest increase in cycling.
Property value 3.2.4
Figure 3.10 shows difference maps for property values for every scenario. These maps reveal very few areas where a noticeable change in property value occurs. Factors influencing the value of property include the proximity of a residence to parks, and its visibility of trees and water. The main change within scenarios that would thus affect residence property values includes their access to trees, as all other factors remain constant. Within the Green Network and Green Neighbourhoods scenarios, trees are added within areas where a few or no trees were found, significantly raising the value of property. As such, these two scenarios show the highest relative increases in property value. Within the Urban Parks scenario, trees are either added to existing parks, having a relatively low or neutral effect on property value, or within new parks. Additionally, the creation of new parks can generate significant contributions to property value, however, for a confined number of residences. As such, the increase in property value is relatively lower within the Urban Parks scenario as compare to the Green Network and Green Neighbourhoods scenarios.
Recreation 3.2.5In Amsterdam, the number of visits to recreational areas is expected to increase sharply throughout the upcoming years, due to the high demand from a growing population. The strategies in Amsterdam’s Quality Impulse Green aim to enhance not just the quantity but also the quality of green spaces throughout the city. The scenarios Green Neighbourhoods and Green Network do not comprise strategies for addressing the management of recreational areas. As such, the visitation rate is not expected to change, compared to the Business-As-Usual situation. Within the Metropolitan Landscape and Urban Parks scenarios, the maintenance and management of a number of recreational sites is enhanced. This in turn leads to certain recreational areas shifting from extensive to intensive use, increasing their attractiveness for recreational visits. In 2025, enhanced management of recreational areas is expected to accommodate 10 million additional visitors provided the implementation of the Metropolitan Landscape scenario, and 19 million provided the implementation of the Urban Parks scenario. The distribution of new visits differs from new visits in urban parks in the Urban Parks scenario, to visits in metropolitan areas in the Metropolitan Landscape scenario.

RIVM Letter report 2019-0021
Page 50 of 79
Figure 3.10: Difference between the value for ‘property’ in the Business-As-Usual scenario compared to the green infrastructure scenarios

RIVM Letter report 2019-0021
Page 51 of 79
Urban cooling 3.2.6Just as with changes in the delivery of other ecosystem services quantified in this study, the distribution of vegetation plays a significantly influential role on the distribution of urban cooling across the city. As such, areas where new vegetation has been added experience the highest reductions in temperature, as can be seen in Figure 3.11. Similar to the ecosystem service ‘air quality regulation’, trees tend to have a higher capacity to reduce temperature, followed by shrubs and grass at last. As such, areas where a high number of trees is added will see the highest reductions in temperature.
Water storage 3.2.7The amount of water stored by green spaces is correlated with the amount of vegetation in an area. As such, areas where more vegetation is added tend to experience the highest increases in water stored. This is clearly visible in Figure 3.12, where increases in water storage are visible particularly in areas where green is added. Within the Green Neighbourhoods scenario, the increase is sparsely distributed throughout Amsterdam’s central areas, while in the Green Network scenario, increases in water storage are mainly seen along areas where the city’s ecological network is expanded. In the Urban Parks scenario, increases are mainly seen in recreational areas, where green spaces were extended or made greener.

RIVM Letter report 2019-0021
Page 52 of 79
Figure 3.11: Difference between the value for ‘urban cooling’ in the Business-As-Usual scenario compared to the green infrastructure scenarios

RIVM Letter report 2019-0021
Page 53 of 79
Figure 3.12: Difference between the value for ‘water storage’ in the Business-As-Usual scenario compared to the green infrastructure scenarios

RIVM Letter report 2019-0021
Page 54 of 79
3.3 Associations between ecosystem services Ecosystem services are often analysed independently from one another within ecosystem service assessments. In reality, ecosystem services do not behave as individual elements in a vacuum but as interconnected parts of a network. They coexist across space and time as bundles of services that are associated with one another, often in a non-linear fashion (Bennett et al., 2009). It is crucial to understand these associations when analysing the implications of ecosystem change (Hattam et al., 2015). In essence, an increase the availability an ecosystem service can be associated with an increase or even a decrease, in the availability of another ecosystem service (Lester et al., 2013; Mouchet et al., 2014). One way to illustrate these trade-offs is by creating amoeba diagrams. Figure 3.13 presents amoeba diagrams depicting relative values for ecosystem services across the four green infrastructure scenarios. Relative values were calculated by dividing the total value for an indicator within a particular scenario against the average value for the same indicator for all four scenarios. Indicators in the amoeba diagrams showing values higher (lower) than 1 suggest that the total quantity measured for that indicator within that scenario is higher (lower) than the average of the same indicator for all scenarios. In other words, the value of the indicator for a particular scenario is higher (lower) than average. For the Green Network scenario, the indicator for the ecosystem service ‘air quality regulation’ is excluded since, as previously mentioned, the model implemented does not consider the negative effect of street canyons on air quality. Expected values for particular indicators across scenarios do not vary significantly (value≈1) with a few exceptions. Within the Metropolitan Landscape scenario, indicator values are generally lower than average since the scenario comprises no changes in land cover so the values for most indicators are equivalent to the values obtained for the BAU situation. Other scenarios generally witness an increase in ecosystem service delivery compared to the BAU situation, due to additions in vegetation. Moreover, the cycling indicator for physical activity is correlated with the length of cycling lanes, which is why the indicator is significantly higher where bike lanes experience significant expansions (i.e. Metropolitan Landscape and Urban Parks) and lower where bike-lane expansion is relatively low (i.e. Green Neighbourhoods and Green Network). Changes in the recreation indicator depend on whether increased management measures are taken in recreational areas or not. This explains why scenarios where enhanced management of recreational areas takes place (i.e. Metropolitan Landscape and Urban Parks) see a significantly relatively higher value for recreation, compared to scenarios where no enhanced management takes place (i.e. Green Neighbourhoods and Green Networks). Since the ‘cycling to-from work’ measure for physical activity has a positive relationship to the amount of green, all scenarios see an increase in the indicator, except for the Metropolitan Landscape scenario, where green remains constant. In terms of health benefits, the Green Neighbourhoods and Green Network scenarios seem to yield the highest relative benefits.

RIVM Letter report 2019-0021
Page 55 of 79
Figure 3.13: Relative values of ecosystem services across different scenarios (total value of scenario/average of four green infrastructure scenarios). For every ecosystem service, one indicator is presented per model used (in cases where one model leads to more than one indicator). Values higher (lower) than 1 imply that the value for that ecosystem service indicator for a scenario is higher (lower) than the average for all scenarios. For illustrative purposes, the origin was set at 0.9, accentuating relative changes in indicators across scenarios.
Green Neighbourhoods Green Network
Metropolitan Landscape Urban Parks
1 1
1 1

RIVM Letter report 2019-0021
Page 56 of 79
Amoebas can also be generated by comparing total values for each scenario against BAU values. Values can be shown as the ratio or the percentage difference between the scenario and the BAU situation. This approach was not adopted to develop the amoeba diagrams since the Metropolitan Landscape scenario experiences significantly large increases for the recreation and one physical activity (i.e. cycling) indicators. As such, relative changes in other indicators, which were relatively smaller, would be difficult to distinguish, defeating the purpose of the illustration. Table 3.3 provides an overview of the relative values of ecosystem service indicators compared to BAU values, as ratios. By analysing the Table, it becomes clear that the Green Neighbourhoods and Green Network scenarios generate the highest relative increases in ecosystem service values for most indicators considered, followed by the Urban Parks and, finally, the Metropolitan Landscape scenarios. It is worth repeating that scenarios are not meant to be viewed as alternatives but rather as different aspects from Amsterdam’s Quality Impulse Green. Hence, the values here presented serve as a means to provide information on how different strategies from the Quality Impulse Green could influence ecosystem services amounts. Table 3.3: Relative values of ecosystem service against the BAU situation. every ecosystem service, one indicator is presented per model used (in cases where one model leads to more than one indicator). For each indicator, the total value for each scenario is divided by the average of all four scenarios. Values higher (lower) than 1 imply that the value for that ecosystem service indicator for that scenario is higher (lower) than the value within the BAU scenario.
Ecosystem Service Indicator Green
Neigh. Green Netw.
Metro. Lands.
Urban parks
Air quality PM10 retention 1.01 1.00 1.01
Health Reduction in probability of being overweight 1.00 1.14 1.00 1.14
Reduced health costs due to urban green 1.07 1.06 1.00 1.03
Physical activity Additional time spent on outdoor physical activity 1.12 1.15 1.00 1.08
Cycling 1.14 1.05 1.21 1.20
Time spent cycling to-from work 1.02 1.01 1.00 1.01
Property value Contribution to property value 1.00 1.00 1.00 1.00
Recreation Visits to recreation areas 1.00 1.00 1.05 1.09 Urban cooling Decrease in temperature 1.01 1.01 1.00 1.00
Water storage Reduced rainwater in sewers 1.04 1.03 1.00 1.02

RIVM Letter report 2019-0021
Page 57 of 79
4 Discussion and conclusions
An innovative spatial strategy is required to accommodate the needs of Amsterdam’s growing population, if it wishes to maintain a robust economy while fostering a good quality of life and tackling the critical environmental challenges of our time. The Structural Vision 2040 envisions the solutions that are required to tackle these challenges. The strategies designed to achieve these solutions were envisioned in Amsterdam’s Green Agenda 2015-2018 (Gemeente Amsterdam, 2015) and will be further formulated within the Quality Impulse Green (Gemeente Amsterdam, 2017). To understand the consequences of the implementation of these strategies, a quick scan was requested, evaluating the potential effect of their implementation on the health and well-being of Amsterdam’s citizens. This study explored how the implementation of different green infrastructure measures from the Quality Impulse Green could impact Amsterdam’s natural capital and the ecosystem services it generates. Urban design firm De Urbanisten designed four scenarios capturing strategies from the Quality Impulse Green. Scenarios, expressed as maps, illustrate the potential distribution of new green infrastructure measures in Amsterdam by the year 2025. Input maps on one Business-As-Usual (BAU) (i.e. only population growth and residential expansions considered) and the four scenarios considering changes in green infrastructure, served as input for the quantification and mapping of ecosystem services in the year 2025. Indicators adopted as proxies for ecosystem services consider biophysical, economic, and social values. Described hereunder are this study’s main findings, limitations, and recommendations for future research. The Section discusses the main factors identified as influential for ecosystem service delivery across scenarios. It puts into perspective the limitations and recommendations necessary to make adequate use of this study’s results. Finally, the benefits (and costs) that strategies from the Quality Impulse Green could generate for the city of Amsterdam, are described.
4.1 Supply and demand In most cases, the main factor influencing ecosystem service supply (production) was the vegetation cover, including the amount, type, and distribution of vegetation. In terms of ecosystem service demand (use), the main influential factor was population density, which determines both ecosystem service usage and environmental pressures.
Supply 4.1.1Vegetation characteristics played a deterministic role in the delivery of ecosystem services within this study. Results reveal a general increase in ecosystem service delivery as a result of increases in the amount of green. Vegetation cover was classified intro three main types: trees, shrubs, and grass. Within various models, trees have a higher positive effect on the delivery of ecosystem services (e.g. air quality regulation; urban cooling) than shrubs and grass, at last. Aside from the amount

RIVM Letter report 2019-0021
Page 58 of 79
and type of vegetation, its distribution plays a key role. Areas where the relative increase in vegetation is high (e.g. from none or low, to high amounts of green), often experience sharper increases in ecosystem service delivery. This might explain why the Green Neighbourhoods and Green Network scenarios score highest for most ecosystem service indicators, compared to other scenarios. These two scenarios are characterized by not just a higher amount, but also a more homogenous distribution of green, compared to the Urban Parks and Metropolitan Landscape scenarios. This includes adding green in areas where green is currently rather scarce, such as the central and old south areas.
Demand 4.1.2The ecosystem services concept is anthropocentric in nature, since the demand for an ecosystem service only exists if humans can benefit from it. This is why, in most cases, the highest demand for ecosystem services was found within densely populated areas. However, this study also makes reference to ecosystem service bundles, where ecosystem services act as interdependent elements of a system that influence one another. As such, all natural systems provide, to some extent, benefits to humans and their well-being. Demand for ecosystem services also exists when environmental pressures detrimental to human beings need to be mitigated. To a large extent, environmental pressures are determined by population density (e.g. the urban heat island effect; air pollution), another reason why densely populated areas often experience higher ecosystem service demand.
4.2 Limitations Qualitative assessment 4.2.1
A number of relevant ecosystem services were not included within this study. This resulted from restrictions in models, data, and time required to quantify a broader set of ecosystem service indicators. Additional models and indicators are required to quantify ecosystem services not considered in this study, such as biodiversity (often not considered an ecosystem service), and to monetize all ecosystem services not reflected in monetary units. The quantification of ecosystem services that are qualitative in nature (e.g. the spiritual or intrinsic value of nature) is subject to controversy, since defining boundaries and concepts proves a highly subjective task. This often leads to a lack of evidence on the relationship between natural elements and the qualitative values people assign to them. Socio-cultural ecosystem services can be quantified through the use of proxy indicators and through participatory processes. Participatory processes are time and resource intensive. This is why, in this study, only one socio-cultural ecosystem service (i.e. recreation) was quantified, using both physical and monetary proxy-indicators.
Aggregation 4.2.2Aggregating ecosystem service indicators is strongly discouraged. A common way of aggregating ecosystem services is by normalizing quantified indicators and subsequently obtaining their sum or average. However, this practice assumes that all ecosystem services have the same weight, which is unlikely to be the case. One way to solve for this is by assigning different weights to ecosystem services, based on stakeholder preferences obtained through participatory exercises, or

RIVM Letter report 2019-0021
Page 59 of 79
based on expert judgment. However, this reduces the objectivity of the results obtained, resulting in a lower degree of accuracy. Moreover, each ecosystem service can be measured in a variety of metrics, quantified through the use of more than one model. This can lead to conflicting changes in different indicators adopted to represent one ecosystem service. For instance, in this study three different indicators were used to quantify the health benefits of urban green, all of them yielding different results (e.g. reduction in the probability of being overweight vs. reduction in visits to GP). Aggregation can also lead to double-counting, which occur when there are overlaps within the elements covered by different indicators. This leads to the inflation of ecosystem service values where double-counting takes place, at the expense of the remaining ecosystem services. Moreover, this study does not discern between intermediate and final benefits (e.g. PM10 retention is an intermediate benefit, while the reduction of diseases associated with PM10 retention is a final benefit), which can also lead to double-counting.
Monetization 4.2.3It is inappropriate and not recommended to aggregate monetized ecosystem service indicators since the value generated can be misleading and may be easily misconstrued. Firstly, not all ecosystem service indicators were monetized. For instance, in addition to reduced sewage costs, water storage leads to a reduction in the risk of flooding and the associated costs, yet the latter was not included in this study. Furthermore, various ecosystem services were not considered in this study, due to restrictions in time, models, and data. One example is biodiversity, which although often not considered an ecosystem service, underpins ecosystem service delivery. The aggregation of monetized ecosystem service indicators may lead to the overstatement of monetized values against non-monetized values. Aggregating monetized ecosystem service indicators may also lead to overstated values due to the potential occurrence of double-counting (i.e. adding two or more indicators that partially overlap).
Model uncertainty 4.2.4For this study, the Natural Capital Model (NK-Model) was used, alongside additional calculations developed for this study’s purpose (Remme et al., 2018). The NK-Model is currently under development and undergoing its first implementation stages. This study made use of published urban subset of models from the NK-Model. Additional models developed for this study have not been published and are not all based on peer-reviewed literature. Table 4.1 presents a qualitative overview on the level of uncertainty associated with the models adopted.

RIVM Letter report 2019-0021
Page 60 of 79
Table 4.1: A qualitative overview on the degree of uncertainty per ecosystem service model. For every ecosystem service, one indicator is presented per model (in cases where one model leas to more than one indicator). The degree of uncertainty is categorized into three levels: moderately uncertain, uncertain, and very uncertain.
Ecosystem Service Indicator
Uncertainty
level Air quality PM10 retention
Health Reduction in probability of being overweight
Reduced health costs due to urban green
Physical activity
Additional time spent on outdoor physical activity
Cycling
Time spent cycling to-from work
Property value Contribution to real estate value
Recreation Visits to recreation areas
Urban cooling Decrease in temperature
Water storage Additional storage by green areas
Moderately uncertain: Based on published models, based on peer-reviewed literature
Uncertain: Based on peer-reviewed literature
Very uncertain: Not based on peer-reviewed literature
Identified model-related uncertainties result mainly from the lack of evidence necessary to model ecological functions (e.g. water retention by vegetation and soil in cities) and their benefits (e.g. relationship between green spaces and cycling) at various scales and levels of urbanization. This sometimes led to the adoption of relationships which are either too general (e.g. the application of Dutch relationships to the Amsterdam scale) or somewhat outdated (e.g. modelling visits to GPs based on Maas (2008). In some cases, associations have either only been discussed in theory (e.g. association between cycling-lane length and cycling) or may lead to contradicting conclusions (e.g. studies showing both positive and negative relationships between green space and cycling). Where no relationships were found (i.e. cycling, visits to recreational areas, expenditures made in recreational areas), extrapolations were made based on statistical trends. These are to be used with precaution since they constitute a high degree of uncertainty and were rather produced as a means of comparison among ecosystem service indicators. Provided the substantial amount of readily available Dutch data (input maps) relevant for modelling relationships between green spaces and

RIVM Letter report 2019-0021
Page 61 of 79
ecosystem services, it would be useful to place more efforts in conducting new studies that provide insights on current relationships between green space and ecosystem service indicators, and at various scales (city, region, areas with similar demographic structures).
4.3 Uses and recommendations This study’s results serve as an instrument to (1) inform decision-makers on the value of natural capital, (2) communicate the value of natural capital to citizens, (3) evaluate the consequences of changes in natural capital (e.g. based on trends or policy strategies) on human well-being. This study’s results are not meant to be used for forecasting purposes or for analysing the actual cell-by-cell distribution of ecosystem services. While methods for quantifying and mapping ecosystem services have seen significant advances in the last decades, various models constitute a high degree of uncertainty, due to limitations in data and knowledge or evidence. It is important to bear these points in mind when using ecosystem service assessment results to support decision-making. Future research should focus on the further development of models for quantifying and mapping ecosystem services at different scales. For instance, models tailored to the Netherlands and more specifically to different regions or levels of urbanization could lead to more accurate results and conclusions. This would enhance the explanatory and predictive capability of such models to support spatial planning. Participatory semi-quantitative models could also be adopted to identify stakeholder preferences and their knowledge gaps regarding ecosystem services. This could shed light on niches that require further attention by decision-makers involved in spatial planning, contributing to inclusive and legitimized decision-making.
4.4 Implications for Amsterdam’s Structural Vision Amsterdam’s Structural Vision 2040 laid out an ambitious mission of achieving an economically robust, internationally competitive, and sustainable city by the year 2040 (Gemeente Amsterdam, 2011). The four strategies designed to address this challenge were embodied in Amsterdam’s Green Agenda 2015-2018 and is further developed within the Quality Impulse Green (Gemeente Amsterdam, 2015, 2017). Green infrastructure includes a range of societal benefits, improving health, water storage and recreation. This study showed that the average benefits for the different strategies range between 1 and 5 €/m2/year. An overview on the way in which each green infrastructure scenario can contribute to the objectives addressed by each strategy, is presented below. To avoid confusion, it is worth mentioning that the names from the strategies from the Green Agenda and Quality Impulse Green (Gemeente Amsterdam, 2015) may overlap with the names that were given to green infrastructure scenarios.
Quality Impulse Green strategy 1: Urban Parks 4.4.1Park visitation rates have sharply risen in Amsterdam throughout the past decades, a continuing trend (Gemeente Amsterdam, 2015). The rising demand for green recreational sites is addressed by the strategy ‘Urban Parks’ (Stadsparken) (Gemeente Amsterdam, 2015). The

RIVM Letter report 2019-0021
Page 62 of 79
strategy proposes an increase in the quality and availability of green spaces for recreational use, addressing the rising demand for recreational sites while also reducing pressure on sites where use is highly intensive (e.g. Vondelpark). The increase in quality of green recreational sites includes altering the vegetation in parks in order to ensure the appropriate dryness of the grass, while ensuring that the quality of the soil remains constant. This strategy is addressed by the Urban Parks and Metropolitan Landscape scenarios. Within the two scenarios, recreational areas are expanded, their quality is enhanced through an increase in their management level, and accessibility is enhanced through the expansion of cycling and walking paths. This study’s results show that the implementation of these scenarios will lead to a higher use of green spaces, with a redistribution of recreational visits to urban parks where use is currently non-intensive, and to green areas in the outskirts of the city, which will be made more accessible. Moreover, all scenarios entail an increase in outdoor physical activity due to the expansion of green areas, accentuating the need for not just more but also higher quality green.
Quality Impulse Green strategy 2: Climate and biodiversity 4.4.2Climate change leads to more severe weather extremes, such as heatwaves and more intense precipitation, posing a risk to people living in cities. The strategy ‘Climate and Biodiversity’ (Klimaat en biodiversiteit) addresses the challenges posed by climate change by increasing the overall area that green spaces cover, thereby also enhancing biodiversity (Gemeente Amsterdam, 2015). Strategies for expanding green coverage include the implementation of green roofs and areas for rainwater storage where it poses a risk. This strategy is addressed by the Green Neighborhoods, Green Network, and Urban Parks scenarios, which comprise a substantial increase in the amount of green throughout the Amsterdam region. Green space has a positive effect on the amount of water stored from rainfall. It also contributes to lower temperatures during warm days, reducing the heat island effect commonly experienced by cities. As such, it can contribute to tackling the weather extremes that result from climate change, positively affecting people’s health and well-being. Green spaces also contribute to enhancements in biodiversity, playing a crucial role as habitats for various organisms. However, biodiversity was not quantified in this study, due to time, model, and data restrictions.
Quality Impulse Green strategy 3: Green Neighbourhoods 4.4.3Green areas in local neighbourhoods are important sites of social cohesion, while also providing a number of additional benefits, such as enhanced health and improved air quality. The strategy ‘Green Neighbourhoods’ (Groen in de buurt) targets an increase in the quality and availability of green spaces in Amsterdam’s neighbourhoods (Gemeente Amsterdam, 2015). This includes adding more green elements in the near vicinity of households and making green spaces available for local residents (children, elderly, people with disabilities) to engage in green initiatives.

RIVM Letter report 2019-0021
Page 63 of 79
The scenario Green Neighbourhoods addresses this strategy directly, making green spaces available in the near vicinity of households. The effects of small, sparsely-distributed green spaces on social cohesion, were not quantified, due to model, data, and time restrictions. However, it is clear that adding green in the near vicinity of households can deliver an array of additional benefits to Amsterdam’s residents. The implementation of this scenario was found to generate substantial benefits in terms of air quality, physical activity, health, property value and heat reduction. This is especially the case in areas where green is currently scarce.
Quality Impulse Green strategy 4: Green Networks and accessibility 4.4.4The rate at which people recreate in green spaces in Amsterdam is sharply rising. A large portion of recreational visits remains within a limited number of recreational spaces (e.g. Vondelpark, Westerpark), despite the increasing rate of visitation to these sites. This results, in part, from the lack of appropriate infrastructure required for people to reach other existing green areas. The strategy ‘Green Networks and Accessibility’ (Verbindingen en toegankelijkheid) entails an improvement in the city’s ecological network and its accessibility (Gemeente Amsterdam, 2015). Enhancing accessibility to green elements includes expanding and interconnecting existing walking and cycling paths. The enhancement of ecological networks is addressed by the scenario Green Network, while the scenario Metropolitan Landscape addresses the need to improve accessibility to green spaces. Green networks are a useful way to enhance biodiversity. This ecosystem service was not quantified in this study due to time, model, and data restrictions. However, ecological networks were also found to generate significant contributions to temperature decrease, water storage, and the amount of time people spend on physical activity. The implementation of the Metropolitan Landscape scenario could additionally lead to significant increases in cycling and recreation in the outskirts of the city, due to the significant improvement in accessibility to green areas.

RIVM Letter report 2019-0021
Page 64 of 79

RIVM Letter report 2019-0021
Page 65 of 79
References
Arcadis & CE-Delft, 2018. Werkwijzer Natuur: Maatschappelijke Kosten-Baten Analyses.
Bennett E.M., Peterson G.D., Gordon L.J., 2009. Understanding relationships among multiple ecosystem services. Ecol Lett.
CE-Delft, 2017. Handboek Milieuprijzen 2017. Methodische onderbouwing van kengetallen gebruikt voor waardering van emissies en milieu-impact. Publicatienummer: 17.7A76.64, Delft.
Czembrowski P., & Kronenberg J., 2016. Hedonic pricing and different urban green space types and sizes: Insights into the discussion on valuing ecosystem services. Landscape and Urban Planning. 146. 11-19.
Franco S.F., & Macdonald J.L., 2017. Measurement and valuation of urban greenness: Remote sensing and hedonic applications to Lisbon, Portugal. Regional Science and Urban Economics.
Gemeente Amsterdam, 2011. Amsterdam 2040 Economisch Sterk en Duurzaam. Amsterdam.
Gemeente Amsterdam, 2015. Agenda Groen 2015-2018: Investeren in de Tuin van de Amsterdammer. Amsterdam.
Gemeente Amsterdam, 2017. Tussenrapportage Ruimte voor de Stad: naar een metropool op menselijke maat. Amsterdam.
Hattam C., Atkins, J.P., Beaumont N, Börger, T., Böhnke-Henrichs, A., Burdon, D., De Groot R., Hoefnagel, E., Nunes, P.A.L.D., Piwowarczyk, J., et al., 2015. Marine ecosystem services: Linking indicators to their classification. Ecol Indic. 49:61–75.
Kahlmeier S., Götschi T., Cavill N., Castro Fernandez A., Brand, David Rojas Rueda C., Woodcock J., Kelly P., Lieb C., Oja P., Foster, Harry Rutter C., Racioppi F., 2017. Health economic assessment tool (HEAT) for walking and for cycling. Methods and user guide on physical activity, air pollution, injuries and carbon impact assessments. World Health Organization.
Kelly P., Kahlmeier S., Götschi T., Orsini N., Richards J., Roberts N., ... & Foster C., 2014. Systematic review and meta-analysis of reduction in all-cause mortality from walking and cycling and shape of dose response relationship. International journal of behavioral nutrition and physical activity. 11(1). 132.
Klompmaker J.O., Hoek G., Bloemsma L.D., Gehring U., Strak M., Wijga A.H., ... & Janssen N.A., 2018. Green space definition affects associations of green space with overweight and physical activity. Environmental research. 160. 531-540.
KPMG, 2012. Groen, gezond en productief. The Economics of Ecosystems & Biodiversity (TEEB NL): natuur en gezondheid.
Lauwaet D., Hooyberghs H., Maiheu B., Lefebvre W., Driesen G., Van Looy S., De Ridder K., 2015. Detailed Urban Heat Island projections for cities worldwide: dynamical downscaling CMIP5 global climate models. Climate, 3, 391-415.
Lester S.E., Costello C., Halpern B.S., Gaines S.D., White C., Barth J.A., 2013. Evaluating tradeoffs among ecosystem services to inform marine spatial planning. Mar Policy. 38:80–89.

RIVM Letter report 2019-0021
Page 66 of 79
Luttik J. & Zijlstra M., 1997. Woongenot heeft een prijs; Het waardeverhogend effect van een groene en waterrijke omgeving op huizenprijzen. Wageningen SC-DLO (Rapport 562).
Maas J., 2008. Vitamin G: green environments-healthy environments (Doctoral dissertation. NIVEL).
Maas J., Verheij. R. A., Spreeuwenberg. P., & Groenewegen. P.P., 2008. Physical activity as a possible mechanism behind the relationship between green space and health: a multilevel analysis. BMC public health. 8(1). 206.
Mouchet M.A., Lamarque P., Martín-López B., Crouzat E., Gos P., Byczek C., Lavorel S., 2014. An interdisciplinary methodological guide for quantifying associations between ecosystem services. Glob Environ Chang. 28:298–308.
Provincie Noord Holland, 2016. Bezoekersonderzoek natuur- en recreatiegebieden Noord Holland 2016.
Remme R., de Nijs T., Paulin M., 2018. Natural Capital Model: Technical documentation of the quantification, mapping, and monetary valuation of urban ecosystem services. National Institute for Public Health and the Environment (2017-0040).
RIVM, 2003 onwards. Cijfertool kosten van ziekten met cijfers uit de 'kosten van ziektestudie’. RIVM, Bilthoven.
Romijn, G. & Renes, G., 2013. Algemene leidraad voor maatschappelijke kosten-batenanalyse. Central Planbureau voor de Leefomgeving.
Ruijgrok E.C.M., Smale A.J., Zijlstra R., Abma R., Berkers R.F.A., Németh A.A., Asselman N., de Kluiver P.P., de Groot D., Kirchholtes U., Todd P.G., Buter E., Hellegers P.J.G.J. and Rosenberg F.A., 2006. Kentallen Waardering Natuur, Water, Bodem en Landschap, Hulpmiddel voor de MKBA. Witteveen+Bos, commissioned by Ministerie van Landbouw Natuurbeheer en Voedselkwaliteit, The Hague.
Staatsen B., van der Vliet N., Kruize H., et al. 2017. INHERIT: Exploring triple-win solutions for living, moving and consuming that encourage behavioural change, protect the environment, promote health and health equity. EuroHealthNet, Brussels.
Steenbeek R., Hooftman W., Geuskens G., Wevers C., 2010. Objectiveren van gezondheidsgerelateerde non-participatie en de vermijdbare bijdrage van de gezondheidszorg hieraan. TNO, TNO-rapport 2010.171/13738.01.01.
Wesseling J., van der Zee S., van Overveld A., 2011. Het effect van vegetatie op de luchtkwaliteit. National Institute for Public Health and the Environment (680705019/201).

RIVM Letter report 2019-0021
Page 67 of 79
Appendix 1 Social cost-benefit analysis
The Nature Guideline (Arcadis & CE-Delft, 2018) lays out a number of steps that should be fulfilled when conducting SCBAs regarding policies that lead to changes in natural capital in the Netherlands. Hereunder, the steps are presented in brief and insights are provided on the steps that are covered within this report. Table A1: Criteria that need to be covered within a SCBA to meet the guidelines expressed within the ‘General guidelines for social cost-benefit analyses’ (Romijn & Renes, 2013) and the ‘Nature Guideline’ (Arcadis & CE-Delft, 2018). Column 2 presents the location within this report where each step is represented (unless stated otherwise). Step Report section 1. Structuring the SCBA Problem analysis and scope 1, 4.3 Policy alternatives/scenarios 2.2, 4.4 Reference alternative 2.2 Market demarcation Amsterdam Rule of half Not considered 2. Determining the physical changes in nature Expected and unexpected changes 2.2, 2.5 Uncertainties within predicted changes 4.2 3. From physical changes in nature to effects on human well-being Effects on human well-being from changes on ecosystem services 3.1, 3.2
Quantification of relevant ecosystem services 3.1 Quantification of changes in ecosystem services 3.2 Dealing with biodiversity Not considered 4. Valuation of effects on human well-being Implementation advice regarding valuation methods 4.2, 4.3, 4.4 Overview and description of valuation methods 2.3, 2.4, 2.5 Use of benefit transfers 2.4 5. Determine the costs Relevant costs Not considered Taxes and subsidies Not considered 6. Uncertainties and risks Future, policy, and knowledge uncertainties 2.4, 4.2 How to deal with uncertainties and risks 4.2, 4.3 7. Present results Overview of costs and benefits 3
Distribution effects 3.1, 3.2 (partial)

RIVM Letter report 2019-0021
Page 68 of 79
Appendix 2 Additional models
A2.1 Health Indicator: Probability of being overweight Unit: Value higher or lower than 1. where 1 is the reference value. respective to 50% or less green space within a buffer of 3000 meters Source: Klompmaker et al. (2017) A study conducted by Klompmaker et al. (2017) found a negative relationship between green space and being overweight (body mass index (BMI) ≥ 25 kg/m2) within the Netherlands. The study was based on a national health survey (Public Health Monitor 2012. PHM) conducted with 387,195 adults. To measure green space. the Normalized Difference Vegetation Index (NDVI) was used. NDVI captures the density of green vegetation at a spatial resolution of 30m. Surrounding greenness was measured as the average NDVI within a circular buffer of the participant's residential address.
The study found a negative relationship between the percentage of green space within a 3000m buffer and the probability of being overweight (Table A2). Percentages of green space were divided into quintiles (column 1). where the first quintile represents the reference category. As Table A2 reveals, as the percentage of green space increases within every quintile, the probability of having a BMI ≥ 25 kg/m2 decreases. Values in bold are significant at a 5% level.
Table A2: Relationship between different percentages of green space within a buffer of 3000m and being overweight (BMI ≥ 25 kg/m2)
Percentage of green space
(quintiles – NDVI)
Probability of being overweight (95% CI)
≤ 50 ref 51–57 1.00 (0.97, 1.02) 58–63 0.96 (0.93, 0.99) 64–69 0.93 (0.91, 0.96) > 69 0.92 (0.89, 0.95)
Steps 1. For every grid cell. estimate the percentage of green space within a
3000m buffer (X1) 2. For every grid cell. estimate the probability that individuals are
overweight (BMI ≥ 25 kg/m2) (X2)
Percentage of green space (X1)
Probability of being overweight (X2)
≤ 0.50 ref 0.51–0.57 1.00 0.58–0.63 0.96 0.64–0.69 0.93
> 0.69 0.92

RIVM Letter report 2019-0021
Page 69 of 79
A2.2 Physical activity Indicator: Additional time spent on outdoor physical activity Unit: minutes/year Source: Klompmaker et al. (2017) A study conducted by Klompmaker et al. (2017) found a positive relationship between green space and outdoor physical activity within the Netherlands. The study was based on a national health survey (Public Health Monitor 2012, PHM) with 387,195 adults. Outdoor physical activity was defined as all moderate and vigorous physical activities that can be done outdoors (physical activity for commuting purposes, leisure time physical activity (walking, cycling, gardening). and outdoor sports). To measure green space. the Normalized Difference Vegetation Index (NDVI) was used. NDVI captures the density of green vegetation at a spatial resolution of 30m. Surrounding greenness was measured as the average NDVI within a circular buffer of the participant's residential address.
The study found a positive relationship between green space within a buffer of 300m and the change in minutes adults engage in outdoor physical activities for every quintile (Table A3). Percentages of green space were divided into quintiles (column 1), where the first quintile represents the reference category. As Table A3 reveals, as the percentage of green space increases within every quintile, the minutes individuals invest in outdoor physical activities increases.
Table A3: Percentage of green space within a buffer of 300m and changes in the amount of min/week that individuals invest in outdoor physical activity. Values in bold are significant at a 5% level. Percentage of green space
(quintiles – NDVI) Minutes extra spent on outdoor
physical activity (95% CI) ≤ 40 ref 45-50 3.5 (-3.5. 10.6) 51-55 9.4 (2.2. 16.5) 53–59 18.6 (11.3. 25.9) > 59 43.8 (36. 51.6)

RIVM Letter report 2019-0021
Page 70 of 79
Steps 1. For every grid cell, estimate the percentage of green space within a
300m buffer (X1) 2. For every grid cell, estimate the population (X2) 3. For every grid cell, estimate the individual increase in in outdoor
physical activity (min) (X3)
Percentage of green space (X1)
Minute increase in outdoor physical activity (X3)
≤ 0.40 0 0.45-0.50 3.5 0.51-0.55 9.4 0.53–0.59 18.6
> 0.59 43.8 4. For every grid cell, estimate the total increase in outdoor physical
activity (min) (X4)
X2 * X3

RIVM Letter report 2019-0021
Page 71 of 79
Indicator: Cycling Unit: km/year Source: Gemeente Amsterdam, CBS To calculate the increase in cycling in Amsterdam, a simple calculation was performed, where the increase in kilometres cycled by the city’s inhabitants is proportional to the increase in the length of Amsterdam’s cycling network within each scenario. The amount of km cycled per resident per year in North Holland was used as a proxy for the amount of km cycled per resident per year in Amsterdam. The growth rate in km cycled per resident per year was used to estimate the increase in km cycled by 2025, within a Business-As-Usual situation.

RIVM Letter report 2019-0021
Page 72 of 79
Indicator: Time spent cycling to-from work Unit: minutes per year Source: Maas et al. (2008)
A study conducted by Maas et al. (2008) studied the relationship between green space and cycling within the Netherlands. The study was based on a national health survey (Second Dutch National Survey of General Practice, DNSGP-2) with 4,899 people. To measure green space, the National Land Cover Classification database (LGN4) was used. LGN4 contains the dominant type of land use of each 25×25m grid cell in the Netherlands in 2001. Surrounding greenness was measured as the percentage of green space within a circular buffer of the participant's address.
𝑚𝑚𝑚𝑚𝑚𝑚𝑚𝑚𝑚𝑚𝑚𝑚𝑚𝑚 𝑝𝑝𝑚𝑚𝑝𝑝 𝑤𝑤𝑚𝑚𝑚𝑚𝑤𝑤 (𝑚𝑚𝑚𝑚𝑖𝑖𝑚𝑚𝑖𝑖𝑚𝑚𝑖𝑖𝑚𝑚𝑑𝑑𝑑𝑑)= 𝑚𝑚𝑚𝑚𝑚𝑚𝑚𝑚𝑝𝑝𝑖𝑖𝑚𝑚𝑝𝑝𝑚𝑚 + (0.83 × 𝑝𝑝𝑚𝑚𝑝𝑝𝑖𝑖𝑚𝑚𝑚𝑚𝑚𝑚𝑑𝑑𝑝𝑝𝑚𝑚 𝑝𝑝𝑝𝑝𝑚𝑚𝑚𝑚𝑚𝑚 𝑚𝑚𝑝𝑝𝑑𝑑𝑖𝑖𝑚𝑚 𝑥𝑥 100)
Formula 1
The study found a positive relationship between the percentage of green space within a buffer of 1000m and the number of minutes cycled for commuting purposes. It was found that, for every percentage increase in green space, people who cycle to work for commuting purposes will cycle 0.83 additional minutes on average. This information can be used to extrapolate Formula 1. Moreover, people with 20% green space within a 1000m radius around their home cycle 120 minutes per week for commuting purposes, whereas people with 80% green space within a 1000m radius cycle approximately 170 minutes per week for commuting purposes. Based on this information, the intercept is estimated at 103.4 minutes per week per person (Figure A1).
Figure A1: Relationship between the percentage of green space and the minutes people engage in cycling for commuting purposes
Steps 1. For every grid cell, estimate the percentage of green space within a
1000m buffer (X1) 2. For every grid cell, estimate the population (X2) 3. For every grid cell, estimate the minutes cycled per week per
individual for commuting purposes (X3):
103.4 + (0.83 * X1 * 100)

RIVM Letter report 2019-0021
Page 73 of 79
4. For every grid cell, estimate the total amount of minutes cycled per week for commuting purposes (X4):
X2 * X3 * (0.63 * 0.06) 2
2 Probability that people will cycle for commuting purpose = (0.63 * 0.23). Percentage of people employed (0.63) times the percentage of commuting done by bike (0.23) in 2017 (www.ois.amsterdam.nl)

RIVM Letter report 2019-0021
Page 74 of 79
Indicator: Avoided premature deaths from cycling to-from work Unit: lives/year Source: Maas et al. (2008); HEAT Tool (Kahlmeier et al., 2017); Kelly et al. (2014) Based on the calculation obtained on cycling for commuting purposes, the number of avoided premature deaths from cycling is calculated. This is done through the implementation of the HEAT Tool, a tool developed by the World Health Organization, which measures the effects of walking and cycling on human health. Steps 1. For every grid cell, estimate the percentage of green space within a
1000m buffer (X1) 2. For every grid cell, estimate the population (X2) 3. For every grid cell, estimate the minutes cycled per week per
individual for commuting purposes (X3)
103.4 + (0.83 * X1 * 100) 4. For every grid cell, estimate the reduced risk of all-cause mortality
(RRM) for individuals cycling for commuting purposes (X4). Note: A cap of 45% RRM should be implemented.
(X3 / 100) * (1 - 0.9) 3 5. For every grid cell, estimate the sum of all individual RR’s (X5)
X2 * X4 6. Estimate the sum of sum of X5 values from all grid cells (X6). 7. Estimate Amsterdam’s average RRM due to cycling for commuting
purposes (X7).
X6𝑇𝑇𝑇𝑇𝑚𝑚𝑑𝑑𝑑𝑑𝑇𝑇𝑇𝑇𝑝𝑝
8. Calculate the total avoided premature deaths due to cycling for commuting purposes (X8)
�� 11−X7
× 0.006(𝑇𝑇𝑇𝑇𝑚𝑚𝑑𝑑𝑑𝑑𝑇𝑇𝑇𝑇𝑝𝑝)� − 0.006(𝑇𝑇𝑇𝑇𝑚𝑚𝑑𝑑𝑑𝑑𝑇𝑇𝑇𝑇𝑝𝑝) � × (0.63 × 0.23) 4. 5
3 Relative risk of mortality (RR) of cyclists against non-cyclists = 0.9 (Kelly et al., 2014) 4 MR = Mortality rate Amsterdam 2017 = 0.006 (allecijfers.nl) 5 Probability that people will cycle for commuting purpose = (0.63 * 0.23). Percentage of people employed (0.63) times the percentage of commuting done by bike (0.23) in Amsterdam in 2017 (www.ois.amsterdam.nl)

RIVM Letter report 2019-0021
Page 75 of 79
Indicator: Avoided premature deaths from cycling to-from work Unit: lives/year. €/year Source: Maas et al. (2008); HEAT Tool (Kahlmeier et al., 2017); Kelly et al. (2014); Gemeente Amsterdam One way to calculate the monetary benefits of cycling, in this case to-from work, is to translate minutes cycled by individuals to the number of avoided premature deaths, and to multiply this to the statistical value of a life (WHO, 2017). Various estimates for the value of a statistical life exist, such as the European default values (for 2015) of €2.132 million (WHO European Region), €2.891 million (EU27 countries) or €2.877 million (EU28 countries including Croatia) can also be used (WHO, 2017). Steps 1. For every grid cell, estimate the percentage of green space within a
1000m buffer (X1) 2. For every grid cell, estimate the population (X2) 3. For every grid cell, estimate the minutes cycled per week per
individual for commuting purposes (X3)
103.4 + (0.83 * X1 * 100) 4. For every grid cell, estimate the reduced risk of mortality (RRM) for
individuals cycling for commuting purposes (X4). Note: A cap of 45% RRM should be implemented.
(X3 / 100) * (1 - 0.9) 6 5. Add the RRM’s for the entire population: 5.1 For every grid cell, estimate the sum of all individual RRM’s (X5)
X2 * X4 5.2 Estimate the sum of sum of X5 values from all grid cells (X6). 6 Estimate Amsterdam’s average RRM due to cycling for commuting
purposes (X7)
X6𝑇𝑇𝑇𝑇𝑇𝑇𝑇𝑇𝑇𝑇𝑇𝑇𝑇𝑇𝑇𝑇
× (0.63 × 0.23) 7 7 Estimate the total avoided premature deaths due to cycling for
commuting purposes (X8)
� 11−X7
× 0.006 (𝑇𝑇𝑇𝑇𝑚𝑚𝑑𝑑𝑑𝑑𝑇𝑇𝑇𝑇𝑝𝑝)� − 0.006 (𝑇𝑇𝑇𝑇𝑚𝑚𝑑𝑑𝑑𝑑𝑇𝑇𝑇𝑇𝑝𝑝) 8 8 Estimate the economic value of avoided premature deaths due to
cycling for commuting purposes
X8 * VSL
6 Relative risk of mortality (RR) of cyclists against non-cyclists = 0.9 (Kelly et al., 2014) 7 Probability that people will cycle for commuting purpose = (0.63 * 0.23). Percentage of people employed (0.63) times the percentage of commuting done by bike (0.23) in Amsterdam in 2017 (www.ois.amsterdam.nl) 8 MR = Mortality rate Amsterdam 2017 = 0.006 (allecijfers.nl)

RIVM Letter report 2019-0021
Page 76 of 79
A2.3 Recreation Indicator: Visits to recreation areas Unit: visits/year Source: Gemeente Amsterdam Recreation was measured by looking at the number of visits to parks and other green recreational areas. The stepwise procedure adopted is described hereunder. Business-As-Usual 1. To calculate the increase in the number of visits to parks for the
Business-As-Usual scenario, data provided by the City of Amsterdam on the number of visits to 22 parks, for the years 1996 and 2013, was used. This dataset included two types of parks: ‘neighbourhood parks’ (buurtparken) and ‘city parks’ (stadsparken). It was estimated that for neighbourhood parks, the average yearly percentage increase in visits to these parks was around 3%, whereas for ‘city parks’ (stadsparken), the number of visits increased by 9% per year on average. For each of the 22 parks, its respective percentage growth rate was used to predict the number of visits in 2025. Linear growth was assumed, due to the likelihood of obtaining exorbitant and unrealistic visitation predictions using compounded growth rates, and the lack of evidence suggesting non-linear growth rates.
2. Additional data was provided by the Municipality of Amsterdam on recreational visits to additional recreational areas only for the year 2013. For areas categorized as ‘city parks’, linear visitation growth was assumed, with an average yearly percentage growth rate of 9%. For all other recreational areas (e.g. neighbourhood parks, ecological areas, recreational areas) a linear, average yearly percentage growth rate of 3% was assumed.
3. For parks where no data on the number of recreational visits has been recorded, the average number of visits per m2 was estimated based on the average number of visits per m2 to neighbourhood parks for the years 2016 and 2025, obtained by collapsing the datasets from Steps 1 and 2 above.
4. The values calculated above for all parks were summed up, to estimate the number of visits to recreational areas during the years 2016 and 2025.
Scenarios 1. The scenarios Metropolitan Landscape and Urban Parks involve
improvements in management for various recreational areas. For areas where management remains the same, the original growth rates and recreational visit numbers calculated were assumed. For areas where enhancement in management takes place, a 5% linear, average yearly increase is assumed since 2020, provided that the original or previously extrapolated growth rate is equal to or lower than 5%. In this case, it is assumed that the implementation of improved management will not take place until the year 2020.
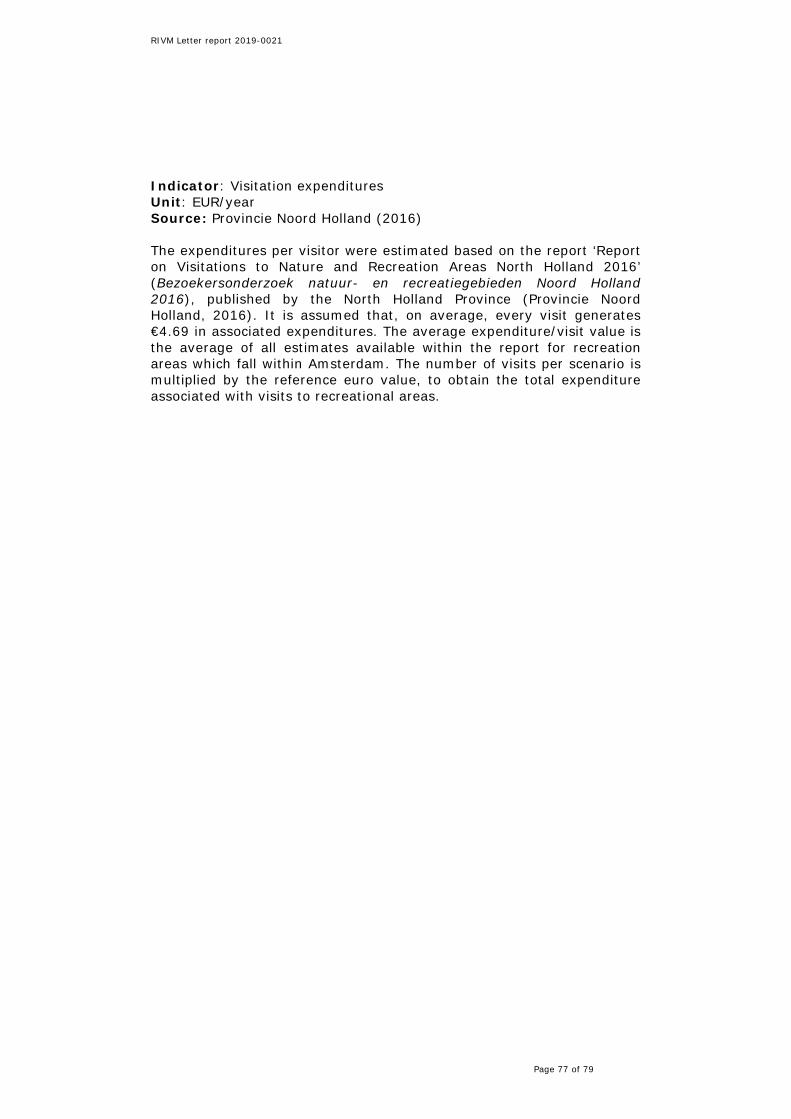
RIVM Letter report 2019-0021
Page 77 of 79
Indicator: Visitation expenditures Unit: EUR/year Source: Provincie Noord Holland (2016) The expenditures per visitor were estimated based on the report ‘Report on Visitations to Nature and Recreation Areas North Holland 2016’ (Bezoekersonderzoek natuur- en recreatiegebieden Noord Holland 2016), published by the North Holland Province (Provincie Noord Holland, 2016). It is assumed that, on average, every visit generates €4.69 in associated expenditures. The average expenditure/visit value is the average of all estimates available within the report for recreation areas which fall within Amsterdam. The number of visits per scenario is multiplied by the reference euro value, to obtain the total expenditure associated with visits to recreational areas.

RIVM Letter report 2019-0021
Page 78 of 79
A2.4 Water storage Indicator: Reduced rainwater in sewers Unit: m3/year Source: SBRCURnet (www.sbrcurnet.nl) In the Netherlands, an average 874mm precipitation occurs every year. Research on water retention by green roofs shows that grass, herbs and mosses can retain between 40-60% rainfall per year. Based on expert judgment, a reference percentage rate for water (rainfall) storage of 55% is assumed. Hence the reduced amount of rainwater in sewers due to the availability of green space was estimated at 0.481m3 per m2 of green area. This value was only estimated for inhabited areas, since these are the areas where the contribution of green to the reduction of rainwater in sewers is most prominent. The contour of inhabited areas was defined using the population centres (bevolkingskernen).

RIVM Letter report 2019-0021
Page 79 of 79
Indicator: Reduced water treatment costs Unit: €/year Source: SBRCURnet (www.sbrcurnet.nl) Rainfall stored by vegetation would otherwise end up in sewers, incurring higher treatment costs. The associated sewage treatment costs are estimated at €0.78/m3/year. Hence, the value of water stored vegetation in m3/year is multiplied by €0. 78 to obtain the monetary benefit, or the reduced sewage cost, associated with reduced rainfall entering sewers.

RIVMCommitted to health and sustainability