Amsterdam Open Data 2017
35
Open Data in Amsterdam January 2017 CTO Office Jasper Soetendal Ron van der Lans
Transcript of Amsterdam Open Data 2017
Open Data in AmsterdamJanuary 2017CTO OfficeJasper SoetendalRon van der Lans

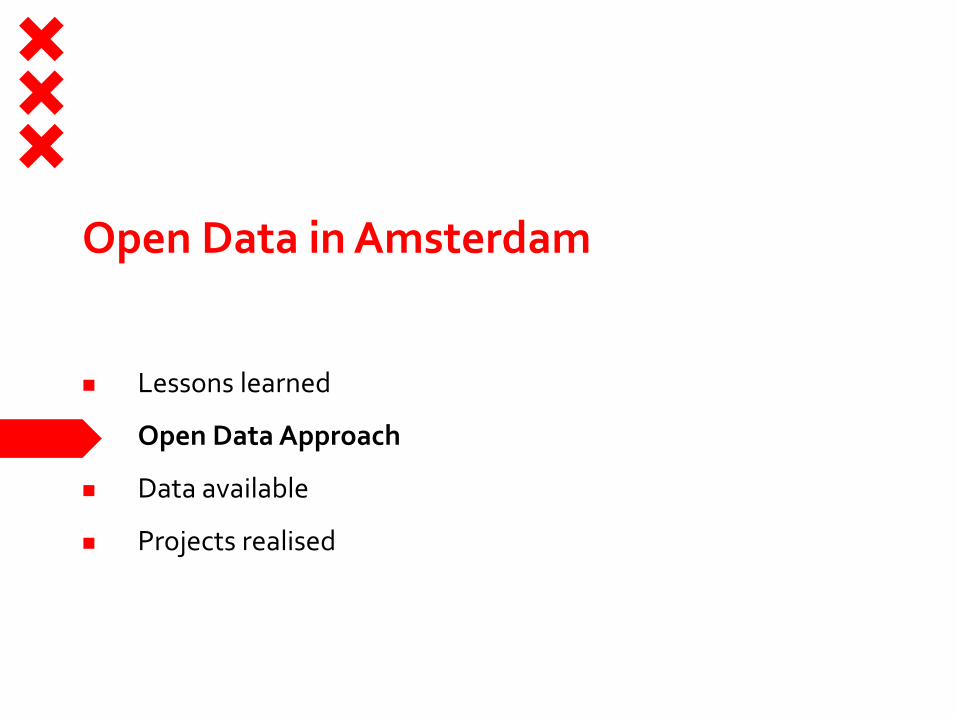
Open Data in Amsterdam
Lessons learned
Open Data Approach
Data available
Projects realised

Open Data Data innovation
Lessons learned
2011 2017
“the total direct and indirect economic gains from
easier open data re-use in the EU would be in the
order of € 140 billion annually.”
“We provide our open data, went out for lunch and
the first app was available”
From Open Data to Data innovation
Open data is not a goal Business case = intern
Simple last stepThree layers of data
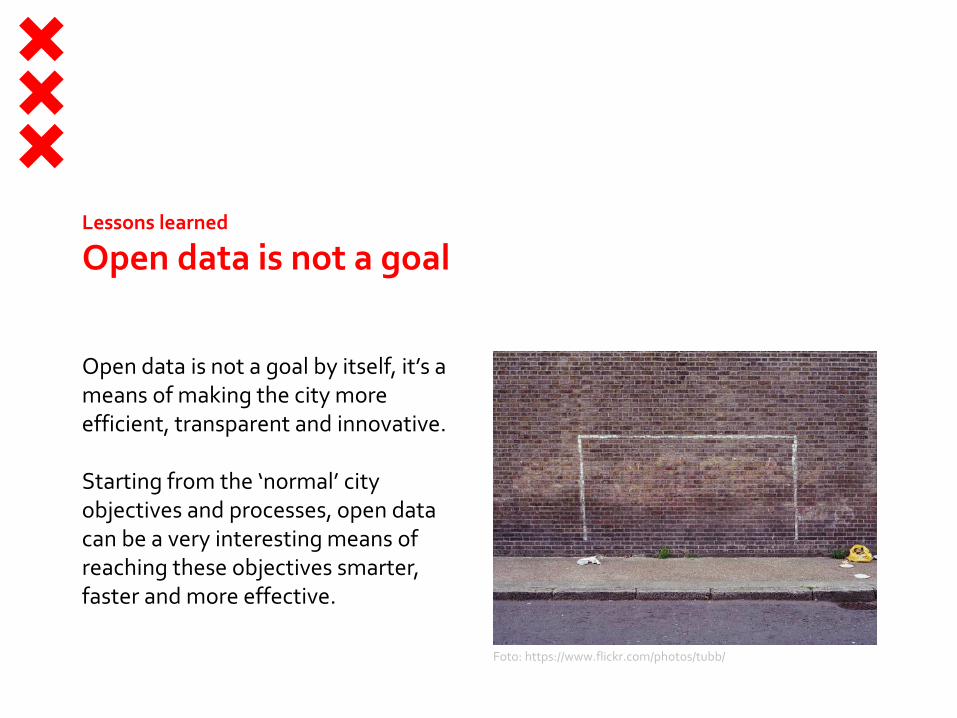
Open data is not a goal by itself, it’s a means of making the city more efficient, transparent and innovative.
Starting from the ‘normal’ city objectives and processes, open data can be a very interesting means of reaching these objectives smarter, faster and more effective.
Lessons learned
Open data is not a goal
Foto: https://www.flickr.com/photos/tubb/

Do not underestimate the internal profits that can be realised by opening up your data.
In Amsterdam it turns out that the internal efficiency of sharing data within the city is the most important profit.
Lessons learned
Internal efficiency drives the business case
Foto: https://www.flickr.com/photos/avaragado/

Internal - only available to organisations and persons within the City of Amsterdam
Shared - conditional sharing with selected third parties
Open – For every one, without constraints
Lessons learned
Share across three data layers
Foto: https://www.flickr.com/photos/tubb/

Lessons learned
In a perfect city information system, opening data is a simple step
In the perfect city information system, opening data is just a simple last step of the information process.
The real problem is: the city’s information process isn’t perfect. While trying to open data, we’ll have to deal with a lot of challenges that aren’t really connected with open data, but with data management in general.
These challenges cost time and money, but they will improve the city and should not be charged to ‘open data’ only.
Open Data in Amsterdam
Lessons learned
Open Data Approach
Data available
Projects realised
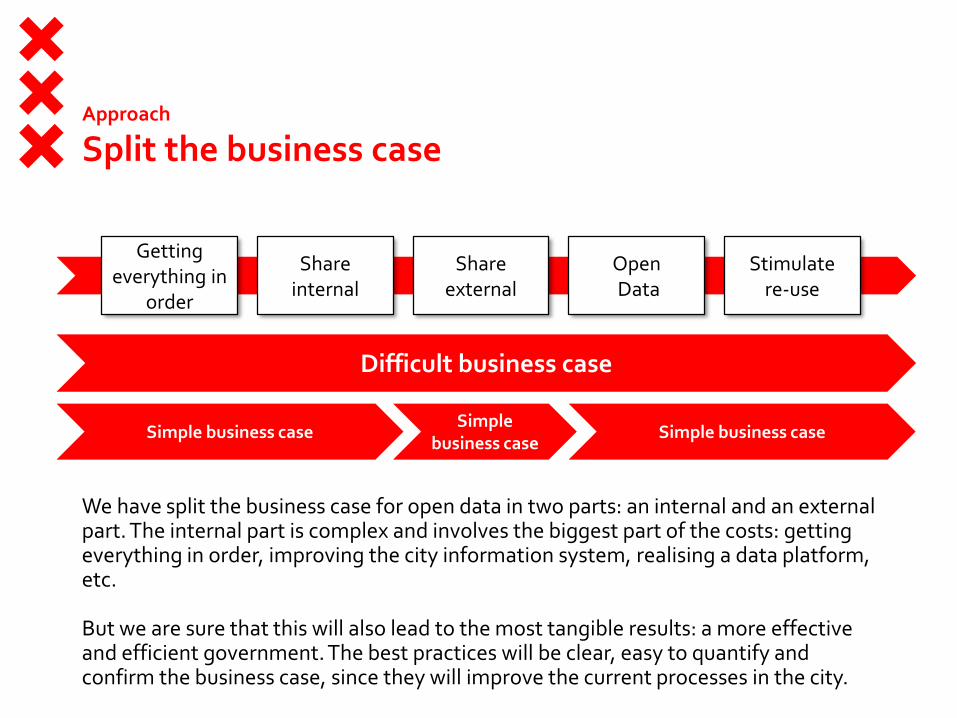
We have split the business case for open data in two parts: an internal and an external part. The internal part is complex and involves the biggest part of the costs: getting everything in order, improving the city information system, realising a data platform, etc.
But we are sure that this will also lead to the most tangible results: a more effective and efficient government. The best practices will be clear, easy to quantify and confirm the business case, since they will improve the current processes in the city.
Gettingeverything in
order
Share internal
Share external
OpenData
Stimulatere-use
Difficult business case
Simple business case Simple business caseSimple
business case
Approach
Split the business case
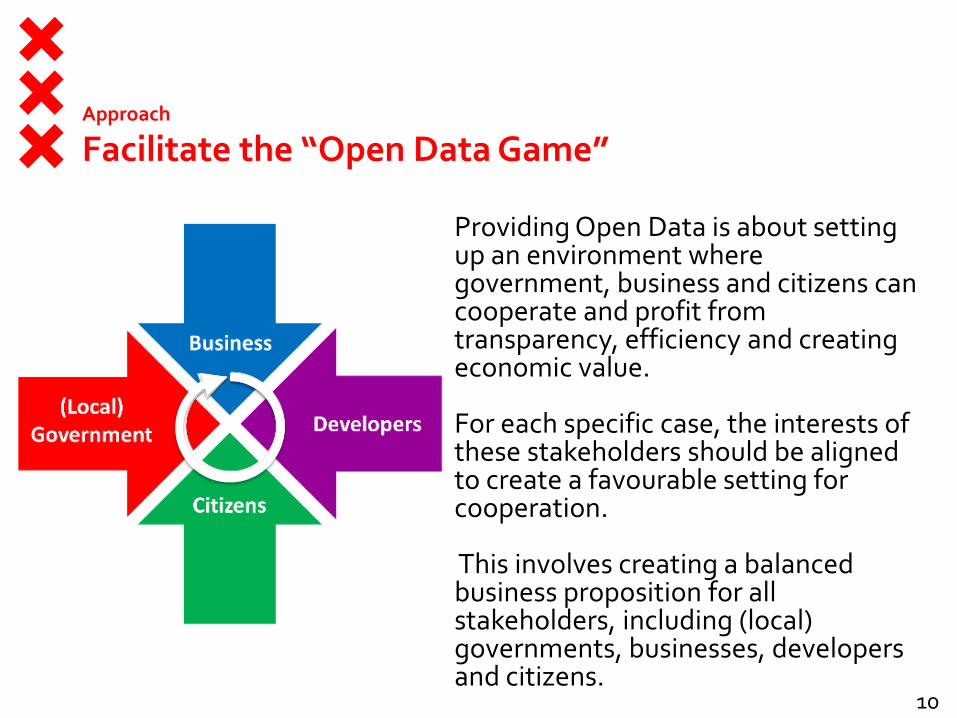
Providing Open Data is about setting up an environment where government, business and citizens can cooperate and profit from transparency, efficiency and creating economic value.
For each specific case, the interests of these stakeholders should be aligned to create a favourable setting for cooperation.
This involves creating a balanced business proposition for all stakeholders, including (local) governments, businesses, developers and citizens.
10
Approach
Facilitate the “Open Data Game”

The three layers of data are integrated in our data platform. We don’t want to use different platforms, but a three layer architecture for our data platform.
Internal - only available to organisations and persons within the City of Amsterdam
Shared - conditional sharing with selected third parties
Open – For every one, without constraints
Approach
Use three layers of data

A ‘cold approach’, providing open data without further context andactivities doesn’t lead to theexpected re-use
As much as possible, we apply a ‘warm approach’, coordinate with(potential) users and organizeactivities.
More and more the cities challengesare leading, more than the data itself
Approach
‘Warm approach’ vs. ‘cold approach’
Foto: https://www.flickr.com/photos/rbainfo/

Open Data starts with the enthusiastic initiatives of the early adopters. Let a 1.000 flowers bloom and support these initiatives. Connect the early adopters and share their experiences and best practices.
Approach
Start bottom up
Foto: smlp.co.uk

The best practices of Open Data rarely start with policies and documents.
They start with action and experimentation, backed by management commitment.
Approach
Action first, policies later
Foto: Moyan Brenn
Open Data in Amsterdam
Lessons learned
Open Data Approach
Data available
Projects realised

Available data
305 topics across 10 themes
Public Space
Basic Information
Mobility
Economy & Labour
Tourism
Health & Well-being
Democracy
Education & Youth
Energy
Safety

Available data
data.amsterdam.nl

What?– Real-time data on stops, departure times
and actual delays
Specifications– API
Notes– Via OpenOV both static (stops, routes, time
tables) as actual (departure times, delays, detours) data can be used, using variousformats and API’s
– In Amsterdam, this data is available for alltransport organisations
– In The Netherlands, this data is available foralmost all transport organisations
Available data
Real-time Public Transport info
18Link to data
Featured dataset

What?– Actual travel times for high ways and all
main roads in the Amsterdam metropolitan area
Specifications– GeoJSON, updated every 5 minutes
Notes– For over 1.000 routes and road sections
(over 900 km) geography, distance andcurrent velocity and travel times are available
Available data
Real-time traffic data
19Link to data
Featured dataset

What?– The BBGA contains core statistics on
various aggregation levels in Amsterdam
Specifications– API, Excel file and web visualisation
Notes– These base statistics cover over 400
variables on various themes: Demographics, Housing, Public Space, Mobility, Safety, Economy, Sports & recration, Heakth & well-being, Education, Income and Participation
Available data
Amsterdam Base Statistics
20Link to data
Featured dataset
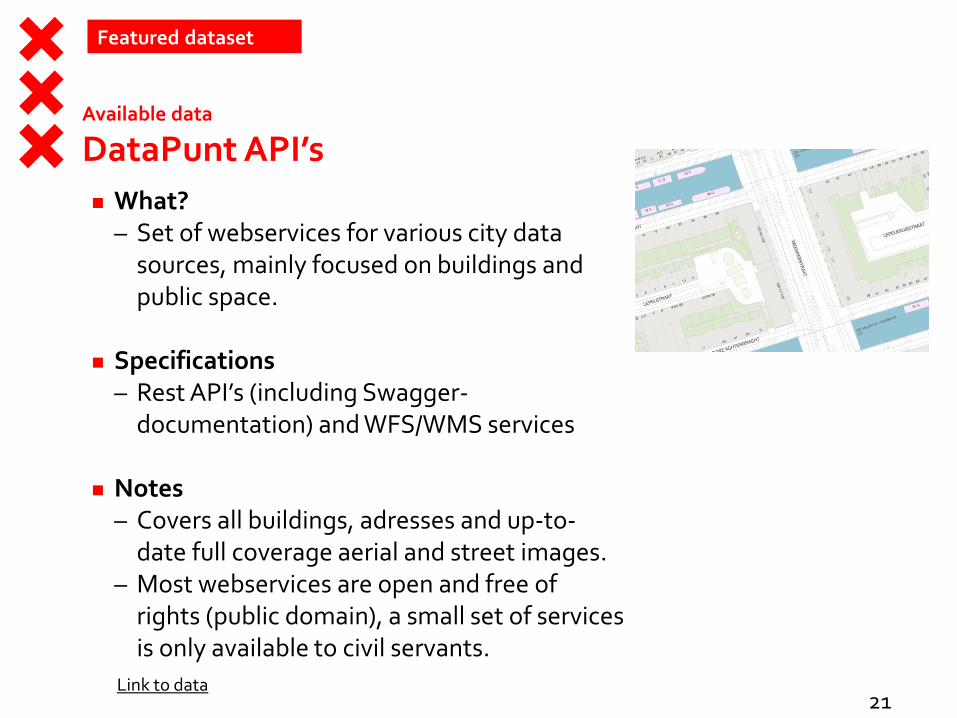
What?– Set of webservices for various city data
sources, mainly focused on buildings andpublic space.
Specifications– Rest API’s (including Swagger-
documentation) and WFS/WMS services
Notes– Covers all buildings, adresses and up-to-
date full coverage aerial and street images.– Most webservices are open and free of
rights (public domain), a small set of services is only available to civil servants.
Available data
DataPunt API’s
21Link to data
Featured dataset

What?– Geography, function and floor area for each
non-residential building in Amsterdam
Specifications– Shapefile
Notes– On the Function Map are all non-residential
functions in Amsterdam. Through intensive field research we look at each property which features are present therein: offices and businesses, retail, bar, social and leisure functions, parking and public transport.
Available data
Function Map
22Link to data
Featured dataset

Available data
Planned constructions
23Link to data
What?– Planned constructions in Amsterdam.
Specifications– GeoJSON, including geography,
planned start and end date. Weeklyupdated.
Notes– The City Director coordinates all
planned large construction works whereground and/or streets are broken. They’re tracked in the CORA Database, including resulting hindrance.
Featured dataset
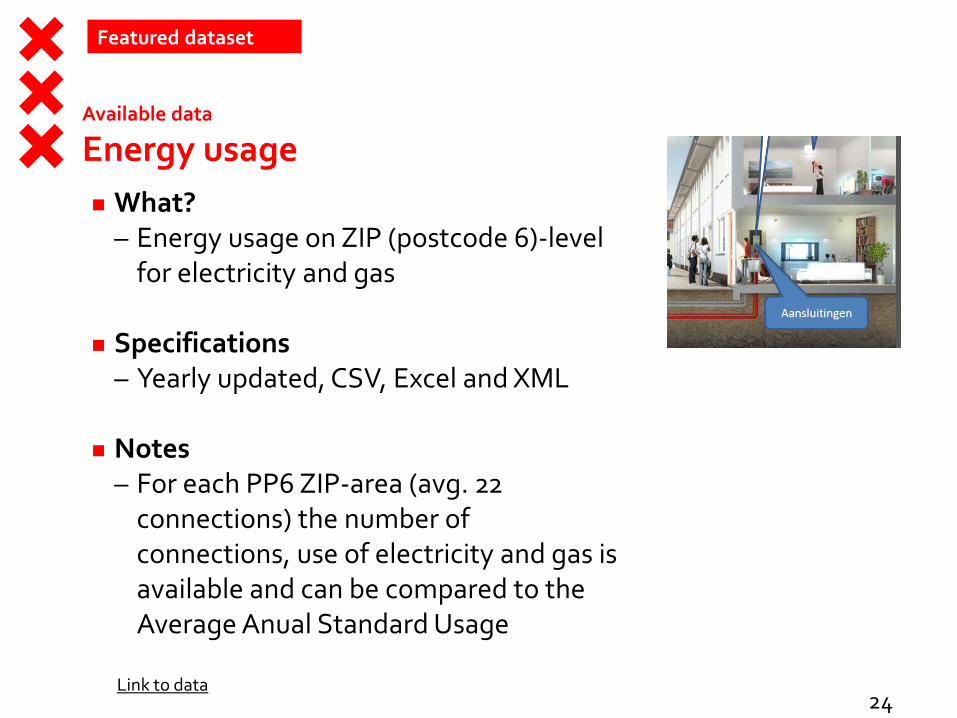
What?– Energy usage on ZIP (postcode 6)-level
for electricity and gas
Specifications– Yearly updated, CSV, Excel and XML
Notes– For each PP6 ZIP-area (avg. 22
connections) the number of connections, use of electricity and gas is available and can be compared to theAverage Anual Standard Usage
Available data
Energy usage
24Link to data
Featured dataset
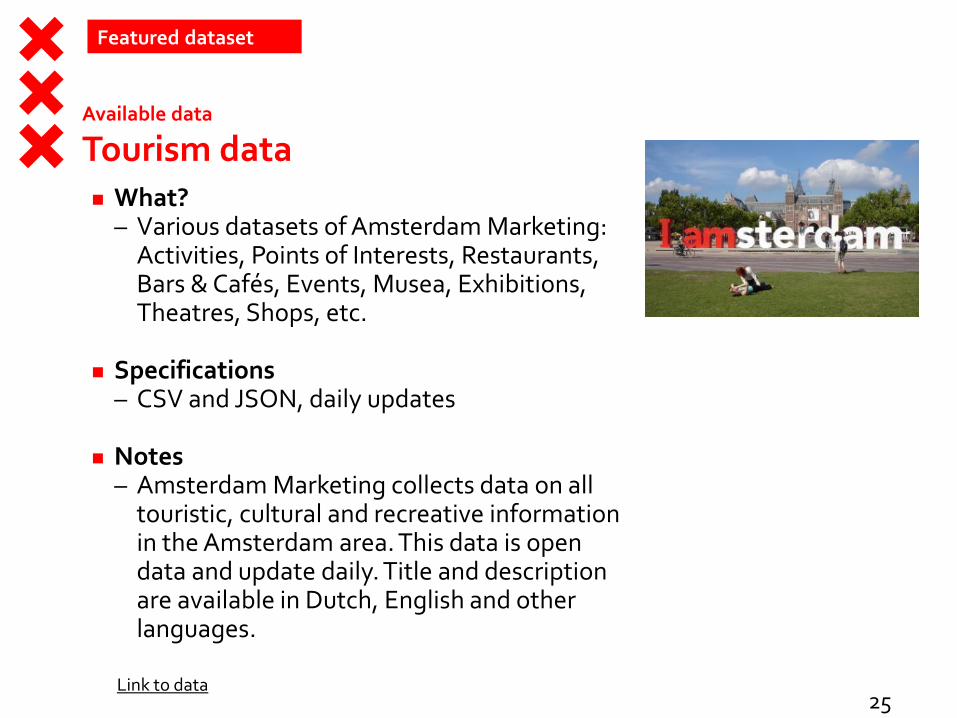
What?– Various datasets of Amsterdam Marketing:
Activities, Points of Interests, Restaurants, Bars & Cafés, Events, Musea, Exhibitions, Theatres, Shops, etc.
Specifications– CSV and JSON, daily updates
Notes– Amsterdam Marketing collects data on all
touristic, cultural and recreative information in the Amsterdam area. This data is open data and update daily. Title and descriptionare available in Dutch, English and otherlanguages.
Available data
Tourism data
25Link to data
Featured dataset

What?– Information and hig quality images of
100.000+ items from the Rijksmuseum
Specifications– API, XML-format (OAI/PMH protocol)
Notes– Developers are granted access to the base
collection of the Rijksmuseum, over 100.000 objects including Rembrandts Night Watch
– For all objects digital images are available. The datasets are opened directly from thecollection registration system on theRijksmuseum.
– Information is updated daily. If new or improved imagery comes is created in themuseum, it’s instant available through the API.
Available data
Rijksmuseum API
26Link to data
Featured dataset

What?– Projected and actual financial figures of
Amsterdam and its burroughs. The Open State foundation has build theOpenSpending.nl platform on which thefinancial figures of all municipalities in The Netherlands can be compared
Notes– Municipalities report their projected and
actual figures to the CBS (National Bureau of Statistics), all using the samestandard (IV3).By doing this, the data for this platform can be easily extracted and compared.
– Financial data can be compared on a ‘EUR/inhabitant’-level
Available data
Open Spending
27http://www.openspending.nl/amsterdam-centrum
Featured dataset
Open Data in Amsterdam
Lessons learned
Open Data Approach
Data available
Projects realised

More info:
Amsterdam DataPunt
What?DataPunt is a platform where a multitude of internal and external information of the Amsterdam municipality is available for the various organizations in the city and their end users (civil workers, citizens and entrepreneurs) in the user-desired format.
How?DataPunt is developed and managed by SCRUM and DevOps teams, based on open source components. DataPunt consists of a portal (search, catalog, maps, visualizations, etc.), data APIs and underlying infrastructure.
ImpactDataPunt accelerates data innovation in Amsterdam. The new data infrastructure of the city enables a more agile, data based and effective city organisation. For third parties, it is now much easier to realize applications based on the cities data.
Municipal data available in a uniform format
https://data.amsterdam.nl en https://api.datapunt.amsterdam.nl/api/
Featured project
More info:
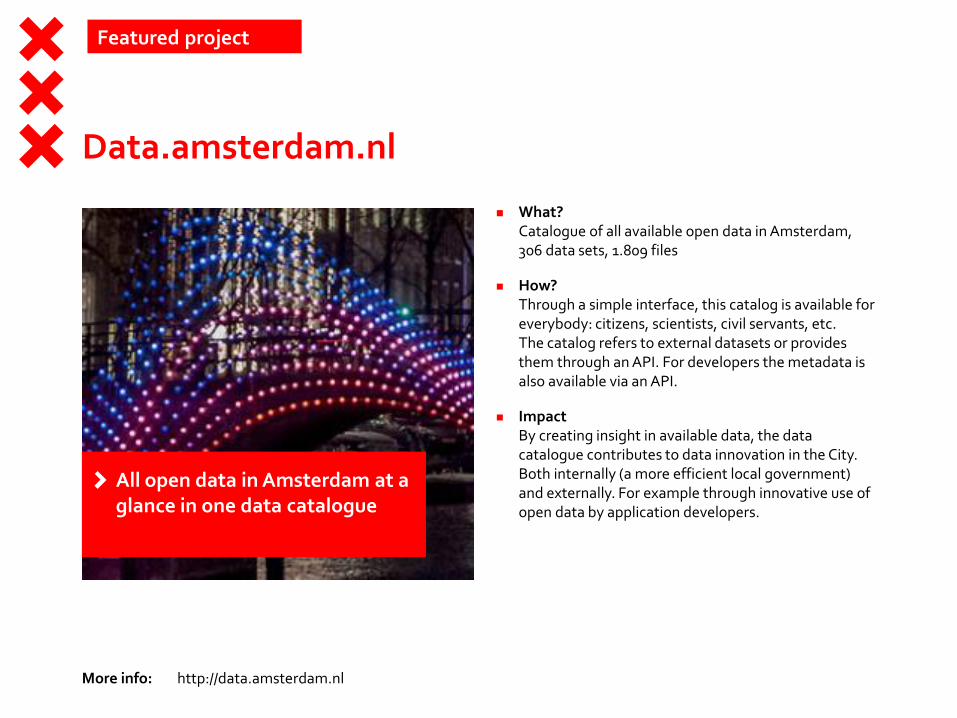
Data.amsterdam.nl
What?Catalogue of all available open data in Amsterdam, 306 data sets, 1.809 files
How?Through a simple interface, this catalog is available for everybody: citizens, scientists, civil servants, etc. The catalog refers to external datasets or provides them through an API. For developers the metadata is also available via an API.
ImpactBy creating insight in available data, the data catalogue contributes to data innovation in the City. Both internally (a more efficient local government) and externally. For example through innovative use of open data by application developers.
All open data in Amsterdam at a glance in one data catalogue
http://data.amsterdam.nl
Featured project

More info:
City Alerts Berichtendienst
What?Exchange of information between police, firedepartment, ambulance, local government and otherrelated organisations. To warn for potentialcomplications in emergency situations, includingprivacy sensitive information
How?By exchanging relevant information (personal and non-personal) between emergency services during emergency incidents. In such a way that rescuers have all relevant information available at a glance.
Information that is not yet shared (because of practical, technical, organisational or privacy-related issues) will be shared using our unique color-coded system, which is non-privacy-invasive and provides instant operation instructions for rescuers.
ImpactImprove the safety of those involved during an emergency incident. Prevent that information that must be shared, but isn't, causes unnecessary damage or injury.
Exchanging data the smart way may save peoples lives
https://amsterdamsmartcity.com/projects/city-alerts
Featured project

More info:
Smart Port Platform
What?Exchange of data between companies in the Port of Amsterdam and emergency services in case of incidents
How?By setting up a digital infrastructure in advance, including clear agreements on under whatcircumstances what data may be shared with whatother parties.
ImpactIn case of emergency, relevant information can beexchanged directly, instead of a lot of phone- andpaperwork that is done currently.In large calamities, this will save a lot of time, resultingin less victims and consequential damage.
Instant information exchange in emergency situations in the Port of Amsterdam
Featured project

More info:
Cooperating with Google and TNO
What?In the “Better Cities” program, Google, TNO and the City of Amsterdam join forces on potential applications in traffic management. Traffic statistics can add significant value to a better and more efficient traffic flow in the city.
How?TNO studied feasibility and added value of using Google traffic statistics for traffic management. These traffic statistics werecompared with the measurements of the extensive network of traffic sensors in the Dutch roads, for example in theAmsterdam A10 ring way.
ImpactTNO calculated the savings of a partial replacement of data from sensors in the road for Google traffic statistics.If 20% of the current road sensors are replaced by Google statistics, the quality and coverage remains at the same qualitylevel.Potential total saves accumulate to 161 million euro, if appliedto the complete Dutch network of high ways (6.500 km)
Save costs by replacing hardware sensors by smart software
https://nederland.googleblog.com/2016/04/google-tno-en-amsterdam-werken-aan.html
Featured project
More info:
Cooperating with TomTom
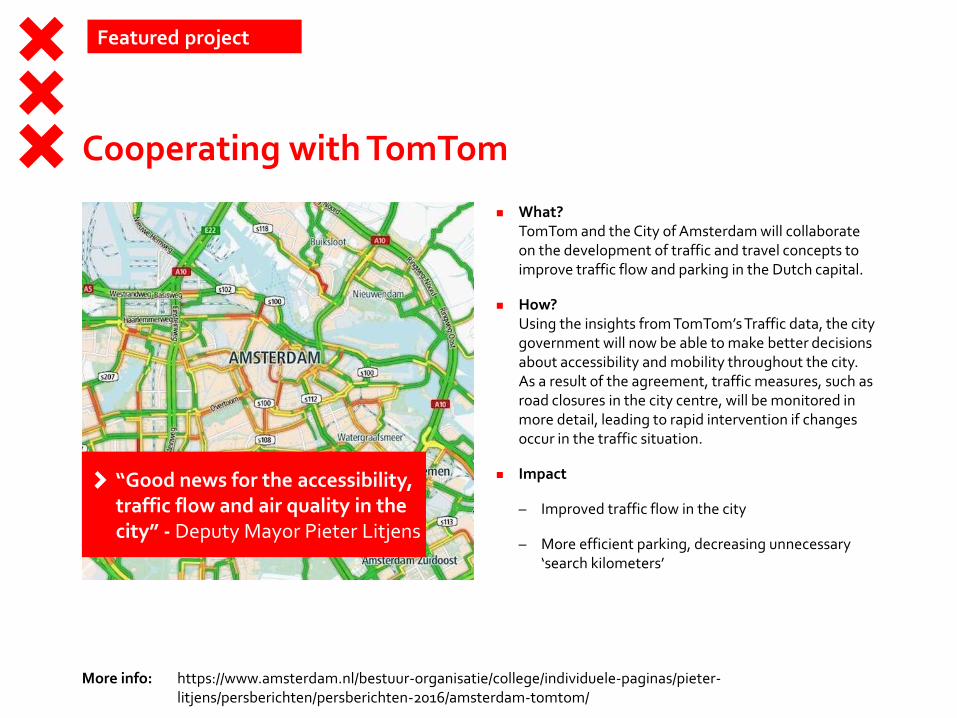
What?TomTom and the City of Amsterdam will collaborate on the development of traffic and travel concepts to improve traffic flow and parking in the Dutch capital.
How?Using the insights from TomTom’s Traffic data, the city government will now be able to make better decisions about accessibility and mobility throughout the city. As a result of the agreement, traffic measures, such as road closures in the city centre, will be monitored in more detail, leading to rapid intervention if changes occur in the traffic situation.
Impact
– Improved traffic flow in the city
– More efficient parking, decreasing unnecessary‘search kilometers’
“Good news for the accessibility, traffic flow and air quality in the city” - Deputy Mayor Pieter Litjens
https://www.amsterdam.nl/bestuur-organisatie/college/individuele-paginas/pieter-litjens/persberichten/persberichten-2016/amsterdam-tomtom/
Featured project

More info:
‘Kaart van Amsterdam’ (Map of Amsterdam)
What?A web application showing dozens of open datasets on a map. Citizens and civil workers can search andcombine these map layers at their own will.
How?Kaart.amsterdam.nl enables civil workers to easily andquickly add their own list or file to a map. By using a generic format, dozens of datasets can beshown on a map together, creating new insights.
ImpactKaart.amsterdam.nl lowers the threshold to add yourown data to the map an publish open data in that way.It sets a new standard for showing and embeddingmaps on the city wide amsterdam.nl website.
Kaart.amsterdam.nl puts Amsterdam on the map
http://kaart.amsterdam.nl
Featured project