AMERICAN FINANCE TRUSTamericanfinancetrust.com/.../2-AFIN-2Q17-Investor-Pres… · ·...
17
AMERICAN FINANCE TRUST 2 nd Quarter 2017 Investor Presentation
Transcript of AMERICAN FINANCE TRUSTamericanfinancetrust.com/.../2-AFIN-2Q17-Investor-Pres… · ·...

AMERICAN FINANCE TRUST2nd Quarter 2017 Investor Presentation

2
Overview Strong Portfolio: 516 properties, comprised of 19.2 million rentable square feet, which
were 95.8% leased(1)
Leverage: 39.6% Total Debt to Total Assets (based on book value), with a weighted average effective interest rate of 4.31%(1)
Flexible Cash Position: Cash balance of $56 million and unused borrowing capacity on the credit facility of $95 million provides operational flexibility(1)
Net Asset Value: On March 17, 2017, the Company’s independent directors unanimously approved an estimated per-share net asset value (“Estimated Per-Share NAV”) equal to $23.37 as of December 31, 2016
Distribution Rate: On June 9, 2017, the Company’s Board of Directors authorized a decrease to the annualized distribution per share, effective July 1, 2017, from $1.65 to $1.30. This represents a change in the annualized distribution yield, based on the original purchase price of $25.00 per share, from 6.6% to 5.2%. (2)
2nd Quarter Activity
Acquired 32 properties for $70.2 million, including the purchase of a 23-property Bob Evans portfolio
Sold 7 properties for $122.8 million
Subsequent events
From July 1, 2017 to August 10, 2017, the Company acquired an additional two properties for $13.8 million and sold five properties for $4.8 million
On August 8, 2017, the Company's application to list its common stock on NASDAQ under the symbol "AFIN" was approved by NASDAQ
(1) Data as of June 30, 2017(2) This represents a change from 7.1% to 5.6% based on the Company’s most recent estimated per share net asset value as of Decem ber 31, 2016 of $23.37 per share.

3
Key 2017 InitiativesAFIN remains focused on executing property level and corporate
level initiatives to enhance shareholder value
Acquisitions Management will continue to evaluate both the single tenant NNN and multi-tenant retail market to grow our high
quality portfolio
Management believes current market conditions are favorable for AFIN and we will continue to seek assets that provide shareholders with stability, growth and yield as well as redeploy capital when appropriate
AFIN will continue to leverage its reputation as an all cash buyer and expects to benefit from its robust pipeline of both on and off market transactions
Asset Management and Leasing Initiatives Continue lease-up campaign at power and lifestyle centers
Full review of the portfolio and scheduling meetings with top tenant relationships
Proactively visit with large tenants with near to mid-term lease rollover to understand their needs and plan accordingly
Capex projects Evaluate properties for any potential capex projects to potentially drive higher rents at existing centers for future
leasing activity
4
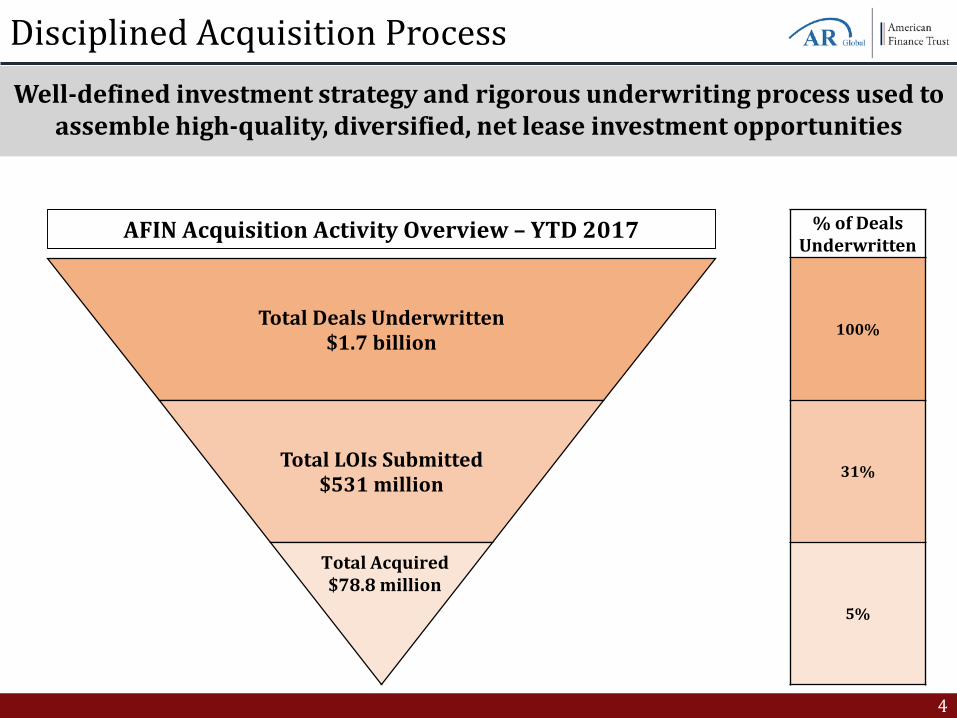
Disciplined Acquisition ProcessWell-defined investment strategy and rigorous underwriting process used to
assemble high-quality, diversified, net lease investment opportunities
Total Deals Underwritten$1.7 billion
Total LOIs Submitted$531 million
Total Acquired$78.8 million
AFIN Acquisition Activity Overview – YTD 2017 % of Deals Underwritten
100%
31%
5%

5
Leasing UpdateAFIN remains focused on its leasing and
capex initiatives to further drive occupancy and increase NOI
Single TenantAFIN’s single tenant portfolio has zero lease maturities in 2017 and 2018(1)
SunTrust disposition plan for non-renewal properties remains on track.
On May 12, 2016, AFIN and SunTrust executed various agreements to extend leases for the majority of the 213 SunTrust properties. For the remaining properties that were not renewed, with leases set to expire on December 31, 2017, AFIN is actively marketing these properties for sale or lease.
Excluding the SunTrust properties, only two properties have a lease maturity by 2020, representing less than 3% of total SLR.
Multi-TenantSince the merger with American Realty Capital – Retail Centers of America, Inc. (“RCA”) was completed in February 2017, management has been working diligently in partnership with Lincoln to ensure proper insight and oversight of the acquired multi-tenant portfolio
As a result, management is seeing increased velocity in new leases, lease renewals, and negotiations with potential tenants in addition to an enhanced focus on day-to-day asset operations, capital expenditure budgets, and asset marketing to drive revenue to selected centers.
Currently negotiating leases to backfill vacancies from tenant bankruptcies and dark tenants.
In total, only 3.6%(2) of multi-tenant leases (1.4% of total) are expiring through the remainder of 2017, representing $3.4 million of SLR.
(1) Excluding SunTrust properties.(2) As a percent of respective portfolio NOI.
6
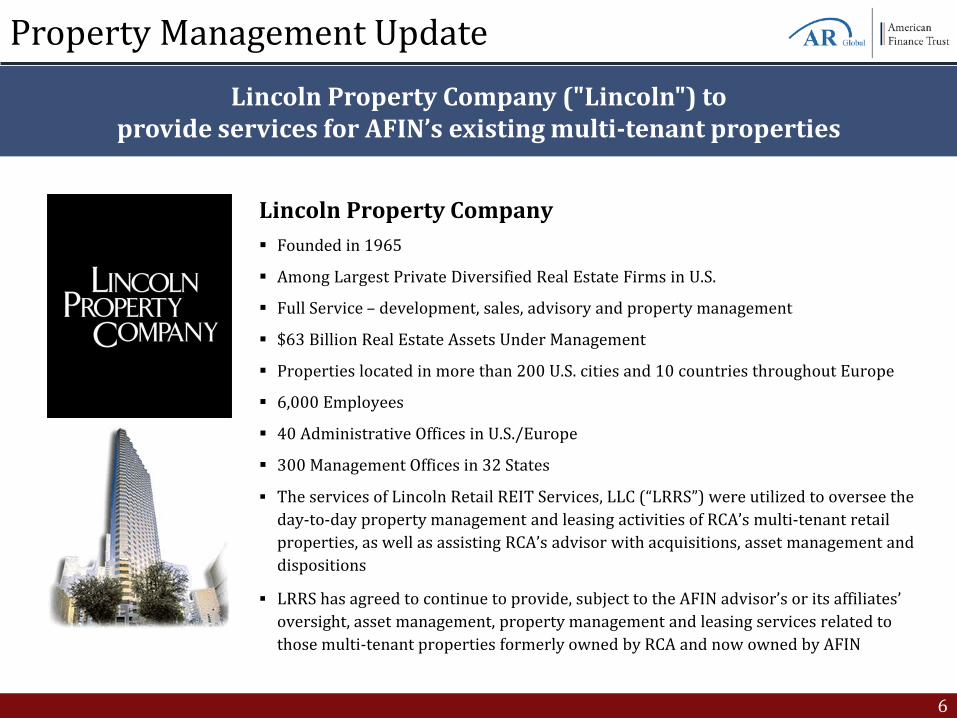
Property Management UpdateLincoln Property Company ("Lincoln") to
provide services for AFIN’s existing multi-tenant properties
Lincoln Property Company Founded in 1965
Among Largest Private Diversified Real Estate Firms in U.S.
Full Service – development, sales, advisory and property management
$63 Billion Real Estate Assets Under Management
Properties located in more than 200 U.S. cities and 10 countries throughout Europe
6,000 Employees
40 Administrative Offices in U.S./Europe
300 Management Offices in 32 States
The services of Lincoln Retail REIT Services, LLC (“LRRS”) were utilized to oversee the day-to-day property management and leasing activities of RCA’s multi-tenant retail properties, as well as assisting RCA’s advisor with acquisitions, asset management and dispositions
LRRS has agreed to continue to provide, subject to the AFIN advisor’s or its affiliates’ oversight, asset management, property management and leasing services related to those multi-tenant properties formerly owned by RCA and now owned by AFIN

7
PORTFOLIO UPDATE

8
Single Tenant Retail, 33.5%
Power Center, 31.8%
Lifestyle Center, 7.2%
Distribution, 13.2%
Office, 14.3%
AFIN Portfolio Overview (As of June 30, 2017)
AFIN has assembled a high-quality portfolio well diversified by property type, tenant base, and geography
(1) Calculated on weighted average basis on SLR (annualized straight -line rental income) as of June 30, 2017(2) Based on annualized SLR as of June 30, 2017
Metrics AFIN
Port
folio
Met
rics
Real Estate, at cost $3.5 billion
# of Properties 516
Square Feet 19.2 million
SLR (straight-line rental income) (2)
$242 million
SLR per Sq. Ft. (2) $12.63
Addi
tion
alM
etri
cs
Occupancy (%) 95.8%
Weighted Average Remaining Lease Term(1) 7.8
Top 10 TenantConcentration(2) (%) 45%
Geographical Concentration(2)
NC, 8.9%
FL, 8.6% NJ, 8.4%
GA, 7.4%
AL, 6.7%
TX, 6.2%
OH, 5.4%
SC, 5.1%Remaining 32 States, 43.3%
Property Type(2)
9
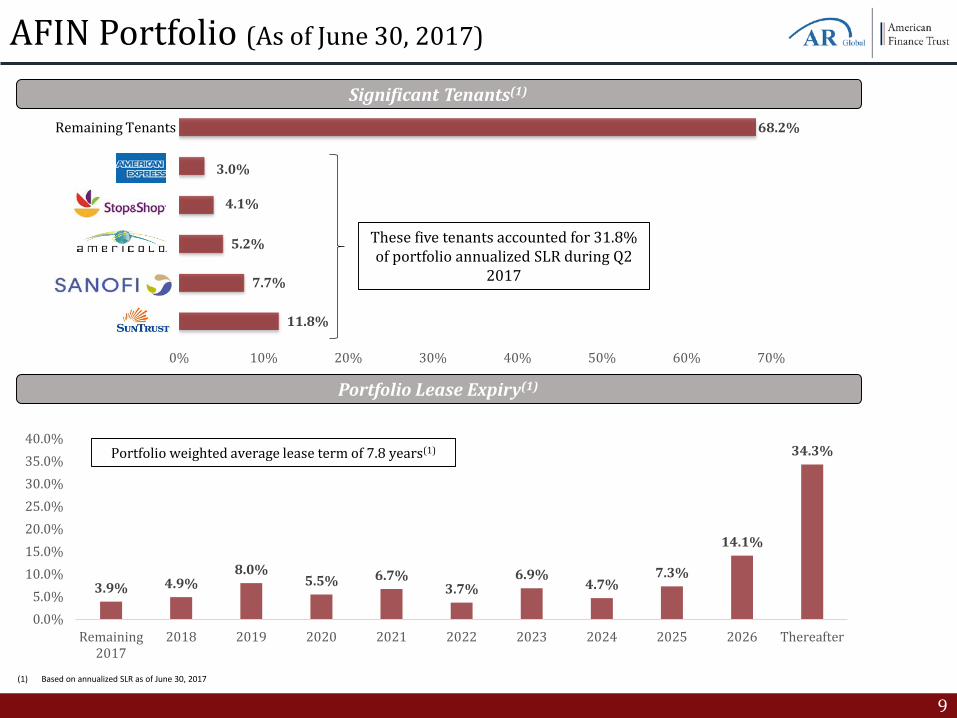
AFIN Portfolio (As of June 30, 2017)
(1) Based on annualized SLR as of June 30, 2017
Portfolio Lease Expiry(1)
11.8%
7.7%
5.2%
4.1%
3.0%
68.2%
0% 10% 20% 30% 40% 50% 60% 70%
Significant Tenants(1)
These five tenants accounted for 31.8% of portfolio annualized SLR during Q2
2017
Remaining Tenants
3.9% 4.9%8.0%
5.5% 6.7%3.7%
6.9%4.7%
7.3%
14.1%
34.3%
0.0%5.0%
10.0%15.0%20.0%25.0%30.0%35.0%40.0%
Remaining2017
2018 2019 2020 2021 2022 2023 2024 2025 2026 Thereafter
Portfolio weighted average lease term of 7.8 years(1)

10
AFIN Capital Structure (As of June 30, 2017)
Revolving Credit Facility Based on the maximum commitment, AFIN can borrow up to $325 million under its Credit Facility and AFIN has the
ability to draw an additional $95 million from this facility, providing significant liquidity to the Company The Credit Facility matures on May1, 2018
‒ AFIN is able to freely borrow or pay down this loan through the maturity date
Secured Debt Multi-tenant mortgage loan executed in August 2015, the current outstanding balance is $648 million with a
maturity in September 2020 Additional mortgage loans of $430 million outstanding, each encumbered by either single tenant or multi-tenant
assets The portfolio has a weighted average interest rate of 4.3%
Debt Capitalization ($mm)
Multi-Tenant Mortgage Loan $648
Mortgage Loans – Single-Tenant 303
Mortgage Loans – Multi-Tenant 127
Total Secured Debt $1,078
Revolving Credit Facility $230
Total Unsecured Debt $230
Total Debt $1,308
Liquidity ($mm)
Cash and Cash Equivalents $56
Unused Borrowing Capacity under Credit Facility 95
Total Liquidity $151
Key Capitalization Metrics ($bn)
Total Debt $1.3
Real Estate Assets, at cost $3.5
Total Debt/ Real Estate Assets, at cost 39%

11
Market Conditions: Single Tenant Net Lease
Steady sales and healthy pipelines within an expanding buyer pool are expected to continue over the next 12 to 18 months given net lease’s bond like returns and favorable long term performance – JLL Net Lease Investment Outlook 1H 2017
Overall sales volumes in the first half of 2017 increased 4.7% year-over-year.
Sales volumes in tertiary markets are up significantly at 20.5% year-over-year, indicating a shift from wide buyer pools to seek more competitive pricing away from primary markets.
REITs increased acquisitions by 58.1% year-over-year in tertiary markets.
This increased participation in secondary and tertiary markets is driving further cap rate compression – down an average of 38 basis points year over year.
Source: JLL: Net Lease Investment Outlook 1H 2017
12
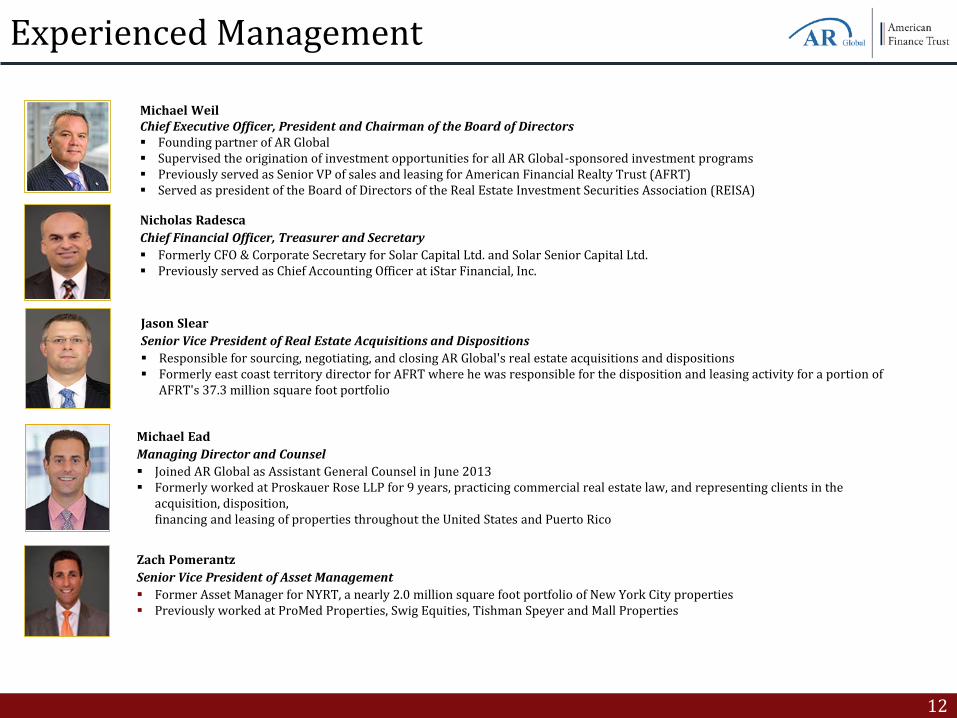
Experienced Management
Nicholas RadescaChief Financial Officer, Treasurer and Secretary Formerly CFO & Corporate Secretary for Solar Capital Ltd. and Solar Senior Capital Ltd. Previously served as Chief Accounting Officer at iStar Financial, Inc.
Michael WeilChief Executive Officer, President and Chairman of the Board of Directors Founding partner of AR Global Supervised the origination of investment opportunities for all AR Global-sponsored investment programs Previously served as Senior VP of sales and leasing for American Financial Realty Trust (AFRT) Served as president of the Board of Directors of the Real Estate Investment Securities Association (REISA)
Jason SlearSenior Vice President of Real Estate Acquisitions and Dispositions Responsible for sourcing, negotiating, and closing AR Global's real estate acquisitions and dispositions Formerly east coast territory director for AFRT where he was responsible for the disposition and leasing activity for a portion of
AFRT's 37.3 million square foot portfolio
Michael EadManaging Director and Counsel Joined AR Global as Assistant General Counsel in June 2013 Formerly worked at Proskauer Rose LLP for 9 years, practicing commercial real estate law, and representing clients in the
acquisition, disposition, financing and leasing of properties throughout the United States and Puerto Rico
Zach PomerantzSenior Vice President of Asset Management Former Asset Manager for NYRT, a nearly 2.0 million square foot portfolio of New York City properties Previously worked at ProMed Properties, Swig Equities, Tishman Speyer and Mall Properties

13
$-
$1.00
$2.00
$3.00
$4.00
$5.00
$6.00
$7.00
$8.00
Jun-
13Ju
l-13
Aug-
13Se
p-13
Oct-1
3N
ov-1
3De
c-13
Jan-
14Fe
b-14
Mar
-14
Apr-
14M
ay-1
4Ju
n-14
Jul-1
4Au
g-14
Sep-
14Oc
t-14
Nov
-14
Dec-
14Ja
n-15
Feb-
15M
ar-1
5Ap
r-15
May
-15
Jun-
15Ju
l-15
Aug-
15Se
p-15
Oct-1
5N
ov-1
5De
c-15
Jan-
16Fe
b-16
Mar
-16
Apr-
16M
ay-1
6Ju
n-16
Jul-1
6Au
g-16
Sep-
16Oc
t-16
Nov
-16
Dec-
16Ja
n-17
Feb-
17M
ar-1
7Ap
r-17
May
-17
Jun-
17
$6.82 per share (Cumulative) (1)
Consistent Distributions
Since inception, AFIN has paid out $6.82 per share of regular, monthly distributions in cash and distributions reinvested in the DRIP
(1) Totals as of each period presented represent cumulative distributions per share assuming shares had been held since May 13, 2013, the date when our distributions began to accrue. On April 9, 2013, our board of directors authorized, and we declared, distributions of $1.65 per annum, per share of common stock. A portion of the distributions paid in cash has exceeded cumulative cash flow from operations and has been paid out of cash on hand , including proceeds from the IPO, proceeds from sale of real estate investments and proceeds from financings

14
Supplemental Information
Share Repurchase ProgramAccordingly, the Board unanimously approved a second amended and restated share repurchase program the (“A&R SRP”) which became effective on July 14, 2017. The A&R SRP supersedes and replaces the Existing SRP. Under the A&R SRP, subject to certain conditions, only repurchase requests made following the death or qualifying disability, in each case as defined inthe A&R SRP, of stockholders that purchased shares of common stock of the Company or received their shares from the Company (directly or indirectly) through one or more non-cash transactions will be considered for repurchase by the Company so long as the repurchase otherwise complies with the provisions of Maryland law. Other terms and provisions of the A&R SRP remain consistent with the Existing SRP. Any requests received to date will be processed in accordance with the A&R SRP.
Distribution RateThe Board unanimously authorized a decrease in the rate at which the Company pays its daily-accrued distributions paid monthly in arrears to stockholders, effective as of July 1, 2017, from $1.65 per share on an annualized basis, to $1.30 per share on an annualized basis. This represents a change in the annualized distribution yield, based on the original purchase price of $25.00 per share, from 6.6% to 5.2%, or a change from 7.1% to 5.6% based on the Company’s most recent estimated per share net asset value as of December 31, 2016 of $23.37 per share. The distributions paid on or about July 5, 2017 reflected the original rate, while the first distributions under the new rate were paid on or about August 5, 2017.
On June 9, 2017, the board of directors of AFIN approved certain amendments to the Company’s existing share repurchase program and distribution rate
15
Forward-Looking Statements
Certain statements made in this letter are “forward-looking statements” (as defined in Section 21E of the Exchange Act),which reflect the expectations of the Company regarding future events. The forward-looking statements involve a number ofrisks, uncertainties and other factors that could cause actual results to differ materially from those contained in theforward-looking statements. Such forward-looking statements include, but are not limited to, market and otherexpectations, objectives, intentions, as well as any expectations or projections with respect to the combined company,including regarding future dividends and market valuations, and other statements that are not historical facts.
The following additional factors, among others, could cause actual results to differ from those set forth in the forward-looking statements: whether benefits from the merger with RCA are achieved; the inability to retain key personnel;continuation or deterioration of current market conditions; future regulatory or legislative actions that could adverselyaffect the company; and the business plans of the tenants of the respective parties. Additional factors that may affect futureresults are contained in the Company’s filings with the SEC, including the Annual Report on Form 10-K for the year endedDecember 31, 2016 filed on March 13, 2017, the Quarterly Reports on Form 10-Q filed on May 12, 2017 and August 11,2017, and in future periodic reports filed by the Company under the Securities Exchange Act of 1934, as amended, which areavailable at the SEC’s website at www.sec.gov. The Company disclaims any obligation to update and revise statementscontained in these materials based on new information or otherwise.
16
Risk FactorsOur potential risks and uncertainties are presented in the section titled “Item 1A. Risk Factors” disclosed in ourAnnual Report on Form 10-K for the year ended December 31, 2016 and our Quarterly Reports on Form 10-Q filedfrom time to time. The following are some of the risks and uncertainties relating to us and the proposed transaction,although not all risks and uncertainties, that could cause our actual results to differ materially from those presentedin our forward-looking statements:
All of our executive officers are also officers, managers or holders of a direct or indirect controlling interest in American Finance Advisors, LLC (our “Advisor”) orother entities under common control with AR Global. As a result, our executive officers, our Advisor and its affiliates face conflicts of interest, including significantconflicts created by our Advisor’s compensation arrangements with us and other investment programs advised by affiliates of our Sponsor and conflicts inallocating time among these entities and us, which could negatively impact our operating results.
Although we have announced our intention to list our shares of common stock on an exchange, at a time yet to be determined, there can be no assurance that ourshares of common stock will be listed or of the price at which our shares may trade. No public market currently exists, or may ever exist, for shares of our commonstock and our shares are, and may continue to be, illiquid.
Lincoln Retail REIT Services, LLC, a Delaware Limited Liability Company, and its affiliates, which provides services to our Advisor in connection with our stabilizedcore retail portfolio, faces conflicts of interest in allocating its employees’ time between providing real estate-related services to our Advisor and other programsand activities in which they are presently involved or may be involved in the future.
We depend on tenants for our rental revenue and, accordingly, our rental revenue is dependent upon the success and economic viability of our tenants. Our tenants may not achieve our rental rate incentives and our expenses could be greater, which may impact our results of operations. The business of owning and operating retail properties, including power centers and lifestyle centers, which RCA was engaged in, has different risks than our
business prior to the Merger, which primarily consisted of owning net leased real estate, including shorter lease terms, greater exposure to downturns in the retailmarket, dependence on the success and economic viability of anchor tenants and competition from other retail properties in areas where our operating real estateproperties are located and from alternative retail channels such as internet shopping.
We have not generated, and in the future may not generate, operating cash flows sufficient to cover 100% of our distributions, and, as such, we may be forced tosource distributions from borrowings, which may be at unfavorable rates, or depend on our Advisor to waive reimbursement of certain expenses or fees. There isno assurance that our Advisor will waive reimbursement of expenses or fees.
We may be unable to pay or maintain cash distributions at the current rate or increase distributions over time. We are obligated to pay fees, which may be substantial, to our Advisor and its affiliates. We are subject to risks associated with any dislocation or liquidity disruptions that may exist or occur in the credit markets of the United States of America. We may fail to continue to qualify to be treated as a real estate investment trust for U.S. federal income tax purposes, which would result in higher taxes, may
adversely affect our operations and would reduce the value of an investment in our common stock and our cash available for distributions. We may be deemed by regulators to be an investment company under the Investment Company Act of 1940, as amended (the “Investment Company Act”), and thus
subject to regulation under the Investment Company Act. The estimated net asset value per share of our common stock ("Estimated Per-Share NAV") may be lower or higher than the price of our shares of common stock on
a national securities exchange. Our common stock has never been traded on a national securities exchange and as such has no trading history, and there can be no assurance that the trading price
of our common stock will equal or exceed Estimated Per-Share NAV. The current lack of liquidity for shares of our common stock, and the lack of liquidity for RCA’s common stock prior to RCA's merger with and into a subsidiary of
the Company, could adversely affect the market price of our common stock upon listing.

17
AmericanFinanceTrust.com
For account information, including balances and the status of submitted paperwork, please call us at (866) 902-0063
Financial Advisors may view client accounts, statements and tax forms at www.dstvision.com
Shareholders may access their accounts at www.ar-global.com