Ameren Illinois Company · Canton 0.4305 0.2822 0.2544 0.2472 0.2400 0.2256 0.2225 0.2184 0.2153...
14
Ameren Illinois Company Ill. C. C. No. 1 d/b/a Ameren Illinois Original Sheet No. 41 Electric Service Schedule Ill. C. C. No. 1 TAX ADDITIONS Date of Filing, October 5, 2010 Date Effective, November 19, 2010 Issued by S.A. Cisel, President 300 Liberty Street, Peoria, IL 61602 1. STATE TAX ADDITIONS A. Electricity Excise Tax Section 2-4 of the Electricity Excise Tax Law imposes an electricity excise tax on the privilege of electric use measured by the kilowatt-hours (kWhs) delivered to the purchaser. The tax is imposed on the privilege of using in this State electricity purchased for use or consumption and not for resale, other than by municipal corporations owning and operating a local transportation system for public service, at the following rates per kWh delivered to the purchaser: (a) For the first 2000 kWhs used or consumed in a month: 0.330 cents per kWh; (b) For the next 48,000 kWhs used or consumed in a month: 0.319 cents per kWh; (c) For the next 50,000 kWhs used or consumed in a month: 0.303 cents per kWh; (d) For the next 400,000 kWhs used or consumed in a month: 0.297 cents per kWh; (e) For the next 500,000 kWhs used or consumed in a month: 0.286 cents per kWh; (f) For the next 2,000,000 kWhs used or consumed in a month: 0.270 cents per kWh; (g) For the next 2,000,000 kWhs used or consumed in a month: 0.254 cents per kWh; (h) For the next 5,000,000 kWhs used or consumed in a month: 0.233 cents per kWh; (i) For the next 10,000,000 kWhs used or consumed in a month: 0.207 cents per kWh; (j) For all electricity in excess of 20,000,000 kWhs used or consumed in a month: 0.202 cents per kWh;
Transcript of Ameren Illinois Company · Canton 0.4305 0.2822 0.2544 0.2472 0.2400 0.2256 0.2225 0.2184 0.2153...

Ameren Illinois Company Ill. C. C. No. 1
d/b/a Ameren Illinois Original Sheet No. 41
Electric Service Schedule Ill. C. C. No. 1
TAX ADDITIONS
Date of Filing, October 5, 2010 Date Effective, November 19, 2010
Issued by S.A. Cisel, President
300 Liberty Street, Peoria, IL 61602
1. STATE TAX ADDITIONS
A. Electricity Excise Tax
Section 2-4 of the Electricity Excise Tax Law imposes an electricity excise tax on the
privilege of electric use measured by the kilowatt-hours (kWhs) delivered to the purchaser.
The tax is imposed on the privilege of using in this State electricity purchased for use or
consumption and not for resale, other than by municipal corporations owning and operating a
local transportation system for public service, at the following rates per kWh delivered to the
purchaser:
(a) For the first 2000 kWhs used or consumed in a month: 0.330 cents per kWh;
(b) For the next 48,000 kWhs used or consumed in a month: 0.319 cents per kWh;
(c) For the next 50,000 kWhs used or consumed in a month: 0.303 cents per kWh;
(d) For the next 400,000 kWhs used or consumed in a month: 0.297 cents per kWh;
(e) For the next 500,000 kWhs used or consumed in a month: 0.286 cents per kWh;
(f) For the next 2,000,000 kWhs used or consumed in a month: 0.270 cents per kWh;
(g) For the next 2,000,000 kWhs used or consumed in a month: 0.254 cents per kWh;
(h) For the next 5,000,000 kWhs used or consumed in a month: 0.233 cents per kWh;
(i) For the next 10,000,000 kWhs used or consumed in a month: 0.207 cents per kWh;
(j) For all electricity in excess of 20,000,000 kWhs used or consumed in a month:
0.202 cents per kWh;

Ameren Illinois Company Ill. C. C. No. 1
d/b/a Ameren Illinois 4th Revised Sheet No. 41.001
Electric Service Schedule Ill. C. C. No. 1 (Canceling 3rd Revised Sheet No. 41.001)
TAX ADDITIONS
Date of Filing, October 4, 2012 Date Effective, October 19, 2012
Filed Pursuant to ICC Order Issued by R.J. Mark, President & CEO
in Docket No. 12-0001 6 Executive Drive, Collinsville, IL 62234
*Asterisk denotes change
Non-residential electric purchasers have the option to register with the Department of
Revenue of the State of Illinois to become a self-assessing purchaser of electricity. In lieu of
the foregoing rates, the tax is imposed on a self-assessing purchaser at the rate of 5.1% of the
self-assessing purchaser’s purchase price for all electricity distributed, supplied, furnished,
sold, transmitted and delivered to the self-assessing purchaser in a month.
This tax shall be collected from the purchaser, other than a self assessing purchaser, by the
Company and shall be remitted to the Department of Revenue of the State of Illinois. A self
assessing purchaser is required to pay the tax directly to the Department of Revenue of the
State of Illinois.
* B. EDT Cost Recovery
Section 1 of the Public Utilities Revenue Act imposes a Distribution Tax on the Company
based on the quantity of electricity that is delivered in the State of Illinois. This tax is a
replacement for the invested capital tax on electric utilities. In order to recover the
Distribution Tax amount imposed upon the Company by the State of Illinois from Customers
taking electric delivery service from the Company, the Company will collect from such
Customers an EDT Cost Recovery based on the Customer’s electric use as measured in
kilowatt-hours (kWhs) which are delivered to the Customer. The EDT Cost Recovery charge
to be applicable to each kWh delivered to Customers taking service under each applicable
Rate is shown in the Delivery Charges Informational Sheet supplemental to the Rate MAP-P
tariff.
The EDT Cost Recovery shall be shown as a separate line item on Customers bills.

Ameren Illinois Company Ill. C. C. No. 1
d/b/a Ameren Illinois Original Sheet No. 41.002
Electric Service Schedule Ill. C. C. No. 1
TAX ADDITIONS
Date of Filing, October 5, 2010 Date Effective, November 19, 2010
Issued by S.A. Cisel, President
300 Liberty Street, Peoria, IL 61602
2. MUNICIPAL TAX ADDITIONS
Pursuant to the provisions of The Public Utilities Act, as amended, the Company will make an
additional charge to its customers receiving service in municipalities imposing the tax authorized
by Section 8-11-2 of the Illinois Municipal Code. Said additional charge will be separately
shown on each such customer’s bill and designated “Municipal Charge” or by a similar legend.
The tax additions shown on the following Sheets include an allowance of three percent of the tax to
cover the administration expense associated with accounting and collection in accordance with
Section 8-11-2 subsection 4 ( c ) of the Illinois Municipal Code.
The effective date for such additions will coincide with the date upon which billings become
subject to the tax so levied.

Ameren Illinois Company Ill. C. C. No. 1
d/b/a Ameren Illinois 5th Revised Sheet No. 41.003
Electric Service Schedule Ill. C. C. No. 1 (Canceling 4th Revised Sheet No. 41.003)
TAX ADDITIONS
Date of Filing, August 25, 2017 Date Effective, September 1, 2017
Pursuant to Municipal Ordinance Issued by R.J. Mark, President & CEO
6 Executive Drive, Collinsville, IL 62234
*Asterisk denotes change
Rate Zone I
Per kWh
(Cents per kWh by Usage Block)
Municipality A B C D E F G H I J Effective
Alorton 0.3801 0.2493 0.2245 0.2184 0.2122 0.1998 0.1967 0.1936 0.1906 0.1875 06/01/1999
Alsey 0.6283 0.4120 0.3708 0.3605 0.3502 0.3296 0.3245 0.3193 0.3142 0.3090 08/01/2010
Alto Pass 0.4027 0.2647 0.2379 0.2318 0.2245 0.2112 0.2081 0.2050 0.2019 0.1978 08/01/1999
*Alton 0.6283 0.4120 0.3708 0.3605 0.3502 0.3296 0.3245 0.3193 0.3142 0.3090 09/01/2017
Arrowsmith 0.6283 0.4120 0.3708 0.3605 0.3502 0.3296 0.3245 0.3193 0.3142 0.3090 06/01/2010
Ashland 0.5026 0.3296 0.2966 0.2884 0.2802 0.2637 0.2596 0.2554 0.2513 0.2472 08/01/2015
Barry 0.3142 0.2060 0.1854 0.1803 0.1751 0.1648 0.1627 0.1597 0.1576 0.1545 05/01/2015
Baylis 0.4614 0.3028 0.2719 0.2647 0.2575 0.2421 0.2379 0.2348 0.2307 0.2266 02/01/2000
Beardstown 0.5150 0.3378 0.3039 0.2956 0.2874 0.2699 0.2657 0.2616 0.2575 0.2534 04/01/2000
Belleville 0.5289 0.3904 0.3565 0.3168 0.2765 0.2763 0.2762 0.2761 0.2760 0.2758 06/01/2002
Bellmont 0.6283 0.4120 0.3708 0.3605 0.3502 0.3296 0.3245 0.3193 0.3142 0.3090 01/01/2017
Benton 0.6283 0.4120 0.3708 0.3605 0.3502 0.3296 0.3245 0.3193 0.3142 0.3090 01/01/2017
Blue Mound 0.2336 0.1532 0.1378 0.1340 0.1302 0.1226 0.1206 0.1188 0.1168 0.1148 03/01/1999
Bluffs 0.4367 0.2863 0.2575 0.2503 0.2441 0.2297 0.2256 0.2225 0.2184 0.2153 11/01/1998
Brookport 0.4419 0.2894 0.2606 0.2534 0.2462 0.2318 0.2276 0.2245 0.2204 0.2173 09/01/2004
Buckley 0.4305 0.2822 0.2544 0.2472 0.2400 0.2256 0.2225 0.2184 0.2153 0.2112 06/01/2005
Buckner 0.6283 0.4120 0.3708 0.3605 0.3502 0.3296 0.3245 0.3193 0.3142 0.3090 05/01/2011
Bush 0.4120 0.2699 0.2431 0.2369 0.2297 0.2163 0.2132 0.2091 0.2060 0.2029 12/01/1998
Cahokia 0.4110 0.2699 0.2431 0.2359 0.2297 0.2153 0.2122 0.2091 0.2060 0.2019 08/01/1999
Camargo 0.4295 0.2822 0.2534 0.2462 0.2400 0.2256 0.2225 0.2184 0.2153 0.2112 08/01/1999
Cambria 0.3873 0.2534 0.2287 0.2225 0.2153 0.2029 0.1998 0.1967 0.1936 0.1906 10/01/1998
Camp Point 0.3420 0.2245 0.2019 0.1957 0.1906 0.1792 0.1761 0.1741 0.1710 0.1679 08/01/1999
Canton 0.4305 0.2822 0.2544 0.2472 0.2400 0.2256 0.2225 0.2184 0.2153 0.2122 08/01/1999
Carbondale 0.4594 0.3008 0.2709 0.2637 0.2554 0.2410 0.2369 0.2328 0.2297 0.2256 09/01/1999
Carterville 0.4130 0.2709 0.2441 0.2369 0.2307 0.2173 0.2132 0.2101 0.2070 0.2029 11/01/1999
Caseyville 0.3047 0.1997 0.1797 0.1748 0.1697 0.1598 0.1573 0.1548 0.1523 0.1499 12/01/1998
Centreville 0.4336 0.2843 0.2554 0.2482 0.2421 0.2276 0.2235 0.2204 0.2163 0.2132 08/01/1999
Charleston 0.2925 0.1916 0.1730 0.1679 0.1627 0.1535 0.1514 0.1483 0.1463 0.1442 08/01/1999
Clay City 0.2596 0.1700 0.1535 0.1494 0.1442 0.1360 0.1339 0.1318 0.1298 0.1277 04/01/2004
Clayton 0.2657 0.1741 0.1566 0.1524 0.1483 0.1401 0.1370 0.1349 0.1329 0.1308 03/01/2000
Usage Block Definitions:
A first 2,000 kWh used or consumed in a month
B next 48,000 kWh used or consumed in a month
C next 50,000 kWh used or consumed in a month
D next 400,000 kWh used or consumed in a month
E next 500,000 kWh used or consumed in a month
F next 2,000,000 kWh used or consumed in a month
G next 2,000,000 kWh used or consumed in a month
H next 5,000,000 kWh used or consumed in a month
I next 10,000,000 kWh used or consumed in a month
J all over 20,000,000 kWh used or consumed in a month

Ameren Illinois Company Ill. C. C. No. 1
d/b/a Ameren Illinois 6th Revised Sheet No. 41.004
Electric Service Schedule Ill. C. C. No. 1 (Canceling 5th Revised Sheet No. 41.004)
TAX ADDITIONS
Date of Filing, January 29, 2016 Date Effective, February 1, 2016
Filed Pursuant to Municipal Ordinance Issued by R.J. Mark, President & CEO
6 Executive Drive, Collinsville, IL 62234
*Asterisk denotes change
Rate Zone I
Per kWh
(Cents per kWh by Usage Block)
Municipality A B C D E F G H I J Effective
*Cobden 0.6283 0.4120 0.3708 0.3605 0.3502 0.3296 0.3245 0.3193 0.3142 0.3090 02/01/2016
Crainville 0.3996 0.2627 0.2359 0.2297 0.2235 0.2101 0.2070 0.2029 0.1998 0.1967 11/01/1998
Crossville 0.4573 0.2997 0.2699 0.2627 0.2544 0.2400 0.2359 0.2328 0.2287 0.2245 08/01/1999
Desoto 0.6283 0.4120 0.3708 0.3605 0.3502 0.3296 0.3245 0.3193 0.3142 0.3090 01/01/2016
Dowell 0.4089 0.2678 0.2410 0.2348 0.2276 0.2142 0.2112 0.2081 0.2039 0.2009 12/01/1998
East Alton 0.6283 0.4120 0.3708 0.3605 0.3502 0.3296 0.3245 0.3193 0.3142 0.3090 06/01/2010
East St. Louis 0.6283 0.4120 0.3708 0.3605 0.3502 0.3296 0.3245 0.3193 0.3142 0.3090 01/01/2016
Edgewood 0.4522 0.2966 0.2668 0.2596 0.2524 0.2369 0.2338 0.2297 0.2256 0.2225 08/01/1999
Edwardsville 0.3909 0.2564 0.2307 0.2242 0.2178 0.2051 0.2019 0.1987 0.1954 0.1922 02/01/2002
Effingham 0.1421 0.0927 0.0834 0.0814 0.0793 0.0742 0.0731 0.0721 0.0711 0.0700 12/01/1998
Elkville 0.6283 0.4120 0.3708 0.3605 0.3502 0.3296 0.3245 0.3193 0.3142 0.3090 09/01/2013
Elsah 0.4594 0.3018 0.2719 0.2637 0.2565 0.2410 0.2379 0.2338 0.2297 0.2266 08/01/1999
Energy 0.3883 0.2544 0.2287 0.2225 0.2163 0.2039 0.2009 0.1978 0.1936 0.1906 01/01/1999
Exeter 0.5026 0.3296 0.2966 0.2884 0.2802 0.2637 0.2596 0.2554 0.2513 0.2472 11/01/2011
Fairmont City 0.4048 0.2657 0.2390 0.2318 0.2256 0.2122 0.2091 0.2060 0.2019 0.1988 08/01/1999
Fisher 0.2719 0.1782 0.1607 0.1566 0.1514 0.1432 0.1411 0.1380 0.1360 0.1339 07/01/1999
Foosland 0.4717 0.3090 0.2781 0.2709 0.2627 0.2472 0.2441 0.2400 0.2359 0.2318 05/01/2002
Forrest 0.4470 0.2925 0.2637 0.2565 0.2493 0.2348 0.2307 0.2266 0.2235 0.2194 08/01/1999
Freeman Spur 0.4089 0.2678 0.2410 0.2348 0.2276 0.2142 0.2112 0.2081 0.2039 0.2009 10/01/1998
Gibson (Gibson) 0.2853 0.1864 0.1679 0.1638 0.1586 0.1494 0.1473 0.1452 0.1421 0.1401 08/01/1999
Glasford 0.4398 0.2884 0.2596 0.2524 0.2451 0.2307 0.2276 0.2235 0.2204 0.2163 09/01/2006
Grafton 0.4614 0.3028 0.2719 0.2647 0.2575 0.2421 0.2379 0.2348 0.2307 0.2266 11/01/1998
Grand Tower 0.4141 0.2719 0.2441 0.2379 0.2307 0.2173 0.2142 0.2101 0.2070 0.2039 02/01/1999
Griggsville 0.4666 0.3059 0.2750 0.2678 0.2596 0.2451 0.2410 0.2369 0.2328 0.2297 05/01/2004
Hamilton (1) 0.3958 0.2596 0.2336 0.2271 0.2206 0.2076 0.2045 0.2012 0.1980 0.1947 07/01/2015
Hanaford (Logan) 0.3842 0.2513 0.2266 0.2204 0.2142 0.2009 0.1978 0.1947 0.1916 0.1885 08/01/1999
Hartford 0.1710 0.1123 0.1009 0.0979 0.0958 0.0896 0.0886 0.0876 0.0855 0.1845 03/01/1999
Hindsboro 0.4244 0.2781 0.2503 0.2431 0.2369 0.2225 0.2194 0.2153 0.2122 0.2091 08/01/1999
Hoopeston 0.4481 0.2936 0.2637 0.2565 0.2493 0.2348 0.2307 0.2276 0.2235 0.2204 08/01/1999
Johnston City 0.4069 0.2668 0.2400 0.2338 0.2266 0.2132 0.2101 0.2070 0.2039 0.1998 10/01/1998
Usage Block Definitions:
A first 2,000 kWh used or consumed in a month
B next 48,000 kWh used or consumed in a month
C next 50,000 kWh used or consumed in a month
D next 400,000 kWh used or consumed in a month
E next 500,000 kWh used or consumed in a month
F next 2,000,000 kWh used or consumed in a month
G next 2,000,000 kWh used or consumed in a month
H next 5,000,000 kWh used or consumed in a month
I next 10,000,000 kWh used or consumed in a month
J all over 20,000,000 kWh used or consumed in a month
(1) The City of Hamilton and all public school districts and public schools within the City of Hamilton
shall be exempt from this municipal tax.
Ameren Illinois Company Ill. C. C. No. 1
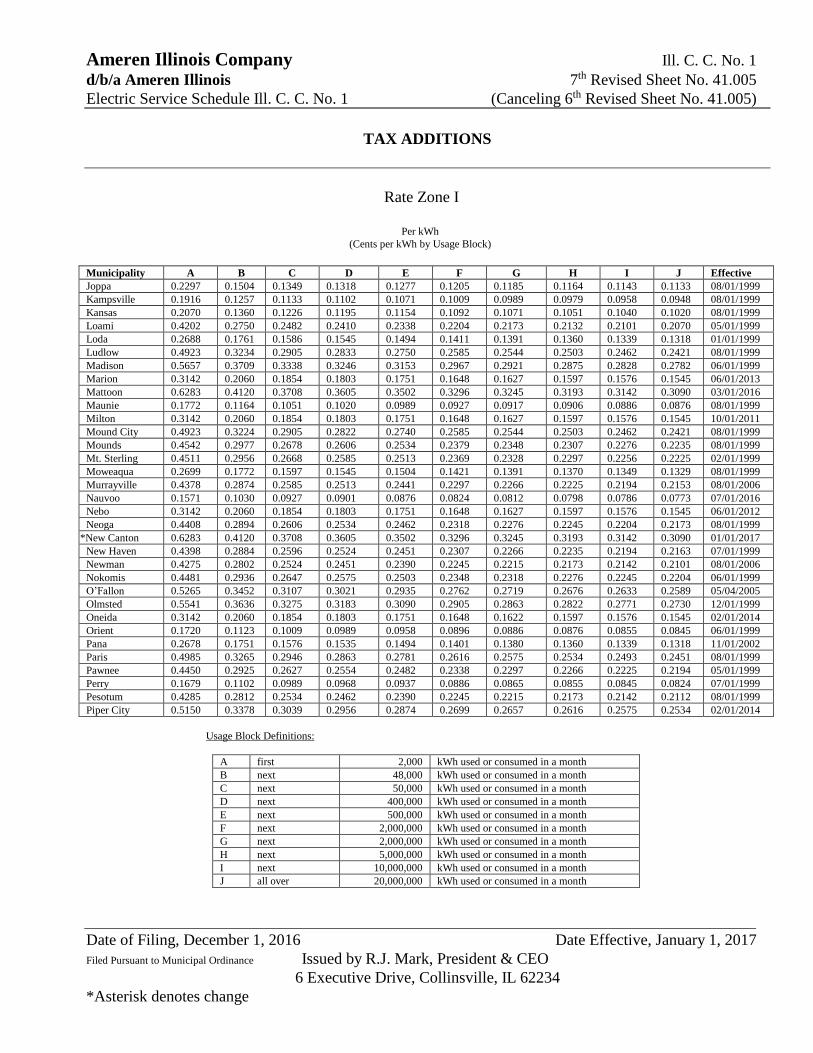
d/b/a Ameren Illinois 7th Revised Sheet No. 41.005
Electric Service Schedule Ill. C. C. No. 1 (Canceling 6th Revised Sheet No. 41.005)
TAX ADDITIONS
Date of Filing, December 1, 2016 Date Effective, January 1, 2017
Filed Pursuant to Municipal Ordinance Issued by R.J. Mark, President & CEO
6 Executive Drive, Collinsville, IL 62234
*Asterisk denotes change
Rate Zone I
Per kWh
(Cents per kWh by Usage Block)
Municipality A B C D E F G H I J Effective
Joppa 0.2297 0.1504 0.1349 0.1318 0.1277 0.1205 0.1185 0.1164 0.1143 0.1133 08/01/1999
Kampsville 0.1916 0.1257 0.1133 0.1102 0.1071 0.1009 0.0989 0.0979 0.0958 0.0948 08/01/1999
Kansas 0.2070 0.1360 0.1226 0.1195 0.1154 0.1092 0.1071 0.1051 0.1040 0.1020 08/01/1999
Loami 0.4202 0.2750 0.2482 0.2410 0.2338 0.2204 0.2173 0.2132 0.2101 0.2070 05/01/1999
Loda 0.2688 0.1761 0.1586 0.1545 0.1494 0.1411 0.1391 0.1360 0.1339 0.1318 01/01/1999
Ludlow 0.4923 0.3234 0.2905 0.2833 0.2750 0.2585 0.2544 0.2503 0.2462 0.2421 08/01/1999
Madison 0.5657 0.3709 0.3338 0.3246 0.3153 0.2967 0.2921 0.2875 0.2828 0.2782 06/01/1999
Marion 0.3142 0.2060 0.1854 0.1803 0.1751 0.1648 0.1627 0.1597 0.1576 0.1545 06/01/2013
Mattoon 0.6283 0.4120 0.3708 0.3605 0.3502 0.3296 0.3245 0.3193 0.3142 0.3090 03/01/2016
Maunie 0.1772 0.1164 0.1051 0.1020 0.0989 0.0927 0.0917 0.0906 0.0886 0.0876 08/01/1999
Milton 0.3142 0.2060 0.1854 0.1803 0.1751 0.1648 0.1627 0.1597 0.1576 0.1545 10/01/2011
Mound City 0.4923 0.3224 0.2905 0.2822 0.2740 0.2585 0.2544 0.2503 0.2462 0.2421 08/01/1999
Mounds 0.4542 0.2977 0.2678 0.2606 0.2534 0.2379 0.2348 0.2307 0.2276 0.2235 08/01/1999
Mt. Sterling 0.4511 0.2956 0.2668 0.2585 0.2513 0.2369 0.2328 0.2297 0.2256 0.2225 02/01/1999
Moweaqua 0.2699 0.1772 0.1597 0.1545 0.1504 0.1421 0.1391 0.1370 0.1349 0.1329 08/01/1999
Murrayville 0.4378 0.2874 0.2585 0.2513 0.2441 0.2297 0.2266 0.2225 0.2194 0.2153 08/01/2006
Nauvoo 0.1571 0.1030 0.0927 0.0901 0.0876 0.0824 0.0812 0.0798 0.0786 0.0773 07/01/2016
Nebo 0.3142 0.2060 0.1854 0.1803 0.1751 0.1648 0.1627 0.1597 0.1576 0.1545 06/01/2012
Neoga 0.4408 0.2894 0.2606 0.2534 0.2462 0.2318 0.2276 0.2245 0.2204 0.2173 08/01/1999
*New Canton 0.6283 0.4120 0.3708 0.3605 0.3502 0.3296 0.3245 0.3193 0.3142 0.3090 01/01/2017
New Haven 0.4398 0.2884 0.2596 0.2524 0.2451 0.2307 0.2266 0.2235 0.2194 0.2163 07/01/1999
Newman 0.4275 0.2802 0.2524 0.2451 0.2390 0.2245 0.2215 0.2173 0.2142 0.2101 08/01/2006
Nokomis 0.4481 0.2936 0.2647 0.2575 0.2503 0.2348 0.2318 0.2276 0.2245 0.2204 06/01/1999
O’Fallon 0.5265 0.3452 0.3107 0.3021 0.2935 0.2762 0.2719 0.2676 0.2633 0.2589 05/04/2005
Olmsted 0.5541 0.3636 0.3275 0.3183 0.3090 0.2905 0.2863 0.2822 0.2771 0.2730 12/01/1999
Oneida 0.3142 0.2060 0.1854 0.1803 0.1751 0.1648 0.1622 0.1597 0.1576 0.1545 02/01/2014
Orient 0.1720 0.1123 0.1009 0.0989 0.0958 0.0896 0.0886 0.0876 0.0855 0.0845 06/01/1999
Pana 0.2678 0.1751 0.1576 0.1535 0.1494 0.1401 0.1380 0.1360 0.1339 0.1318 11/01/2002
Paris 0.4985 0.3265 0.2946 0.2863 0.2781 0.2616 0.2575 0.2534 0.2493 0.2451 08/01/1999
Pawnee 0.4450 0.2925 0.2627 0.2554 0.2482 0.2338 0.2297 0.2266 0.2225 0.2194 05/01/1999
Perry 0.1679 0.1102 0.0989 0.0968 0.0937 0.0886 0.0865 0.0855 0.0845 0.0824 07/01/1999
Pesotum 0.4285 0.2812 0.2534 0.2462 0.2390 0.2245 0.2215 0.2173 0.2142 0.2112 08/01/1999
Piper City 0.5150 0.3378 0.3039 0.2956 0.2874 0.2699 0.2657 0.2616 0.2575 0.2534 02/01/2014
Usage Block Definitions:
A first 2,000 kWh used or consumed in a month
B next 48,000 kWh used or consumed in a month
C next 50,000 kWh used or consumed in a month
D next 400,000 kWh used or consumed in a month
E next 500,000 kWh used or consumed in a month
F next 2,000,000 kWh used or consumed in a month
G next 2,000,000 kWh used or consumed in a month
H next 5,000,000 kWh used or consumed in a month
I next 10,000,000 kWh used or consumed in a month
J all over 20,000,000 kWh used or consumed in a month

Ameren Illinois Company Ill. C. C. No. 1
d/b/a Ameren Illinois 5th Revised Sheet No. 41.006
Electric Service Schedule Ill. C. C. No. 1 (Canceling 4th Revised Sheet No. 41.006)
TAX ADDITIONS
Date of Filing, June 24, 2015 Date Effective, July 1, 2015
Filed Pursuant to Municipal Ordinance Issued by R.J. Mark, President & CEO
6 Executive Drive, Collinsville, IL 62234
*Asterisk denotes change
Rate Zone I
Per kWh
(Cents per kWh by Usage Block)
Municipality A B C D E F G H I J Effective
*Pittsburg 0.6283 0.4120 0.3708 0.3605 0.3502 0.3296 0.3245 0.3193 0.3142 0.3090 07/01/2015
Pontoon Beach 0.5144 0.3481 0.3094 0.3090 0.2987 0.2884 0.2781 0.2678 0.2575 0.2472 06/01/1999
Pulaski 0.4604 0.3018 0.2719 0.2647 0.2565 0.2421 0.2379 0.2338 0.2307 0.2266 04/01/2000
Rankin 0.4563 0.2987 0.2688 0.2616 0.2544 0.2390 0.2359 0.2318 0.2276 0.2245 08/01/1999
Roodhouse 0.4779 0.3131 0.2822 0.2740 0.2657 0.2503 0.2462 0.2431 0.2390 0.2348 08/01/1999
Roxana 0.3142 0.2060 0.1854 0.1803 0.1751 0.1648 0.1622 0.1597 0.1571 0.1545 05/01/2011
Royalton 0.4099 0.2688 0.2421 0.2348 0.2287 0.2153 0.2122 0.2081 0.2050 0.2019 08/01/1999
Sadorus 0.3121 0.2050 0.1844 0.1792 0.1741 0.1638 0.1617 0.1586 0.1566 0.1535 06/01/1999
Sesser 0.4110 0.2688 0.2421 0.2359 0.2287 0.2153 0.2122 0.2091 0.2050 0.2019 07/01/1999
Sheldon 0.4717 0.3090 0.2781 0.2709 0.2627 0.2472 0.2431 0.2400 0.2359 0.2318 09/01/2002
South Roxana 0.6283 0.4120 0.3708 0.3605 0.3502 0.3296 0.3245 0.3193 0.3142 0.3090 04/01/2011
St. Elmo 0.2678 0.1751 0.1576 0.1535 0.1494 0.1401 0.1380 0.1360 0.1339 0.1318 07/02/2001
Strasburg 0.1751 0.1154 0.1040 0.1009 0.0979 0.0917 0.0906 0.0896 0.0876 0.0865 01/01/1999
Tamms 0.4717 0.3090 0.2781 0.2709 0.2627 0.2472 0.2431 0.2400 0.2359 0.2318 05/01/2002
Taylorville 0.3770 0.2472 0.2225 0.2163 0.2101 0.1978 0.1947 0.1916 0.1885 0.1854 01/01/2009
Valier 0.3924 0.2575 0.2318 0.2245 0.2184 0.2060 0.2029 0.1998 0.1957 0.1926 08/01/1999
Vermont 0.3893 0.2554 0.2297 0.2235 0.2173 0.2039 0.2009 0.1978 0.1947 0.1916 08/01/1999
Versailles 0.2709 0.1772 0.1597 0.1555 0.1504 0.1421 0.1401 0.1370 0.1349 0.1329 04/30/1999
Villa Grove 0.4244 0.2781 0.2503 0.2431 0.2369 0.2225 0.2194 0.2153 0.2122 0.2091 08/01/1999
Warsaw 0.5026 0.3296 0.2966 0.2884 0.2802 0.2637 0.2596 0.2554 0.2513 0.2472 05/01/2012
Washington-Park
Limited (1)
0.4192 0.2750 0.2472 0.2400 0.2338 0.2194 0.2163 0.2132 0.2091 0.2060 08/01/1999
Washington Park 0.4192 0.2750 0.2472 0.2400 0.2338 0.2194 0.2163 0.2132 0.2091 0.2060 08/01/1999
Westfield 0.4419 0.2894 0.2606 0.2534 0.2462 0.2318 0.2276 0.2245 0.2204 0.2173 11/01/1998
Winchester 0.5026 0.3296 0.2966 0.2884 0.2802 0.2637 0.2596 0.2554 0.2513 0.2472 10/01/2011
Woodson 0.4491 0.2946 0.2647 0.2575 0.2503 0.2359 0.2318 0.2287 0.2245 0.2204 01/01/2005
Zeigler 0.4141 0.2709 0.2441 0.2369 0.2307 0.2173 0.2132 0.2101 0.2070 0.2029 08/01/1999
Usage Block Definitions:
A first 2,000 kWh used or consumed in a month
B next 48,000 kWh used or consumed in a month
C next 50,000 kWh used or consumed in a month
D next 400,000 kWh used or consumed in a month
E next 500,000 kWh used or consumed in a month
F next 2,000,000 kWh used or consumed in a month
G next 2,000,000 kWh used or consumed in a month
H next 5,000,000 kWh used or consumed in a month
I next 10,000,000 kWh used or consumed in a month
J all over 20,000,000 kWh used or consumed in a month
(1) Limited to manufacturing concerns having at least 75 employees
Ameren Illinois Company Ill. C. C. No. 1
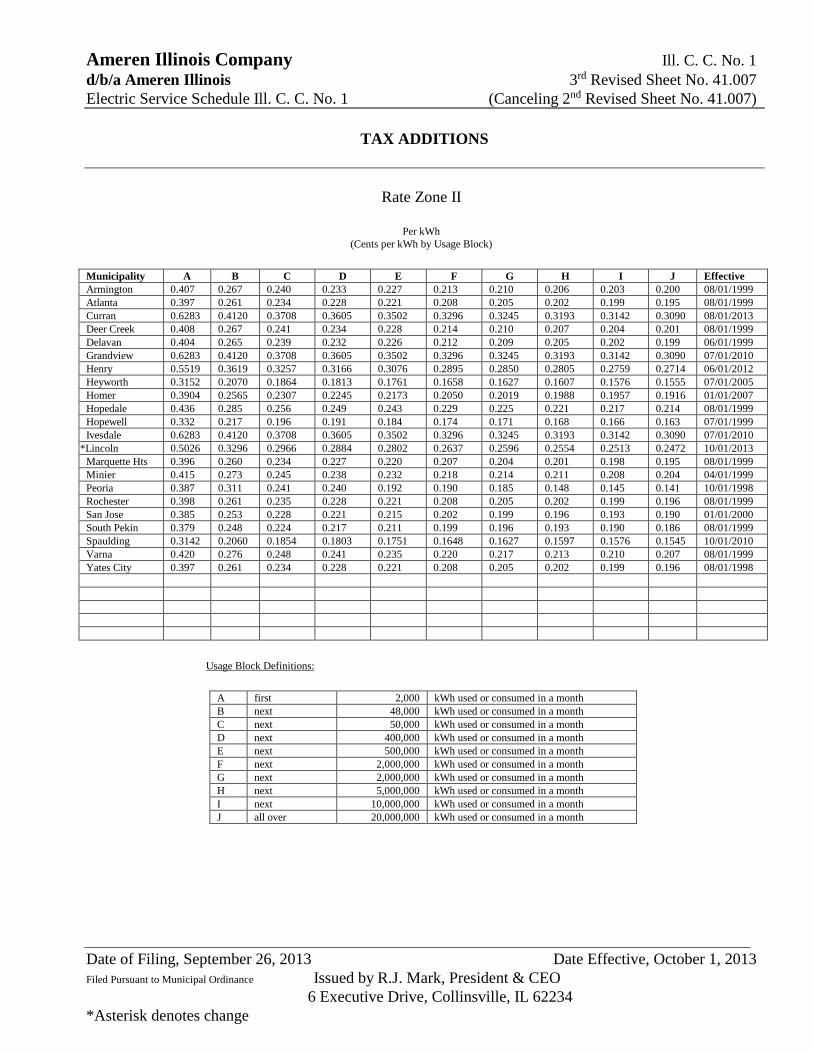
d/b/a Ameren Illinois 3rd Revised Sheet No. 41.007
Electric Service Schedule Ill. C. C. No. 1 (Canceling 2nd Revised Sheet No. 41.007)
TAX ADDITIONS
Date of Filing, September 26, 2013 Date Effective, October 1, 2013
Filed Pursuant to Municipal Ordinance Issued by R.J. Mark, President & CEO
6 Executive Drive, Collinsville, IL 62234
*Asterisk denotes change
Rate Zone II
Per kWh
(Cents per kWh by Usage Block)
Municipality A B C D E F G H I J Effective
Armington 0.407 0.267 0.240 0.233 0.227 0.213 0.210 0.206 0.203 0.200 08/01/1999
Atlanta 0.397 0.261 0.234 0.228 0.221 0.208 0.205 0.202 0.199 0.195 08/01/1999
Curran 0.6283 0.4120 0.3708 0.3605 0.3502 0.3296 0.3245 0.3193 0.3142 0.3090 08/01/2013
Deer Creek 0.408 0.267 0.241 0.234 0.228 0.214 0.210 0.207 0.204 0.201 08/01/1999
Delavan 0.404 0.265 0.239 0.232 0.226 0.212 0.209 0.205 0.202 0.199 06/01/1999
Grandview 0.6283 0.4120 0.3708 0.3605 0.3502 0.3296 0.3245 0.3193 0.3142 0.3090 07/01/2010
Henry 0.5519 0.3619 0.3257 0.3166 0.3076 0.2895 0.2850 0.2805 0.2759 0.2714 06/01/2012
Heyworth 0.3152 0.2070 0.1864 0.1813 0.1761 0.1658 0.1627 0.1607 0.1576 0.1555 07/01/2005
Homer 0.3904 0.2565 0.2307 0.2245 0.2173 0.2050 0.2019 0.1988 0.1957 0.1916 01/01/2007
Hopedale 0.436 0.285 0.256 0.249 0.243 0.229 0.225 0.221 0.217 0.214 08/01/1999
Hopewell 0.332 0.217 0.196 0.191 0.184 0.174 0.171 0.168 0.166 0.163 07/01/1999
Ivesdale 0.6283 0.4120 0.3708 0.3605 0.3502 0.3296 0.3245 0.3193 0.3142 0.3090 07/01/2010
*Lincoln 0.5026 0.3296 0.2966 0.2884 0.2802 0.2637 0.2596 0.2554 0.2513 0.2472 10/01/2013
Marquette Hts 0.396 0.260 0.234 0.227 0.220 0.207 0.204 0.201 0.198 0.195 08/01/1999
Minier 0.415 0.273 0.245 0.238 0.232 0.218 0.214 0.211 0.208 0.204 04/01/1999
Peoria 0.387 0.311 0.241 0.240 0.192 0.190 0.185 0.148 0.145 0.141 10/01/1998
Rochester 0.398 0.261 0.235 0.228 0.221 0.208 0.205 0.202 0.199 0.196 08/01/1999
San Jose 0.385 0.253 0.228 0.221 0.215 0.202 0.199 0.196 0.193 0.190 01/01/2000
South Pekin 0.379 0.248 0.224 0.217 0.211 0.199 0.196 0.193 0.190 0.186 08/01/1999
Spaulding 0.3142 0.2060 0.1854 0.1803 0.1751 0.1648 0.1627 0.1597 0.1576 0.1545 10/01/2010
Varna 0.420 0.276 0.248 0.241 0.235 0.220 0.217 0.213 0.210 0.207 08/01/1999
Yates City 0.397 0.261 0.234 0.228 0.221 0.208 0.205 0.202 0.199 0.196 08/01/1998
Usage Block Definitions:
A first 2,000 kWh used or consumed in a month
B next 48,000 kWh used or consumed in a month
C next 50,000 kWh used or consumed in a month
D next 400,000 kWh used or consumed in a month
E next 500,000 kWh used or consumed in a month
F next 2,000,000 kWh used or consumed in a month
G next 2,000,000 kWh used or consumed in a month
H next 5,000,000 kWh used or consumed in a month
I next 10,000,000 kWh used or consumed in a month
J all over 20,000,000 kWh used or consumed in a month

Ameren Illinois Company Ill. C. C. No. 1
d/b/a Ameren Illinois 6th Revised Sheet No. 41.008
Electric Service Schedule Ill. C. C. No. 1 (Canceling 5th Revised Sheet No. 41.008)
TAX ADDITIONS
Date of Filing, December 17, 2015 Date Effective, January 1, 2016
Filed Pursuant to Municipal Ordinance Issued by R.J. Mark, President & CEO
6 Executive Drive, Collinsville, IL 62234
*Asterisk denotes change
Rate Zone III
Per kWh
(Cents per kWh by Usage Block)
Name of
Municipality A B C D E F G H I J Effective
Alexis 0.4421 0.2898 0.2609 0.2536 0.2464 0.2319 0.2282 0.2246 0.2210 0.2174 08/01/2008
*Arlington 0.6283 0.4120 0.3708 0.3605 0.3502 0.3296 0.3245 0.3193 0.3142 0.3090 01/01/2016
Ava 0.5324 0.3491 0.3142 0.3055 0.2967 0.2792 0.2749 0.2706 0.2662 0.2618 08/01/1998
Baldwin 0.5369 0.3522 0.3169 0.3081 0.2993 0.2817 0.2773 0.2728 0.2685 0.2641 08/12/1998
Belleville 0.5289 0.3904 0.3565 0.3168 0.2765 0.2763 0.2762 0.2761 0.2760 0.2758 05/15/2002
Benld 0.6283 0.4120 0.3708 0.3605 0.3502 0.3296 0.3245 0.3193 0.3142 0.3090 08/01/2014
Bethalto 0.6283 0.4120 0.3708 0.3605 0.3502 0.3296 0.3245 0.3193 0.3142 0.3090 10/01/2014
Biggsville 0.4442 0.2913 0.2621 0.2549 0.2476 0.2330 0.2294 0.2258 0.2221 0.2185 08/01/1998
Bloomington 0.4572 0.2998 0.2699 0.2623 0.2548 0.2399 0.2361 0.2324 0.2287 0.2248 06/01/2014
Brooklyn 0.5571 0.3653 0.3288 0.3196 0.3105 0.2922 0.2877 0.2831 0.2785 0.2740 09/22/1998
Brownstown 0.4964 0.3255 0.2929 0.2848 0.2767 0.2604 0.2564 0.2522 0.2482 0.2441 07/01/2004
Buffalo 0.6049 0.3967 0.3570 0.3471 0.3372 0.3173 0.3124 0.3075 0.3025 0.2975 05/01/2001
Bureau 0.6283 0.4120 0.3708 0.3605 0.3502 0.3296 0.3245 0.3193 0.3142 0.3090 03/01/2011
Cahokia 0.4110 0.2699 0.2431 0.2359 0.2297 0.2153 0.2122 0.2091 0.2060 0.2019 08/01/1999
Cambridge 0.2531 0.1659 0.1494 0.1452 0.1410 0.1328 0.1307 0.1286 0.1265 0.1244 08/01/1998
Carlock 0.5377 0.3523 0.3172 0.3090 0.2997 0.2822 0.2781 0.2730 0.2688 0.2647 02/01/2007
Caseyville 0.3047 0.1997 0.1797 0.1748 0.1697 0.1598 0.1573 0.1548 0.1523 0.1499 11/12/1998
Central City 0.5584 0.3662 0.3296 0.3204 0.3113 0.2929 0.2884 0.2838 0.2792 0.2746 08/01/1998
Centralia 0.5358 0.3513 0.3162 0.3075 0.2987 0.2811 0.2767 0.2723 0.2679 0.2635 08/01/1998
Centreville 0.4336 0.2843 0.2554 0.2482 0.2421 0.2276 0.2235 0.2204 0.2163 0.2132 06/11/1998
Cerro Gordo 0.6283 0.4120 0.3708 0.3605 0.3502 0.3296 0.3245 0.3193 0.3142 0.3090 01/01/2011
Champaign 0.2930 0.2130 0.1964 0.1754 0.1564 0.1412 0.1377 0.1376 0.1375 0.1374 09/15/1998
Chapin 0.5742 0.3766 0.3389 0.3295 0.3200 0.3012 0.2965 0.2918 0.2871 0.2824 07/14/2000
Cherry 0.5763 0.3779 0.3401 0.3306 0.3212 0.3023 0.2976 0.2928 0.2881 0.2835 08/01/1998
Chester 0.6283 0.4120 0.3708 0.3605 0.3502 0.3296 0.3245 0.3193 0.3142 0.3090 09/01/2009
Cisco 0.5345 0.3505 0.3154 0.3066 0.2979 0.2804 0.2760 0.2716 0.2673 0.2629 10/26/1998
Coffeen 0.3251 0.2131 0.1918 0.1865 0.1812 0.1705 0.1679 0.1652 0.1625 0.1599 08/01/1998
Usage Block Definitions:
A first 2,000 kWh used or consumed in a month
B next 48,000 kWh used or consumed in a month
C next 50,000 kWh used or consumed in a month
D next 400,000 kWh used or consumed in a month
E next 500,000 kWh used or consumed in a month
F next 2,000,000 kWh used or consumed in a month
G next 2,000,000 kWh used or consumed in a month
H next 5,000,000 kWh used or consumed in a month
I next 10,000,000 kWh used or consumed in a month
J all over 20,000,000 kWh used or consumed in a month
Ameren Illinois Company Ill. C. C. No. 1
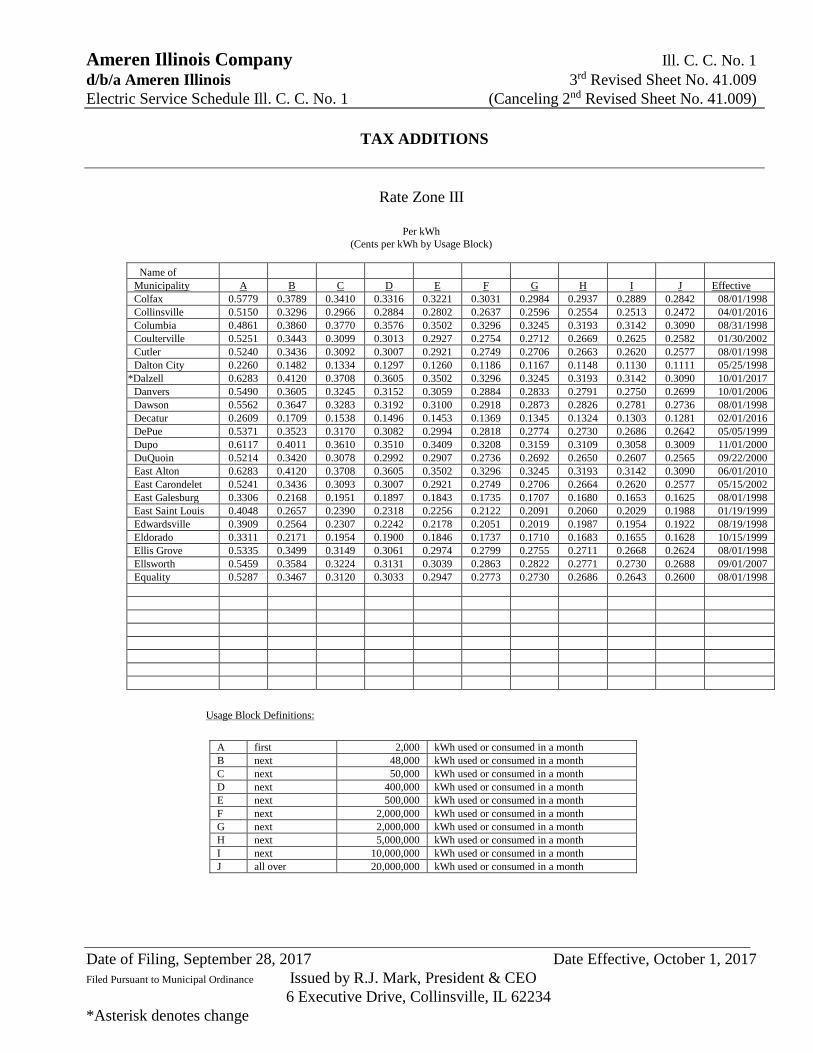
d/b/a Ameren Illinois 3rd Revised Sheet No. 41.009
Electric Service Schedule Ill. C. C. No. 1 (Canceling 2nd Revised Sheet No. 41.009)
TAX ADDITIONS
Date of Filing, September 28, 2017 Date Effective, October 1, 2017
Filed Pursuant to Municipal Ordinance Issued by R.J. Mark, President & CEO
6 Executive Drive, Collinsville, IL 62234
*Asterisk denotes change
Rate Zone III
Per kWh
(Cents per kWh by Usage Block)
Name of
Municipality A B C D E F G H I J Effective
Colfax 0.5779 0.3789 0.3410 0.3316 0.3221 0.3031 0.2984 0.2937 0.2889 0.2842 08/01/1998
Collinsville 0.5150 0.3296 0.2966 0.2884 0.2802 0.2637 0.2596 0.2554 0.2513 0.2472 04/01/2016
Columbia 0.4861 0.3860 0.3770 0.3576 0.3502 0.3296 0.3245 0.3193 0.3142 0.3090 08/31/1998
Coulterville 0.5251 0.3443 0.3099 0.3013 0.2927 0.2754 0.2712 0.2669 0.2625 0.2582 01/30/2002
Cutler 0.5240 0.3436 0.3092 0.3007 0.2921 0.2749 0.2706 0.2663 0.2620 0.2577 08/01/1998
Dalton City 0.2260 0.1482 0.1334 0.1297 0.1260 0.1186 0.1167 0.1148 0.1130 0.1111 05/25/1998
*Dalzell 0.6283 0.4120 0.3708 0.3605 0.3502 0.3296 0.3245 0.3193 0.3142 0.3090 10/01/2017
Danvers 0.5490 0.3605 0.3245 0.3152 0.3059 0.2884 0.2833 0.2791 0.2750 0.2699 10/01/2006
Dawson 0.5562 0.3647 0.3283 0.3192 0.3100 0.2918 0.2873 0.2826 0.2781 0.2736 08/01/1998
Decatur 0.2609 0.1709 0.1538 0.1496 0.1453 0.1369 0.1345 0.1324 0.1303 0.1281 02/01/2016
DePue 0.5371 0.3523 0.3170 0.3082 0.2994 0.2818 0.2774 0.2730 0.2686 0.2642 05/05/1999
Dupo 0.6117 0.4011 0.3610 0.3510 0.3409 0.3208 0.3159 0.3109 0.3058 0.3009 11/01/2000
DuQuoin 0.5214 0.3420 0.3078 0.2992 0.2907 0.2736 0.2692 0.2650 0.2607 0.2565 09/22/2000
East Alton 0.6283 0.4120 0.3708 0.3605 0.3502 0.3296 0.3245 0.3193 0.3142 0.3090 06/01/2010
East Carondelet 0.5241 0.3436 0.3093 0.3007 0.2921 0.2749 0.2706 0.2664 0.2620 0.2577 05/15/2002
East Galesburg 0.3306 0.2168 0.1951 0.1897 0.1843 0.1735 0.1707 0.1680 0.1653 0.1625 08/01/1998
East Saint Louis 0.4048 0.2657 0.2390 0.2318 0.2256 0.2122 0.2091 0.2060 0.2029 0.1988 01/19/1999
Edwardsville 0.3909 0.2564 0.2307 0.2242 0.2178 0.2051 0.2019 0.1987 0.1954 0.1922 08/19/1998
Eldorado 0.3311 0.2171 0.1954 0.1900 0.1846 0.1737 0.1710 0.1683 0.1655 0.1628 10/15/1999
Ellis Grove 0.5335 0.3499 0.3149 0.3061 0.2974 0.2799 0.2755 0.2711 0.2668 0.2624 08/01/1998
Ellsworth 0.5459 0.3584 0.3224 0.3131 0.3039 0.2863 0.2822 0.2771 0.2730 0.2688 09/01/2007
Equality 0.5287 0.3467 0.3120 0.3033 0.2947 0.2773 0.2730 0.2686 0.2643 0.2600 08/01/1998
Usage Block Definitions:
A first 2,000 kWh used or consumed in a month
B next 48,000 kWh used or consumed in a month
C next 50,000 kWh used or consumed in a month
D next 400,000 kWh used or consumed in a month
E next 500,000 kWh used or consumed in a month
F next 2,000,000 kWh used or consumed in a month
G next 2,000,000 kWh used or consumed in a month
H next 5,000,000 kWh used or consumed in a month
I next 10,000,000 kWh used or consumed in a month
J all over 20,000,000 kWh used or consumed in a month

Ameren Illinois Company Ill. C. C. No. 1
d/b/a Ameren Illinois 6th Revised Sheet No. 41.010
Electric Service Schedule Ill. C. C. No. 1 (Canceling 5th Revised Sheet No. 41.010)
TAX ADDITIONS
Date of Filing, September 29, 2016 Date Effective, October 1, 2016
Filed Pursuant to Municipal Ordinance Issued by R.J. Mark, President & CEO
6 Executive Drive, Collinsville, IL 62234
*Asterisk denotes change
Rate Zone III
Per kWh
(Cents per kWh by Usage Block)
Name of
Municipality A B C D E F G H I J Effective
Evansville 0.5418 0.3552 0.3197 0.3109 0.3020 0.2842 0.2797 0.2753 0.2709 0.2665 08/01/1998
Fayetteville 0.5305 0.3478 0.3130 0.3044 0.2956 0.2783 0.2739 0.2696 0.2652 0.2609 08/31/1998
Fithian 0.3462 0.2270 0.2044 0.1987 0.1930 0.1816 0.1788 0.1759 0.1731 0.1703 08/01/1998
Flanagan 0.3142 0.2060 0.1854 0.1803 0.1751 0.1648 0.1627 0.1597 0.1576 0.1545 11/01/2010
Galesburg 0.6283 0.4120 0.3708 0.3605 0.3502 0.3296 0.3245 0.3193 0.3142 0.3090 01/01/2016
Gillespie 0.5621 0.3685 0.3318 0.3225 0.3133 0.2949 0.2903 0.2856 0.2810 0.2765 02/10/1999
Goodfield 0.5809 0.3809 0.3428 0.3333 0.3237 0.3047 0.2999 0.2952 0.2905 0.2857 10/30/1998
Granville 0.5604 0.3675 0.3307 0.3216 0.3124 0.2940 0.2894 0.2848 0.2802 0.2756 09/01/2016
Greenville 0.6283 0.4120 0.3708 0.3605 0.3502 0.3296 0.3245 0.3193 0.3142 0.3090 07/01/2012
Gulfport 0.5617 0.3683 0.3315 0.3223 0.3131 0.2947 0.2900 0.2854 0.2809 0.2762 08/01/1998
Hamel 0.5690 0.3732 0.3358 0.3265 0.3171 0.2985 0.2939 0.2892 0.2845 0.2799 02/01/2005
Hecker 0.4954 0.3249 0.2924 0.2843 0.2761 0.2599 0.2559 0.2517 0.2477 0.2436 08/01/1998
Hillsboro 0.5191 0.3404 0.3064 0.2979 0.2893 0.2723 0.2681 0.2638 0.2596 0.2553 06/22/2001
Hudson 0.5658 0.3710 0.3339 0.3247 0.3154 0.2967 0.2921 0.2875 0.2829 0.2782 02/10/2003
Illiopolis 0.5771 0.3784 0.3406 0.3311 0.3217 0.3027 0.2980 0.2932 0.2885 0.2838 05/31/2002
Joy 0.6283 0.4120 0.3708 0.3605 0.3502 0.3296 0.3245 0.3193 0.3142 0.3090 01/01/2012
Junction City 0.6200 0.4065 0.3659 0.3558 0.3456 0.3253 0.3201 0.3151 0.3100 0.3049 03/28/2002
Keithsburg 0.5496 0.3604 0.3243 0.3154 0.3063 0.2883 0.2839 0.2793 0.2748 0.2703 08/01/1998
Kewanee 0.3518 0.2307 0.2076 0.2019 0.1961 0.1846 0.1817 0.1788 0.1759 0.1730 08/01/1998
Lake Ka-Ho 0.4058 0.2657 0.2390 0.2328 0.2256 0.2132 0.2091 0.2060 0.2029 0.1998 03/01/2006
LaSalle 0.4348 0.2851 0.2566 0.2495 0.2424 0.2280 0.2245 0.2209 0.2173 0.2138 08/01/1998
*Lebanon 0.6283 0.4120 0.3708 0.3605 0.3502 0.3296 0.3245 0.3193 0.3142 0.3090 10/01/2016
Lenzburg 0.5282 0.3464 0.3118 0.3030 0.2944 0.2771 0.2727 0.2684 0.2641 0.2598 08/12/1998
LeRoy 0.5516 0.3616 0.3255 0.3164 0.3075 0.2893 0.2848 0.2803 0.2757 0.2712 07/01/2000
Livingston 0.6283 0.4120 0.3708 0.3605 0.3502 0.3296 0.3245 0.3193 0.3142 0.3090 05/01/2016
Mackinaw 0.5651 0.3705 0.3334 0.3241 0.3150 0.2964 0.2918 0.2872 0.2825 0.2779 08/01/1999
Madison 0.5657 0.3709 0.3338 0.3246 0.3153 0.2967 0.2921 0.2875 0.2828 0.2782 12/24/1998
Magnolia 0.5604 0.3675 0.3307 0.3216 0.3124 0.2940 0.2894 0.2848 0.2802 0.2756 08/01/1998
Usage Block Definitions:
A first 2,000 kWh used or consumed in a month
B next 48,000 kWh used or consumed in a month
C next 50,000 kWh used or consumed in a month
D next 400,000 kWh used or consumed in a month
E next 500,000 kWh used or consumed in a month
F next 2,000,000 kWh used or consumed in a month
G next 2,000,000 kWh used or consumed in a month
H next 5,000,000 kWh used or consumed in a month
I next 10,000,000 kWh used or consumed in a month
J all over 20,000,000 kWh used or consumed in a month

Ameren Illinois Company Ill. C. C. No. 1
d/b/a Ameren Illinois 3rd Revised Sheet No. 41.011
Electric Service Schedule Ill. C. C. No. 1 (Canceling 2nd Revised Sheet No. 41.011)
TAX ADDITIONS
Date of Filing, December 17, 2015 Date Effective, January 1, 2016
Filed Pursuant to Municipal Ordinance Issued by R.J. Mark, President & CEO
6 Executive Drive, Collinsville, IL 62234
*Asterisk denotes change
Rate Zone III
Per kWh
(Cents per kWh by Usage Block)
Name of
Municipality A B C D E F G H I J Effective
Mahomet 0.5622 0.3686 0.3318 0.3225 0.3133 0.2949 0.2903 0.2857 0.2811 0.2765 08/01/1998
*Mansfield 0.6283 0.4120 0.3708 0.3605 0.3502 0.3296 0.3245 0.3193 0.3142 0.3090 01/01/2016
Marissa 0.5261 0.3451 0.3105 0.3019 0.2932 0.2760 0.2717 0.2674 0.2631 0.2587 08/01/1998
Maroa 0.5157 0.3381 0.3044 0.2959 0.2875 0.2706 0.2664 0.2621 0.2579 0.2536 11/01/2015
Marseilles 0.6283 0.4120 0.3708 0.3605 0.3502 0.3296 0.3245 0.3193 0.3142 0.3090 04/01/2010
Maryville 0.4573 0.2999 0.2700 0.2624 0.2549 0.2399 0.2362 0.2325 0.2287 0.2250 06/11/1999
Mascoutah 0.4759 0.3121 0.2812 0.2730 0.2657 0.2503 0.2462 0.2421 0.2379 0.2338 08/01/1999
McNabb 0.6283 0.4120 0.3708 0.3605 0.3502 0.3296 0.3245 0.3193 0.3142 0.3090 11/01/2015
Mechanicsburg 0.6283 0.4120 0.3708 0.3605 0.3502 0.3296 0.3245 0.3193 0.3142 0.3090 01/01/2010
Mt. Clare 0.5326 0.3493 0.3144 0.3056 0.2968 0.2794 0.2750 0.2707 0.2663 0.2619 12/17/1999
Mt. Olive 0.5325 0.3492 0.3143 0.3055 0.2968 0.2793 0.2750 0.2706 0.2663 0.2619 02/18/1999
Mt. Zion 0.3104 0.2440 0.2439 0.2438 0.2437 0.2436 0.2435 0.2434 0.2433 0.2432 09/04/1998
Mulberry Grove 0.2678 0.1751 0.1576 0.1535 0.1494 0.1401 0.1380 0.1360 0.1339 0.1318 09/0l/2005
Naplate 0.3499 0.2294 0.2065 0.2007 0.1950 0.1835 0.1807 0.1778 0.1749 0.1721 08/12/1998
New Athens 0.3161 0.2073 0.1865 0.1814 0.1762 0.1658 0.1633 0.1607 0.1581 0.1554 08/01/1998
Newark 0.5357 0.3512 0.3161 0.3074 0.2986 0.2810 0.2767 0.2722 0.2678 0.2635 08/25/1998
Normal 0.5432 0.3563 0.3206 0.3117 0.3028 0.2850 0.2806 0.2760 0.2716 0.2672 08/01/1998
North Henderson 0.4670 0.3063 0.2756 0.2680 0.2604 0.2449 0.2412 0.2373 0.2336 0.2297 10/26/1998
North Utica 0.5225 0.3426 0.3084 0.2998 0.2912 0.2741 0.2698 0.2655 0.2612 0.2570 08/01/1998
O’Fallon 0.5265 0.3453 0.3108 0.3021 0.2934 0.2762 0.2719 0.2676 0.2633 0.2589 04/10/2002
Old Shawneetown 0.1739 0.1140 0.1026 0.0998 0.0969 0.0913 0.0898 0.0884 0.0869 0.0855 12/08/2000
Usage Block Definitions:
A first 2,000 kWh used or consumed in a month
B next 48,000 kWh used or consumed in a month
C next 50,000 kWh used or consumed in a month
D next 400,000 kWh used or consumed in a month
E next 500,000 kWh used or consumed in a month
F next 2,000,000 kWh used or consumed in a month
G next 2,000,000 kWh used or consumed in a month
H next 5,000,000 kWh used or consumed in a month
I next 10,000,000 kWh used or consumed in a month
J all over 20,000,000 kWh used or consumed in a month

Ameren Illinois Company Ill. C. C. No. 1
d/b/a Ameren Illinois 2nd Revised Sheet No. 41.012
Electric Service Schedule Ill. C. C. No. 1 (Canceling 1st Revised Sheet No. 41.012)
TAX ADDITIONS
Date of Filing, December 17, 2015 Date Effective, January 1, 2016
Filed Pursuant to Municipal Ordinance Issued by R.J. Mark, President & CEO
6 Executive Drive, Collinsville, IL 62234
*Asterisk denotes change
Rate Zone III
Per kWh
(Cents per kWh by Usage Block)
Name of
Municipality A B C D E F G H I J Effective
Oquawka 0.3355 0.2200 0.1980 0.1925 0.1869 0.1760 0.1732 0.1705 0.1677 0.1650 08/01/1998
Ottawa 0.6056 0.3972 0.3574 0.3475 0.3375 0.3177 0.3127 0.3078 0.3028 0.2979 06/29/2000
Panama 0.2985 0.1957 0.1761 0.1713 0.1663 0.1566 0.1542 0.1517 0.1492 0.1468 07/29/2003
*Patoka 0.6283 0.4120 0.3708 0.3605 0.3502 0.3296 0.3245 0.3193 0.3142 0.3090 01/01/2016
Percy 0.5224 0.3426 0.3083 0.2997 0.2912 0.2741 0.2698 0.2655 0.2612 0.2570 06/10/2003
Pontoon Beach 0.5144 0.3481 0.3094 0.3090 0.2987 0.2884 0.2781 0.2678 0.2575 0.2472 05/12/1999
Prairie Du Rocher 0.5475 0.3591 0.3231 0.3142 0.3052 0.2873 0.2827 0.2783 0.2738 0.2692 08/12/1998
Richview 0.5376 0.3526 0.3172 0.3085 0.2996 0.2820 0.2776 0.2732 0.2688 0.2644 03/23/1999
Ridgway 0.5493 0.3602 0.3241 0.3152 0.3062 0.2882 0.2837 0.2791 0.2747 0.2702 08/01/1998
Roxana 0.3142 0.2060 0.1854 0.1803 0.1751 0.1648 0.1622 0.1597 0.1571 0.1545 05/01/2011
Ruma 0.5001 0.3278 0.2951 0.2869 0.2787 0.2623 0.2582 0.2541 0.2500 0.2459 08/12/1998
St. Jacob 0.5432 0.4039 0.3708 0.3605 0.3502 0.3296 0.3245 0.3193 0.3142 0.3090 09/28/1998
Sawyerville 0.5660 0.3712 0.3340 0.3248 0.3155 0.2969 0.2923 0.2877 0.2830 0.2784 06/10/2003
Schram City 0.5522 0.3620 0.3259 0.3168 0.3078 0.2896 0.2851 0.2806 0.2760 0.2715 03/16/1999
Seatonville 0.4522 0.2966 0.2668 0.2596 0.2524 0.2369 0.2338 0.2297 0.2256 0.2225 12/01/2006
Shawneetown 0.5338 0.3501 0.3151 0.3063 0.2976 0.2801 0.2756 0.2713 0.2669 0.2625 08/01/1998
Sheridan 0.6283 0.4120 0.3708 0.3605 0.3502 0.3296 0.3245 0.3193 0.3142 0.3090 07/01/2009
Shiloh 0.5284 0.3465 0.3118 0.3031 0.2945 0.2772 0.2728 0.2685 0.2642 0.2599 08/01/1998
Smithton 0.5344 0.3504 0.3154 0.3066 0.2979 0.2804 0.2759 0.2716 0.2672 0.2629 08/25/1998
Swansea 0.4202 0.2750 0.2482 0.2410 0.2338 0.2204 0.2173 0.2132 0.2101 0.2070 09/01/2006
Usage Block Definitions:
A first 2,000 kWh used or consumed in a month
B next 48,000 kWh used or consumed in a month
C next 50,000 kWh used or consumed in a month
D next 400,000 kWh used or consumed in a month
E next 500,000 kWh used or consumed in a month
F next 2,000,000 kWh used or consumed in a month
G next 2,000,000 kWh used or consumed in a month
H next 5,000,000 kWh used or consumed in a month
I next 10,000,000 kWh used or consumed in a month
J all over 20,000,000 kWh used or consumed in a month

Ameren Illinois Company Ill. C. C. No. 1
d/b/a Ameren Illinois 1st Revised Sheet No. 41.013
Electric Service Schedule Ill. C. C. No. 1 (Canceling Original Sheet No. 41.013)
TAX ADDITIONS
Date of Filing, March 29, 2011 Date Effective, April 1, 2011
Filed Pursuant to Issued by S.A. Cisel, President
Municipal Ordinance 300 Liberty Street, Peoria, IL 61602
*Asterisk denotes change
Rate Zone III
Per kWh
(Cents per kWh by Usage Block)
Name of
Municipality A B C D E F G H I J Effective
* South Roxana 0.6283 0.4120 0.3708 0.3605 0.3502 0.3296 0.3245 0.3193 0.3142 0.3090 04/01/2011
Spring Valley 0.5707 0.3742 0.3368 0.3274 0.3181 0.2994 0.2947 0.2900 0.2853 0.2807 12/30/2003
Standard City 0.1891 0.1240 0.1117 0.1085 0.1054 0.0992 0.0976 0.0961 0.0946 0.0930 04/07/2003
Stanford 0.5550 0.3639 0.3275 0.3184 0.3093 0.2911 0.2865 0.2820 0.2775 0.2730 08/01/1999
Staunton 0.5723 0.3752 0.3377 0.3284 0.3190 0.3002 0.2955 0.2909 0.2861 0.2814 10/09/2003
Steeleville 0.6283 0.4120 0.3708 0.3605 0.3502 0.3296 0.3245 0.3193 0.3142 0.3090 06/01/2009
Summerfield 0.5646 0.3703 0.3332 0.3239 0.3147 0.2962 0.2916 0.2870 0.2823 0.2777 11/12/2003
Tilden 0.5416 0.3551 0.3196 0.3108 0.3019 0.2841 0.2796 0.2752 0.2708 0.2664 08/01/1998
Tilton 0.5653 0.3707 0.3336 0.3243 0.3151 0.2965 0.2919 0.2873 0.2826 0.2780 11/01/2000
Towanda 0.5916 0.3880 0.3492 0.3395 0.3298 0.3103 0.3055 0.3007 0.2958 0.2910 08/12/1998
Trenton 0.2241 0.1806 0.1452 0.1451 0.1450 0.1449 0.1448 0.1447 0.1446 0.1445 09/15/1998
Troy 0.3192 0.2253 0.1939 0.1850 0.1648 0.1545 0.1442 0.1339 0.1236 0.1133 02/22/1999
Urbana 0.5380 0.3834 0.3446 0.3074 0.2774 0.2763 0.2615 0.2516 0.2512 0.2511 08/31/1998
Valmeyer 0.5354 0.4395 0.3974 0.3947 0.3502 0.3296 0.3245 0.3193 0.3142 0.3090 09/15/1998
Venice 0.5344 0.3734 0.3358 0.3254 0.3253 0.3252 0.3245 0.3193 0.3142 0.3090 02/10/1999
Wamac 0.5498 0.3605 0.3245 0.3156 0.3065 0.2884 0.2839 0.2795 0.2750 0.2705 01/01/2008
Wapella 0.5700 0.3738 0.3364 0.3270 0.3177 0.2990 0.2954 0.2896 0.2850 0.2803 06/11/1999
Willisville 0.5187 0.3401 0.3061 0.2977 0.2891 0.2721 0.2679 0.2636 0.2594 0.2551 08/01/1998
Witt 0.5678 0.3723 0.3352 0.3258 0.3165 0.2979 0.2932 0.2886 0.2840 0.2792 02/06/2004
Wood River 0.3516 0.2305 0.2075 0.2018 0.1960 0.1845 0.1816 0.1787 0.1758 0.1729 08/22/2000
Worden 0.5463 0.3717 0.3708 0.3605 0.3502 0.3296 0.3245 0.3193 0.3142 0.3090 06/18/2002
Usage Block Definitions:
A first 2,000 kWh used or consumed in a month
B next 48,000 kWh used or consumed in a month
C next 50,000 kWh used or consumed in a month
D next 400,000 kWh used or consumed in a month
E next 500,000 kWh used or consumed in a month
F next 2,000,000 kWh used or consumed in a month
G next 2,000,000 kWh used or consumed in a month
H next 5,000,000 kWh used or consumed in a month
I next 10,000,000 kWh used or consumed in a month
J all over 20,000,000 kWh used or consumed in a month