Aluminium market update Industry Update -...
21
Deutsche Bank Research Global Metals & Mining Industry Aluminium market update Date 15 June 2016 Industry Update Start 'em up! Downside risks aplenty ________________________________________________________________________________________________________________ Deutsche Bank AG/London Deutsche Bank does and seeks to do business with companies covered in its research reports. Thus, investors should be aware that the firm may have a conflict of interest that could affect the objectivity of this report. Investors should consider this report as only a single factor in making their investment decision. DISCLOSURES AND ANALYST CERTIFICATIONS ARE LOCATED IN APPENDIX 1. MCI (P) 057/04/2016. Grant Sporre Research Analyst (+44) 20 754-58170 [email protected] Sharon Ding Research Analyst (-) - - [email protected] Top picks Alcoa (AA.N),USD9.10 Buy Hindalco (HALC.BO),INR115.75 Buy Rio Tinto (RIO.L),GBP1,895.50 Buy China Hongqiao Group Ltd. (1378.HK),HKD5.06 Buy Source: Deutsche Bank Companies Featured Norsk Hydro (NHY.OL),NOK31.15 Hold Alcoa (AA.N),USD9.10 Buy Alumina (AWC.AX),AUD1.36 Hold Chalco (2600.HK),HKD2.36 Hold Hindalco (HALC.BO),INR115.75 Buy United Company RUSAL (0486.HK),HKD2.30 Hold China Hongqiao Group Ltd. (1378.HK),HKD5.06 Buy Rio Tinto (RIO.L),GBP1,895.50 Buy Source: Deutsche Bank China is likely to remain a net exporter of aluminium to the rest of the world. In part this is justified by the technological and efficiency gains the country has made over the past ten years. However, power is now abundant after years of capacity expansion to the extent that energy is now being exported in the form of aluminium. This is not permanent but whilst local governments continue to provide subsidized power, Chinese latent capacity will continue to keep a lid on prices. In our assessment this will keep the market modestly oversupplied in the medium term. A weakening RMB simply makes the Chinese industry even more competitive, and is a key downside risk to LME prices. Ahead of the pack on demand growth The demand outlook remains decent for aluminium. Yes, demand growth is likely to slow from current levels, as China transitions away from the FAI heavy growth model. Demand growth from 2000 to 2015 was 5.3% CAGR, with growth likely to slow to 3.2% CAGR over the next 10 years. Although growth is slower, this is better than the 2.8% CAGR from 1985 to 2000, and certainly beats demand growth in the other metals. The regions contributing to strong demand are India, China and the US. In China, UHV and rural electrification projects, combined with strong Auto output is the main driver over a two year period. However, a temporary resurgence in the building and construction sector should push 2016 demand growth above that of 2015. In the US, it is the increasing aluminium penetration in Autos and a revival in the housing market which is positive, and in India spending on the grid is the main driver. Supply side reform in China is going to take time As we have learnt from both the Chinese steel and aluminium industry, when there are profits to be made, reform is quickly pushed aside. After the domestic price recovery, most of the Chinese aluminium industry is now profitable. We estimate that at least quarter of the capacity that was shut during late 2015 (1 – 1.2Mtpa) is likely to be restarted by the end of 2016. That’s not including new, low cost and efficient capacity which will continue being added over the course of 2016 (another 3 – 3.2Mtpa). We forecast the flexible latent capacity in China to keep the market in a surplus, capping the upside on the Chinese domestic price, and ultimately the LME price through increasing semi’s exports. A deflationary bias and a weakening RMB point to downside risks The willingness of local governments to subsidize power for domestic smelters, combined with a trough in coal and alumina pricing means that the aluminium market remains in the throes of deflation. We expect these deflation pressures to ease, but given the continual efficiency gains there is always going to be a deflationary bias to the metal. The tipping point for restarts seems to be around RMB11,500/t which equates to an LME price of c.1,575/t at the current RMB exchange rate. However an RMB closer to 7, could drag the equivalent price down below USD1,500/t.
Transcript of Aluminium market update Industry Update -...

Deutsche Bank Research
Global
Metals & Mining
Industry
Aluminium market update
Date
15 June 2016
Industry Update
Start 'em up!
Downside risks aplenty
________________________________________________________________________________________________________________
Deutsche Bank AG/London
Deutsche Bank does and seeks to do business with companies covered in its research reports. Thus, investors should be aware that the firm may have a conflict of interest that could affect the objectivity of this report. Investors should consider this report as only a single factor in making their investment decision. DISCLOSURES AND ANALYST CERTIFICATIONS ARE LOCATED IN APPENDIX 1. MCI (P) 057/04/2016.
Grant Sporre
Research Analyst
(+44) 20 754-58170
Sharon Ding
Research Analyst
(-) - -
Top picks
Alcoa (AA.N),USD9.10 Buy
Hindalco (HALC.BO),INR115.75 Buy
Rio Tinto (RIO.L),GBP1,895.50 Buy
China Hongqiao Group Ltd. (1378.HK),HKD5.06
Buy
Source: Deutsche Bank
Companies Featured
Norsk Hydro (NHY.OL),NOK31.15 Hold
Alcoa (AA.N),USD9.10 Buy
Alumina (AWC.AX),AUD1.36 Hold
Chalco (2600.HK),HKD2.36 Hold
Hindalco (HALC.BO),INR115.75 Buy
United Company RUSAL (0486.HK),HKD2.30
Hold
China Hongqiao Group Ltd. (1378.HK),HKD5.06
Buy
Rio Tinto (RIO.L),GBP1,895.50 Buy
Source: Deutsche Bank
China is likely to remain a net exporter of aluminium to the rest of the world. In part this is justified by the technological and efficiency gains the country has made over the past ten years. However, power is now abundant after years of capacity expansion to the extent that energy is now being exported in the form of aluminium. This is not permanent but whilst local governments continue to provide subsidized power, Chinese latent capacity will continue to keep a lid on prices. In our assessment this will keep the market modestly oversupplied in the medium term. A weakening RMB simply makes the Chinese industry even more competitive, and is a key downside risk to LME prices.
Ahead of the pack on demand growth The demand outlook remains decent for aluminium. Yes, demand growth is likely to slow from current levels, as China transitions away from the FAI heavy growth model. Demand growth from 2000 to 2015 was 5.3% CAGR, with growth likely to slow to 3.2% CAGR over the next 10 years. Although growth is slower, this is better than the 2.8% CAGR from 1985 to 2000, and certainly beats demand growth in the other metals. The regions contributing to strong demand are India, China and the US. In China, UHV and rural electrification projects, combined with strong Auto output is the main driver over a two year period. However, a temporary resurgence in the building and construction sector should push 2016 demand growth above that of 2015. In the US, it is the increasing aluminium penetration in Autos and a revival in the housing market which is positive, and in India spending on the grid is the main driver.
Supply side reform in China is going to take time As we have learnt from both the Chinese steel and aluminium industry, when there are profits to be made, reform is quickly pushed aside. After the domestic price recovery, most of the Chinese aluminium industry is now profitable. We estimate that at least quarter of the capacity that was shut during late 2015 (1 – 1.2Mtpa) is likely to be restarted by the end of 2016. That’s not including new, low cost and efficient capacity which will continue being added over the course of 2016 (another 3 – 3.2Mtpa). We forecast the flexible latent capacity in China to keep the market in a surplus, capping the upside on the Chinese domestic price, and ultimately the LME price through increasing semi’s exports.
A deflationary bias and a weakening RMB point to downside risks The willingness of local governments to subsidize power for domestic smelters, combined with a trough in coal and alumina pricing means that the aluminium market remains in the throes of deflation. We expect these deflation pressures to ease, but given the continual efficiency gains there is always going to be a deflationary bias to the metal. The tipping point for restarts seems to be around RMB11,500/t which equates to an LME price of c.1,575/t at the current RMB exchange rate. However an RMB closer to 7, could drag the equivalent price down below USD1,500/t.
15 June 2016
Metals & Mining
Aluminium market update
Page 2 Deutsche Bank AG/London
Overcapacity is tough to shift
“Supply side” reforms will likely take time.
Chinese “supply side” reforms have not been successful in the aluminium
sector so far. We estimate that at least quarter of the capacity that was shut
during late 2015 is likely to be restarted by the end of 2016. That’s not
including new, low cost and efficient capacity which will continue being added
over the course of 2016. Although we expect Chinese smelting capacity
additions to slow over the course of the next few years, partly driven by new
“supply side” reform initiatives and partly by simple economics. In our view,
the path to a balanced market in aluminium will be slow and remain a
headwind for the metal. We continue to forecast a rebalancing of the global
aluminium market, which means declining Chinese surpluses and declining
ROW deficits. As has happened in a number of other regions, stranded power
never stays stranded indefinitely, and given that most of the aluminium in
China is produced using thermal coal fired power stations, we expect a more
“carbon emission” costs to creep into the aluminium cost base. Furthermore,
there is likely to be some push back from the rest of the world at being
crowded out by China.
Figure 1: Global aluminum market – normalizing by the end of the decade
-3.0
-2.0
-1.0
0.0
1.0
2.0
3.0
China balance ROW balance Global balance
Tonnes (
mill
ion)
Declining Chinese surpluses
Declining ROW deficits
Source: Deutsche Bank, Wood Mackenzie
In the near to medium term, the willingness to restart shuttered capacity as the
domestic Chinese price recovered above RMB11,500/t, combined with the
willingness of local governments to offer power discounts to marginal
producers means that both domestic prices and LME prices will be capped to
the upside. Although the two major cost inputs, alumina and coal prices have
recovered from the lows, we do not expect these to become major inflationary
driving forces. More likely, continuous efficiency improvements will see a
deflationary bias in the sector. The caveat here of course is if the Chinese
government starts to apply greenhouse emission taxes onto coal fired power

15 June 2016
Metals & Mining
Aluminium market update
Deutsche Bank AG/London Page 3
generation. Overshadowing the debate on whether aluminium will start to
experience inflation on a consistent basis, is the likely weakening of the
Chinese currency, which will make Chinese exports far more competitive. By
way of example, if we assume a marginal cost in China of RMB11,500/t, and
an average 10% LME to SHFE discount, there is some downside risk to the
implied LME equivalent price should the RMB continue to weaken.
Figure 2: Downside risks should the RMB weaken
Implied USD price at various RMB exchange rates
Marginal cost range (RMB/t)
10% discount (RMB/t)
6.5 6.7 6.9 7.1 7.3
11000 9900 1,523 1,478 1,435 1,394 1,356
11500 10350 1,592 1,545 1,500 1,458 1,418
12000 10800 1,662 1,612 1,565 1,521 1,479
Source: Deutsche Bank
Demand is not the problem
A bump in 2016 demand before a modest slowdown
The demand outlook remains decent for aluminium. Yes, demand growth is
likely to slow from current levels, as China transitions away from the FAI heavy
growth model. However, the credit boost in H1 and the push on infrastructure
should see 2016E demand improve by 80bps over 2015E. The CAGR for 2000
to 2015 was 5.3%, with the CAGR from 2015 to 2025E likely to be closer to
3.2%. Still this is better than the 2.8% CAGR from 1985 to 2000.
Figure 3: Global aluminium growth to slow, but still remain robust
0.0%
2.0%
4.0%
6.0%
8.0%
10.0%
12.0%
14.0%
16.0%
18.0%
20.0%
China demand growth % Global demand growth %
Source: Deutsche Bank, Wood Mackenzie
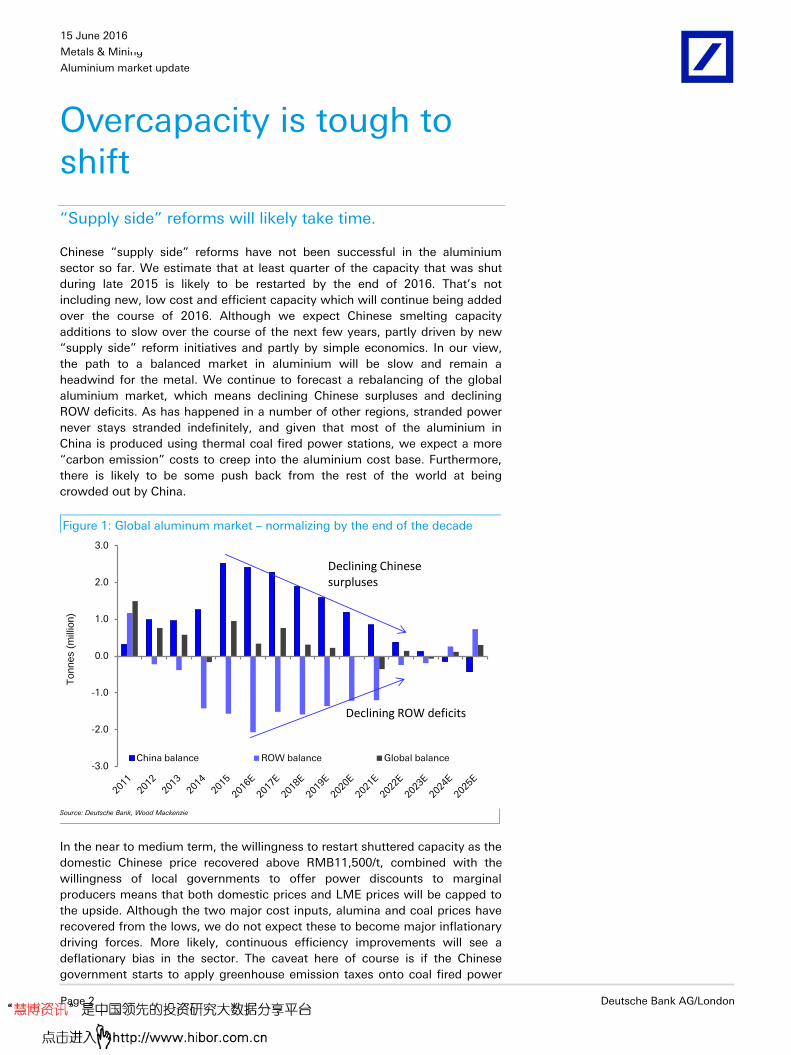
The 80bps improvement in Chinese demand growth is likely to be driven by
improvements in the Building and Construction, Electrical (Grid) and Transport
sectors.
We forecast a demand
growth CAGR of 3.2%for the
next ten years
15 June 2016
Metals & Mining
Aluminium market update
Page 4 Deutsche Bank AG/London
Figure 4: Chinese aluminium demand by sector (2016E) Figure 5: Chinese demand growth by sector
Building & Construction
27%
Transport21%
Electrical12%
Packaging9%
Consumer Goods17%
Machinery & Equipment
9%
Other5%
-4.0%
-2.0%
0.0%
2.0%
4.0%
6.0%
8.0%
10.0%
12.0%
Building & Construction
Transport Electrical Packaging Consumer Goods
Machinery & Equipment
Other
2015 2016E 2017E 2017E
Source: Deutsche Bank
Source: Deutsche Bank, Wood Mackenzie, SMM
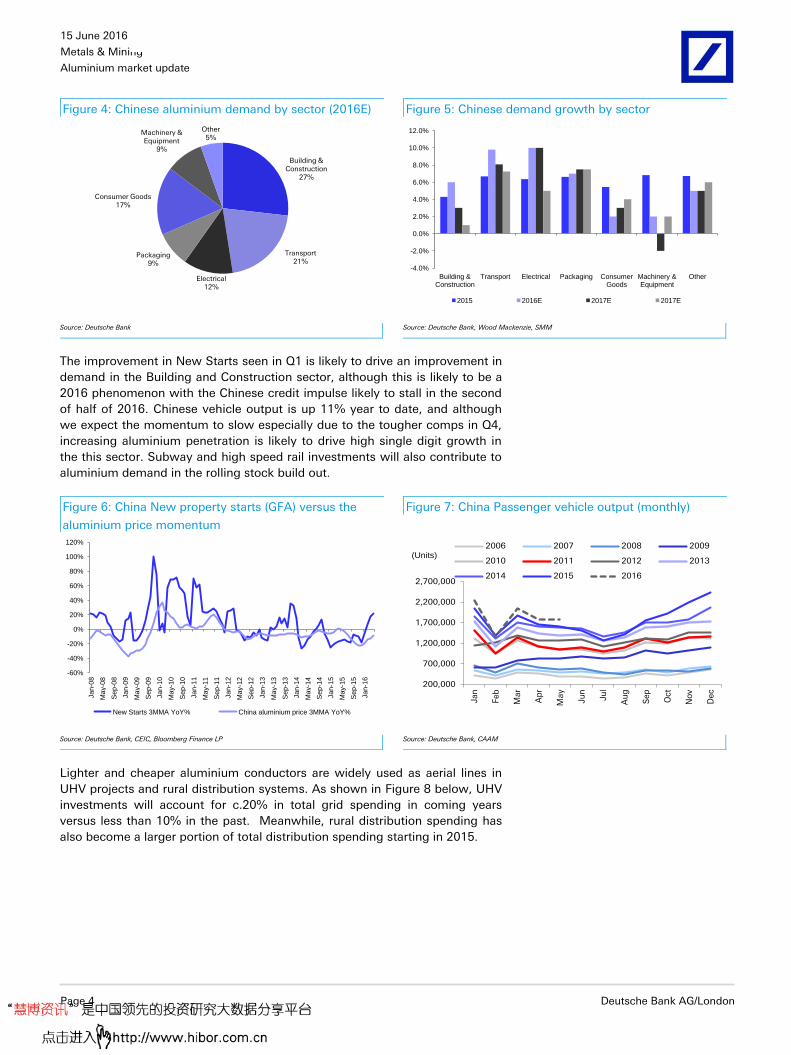
The improvement in New Starts seen in Q1 is likely to drive an improvement in
demand in the Building and Construction sector, although this is likely to be a
2016 phenomenon with the Chinese credit impulse likely to stall in the second
of half of 2016. Chinese vehicle output is up 11% year to date, and although
we expect the momentum to slow especially due to the tougher comps in Q4,
increasing aluminium penetration is likely to drive high single digit growth in
the this sector. Subway and high speed rail investments will also contribute to
aluminium demand in the rolling stock build out.
Figure 6: China New property starts (GFA) versus the
aluminium price momentum
Figure 7: China Passenger vehicle output (monthly)
-60%
-40%
-20%
0%
20%
40%
60%
80%
100%
120%
Jan
-08
May-0
8
Sep
-08
Jan
-09
May-0
9
Sep
-09
Jan
-10
May-1
0
Sep
-10
Jan
-11
May-1
1
Sep
-11
Jan
-12
May-1
2
Sep
-12
Jan
-13
May-1
3
Sep
-13
Jan
-14
May-1
4
Sep
-14
Jan
-15
May-1
5
Sep
-15
Jan
-16
New Starts 3MMA YoY% China aluminium price 3MMA YoY%
200,000
700,000
1,200,000
1,700,000
2,200,000
2,700,000
Jan
Feb
Mar
Ap
r
May
Jun
Jul
Au
g
Sep
Oct
Nov
Dec
2006 2007 2008 2009
2010 2011 2012 2013
2014 2015 2016
(Units)
Source: Deutsche Bank, CEIC, Bloomberg Finance LP
Source: Deutsche Bank, CAAM
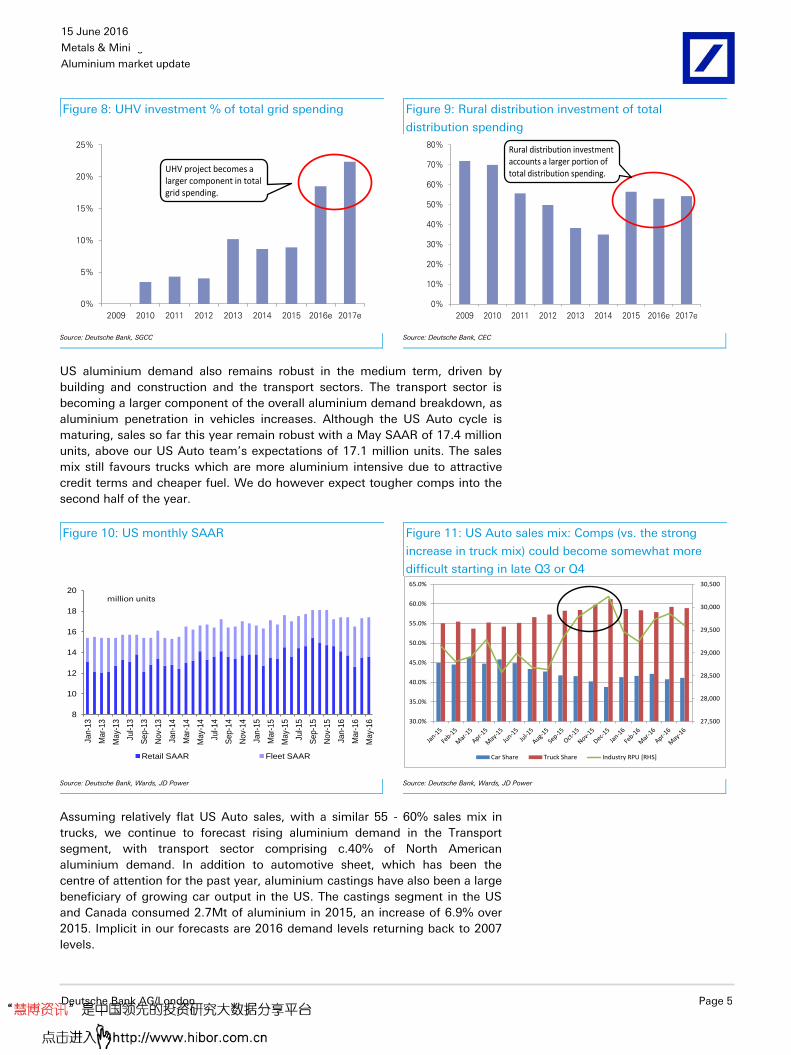
Lighter and cheaper aluminium conductors are widely used as aerial lines in
UHV projects and rural distribution systems. As shown in Figure 8 below, UHV
investments will account for c.20% in total grid spending in coming years
versus less than 10% in the past. Meanwhile, rural distribution spending has
also become a larger portion of total distribution spending starting in 2015.
15 June 2016
Metals & Mining
Aluminium market update
Deutsche Bank AG/London Page 5
Figure 8: UHV investment % of total grid spending Figure 9: Rural distribution investment of total
distribution spending
0%
5%
10%
15%
20%
25%
2009 2010 2011 2012 2013 2014 2015 2016e 2017e
UHV project becomes a larger component in total grid spending.
0%
10%
20%
30%
40%
50%
60%
70%
80%
2009 2010 2011 2012 2013 2014 2015 2016e 2017e
Rural distribution investment accounts a larger portion of total distribution spending.
Source: Deutsche Bank, SGCC
Source: Deutsche Bank, CEC
US aluminium demand also remains robust in the medium term, driven by
building and construction and the transport sectors. The transport sector is
becoming a larger component of the overall aluminium demand breakdown, as
aluminium penetration in vehicles increases. Although the US Auto cycle is
maturing, sales so far this year remain robust with a May SAAR of 17.4 million
units, above our US Auto team’s expectations of 17.1 million units. The sales
mix still favours trucks which are more aluminium intensive due to attractive
credit terms and cheaper fuel. We do however expect tougher comps into the
second half of the year.
Figure 10: US monthly SAAR Figure 11: US Auto sales mix: Comps (vs. the strong
increase in truck mix) could become somewhat more
difficult starting in late Q3 or Q4
8
10
12
14
16
18
20
Jan-1
3
Mar-
13
May-
13
Jul-13
Sep-1
3
Nov-
13
Jan-1
4
Mar-
14
May-
14
Jul-14
Sep-1
4
Nov-
14
Jan-1
5
Mar-
15
May-
15
Jul-15
Sep-1
5
Nov-
15
Jan-1
6
Mar-
16
May-
16
Retail SAAR Fleet SAAR
million units
27,500
28,000
28,500
29,000
29,500
30,000
30,500
30.0%
35.0%
40.0%
45.0%
50.0%
55.0%
60.0%
65.0%
Car Share Truck Share Industry RPU [RHS]
Source: Deutsche Bank, Wards, JD Power
Source: Deutsche Bank, Wards, JD Power
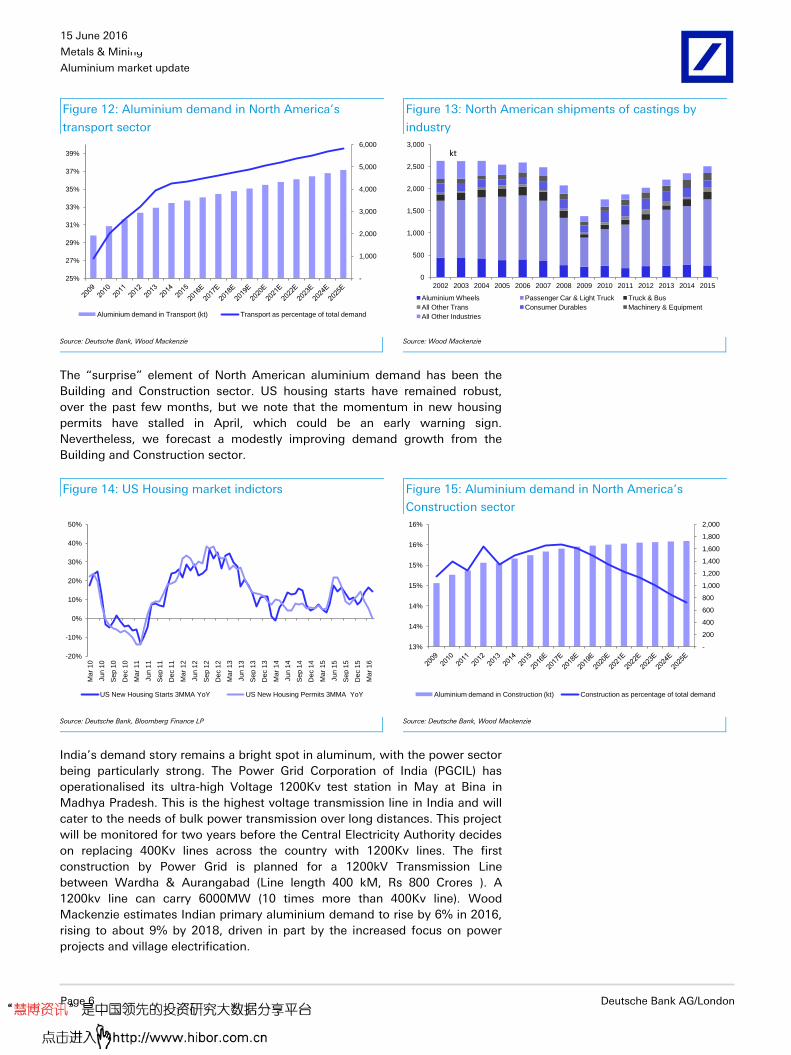
Assuming relatively flat US Auto sales, with a similar 55 - 60% sales mix in
trucks, we continue to forecast rising aluminium demand in the Transport
segment, with transport sector comprising c.40% of North American
aluminium demand. In addition to automotive sheet, which has been the
centre of attention for the past year, aluminium castings have also been a large
beneficiary of growing car output in the US. The castings segment in the US
and Canada consumed 2.7Mt of aluminium in 2015, an increase of 6.9% over
2015. Implicit in our forecasts are 2016 demand levels returning back to 2007
levels.
15 June 2016
Metals & Mining
Aluminium market update
Page 6 Deutsche Bank AG/London
Figure 12: Aluminium demand in North America’s
transport sector
Figure 13: North American shipments of castings by
industry
-
1,000
2,000
3,000
4,000
5,000
6,000
25%
27%
29%
31%
33%
35%
37%
39%
Aluminium demand in Transport (kt) Transport as percentage of total demand
0
500
1,000
1,500
2,000
2,500
3,000
2002 2003 2004 2005 2006 2007 2008 2009 2010 2011 2012 2013 2014 2015
Aluminium Wheels Passenger Car & Light Truck Truck & Bus
All Other Trans Consumer Durables Machinery & Equipment
All Other Industries
kt
Source: Deutsche Bank, Wood Mackenzie
Source: Wood Mackenzie
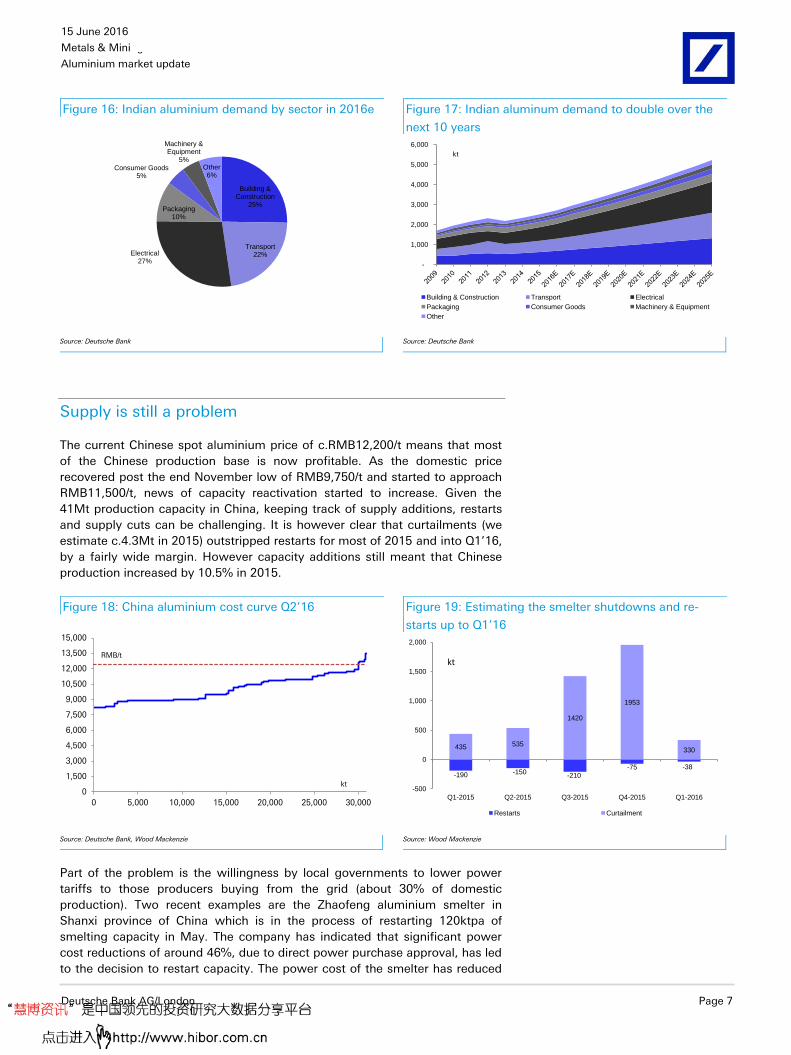
The “surprise” element of North American aluminium demand has been the
Building and Construction sector. US housing starts have remained robust,
over the past few months, but we note that the momentum in new housing
permits have stalled in April, which could be an early warning sign.
Nevertheless, we forecast a modestly improving demand growth from the
Building and Construction sector.
Figure 14: US Housing market indictors Figure 15: Aluminium demand in North America’s
Construction sector
-20%
-10%
0%
10%
20%
30%
40%
50%
Ma
r 1
0
Jun 1
0
Sep 1
0
Dec 1
0
Ma
r 1
1
Jun 1
1
Sep 1
1
Dec 1
1
Ma
r 1
2
Jun 1
2
Sep 1
2
Dec 1
2
Ma
r 1
3
Jun 1
3
Sep 1
3
Dec 1
3
Ma
r 1
4
Jun 1
4
Sep 1
4
Dec 1
4
Ma
r 1
5
Jun 1
5
Sep 1
5
Dec 1
5
Ma
r 1
6
US New Housing Starts 3MMA YoY US New Housing Permits 3MMA YoY
-
200
400
600
800
1,000
1,200
1,400
1,600
1,800
2,000
13%
14%
14%
15%
15%
16%
16%
Aluminium demand in Construction (kt) Construction as percentage of total demand
Source: Deutsche Bank, Bloomberg Finance LP
Source: Deutsche Bank, Wood Mackenzie
India’s demand story remains a bright spot in aluminum, with the power sector
being particularly strong. The Power Grid Corporation of India (PGCIL) has
operationalised its ultra-high Voltage 1200Kv test station in May at Bina in
Madhya Pradesh. This is the highest voltage transmission line in India and will
cater to the needs of bulk power transmission over long distances. This project
will be monitored for two years before the Central Electricity Authority decides
on replacing 400Kv lines across the country with 1200Kv lines. The first
construction by Power Grid is planned for a 1200kV Transmission Line
between Wardha & Aurangabad (Line length 400 kM, Rs 800 Crores ). A
1200kv line can carry 6000MW (10 times more than 400Kv line). Wood
Mackenzie estimates Indian primary aluminium demand to rise by 6% in 2016,
rising to about 9% by 2018, driven in part by the increased focus on power
projects and village electrification.
15 June 2016
Metals & Mining
Aluminium market update
Deutsche Bank AG/London Page 7
Figure 16: Indian aluminium demand by sector in 2016e Figure 17: Indian aluminum demand to double over the
next 10 years
Building & Construction
25%
Transport22%Electrical
27%
Packaging10%
Consumer Goods5%
Machinery & Equipment
5%Other6%
-
1,000
2,000
3,000
4,000
5,000
6,000
Building & Construction Transport Electrical
Packaging Consumer Goods Machinery & Equipment
Other
kt
Source: Deutsche Bank
Source: Deutsche Bank
Supply is still a problem
The current Chinese spot aluminium price of c.RMB12,200/t means that most
of the Chinese production base is now profitable. As the domestic price
recovered post the end November low of RMB9,750/t and started to approach
RMB11,500/t, news of capacity reactivation started to increase. Given the
41Mt production capacity in China, keeping track of supply additions, restarts
and supply cuts can be challenging. It is however clear that curtailments (we
estimate c.4.3Mt in 2015) outstripped restarts for most of 2015 and into Q1’16,
by a fairly wide margin. However capacity additions still meant that Chinese
production increased by 10.5% in 2015.
Figure 18: China aluminium cost curve Q2’16 Figure 19: Estimating the smelter shutdowns and re-
starts up to Q1’16
0
1,500
3,000
4,500
6,000
7,500
9,000
10,500
12,000
13,500
15,000
0 5,000 10,000 15,000 20,000 25,000 30,000
RMB/t
kt
-190 -150-210
-75 -38
435 535
1420
1953
330
-500
0
500
1,000
1,500
2,000
Q1-2015 Q2-2015 Q3-2015 Q4-2015 Q1-2016
Restarts Curtailment
kt
Source: Deutsche Bank, Wood Mackenzie
Source: Wood Mackenzie
Part of the problem is the willingness by local governments to lower power
tariffs to those producers buying from the grid (about 30% of domestic
production). Two recent examples are the Zhaofeng aluminium smelter in
Shanxi province of China which is in the process of restarting 120ktpa of
smelting capacity in May. The company has indicated that significant power
cost reductions of around 46%, due to direct power purchase approval, has led
to the decision to restart capacity. The power cost of the smelter has reduced

15 June 2016
Metals & Mining
Aluminium market update
Page 8 Deutsche Bank AG/London
from CNY0.53/kWh (US8.2¢/kWh) in 2015, down to CNY0.3/kWh
(US4.6¢/kWh). The smelter has brought 40 of 156 reduction cells online and
expects to see the 120ktpa potline fully operational by August. The
government of Yunnan province in China has announced that it is providing
assistance to Yunnan Aluminum Holdings for it to lower its total smelting
power costs from the previous CNY0.35/kWh (US5.4c/kWh). This is under
review until May 2017, with components being a direct hydropower supplier
purchase agreement (at CNY0.185/kWh, US0.3c/kWh), a tariff fee
(CNY0.045/kWh, US0.1c/kWh) and support from a government fund
(CNY0.0485/kWh, US0.1c/kWh) to bring the cost of power to below
CNY0.2785/kWh (US4.3c/kWh). The government may continue to assist
Yunnan Aluminum Holdings until a further CNY0.019/kWh reduction in its
power cost has been achieved.
As illustrated in the summary table below, we have noted Qingtongxia
Aluminium, Dongxin Aluminium and Huanghe Xinye resumed their idled
capacity in late March and smelters such as Taiyuan Donglv, Shanxi Zhaofeng
Aluminium and Liancheng Aluminium are in the process of restarting.
Figure 20: Curtailments and restarts summary
Region Company (in English) Company (in Chinese) Capacity shut down (kt)
Restart (kt) Restarts time
Chongqing Chongqing Tiantai Aluminium 重 天泰 100
Chongqing Chongqing Tengtai Aluminium 重 滕泰 30
Chongqing Qineng Electricity and Aluminium Co., Ltd 旗能 股份有限公司 40
Fujian Fujian Nanping Aluminium 福建南平 40
Gansu Liancheng Plant of Chalco 中国 城分公司 182 100 2H16
Gansu Gansu Hualu Aluminium 甘 235
Gansu Jiayuguan Branch of Dongxing Aluminium 嘉峪关 200 200 Mar-16
Guangxi Guangxi Xiangji Non-ferrous Metal 广西翔吉有色金属有限公司 40
Guizhou Jinlan Weiming Aluminium 金 明 有限公司 75
Guizhou Liupanshui-Shuangyuan Aluminium 六 水-双元 40
Guizhou Yulong Aluminium 玉隆 10
Guizhou Jinlan Weiming Aluminium 金 明 有限公司 10
Henan Henan Xichuan Aluminium Group 河南淅川 集 有限公司 140
Henan Shangqiu Plant of Henan Shenhuo 河南神火商丘 厂 60
Henan Zhengzhou Faxiang Aluminium 州 祥 公司 27
Henan Sanmenxia Hengkang Aluminium 三 峡恒康 240
Hubei Changjiang Aluminium 宜昌 江 有限公司 35
Hunan Chuangyuan Aluminium 湖南 元 150
Inner Mongolia Tongshun Aluminium 通 50
Inner Mongolia Baotou Aluminium 方希望包 稀土 60
Liaoning Fushun Aluminium 297
Ningxia Qingtongxia Aluminium 青 峡 集 270 270 Mar-16
Qinghai Hualong Xianqi Aluminium 化隆先奇 65
Qinghai Yellow River Hydro Renewable Aluminium 青海黄河水 再生 250
Qinghai Yellow River Xinheng Aluminium 青海鑫恒 40
Qinghai Xinye Subsidiary of Yellow River Hydropower 黄河上游水 鑫 分公司 110 50 Mar-16
Qinghai Baihe Aluminium 百河 20
Qinghai Qinghai Jinyuan Aluminium 青海金源 100
Shaanxi Longxi Branch of Dongxing Aluminium 西 150
Shandong Ke'Ao Aluminium 山 省 集 科澳 20
Shandong Zouping Qixing Aluminium 山 平 星 60
Shandong Shandong Weiqiao 山 魏 250
Shanxi Taiyuan East Aluminium 太原 50 100 May/Aug 16

15 June 2016
Metals & Mining
Aluminium market update
Deutsche Bank AG/London Page 9
Shanxi Shanxi Zhaofeng Aluminium 山西兆丰 冶有限公司 30 120 Jul-16
Sichuan Sichuan Qimingxing Aluminium 四川眉山启明星 50
Sichuan Sichuan Qiya Aluminium 四川其 170
Sichuan Aba Plant, Bosai Group 博 集 阿 厂 67
Sichuan Sichuan Qimingxing Aluminium 四川启明星 股份有限公司 60
Xinjiang Xinjiang Zhonghe 新疆众和股份 95
Yunnan Qujing Aluminium 云南 源煤 集 曲靖 公司 150
Yunnan Yunnan Aluminium 云南 200
Yunnan Qujing Aluminium 云南 源煤 集 曲靖 公司 55
Total in 2015 4,323 840 Source: Deutsche Bank, SMM, Antaike, China Non-ferrous Association, SMM, Myyouse
We estimate that restarts could amount to 1.45Mt by the end of 2016.
In summary we estimate that so far this year, a further 170kt of capacity has
been shut down, new capacity in started up so far amounts to 1.22Mt, with a
further 1,92Mt still to come. So restarts have amounted to c.400kt with a
further 1Mt of restarts expected.
Figure 21: Tracking Chinese aluminium restarts and additions
2016 YTD Total Primary Aluminum Capacity Summary (kt)
Capacity shutdown 173
New capacity in operation 1,220
New capacity yet to start operation 1,920
Restarts 405
Restarts to be expected 1,037
Capacity expansion delays 1,100
Source: Deutsche Bank, SMM, alu.cn, SCI Group
We expect the capacity addition rate (+4Mtpa in 2016) to slow to roughly
2.8Mt in 2017.
Figure 22: New capacity addition in 2017
Company (Chinese) Company Region New capacity (kt) Time Comment
中国宏 China Hongqiao Shandong 200 2017
新疆 方希望 East Hope Xinjiang 300 2017
内蒙包 Baotou Aluminium Inner Mongolia 500 2017
内蒙古 源 Chuangyuan Inner Mongolia 800 2017
内蒙古霍煤 Huimei Hongjun Inner Mongolia 430 2017
阜康天 Tianlong Aluminium Xinjiang 100 2017
山西中 Chalco-HuaRun Shanxi 500 2017
Total in 2017 2,830 Source: Deutsche Bank, Shanghai Metal Markets, Nanchu, Asian Metal
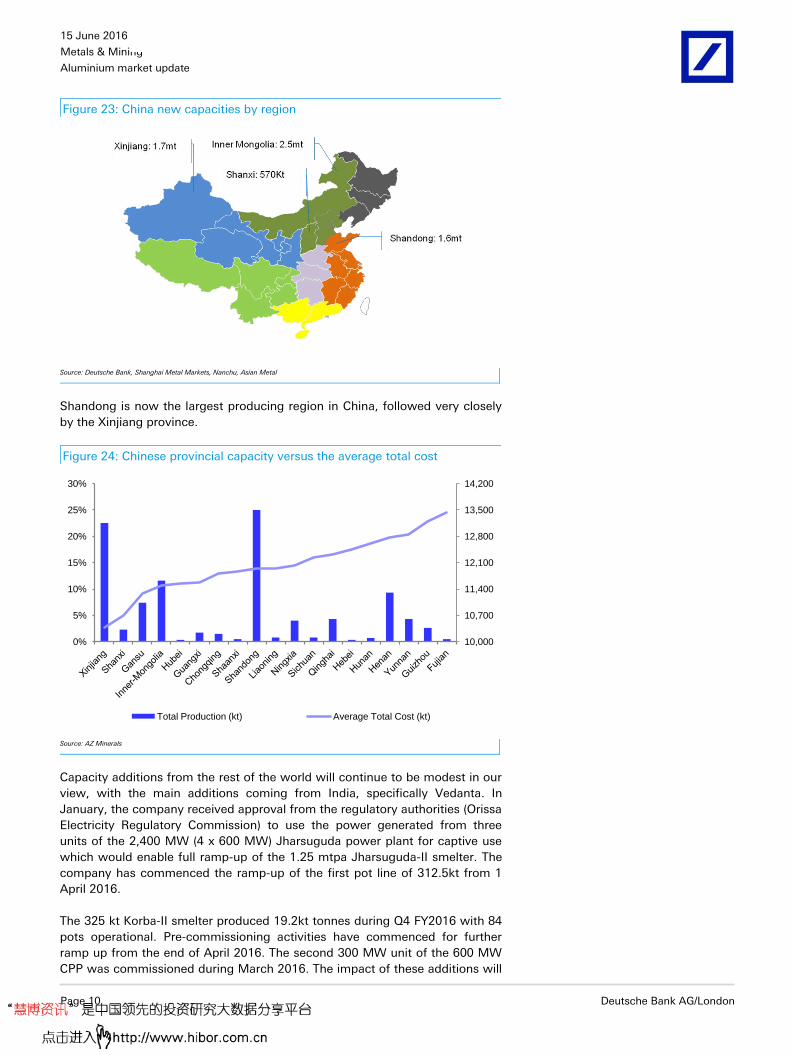
As illustrated in Figure 23 below, most of the upcoming capacities either sit in
coal-abundant areas such as Xinjiang, Inner Mongolia and Shanxi, or close to
end-users in coastal areas like Shandong, with an estimated cash cost from
c.RMB8,500/t to RMB10,000/t.
15 June 2016
Metals & Mining
Aluminium market update
Page 10 Deutsche Bank AG/London
Figure 23: China new capacities by region
Source: Deutsche Bank, Shanghai Metal Markets, Nanchu, Asian Metal
Shandong is now the largest producing region in China, followed very closely
by the Xinjiang province.
Figure 24: Chinese provincial capacity versus the average total cost
10,000
10,700
11,400
12,100
12,800
13,500
14,200
0%
5%
10%
15%
20%
25%
30%
Total Production (kt) Average Total Cost (kt)
Source: AZ Minerals
Capacity additions from the rest of the world will continue to be modest in our
view, with the main additions coming from India, specifically Vedanta. In
January, the company received approval from the regulatory authorities (Orissa
Electricity Regulatory Commission) to use the power generated from three
units of the 2,400 MW (4 x 600 MW) Jharsuguda power plant for captive use
which would enable full ramp-up of the 1.25 mtpa Jharsuguda-II smelter. The
company has commenced the ramp-up of the first pot line of 312.5kt from 1
April 2016.
The 325 kt Korba-II smelter produced 19.2kt tonnes during Q4 FY2016 with 84
pots operational. Pre-commissioning activities have commenced for further
ramp up from the end of April 2016. The second 300 MW unit of the 600 MW
CPP was commissioned during March 2016. The impact of these additions will

15 June 2016
Metals & Mining
Aluminium market update
Deutsche Bank AG/London Page 11
be seen in 2017 as opposed to 2016. We expect modest capacity net additions
from the world ex China (<1%) as closures in the US offset additions elsewhere.
Figure 25: Aluminium capacity additions from the rest of
the world…
Figure 26: …led by India, especially in 2017
-15%
-10%
-5%
0%
5%
10%
15%
20,000
21,000
22,000
23,000
24,000
25,000
26,000
27,000
28,000
29,000
30,000
kt
-600
-400
-200
0
200
400
600
800
1,000
North America
LatAm India Middle East
Australia Eastern Europe
Western Europe
Other Asia
2016E 2017E 2018E
Source: Deutsche Bank
Source: Deutsche Bank
The recovery in Chinese domestic production has been confirmed by data from
the International Aluminium Institute, with the average daily April output of
85.6kt/day up 1.3% from the March output level. In contrast, output from the
world ex China fell slightly as the US closures began to take effect.
Figure 27: Global aluminium output
80
90
100
110
120
130
140
150
160
170
20
30
40
50
60
70
80
90
100
ROW aluminium output China aluminium output
Global aluminium output - rhs
kt/dkt/d
Source: Deutsche Bank, IAI
Chinese exports will come roaring back
We have long argued that whilst most of the innovation in the aluminium
industry is coming from China, the country is becoming more efficient and
competitive at aluminium production. Why then should China not export this
competitive advantage? One could argue that the Chinese costs do not
currently reflect the full environmental cost of carbon emissions, but given the
strides made in moving the energy mix towards renewable sources, we think
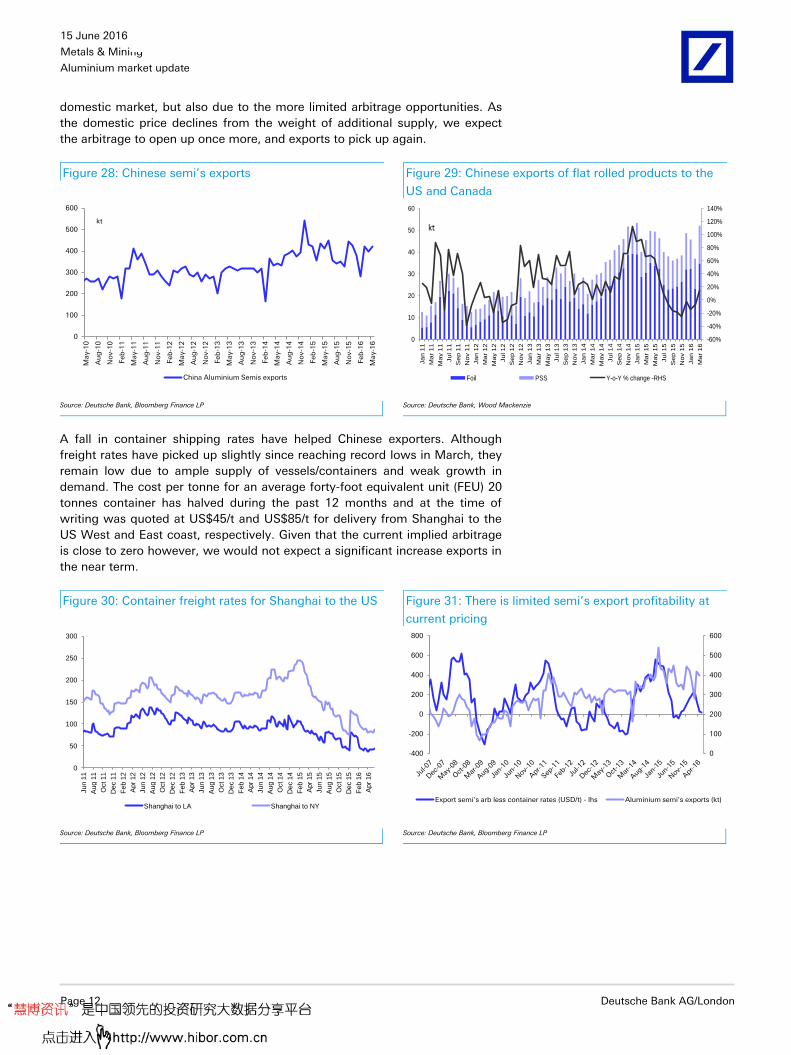
this argument will lose weight over time. Chinese semi’s exports for the first
four months are down 8% versus last year, partly a reflection of a tighter
15 June 2016
Metals & Mining
Aluminium market update
Page 12 Deutsche Bank AG/London
domestic market, but also due to the more limited arbitrage opportunities. As
the domestic price declines from the weight of additional supply, we expect
the arbitrage to open up once more, and exports to pick up again.
Figure 28: Chinese semi’s exports Figure 29: Chinese exports of flat rolled products to the
US and Canada
0
100
200
300
400
500
600
May-1
0
Au
g-1
0
No
v-1
0
Feb
-11
May-1
1
Au
g-1
1
No
v-1
1
Feb
-12
May-1
2
Au
g-1
2
No
v-1
2
Feb
-13
May-1
3
Au
g-1
3
No
v-1
3
Feb
-14
May-1
4
Au
g-1
4
No
v-1
4
Feb
-15
May-1
5
Au
g-1
5
No
v-1
5
Feb
-16
May-1
6China Aluminium Semis exports
kt
-60%
-40%
-20%
0%
20%
40%
60%
80%
100%
120%
140%
0
10
20
30
40
50
60
Jan 1
1
Mar
11
May 1
1
Jul 11
Sep 1
1
Nov 1
1
Jan 1
2
Mar
12
May 1
2
Jul 12
Sep 1
2
Nov 1
2
Jan 1
3
Mar
13
May 1
3
Jul 13
Sep 1
3
Nov 1
3
Jan 1
4
Mar
14
May 1
4
Jul 14
Sep 1
4
Nov 1
4
Jan 1
5
Mar
15
May 1
5
Jul 15
Sep 1
5
Nov 1
5
Jan 1
6
Mar
16
Foil PSS Y-o-Y % change -RHS
kt
Source: Deutsche Bank, Bloomberg Finance LP
Source: Deutsche Bank, Wood Mackenzie
A fall in container shipping rates have helped Chinese exporters. Although
freight rates have picked up slightly since reaching record lows in March, they
remain low due to ample supply of vessels/containers and weak growth in
demand. The cost per tonne for an average forty-foot equivalent unit (FEU) 20
tonnes container has halved during the past 12 months and at the time of
writing was quoted at US$45/t and US$85/t for delivery from Shanghai to the
US West and East coast, respectively. Given that the current implied arbitrage
is close to zero however, we would not expect a significant increase exports in
the near term.
Figure 30: Container freight rates for Shanghai to the US Figure 31: There is limited semi’s export profitability at
current pricing
0
50
100
150
200
250
300
Jun 1
1
Aug 1
1
Oct 11
Dec 1
1
Fe
b 1
2
Apr
12
Jun 1
2
Aug 1
2
Oct 12
Dec 1
2
Fe
b 1
3
Apr
13
Jun 1
3
Aug 1
3
Oct 13
Dec 1
3
Fe
b 1
4
Apr
14
Jun 1
4
Aug 1
4
Oct 14
Dec 1
4
Feb 1
5
Apr
15
Jun 1
5
Aug 1
5
Oct 15
Dec 1
5
Fe
b 1
6
Apr
16
Shanghai to LA Shanghai to NY
0
100
200
300
400
500
600
-400
-200
0
200
400
600
800
Export semi's arb less container rates (USD/t) - lhs Aluminium semi's exports (kt)
Source: Deutsche Bank, Bloomberg Finance LP
Source: Deutsche Bank, Bloomberg Finance LP

15 June 2016
Metals & Mining
Aluminium market update
Deutsche Bank AG/London Page 13
China will continue to drive global prices.
A weaker RMB is a real risk in the near term.
As the largest producer of primary aluminum, and increasingly a supplier to the
world via semi’s exports, we expect China to continue being a strong influence
on global aluminium prices. The rush of closures when the price fell below
RMB10,000/t, and the increasing restarts above RMB11,500/t gives us a good
gauge as to the Chinese price tolerance. In the absence of exceptional demand
outside of China or further capacity cuts, the LME price is likely to be heavily
influenced by the Chinese domestic price. Over the past six months, the
recovery in Chinese prices have simply stabilized LME prices, with a modest
c.USD100/t recovery off the lows. We would argue that in the near term LME
prices should play a bit of catch up.
Figure 32: Chinese domestic prices (converted to USD) Figure 33: LME price including US MidWest premiums
0
50
100
150
200
250
300
350
400
450
1,500
2,000
2,500
3,000
Shanghai price All in Shanghai price Premium
USD/t
0
100
200
300
400
500
600
1,400
1,900
2,400
2,900
LME price All in price US MidWest premium - rhs
USD/tClosures accelerate
Source: Deutsche Bank, Bloomberg Finance LP
Source: Deutsche Bank, Bloomberg Finance LP
The key risk to further pressure on the LME price even in a stable Chinese price
is a depreciating RMB. We continue to expect the RMB to gradually weaken
possibly reaching 7 to the USD by the end of the year. Ironically the LME
aluminium price has led the movements in the RMB, but there is no doubt that
more recently the aluminium price has become more sensitive to the RMB.
Figure 34: The CNY has once again begun to depreciate
against the USD
Figure 35: LME to SHFE price discount: widening once
more
1,400
1,500
1,600
1,700
1,800
1,900
2,000
2,100
2,200
2,300
2,4005.7
5.8
5.9
6
6.1
6.2
6.3
6.4
6.5
6.6
6.7
Jan 1
2
Mar
12
May 1
2
Jul 12
Sep 1
2
Nov 1
2
Jan 1
3
Mar
13
May 1
3
Jul 13
Sep 1
3
Nov 1
3
Jan 1
4
Mar
14
May 1
4
Jul 14
Sep 1
4
Nov 1
4
Jan 1
5
Mar
15
May 1
5
Jul 15
Sep 1
5
Nov 1
5
Jan 1
6
Mar
16
May 1
6
CNY
USD/t - inverse scale
-20.0%
-10.0%
0.0%
10.0%
20.0%
30.0%
40.0%
50.0%
60.0%
Jan 0
9
Ap
r 0
9
Jul 09
Oct 0
9
Jan 1
0
Ap
r 1
0
Jul 10
Oct 1
0
Jan 1
1
Ap
r 1
1
Jul 11
Oct 1
1
Jan 1
2
Ap
r 1
2
Jul 12
Oct 1
2
Jan 1
3
Ap
r 1
3
Jul 13
Oct 1
3
Jan 1
4
Ap
r 1
4
Jul 14
Oct 1
4
Jan 1
5
Ap
r 1
5
Jul 15
Oct 1
5
Jan 1
6
Ap
r 1
6
Source: Deutsche Bank, Bloomberg Finance LP
Source: Deutsche Bank, Bloomberg Finance LP
15 June 2016
Metals & Mining
Aluminium market update
Page 14 Deutsche Bank AG/London
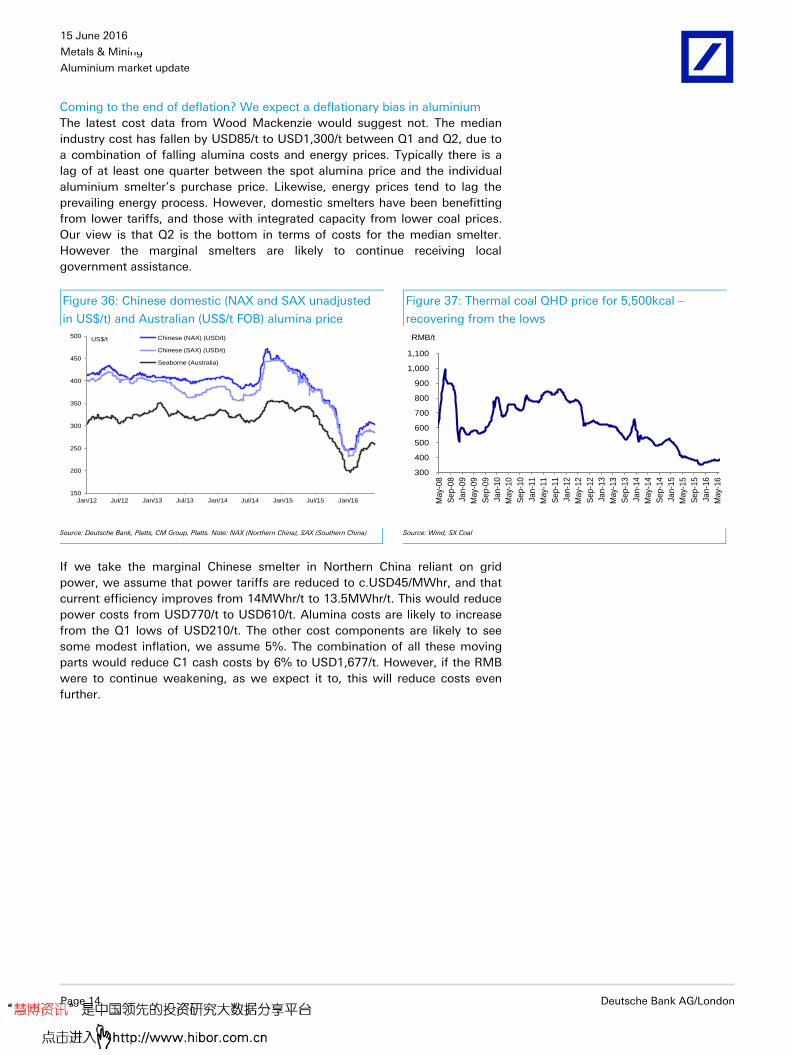
Coming to the end of deflation? We expect a deflationary bias in aluminium
The latest cost data from Wood Mackenzie would suggest not. The median
industry cost has fallen by USD85/t to USD1,300/t between Q1 and Q2, due to
a combination of falling alumina costs and energy prices. Typically there is a
lag of at least one quarter between the spot alumina price and the individual
aluminium smelter’s purchase price. Likewise, energy prices tend to lag the
prevailing energy process. However, domestic smelters have been benefitting
from lower tariffs, and those with integrated capacity from lower coal prices.
Our view is that Q2 is the bottom in terms of costs for the median smelter.
However the marginal smelters are likely to continue receiving local
government assistance.
Figure 36: Chinese domestic (NAX and SAX unadjusted
in US$/t) and Australian (US$/t FOB) alumina price
Figure 37: Thermal coal QHD price for 5,500kcal –
recovering from the lows
150
200
250
300
350
400
450
500
Jan/12 Jul/12 Jan/13 Jul/13 Jan/14 Jul/14 Jan/15 Jul/15 Jan/16
US$/t Chinese (NAX) (USD/t)
Chinese (SAX) (USD/t)
Seaborne (Australia)
300
400
500
600
700
800
900
1,000
1,100
Ma
y-0
8
Se
p-0
8
Ja
n-0
9
Ma
y-0
9
Se
p-0
9
Ja
n-1
0
Ma
y-1
0
Se
p-1
0
Ja
n-1
1
Ma
y-1
1
Se
p-1
1
Ja
n-1
2
Ma
y-1
2
Se
p-1
2
Ja
n-1
3
Ma
y-1
3
Se
p-1
3
Ja
n-1
4
Ma
y-1
4
Se
p-1
4
Ja
n-1
5
Ma
y-1
5
Se
p-1
5
Ja
n-1
6
Ma
y-1
6
RMB/t
Source: Deutsche Bank, Platts, CM Group, Platts. Note: NAX (Northern China), SAX (Southern China)
Source: Wind, SX Coal
If we take the marginal Chinese smelter in Northern China reliant on grid
power, we assume that power tariffs are reduced to c.USD45/MWhr, and that
current efficiency improves from 14MWhr/t to 13.5MWhr/t. This would reduce
power costs from USD770/t to USD610/t. Alumina costs are likely to increase
from the Q1 lows of USD210/t. The other cost components are likely to see
some modest inflation, we assume 5%. The combination of all these moving
parts would reduce C1 cash costs by 6% to USD1,677/t. However, if the RMB
were to continue weakening, as we expect it to, this will reduce costs even
further.

15 June 2016
Metals & Mining
Aluminium market update
Deutsche Bank AG/London Page 15
Figure 38: C1 cash cost breakdown of the marginal
Chinese smelter
Figure 39: Global aluminium cost curve: Q2’16 versus
Q1’16
Delivered Alumina cost30%
Raw Materials18%
Energy43%
Labour2%
Other7%
0
500
1,000
1,500
2,000
2,500
0 10,000 20,000 30,000 40,000 50,000
2016_Q2 2016_Q1
USD/t
kt
Source: Deutsche Bank, Wood Mackenzie
Source: Deutsche Bank, Wood Mackenzie
Aluminium supply demand models
Figure 40: China aluminium demand model
Demand sector 2009 2010 2011 2012 2013 2014 2015 2016E 2017E 2018E
Building & Construction
kt 5,675 6,347 7,435 7,864 8,857 9,689 10,104 10,710 11,032 11,142
YoY growth % 11.8% 17.1% 5.8% 12.6% 9.4% 4.3% 6.0% 3.0% 1.0%
Transport kt 2,683 3,930 5,191 5,602 6,195 7,069 7,541 8,279 8,947 9,596
YoY growth % 46.5% 32.1% 7.9% 10.6% 14.1% 6.7% 9.8% 8.1% 7.2%
Electrical kt 2,364 2,650 2,779 3,217 3,779 4,184 4,450 4,895 5,385 5,654
YoY growth % 12.1% 4.9% 15.8% 17.5% 10.7% 6.4% 10.0% 10.0% 5.0%
Packaging kt 1,294 1,448 1,676 2,570 2,877 3,020 3,220 3,445 3,704 3,982
YoY growth % 11.9% 15.7% 53.3% 11.9% 5.0% 6.6% 7.0% 7.5% 7.5%
Consumer Goods kt 3,325 3,758 4,663 5,171 5,715 6,269 6,610 6,742 6,944 7,222
YoY growth % 13.0% 24.1% 10.9% 10.5% 9.7% 5.4% 2.0% 3.0% 4.0%
Machinery & Equipment
kt 1,918 2,154 2,554 2,640 3,054 3,402 3,634 3,707 3,633 3,705
YoY growth % 12.3% 18.6% 3.4% 15.7% 11.4% 6.8% 2.0% -2.0% 2.0%
Other kt 1,042 1,166 1,350 1,547 1,739 1,936 2,066 2,169 2,278 2,414
YoY growth % 11.9% 15.8% 14.6% 12.4% 11.3% 6.7% 5.0% 5.0% 6.0%
Total kt 18,301 21,453 25,648 28,611 32,216 35,569 37,625 39,948 41,922 43,715
YoY growth % 17.2% 19.6% 11.6% 12.6% 10.4% 5.8% 6.2% 4.9% 4.3%
Primary Consumption 13,937 16,183 18,902 21,233 23,941 26,345 27,975 29,912 31,384 32,756
YoY growth 16.1% 16.8% 12.3% 12.8% 10.0% 6.2% 6.9% 4.9% 4.4%
Secondary Consumption
4,364 5,270 6,746 7,378 8,275 9,225 9,650 10,036 10,538 10,959
YoY growth 20.8% 28.0% 9.4% 12.2% 11.5% 4.6% 4.0% 5.0% 4.0%
Source: Deutsche Bank, SMM, Wood Mackenzie
15 June 2016
Metals & Mining
Aluminium market update
Page 16 Deutsche Bank AG/London
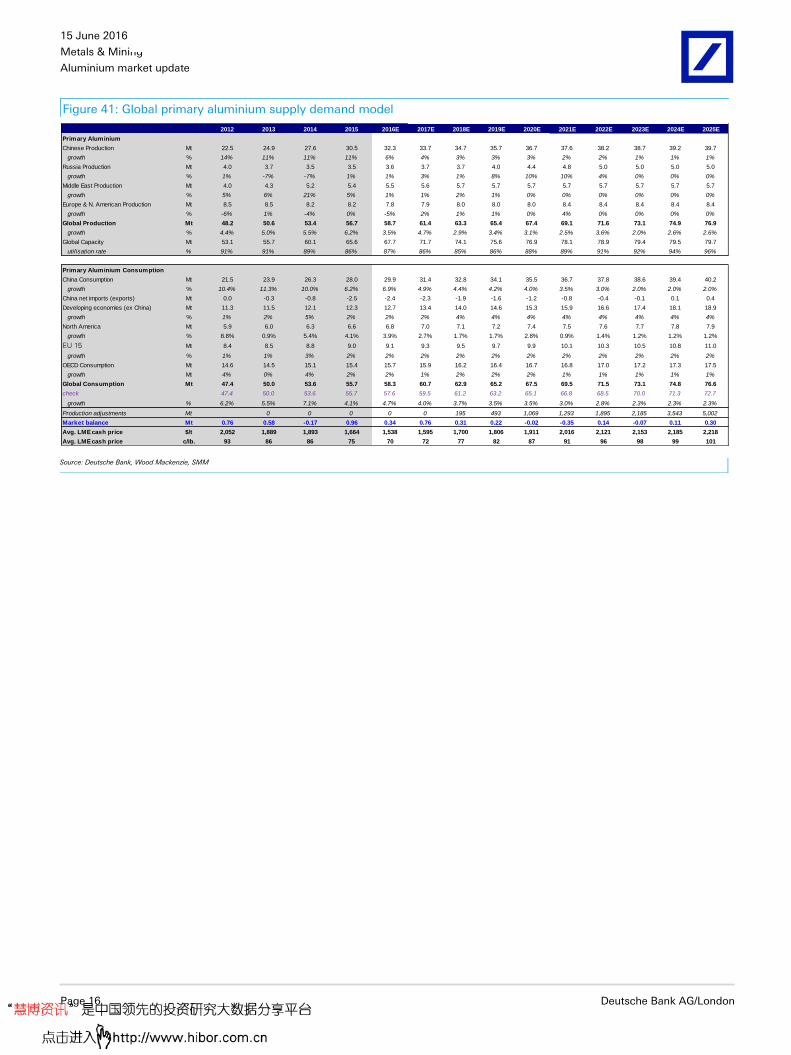
Figure 41: Global primary aluminium supply demand model
2012 2013 2014 2015 2016E 2017E 2018E 2019E 2020E 2021E 2022E 2023E 2024E 2025E
Primary Aluminium
Chinese Production Mt 22.5 24.9 27.6 30.5 32.3 33.7 34.7 35.7 36.7 37.6 38.2 38.7 39.2 39.7
growth % 14% 11% 11% 11% 6% 4% 3% 3% 3% 2% 2% 1% 1% 1%
Russia Production Mt 4.0 3.7 3.5 3.5 3.6 3.7 3.7 4.0 4.4 4.8 5.0 5.0 5.0 5.0
growth % 1% -7% -7% 1% 1% 3% 1% 8% 10% 10% 4% 0% 0% 0%
Middle East Production Mt 4.0 4.3 5.2 5.4 5.5 5.6 5.7 5.7 5.7 5.7 5.7 5.7 5.7 5.7
growth % 5% 6% 21% 5% 1% 1% 2% 1% 0% 0% 0% 0% 0% 0%
Europe & N. American Production Mt 8.5 8.5 8.2 8.2 7.8 7.9 8.0 8.0 8.0 8.4 8.4 8.4 8.4 8.4
growth % -6% 1% -4% 0% -5% 2% 1% 1% 0% 4% 0% 0% 0% 0%
Global Production Mt 48.2 50.6 53.4 56.7 58.7 61.4 63.3 65.4 67.4 69.1 71.6 73.1 74.9 76.9
growth % 4.4% 5.0% 5.5% 6.2% 3.5% 4.7% 2.9% 3.4% 3.1% 2.5% 3.6% 2.0% 2.6% 2.6%
Global Capacity Mt 53.1 55.7 60.1 65.6 67.7 71.7 74.1 75.6 76.9 78.1 78.9 79.4 79.5 79.7
utilisation rate % 91% 91% 89% 86% 87% 86% 85% 86% 88% 89% 91% 92% 94% 96%
Primary Aluminium Consumption
China Consumption Mt 21.5 23.9 26.3 28.0 29.9 31.4 32.8 34.1 35.5 36.7 37.8 38.6 39.4 40.2
growth % 10.4% 11.3% 10.0% 6.2% 6.9% 4.9% 4.4% 4.2% 4.0% 3.5% 3.0% 2.0% 2.0% 2.0%
China net imports (exports) Mt 0.0 -0.3 -0.8 -2.5 -2.4 -2.3 -1.9 -1.6 -1.2 -0.8 -0.4 -0.1 0.1 0.4
Developing economies (ex China) Mt 11.3 11.5 12.1 12.3 12.7 13.4 14.0 14.6 15.3 15.9 16.6 17.4 18.1 18.9
growth % 1% 2% 5% 2% 2% 2% 4% 4% 4% 4% 4% 4% 4% 4%
North America Mt 5.9 6.0 6.3 6.6 6.8 7.0 7.1 7.2 7.4 7.5 7.6 7.7 7.8 7.9
growth % 8.8% 0.9% 5.4% 4.1% 3.9% 2.7% 1.7% 1.7% 2.8% 0.9% 1.4% 1.2% 1.2% 1.2%
EU 15 Mt 8.4 8.5 8.8 9.0 9.1 9.3 9.5 9.7 9.9 10.1 10.3 10.5 10.8 11.0
growth % 1% 1% 3% 2% 2% 2% 2% 2% 2% 2% 2% 2% 2% 2%
OECD Consumption Mt 14.6 14.5 15.1 15.4 15.7 15.9 16.2 16.4 16.7 16.8 17.0 17.2 17.3 17.5
growth Mt 4% 0% 4% 2% 2% 1% 2% 2% 2% 1% 1% 1% 1% 1%
Global Consumption Mt 47.4 50.0 53.6 55.7 58.3 60.7 62.9 65.2 67.5 69.5 71.5 73.1 74.8 76.6
check 47.4 50.0 53.6 55.7 57.6 59.5 61.2 63.2 65.1 66.8 68.5 70.0 71.3 72.7
growth % 6.2% 5.5% 7.1% 4.1% 4.7% 4.0% 3.7% 3.5% 3.5% 3.0% 2.8% 2.3% 2.3% 2.3%
Production adjustments Mt 0 0 0 0 0 195 493 1,069 1,293 1,895 2,185 3,543 5,002
Market balance Mt 0.76 0.58 -0.17 0.96 0.34 0.76 0.31 0.22 -0.02 -0.35 0.14 -0.07 0.11 0.30
Avg. LME cash price $/t 2,052 1,889 1,893 1,664 1,538 1,595 1,700 1,806 1,911 2,016 2,121 2,153 2,185 2,218
Avg. LME cash price c/lb. 93 86 86 75 70 72 77 82 87 91 96 98 99 101
Source: Deutsche Bank, Wood Mackenzie, SMM
15 June 2016
Metals & Mining
Aluminium market update
Deutsche Bank AG/London Page 17
Appendix 1
Important Disclosures
Additional information available upon request
*Prices are current as of the end of the previous trading session unless otherwise indicated and are sourced from local exchanges via Reuters, Bloomberg and other vendors . Other information is sourced from Deutsche Bank, subject companies, and other sources. For disclosures pertaining to recommendations or estimates made on securities other than the primary subject of this research, please see the most recently published company report or visit our global disclosure look-up page on our website at http://gm.db.com/ger/disclosure/DisclosureDirectory.eqsr
Analyst Certification
The views expressed in this report accurately reflect the personal views of the undersigned lead analyst about the subject issuers and the securities of those issuers. In addition, the undersigned lead analyst has not and will not receive any compensation for providing a specific recommendation or view in this report. Grant Sporre/Sharon Ding
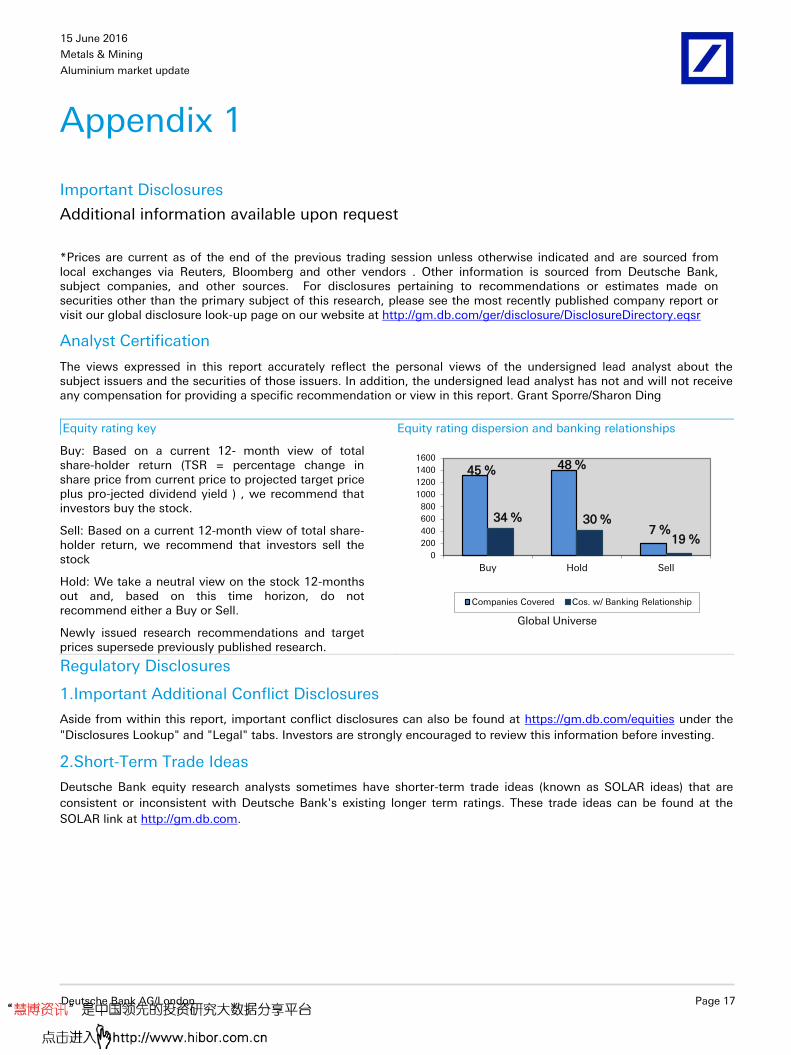
Equity rating key Equity rating dispersion and banking relationships
Buy: Based on a current 12- month view of total share-holder return (TSR = percentage change in share price from current price to projected target price plus pro-jected dividend yield ) , we recommend that investors buy the stock.
Sell: Based on a current 12-month view of total share-holder return, we recommend that investors sell the stock
Hold: We take a neutral view on the stock 12-months out and, based on this time horizon, do not recommend either a Buy or Sell.
Newly issued research recommendations and target prices supersede previously published research.
45 % 48 %
7 %34 % 30 %
19 %0
200
400
600
800
1000
1200
1400
1600
Buy Hold Sell
Global Universe
Companies Covered Cos. w/ Banking Relationship
Regulatory Disclosures
1.Important Additional Conflict Disclosures
Aside from within this report, important conflict disclosures can also be found at https://gm.db.com/equities under the
"Disclosures Lookup" and "Legal" tabs. Investors are strongly encouraged to review this information before investing.
2.Short-Term Trade Ideas
Deutsche Bank equity research analysts sometimes have shorter-term trade ideas (known as SOLAR ideas) that are
consistent or inconsistent with Deutsche Bank's existing longer term ratings. These trade ideas can be found at the
SOLAR link at http://gm.db.com.
15 June 2016
Metals & Mining
Aluminium market update
Page 18 Deutsche Bank AG/London
Additional Information
The information and opinions in this report were prepared by Deutsche Bank AG or one of its affiliates (collectively
"Deutsche Bank"). Though the information herein is believed to be reliable and has been obtained from public sources
believed to be reliable, Deutsche Bank makes no representation as to its accuracy or completeness.
If you use the services of Deutsche Bank in connection with a purchase or sale of a security that is discussed in this
report, or is included or discussed in another communication (oral or written) from a Deutsche Bank analyst, Deutsche
Bank may act as principal for its own account or as agent for another person.
Deutsche Bank may consider this report in deciding to trade as principal. It may also engage in transactions, for its own
account or with customers, in a manner inconsistent with the views taken in this research report. Others within
Deutsche Bank, including strategists, sales staff and other analysts, may take views that are inconsistent with those
taken in this research report. Deutsche Bank issues a variety of research products, including fundamental analysis,
equity-linked analysis, quantitative analysis and trade ideas. Recommendations contained in one type of communication
may differ from recommendations contained in others, whether as a result of differing time horizons, methodologies or
otherwise. Deutsche Bank and/or its affiliates may also be holding debt securities of the issuers it writes on.
Analysts are paid in part based on the profitability of Deutsche Bank AG and its affiliates, which includes investment
banking revenues.
Opinions, estimates and projections constitute the current judgment of the author as of the date of this report. They do
not necessarily reflect the opinions of Deutsche Bank and are subject to change without notice. Deutsche Bank has no
obligation to update, modify or amend this report or to otherwise notify a recipient thereof if any opinion, forecast or
estimate contained herein changes or subsequently becomes inaccurate. This report is provided for informational
purposes only. It is not an offer or a solicitation of an offer to buy or sell any financial instruments or to participate in any
particular trading strategy. Target prices are inherently imprecise and a product of the analyst’s judgment. The financial
instruments discussed in this report may not be suitable for all investors and investors must make their own informed
investment decisions. Prices and availability of financial instruments are subject to change without notice and
investment transactions can lead to losses as a result of price fluctuations and other factors. If a financial instrument is
denominated in a currency other than an investor's currency, a change in exchange rates may adversely affect the
investment. Past performance is not necessarily indicative of future results. Unless otherwise indicated, prices are
current as of the end of the previous trading session, and are sourced from local exchanges via Reuters, Bloomberg and
other vendors. Data is sourced from Deutsche Bank, subject companies, and in some cases, other parties.
Macroeconomic fluctuations often account for most of the risks associated with exposures to instruments that promise
to pay fixed or variable interest rates. For an investor who is long fixed rate instruments (thus receiving these cash
flows), increases in interest rates naturally lift the discount factors applied to the expected cash flows and thus cause a
loss. The longer the maturity of a certain cash flow and the higher the move in the discount factor, the higher will be the
loss. Upside surprises in inflation, fiscal funding needs, and FX depreciation rates are among the most common adverse
macroeconomic shocks to receivers. But counterparty exposure, issuer creditworthiness, client segmentation, regulation
(including changes in assets holding limits for different types of investors), changes in tax policies, currency
convertibility (which may constrain currency conversion, repatriation of profits and/or the liquidation of positions), and
settlement issues related to local clearing houses are also important risk factors to be considered. The sensitivity of fixed
income instruments to macroeconomic shocks may be mitigated by indexing the contracted cash flows to inflation, to
FX depreciation, or to specified interest rates – these are common in emerging markets. It is important to note that the
index fixings may -- by construction -- lag or mis-measure the actual move in the underlying variables they are intended
to track. The choice of the proper fixing (or metric) is particularly important in swaps markets, where floating coupon
rates (i.e., coupons indexed to a typically short-dated interest rate reference index) are exchanged for fixed coupons. It is
also important to acknowledge that funding in a currency that differs from the currency in which coupons are
denominated carries FX risk. Naturally, options on swaps (swaptions) also bear the risks typical to options in addition to
the risks related to rates movements.
15 June 2016
Metals & Mining
Aluminium market update
Deutsche Bank AG/London Page 19
Derivative transactions involve numerous risks including, among others, market, counterparty default and illiquidity risk.
The appropriateness or otherwise of these products for use by investors is dependent on the investors' own
circumstances including their tax position, their regulatory environment and the nature of their other assets and
liabilities, and as such, investors should take expert legal and financial advice before entering into any transaction similar
to or inspired by the contents of this publication. The risk of loss in futures trading and options, foreign or domestic, can
be substantial. As a result of the high degree of leverage obtainable in futures and options trading, losses may be
incurred that are greater than the amount of funds initially deposited. Trading in options involves risk and is not suitable
for all investors. Prior to buying or selling an option investors must review the "Characteristics and Risks of Standardized
Options”, at http://www.optionsclearing.com/about/publications/character-risks.jsp. If you are unable to access the
website please contact your Deutsche Bank representative for a copy of this important document.
Participants in foreign exchange transactions may incur risks arising from several factors, including the following: ( i)
exchange rates can be volatile and are subject to large fluctuations; ( ii) the value of currencies may be affected by
numerous market factors, including world and national economic, political and regulatory events, events in equity and
debt markets and changes in interest rates; and (iii) currencies may be subject to devaluation or government imposed
exchange controls which could affect the value of the currency. Investors in securities such as ADRs, whose values are
affected by the currency of an underlying security, effectively assume currency risk.
Unless governing law provides otherwise, all transactions should be executed through the Deutsche Bank entity in the
investor's home jurisdiction.
United States: Approved and/or distributed by Deutsche Bank Securities Incorporated, a member of FINRA, NFA and
SIPC. Analysts employed by non-US affiliates may not be associated persons of Deutsche Bank Securities Incorporated
and therefore not subject to FINRA regulations concerning communications with subject companies, public appearances
and securities held by analysts.
Germany: Approved and/or distributed by Deutsche Bank AG, a joint stock corporation with limited liability incorporated
in the Federal Republic of Germany with its principal office in Frankfurt am Main. Deutsche Bank AG is authorized under
German Banking Law and is subject to supervision by the European Central Bank and by BaFin, Germany’s Federal
Financial Supervisory Authority.
United Kingdom: Approved and/or distributed by Deutsche Bank AG acting through its London Branch at Winchester
House, 1 Great Winchester Street, London EC2N 2DB. Deutsche Bank AG in the United Kingdom is authorised by the
Prudential Regulation Authority and is subject to limited regulation by the Prudential Regulation Authority and Financial
Conduct Authority. Details about the extent of our authorisation and regulation are available on request.
Hong Kong: Distributed by Deutsche Bank AG, Hong Kong Branch.
India: Prepared by Deutsche Equities India Pvt Ltd, which is registered by the Securities and Exchange Board of India
(SEBI) as a stock broker. Research Analyst SEBI Registration Number is INH000001741. DEIPL may have received
administrative warnings from the SEBI for breaches of Indian regulations.
Japan: Approved and/or distributed by Deutsche Securities Inc.(DSI). Registration number - Registered as a financial
instruments dealer by the Head of the Kanto Local Finance Bureau (Kinsho) No. 117. Member of associations: JSDA,
Type II Financial Instruments Firms Association and The Financial Futures Association of Japan. Commissions and risks
involved in stock transactions - for stock transactions, we charge stock commissions and consumption tax by
multiplying the transaction amount by the commission rate agreed with each customer. Stock transactions can lead to
losses as a result of share price fluctuations and other factors. Transactions in foreign stocks can lead to additional
losses stemming from foreign exchange fluctuations. We may also charge commissions and fees for certain categories
of investment advice, products and services. Recommended investment strategies, products and services carry the risk
of losses to principal and other losses as a result of changes in market and/or economic trends, and/or fluctuations in
market value. Before deciding on the purchase of financial products and/or services, customers should carefully read the
relevant disclosures, prospectuses and other documentation. "Moody's", "Standard & Poor's", and "Fitch" mentioned in
this report are not registered credit rating agencies in Japan unless Japan or "Nippon" is specifically designated in the
name of the entity. Reports on Japanese listed companies not written by analysts of DSI are written by Deutsche Bank

15 June 2016
Metals & Mining
Aluminium market update
Page 20 Deutsche Bank AG/London
Group's analysts with the coverage companies specified by DSI. Some of the foreign securities stated on this report are
not disclosed according to the Financial Instruments and Exchange Law of Japan.
Korea: Distributed by Deutsche Securities Korea Co.
South Africa: Deutsche Bank AG Johannesburg is incorporated in the Federal Republic of Germany (Branch Register
Number in South Africa: 1998/003298/10).
Singapore: by Deutsche Bank AG, Singapore Branch or Deutsche Securities Asia Limited, Singapore Branch (One Raffles
Quay #18-00 South Tower Singapore 048583, +65 6423 8001), which may be contacted in respect of any matters
arising from, or in connection with, this report. Where this report is issued or promulgated in Singapore to a person who
is not an accredited investor, expert investor or institutional investor (as defined in the applicable Singapore laws and
regulations), they accept legal responsibility to such person for its contents.
Taiwan: Information on securities/investments that trade in Taiwan is for your reference only. Readers should
independently evaluate investment risks and are solely responsible for their investment decisions. Deutsche Bank
research may not be distributed to the Taiwan public media or quoted or used by the Taiwan public media without
written consent. Information on securities/instruments that do not trade in Taiwan is for informational purposes only and
is not to be construed as a recommendation to trade in such securities/instruments. Deutsche Securities Asia Limited,
Taipei Branch may not execute transactions for clients in these securities/instruments.
Qatar: Deutsche Bank AG in the Qatar Financial Centre (registered no. 00032) is regulated by the Qatar Financial Centre
Regulatory Authority. Deutsche Bank AG - QFC Branch may only undertake the financial services activities that fall
within the scope of its existing QFCRA license. Principal place of business in the QFC: Qatar Financial Centre, Tower,
West Bay, Level 5, PO Box 14928, Doha, Qatar. This information has been distributed by Deutsche Bank AG. Related
financial products or services are only available to Business Customers, as defined by the Qatar Financial Centre
Regulatory Authority.
Russia: This information, interpretation and opinions submitted herein are not in the context of, and do not constitute,
any appraisal or evaluation activity requiring a license in the Russian Federation.
Kingdom of Saudi Arabia: Deutsche Securities Saudi Arabia LLC Company, (registered no. 07073-37) is regulated by the
Capital Market Authority. Deutsche Securities Saudi Arabia may only undertake the financial services activities that fall
within the scope of its existing CMA license. Principal place of business in Saudi Arabia: King Fahad Road, Al Olaya
District, P.O. Box 301809, Faisaliah Tower - 17th Floor, 11372 Riyadh, Saudi Arabia.
United Arab Emirates: Deutsche Bank AG in the Dubai International Financial Centre (registered no. 00045) is regulated
by the Dubai Financial Services Authority. Deutsche Bank AG - DIFC Branch may only undertake the financial services
activities that fall within the scope of its existing DFSA license. Principal place of business in the DIFC: Dubai
International Financial Centre, The Gate Village, Building 5, PO Box 504902, Dubai, U.A.E. This information has been
distributed by Deutsche Bank AG. Related financial products or services are only available to Professional Clients, as
defined by the Dubai Financial Services Authority.
Australia: Retail clients should obtain a copy of a Product Disclosure Statement (PDS) relating to any financial product
referred to in this report and consider the PDS before making any decision about whether to acquire the product. Please
refer to Australian specific research disclosures and related information at
https://australia.db.com/australia/content/research-information.html
Australia and New Zealand: This research, and any access to it, is intended only for "wholesale clients" within the
meaning of the Australian Corporations Act and New Zealand Financial Advisors Act respectively.
Additional information relative to securities, other financial products or issuers discussed in this report is available upon
request. This report may not be reproduced, distributed or published without Deutsche Bank's prior written consent.
Copyright © 2016 Deutsche Bank AG
David Folkerts-Landau Chief Economist and Global Head of Research
Raj Hindocha Global Chief Operating Officer
Research
Michael Spencer Head of APAC Research
Global Head of Economics
Steve Pollard Head of Americas Research
Global Head of Equity Research
Anthony Klarman Global Head of Debt Research
Paul Reynolds Head of EMEA
Equity Research
Dave Clark Head of APAC
Equity Research
Pam Finelli Global Head of
Equity Derivatives Research
Andreas Neubauer Head of Research - Germany
Stuart Kirk Head of Thematic Research
International locations
Deutsche Bank AG
Deutsche Bank Place
Level 16
Corner of Hunter & Phillip Streets
Sydney, NSW 2000
Australia
Tel: (61) 2 8258 1234
Deutsche Bank AG
Große Gallusstraße 10-14
60272 Frankfurt am Main
Germany
Tel: (49) 69 910 00
Deutsche Bank AG
Filiale Hongkong
International Commerce Centre,
1 Austin Road West,Kowloon,
Hong Kong
Tel: (852) 2203 8888
Deutsche Securities Inc.
2-11-1 Nagatacho
Sanno Park Tower
Chiyoda-ku, Tokyo 100-6171
Japan
Tel: (81) 3 5156 6770
Deutsche Bank AG London
1 Great Winchester Street
London EC2N 2EQ
United Kingdom
Tel: (44) 20 7545 8000
Deutsche Bank Securities Inc.
60 Wall Street
New York, NY 10005
United States of America
Tel: (1) 212 250 2500