Hindus celebrations and festivals Taylan Sharmah Citrine Class Year 2
Alteration of citrine structure by hydrostatic pressureexplains the accompanying spectral shiftBuz Barstow*, Nozomi Ando†‡, Chae Un Kim‡§, and Sol M. Gruner*†§¶
*School of Applied Physics, †Department of Physics, and §Cornell High Energy Synchrotron Source, Cornell University, Ithaca, NY 14853
Edited by Roland Winter, Dortmund University of Technology, Dortmund, Germany, and accepted by the Editorial Board June 4, 2008 (received for reviewMarch 6, 2008)
A protein molecule is an intricate system whose function is highlysensitive to small external perturbations. However, no examplesthat correlate protein function with progressive subangstromstructural perturbations have thus far been presented. To elucidatethis relationship, we have investigated a fluorescent protein,citrine, as a model system under high-pressure perturbation. Theprotein has been compressed to produce deformations of itschromophore by applying a high-pressure cryocooling technique.A closely spaced series of x-ray crystallographic structures revealsthat the chromophore undergoes a progressive deformation of upto 0.8 Å at an applied pressure of 500 MPa. It is experimentallydemonstrated that the structural motion is directly correlated withthe progressive fluorescence shift of citrine from yellow to greenunder these conditions. This protein is therefore highly sensitive tosubangstrom deformations and its function must be understood atthe subangstrom level. These results have significant implicationsfor protein function prediction and biomolecule design and engi-neering, because they suggest methods to tune protein function bymodification of the protein scaffold.
fluorescence � high-pressure x-ray crystallography � protein engineering �protein structure-function � yellow fluorescent protein
I t is well known that the three-dimensional structure of aprotein molecule is crucial to understanding its function (1).
Because protein molecules have dimensions of tens to hundredsof angstroms, subangstrom positional perturbations may naıvelyappear insignificant (2). However, if one considers two objectsinteracting through a Lennard–Jones potential that are sepa-rated by 3.5 Å and moves them together by just 0.1 Å, thepotential energy between these objects will change by (1/3.46)/(1/3.56) � 1.19, or 19%. This calculation suggests that changes assmall as 0.1 Å in the relative positions of critical functionalgroups could make a large difference in the energy of anelectronic transition and thus a notable change in proteinfunction (3).
The sensitivity of protein function to subangstrom positioning ofcritical functional groups is implied by the observation that modestpressures (less than a few hundred MPa) significantly modifyprotein function (4). For example, the flash decay rate of fireflyluciferase is reduced (5), the oxygen binding affinity of humanhemoglobin is doubled (6), and oxidation rates by morphinonereductase are increased (7). Protein atomic structures at up to a fewhundred MPa (8–16) indicate that atoms in protein molecules aretypically displaced by �0.1–1.0 Å from their ambient pressurepositions. These observations suggest that the exact positioning ofatoms, especially in the active sites of catalytic proteins, is animportant feature of protein operation and that this positioning issubject to environmental perturbation.
To systematically investigate the correlation between proteinfunction and small structural deformations, we selected theAequorea Yellow Fluorescent Protein (YFP) citrine (17–19), anextremely bright, intrinsically f luorescent protein whose atomicstructure is known to 2.2-Å resolution (17), which displays afluorescence peak shift of �1 nm/100 MPa at room temperature[supporting information (SI) Text and Fig. S1] (20).
The most notable feature of the YFP family is the stacking ofa phenol ring, the side chain of tyrosine 203, 3.4 Å above themain chromophore found in all Aequorea f luorescent proteins.The weak interaction of the main chromophore and the tyrosine203 phenol is speculated to be responsible for shifting thefluorescence peak of citrine from green to yellow (18). Adiagram of citrine and its chromophore is shown in Fig. 1. Onecan imagine that a small pressure-induced deformation of the�-barrel scaffold of citrine could perturb the relative positions ofthe main chromophore and tyrosine 203, changing their weakinteraction, and alter the fluorescence properties of citrine.
ResultsA closely spaced series of structures of citrine was solved by usinga high-pressure x-ray crystallography technique developed byKim et al. (9). A protein crystal is pressurized with helium gasand is then cooled to 77 K, locking in collective pressure-inducedstructural changes (8–9). After pressure release, the proteinmolecules composing the crystal will retain many of the collec-tive changes of the pressurized state, on the condition that thecrystal’s temperature remains well below its glass transitiontemperature (4, 8, 21). Citrine crystals were prepared at pres-sures ranging from 50 to 500 MPa. In total, data from 30high-quality crystals was condensed into 26 atomic models byusing a standardized refinement procedure (SI Text). Eachstructure at every pressure is derived from a different crystal atcryogenic temperatures. The high-resolution limit of the datasetsranged from 1.5 to 2.46 Å (SI Text), typically �2 Å.
Subangstrom structural shifts also occur upon cooling tocryogenic temperatures (8, 22), complicating pressure cryocool-ing analysis. To establish a direct link to the high-pressurecryocooled structures of citrine, f luorescence spectra of high-pressure cryocooled citrine samples were measured with acrystal spectrophotometer (23–24) (SI Text). Optimal spectrawere obtained from dilute solutions of citrine in optically clearpolycarbonate capillaries with well defined path lengths (25) (SIText). Solutions were prepared with absorbances �0.1 whilemaintaining strong fluorescence with a satisfactory signal tobackground and high-pressure cryocooled. Background subtrac-tion was performed with a high-pressure cryocooled reference ateach pressure level. The fluorescence peak of citrine solutionsshifts from 527 nm when frozen at ambient pressure to 530 nm
Author contributions: B.B., N.A., C.U.K., and S.M.G. designed research; B.B., N.A., and C.U.K.performed research; B.B., N.A., C.U.K., and S.M.G. analyzed data; and B.B., N.A., and S.M.G.wrote the paper.
The authors declare no conflict of interest.
This article is a PNAS Direct Submission. R.W. is a guest editor invited by the Editorial Board.
Data deposition: The atomic coordinates have been deposited in the Protein Data Base,www.pdb.org (accession codes are listed in Table S5).
‡N.A. and C.U.K. contributed equally to this work.
¶To whom correspondence should be addressed at: 162 Clark Hall, Cornell University,Ithaca, NY 14853. E-mail: [email protected].
This article contains supporting information online at www.pnas.org/cgi/content/full/0802252105/DCSupplemental.
© 2008 by The National Academy of Sciences of the USA
13362–13366 � PNAS � September 9, 2008 � vol. 105 � no. 36 www.pnas.org�cgi�doi�10.1073�pnas.0802252105

at 50 MPa and to 510 nm at 360 MPa, with most of the shiftoccurring by 250 MPa (Fig. 2A).
The fluorescence peak shift from yellow to green suggests thatthe perturbing interaction of tyrosine 203 is slowly removed bythe application of high-pressure. The fluorescence peak shift ofpressure cryocooled citrine relaxes to yellow upon warming ofthe sample above a critical temperature (�180 K). It does notreturn to its original position upon recooling, suggesting that theoriginal f luorescence shift to the green had been locked in by thehigh-pressure cryocooling procedure. The fluorescence peak ofa high-pressure cryocooled solution that was slowly warmed andrecooled is shown as a function of temperature in Fig. 2 B andC. This relaxation effect is also observed in citrine crystals atapproximately the same temperature (SI Text and Fig. S2). Thefluorescence peak of monomeric EGFP, which lacks the per-turbing tyrosine 203 ring, does not shift as a function of pressure.
To reduce possible random and systematic coordinate errorsin the high-pressure cryocooled structures of citrine, multiplemodels were constructed at different pressure levels, using datafrom a new crystal for each model. This procedure allowed thecalculation of an average and standard deviation for each atomiccoordinate. The standard deviations were compared with theapproximate coordinate estimate error by Cruickshank (26) andfound to be less than or equal to this estimate. The constructionof multiple models at each pressure level permits the identifi-cation of structural deformations below the resolution limit ofany individual dataset.
The crystal structures of high-pressure cryocooled citrinereveal a small but progressive reorientation of the two stackedaromatic rings that compose citrine’s chromophore. This defor-mation of the chromophore smoothly increases with pressureand stands out from atomic coordinate error. Structures of themain chromophore and tyrosine 203 of the highest qualitystructures at representative pressures are shown in Fig. 3. Thetyrosine 203 phenol rings of the high-pressure cryocooled struc-tures were aligned by using the LSQKAB program (27) to allowinspection of the main chromophore position relative to tyrosine203. This aligned tyrosine 203 coordinate system is also defined inFig. 3. The origin of the aligned tyrosine 203 coordinate system isat the center of the tyrosine 203 phenol ring. The x and y axes of thissystem are embedded in the plane of the phenol ring, whereas thez axis is normal to this plane. The x, y, and z axes are oriented so thatall motions with increasing pressure have a positive sign.
Plots of the motion of the main chromophore’s two rings in thealigned tyrosine 203 coordinate system are shown in Fig. 4. Thecenter of the main chromophore’s phenol ring slides underneaththe stacked tyrosine 203 phenol with increasing pressure. Thissliding motion is confined to a plane parallel to the x-y plane and3.4 Å below it, at z � �3.4 Å. The maximum extent of the swingis �0.8 Å over 500 MPa. The largest component of motion isapproximately �0.5 Å in the y-direction, moving the mainchromophore away from the origin. The motion in the x-direc-tion brings the center of the main chromophore’s phenol �0.4 Å
closer to the origin of the coordinate system. The center of massof the main chromophore’s imidazolinone ring moves by 0.5 Åin y, 0.4 Å in x, and 0.2 Å in z (Fig. 4).
0 100 200 300 400
500
510
520
530 Citrine
mEGFP
180 160 140 120 100 80 60 40
515
520
525
530B
A
500 520 540 560 580 6000.00
0.05
0.10
0.15
0.20
0.25
After Warming
Before Warming
Flu
ore
scen
ce P
eak
(nm
)
Pressure (MPa)
Wavelength (nm)
Temperature (˚C)
C
Flu
ore
scen
ce P
eak
(nm
)F
luo
resc
ence
Inte
nsi
ty (
a.u
.)
Fig. 2. Pressure-induced fluorescence peak shift of citrine. (A) Citrine’s fluores-cencepeakunderhigh-pressurecryocooling(squares),withconnecting linetoaideye, and mEGFP’s fluorescence peak under identical conditions (diamonds). Fit isshown as a dashed line. (B) Fluorescence peak of citrine solution in capillarypressurized to 200 MPa as it is warmed. Note dashed circles surrounding start(gray) and end (black) points of curve, corresponding to spectra of high-pressurecryocooled citrine solution before and after warming, as shown in C.
Chromophore inside Citrine
Citrine’s Chromophore
Tyrosine 203 phenol ringNot present in GFP
Main chromophore phenol ring
3.4 Å
Main chromophore imidazolinone ring
Single bond
Fig. 1. The citrine molecule and citrine’s chromophore.
Barstow et al. PNAS � September 9, 2008 � vol. 105 � no. 36 � 13363
BIO
PHYS
ICS

In addition to sliding, the main chromophore phenol ringreorients with respect to the tyrosine 203 phenol ring and themain chromophore’s imidazolinone ring. The normal vector tothe main chromophore’s phenol ring rotates from 7°, withrespect to the z-axis, to 14°, by 500 MPa (Fig. 4). The normal tothe main chromophore imidazolinone ring rotates by �5°,changing the orientation of the two rings composing the mainchromophore (Fig. 4).
The progressive deformation of citrine’s structure under high-pressure cryocooling reveals a mechanism for the shift towardthe green of citrine’s f luorescence peak. The relative positions ofthe main chromophore and the perturbing tyrosine 203 phenolring separate with increasing pressure, removing the perturbinginfluence of the tyrosine 203 phenol and allowing the main
chromophore to return to its unperturbed, green fluorescentstate. The removal of the perturbing interaction requires astructural shift of only 0.8 Å.
DiscussionWe have demonstrated that small deformations of only severaltenths of one angstrom in the active site of the YFP moleculecitrine, induced by high-pressure cryocooling, can measurablyaffect its function: f luorescence. This deformation shifts thefluorescence peak of the molecule from yellow to green.
To interpret the relationship between the positions of the mainchromophore and tyrosine 203 (Fig. 4) and the fluorescencepeak of citrine (Fig. 2), we must consider the degree of alignmentof the two rings. The overlap of the tyrosine 203 phenol with the
400 MPa200 MPa
0.1 MPa
100 MPa
Z
Y
Motion of Chromophore with Increasing Pressure
0.82 Å 3.4 Å
Fig. 3. X-ray crystal structures of citrine’s chromophore at selected pressures with the lowest RFree factors. Note the x-y-z coordinate axes defined in this figure. Theorigin of the coordinate system is at the center of the tyrosine 203 phenol ring. Note that the centers of mass of the main chromophore phenol and imidazolinone ringshave negative z coordinates.
Fig. 4. Average center of mass positions of the main chromophore phenol and imidazolinone rings in the coordinate system defined in Fig. 3. Error bars wereestimated by Cruickshank’s formula. Fits are shown as solid gray lines.
13364 � www.pnas.org�cgi�doi�10.1073�pnas.0802252105 Barstow et al.

main chromophore shifts the fluorescence peak toward yellowunder ambient conditions (18). There are two notable pressureregions in Fig. 2 A, one at pressures �100 MPa and another at�50 MPa. We showed that at pressures exceeding 100 MPa, thetyrosine 203 phenol is pushed far enough away from the mainchromophore to blue-shift the spectrum of citrine to the green.This results in a spectrum that is more like EGFP, with afluorescence peak at 510 nm (19). At �50 MPa, there is a smallred-shift of the fluorescence peak. This red-shift is interesting,because it demonstrates that, under ambient conditions, theperturbing influence of the tyrosine 203 phenol on the mainchromophore is not maximized. The application of a smallpressure, �50 MPa, is enough to increase the perturbation on themain chromophore.
As noted earlier, the function of many proteins is stronglyaffected by pressure, yet they are highly incompressible, onlyone-twentieth to one-third as compressible as water (28). Theeffect of pressure is not to isotropically compress the molecule,but to alter its ensemble of allowed conformations. Many specificinteractions may be involved, including changes in hydration andionization of surface groups and reduction of void volume. As aprotein is a system of linked parts, small pressure-inducedstructural changes across the molecule may be communicated tothe active site, resulting in functional changes, which appears tobe the case with citrine: The deformation of the �-barrel scaffoldis communicated to the aromatic rings directly involved influorescence.
Dietz et al. (29–31) have performed single molecule unfold-ing experiments on GFP molecules by using optical tweezers.One speculates that a similar experiment could be performedwhere mechanical forces, such as those produced by the tip ofan atomic force microscope (AFM) or optical tweezers, couldbe used to distort the protein to see whether it results in asimilar spectral shift. The global effect of pressure on thecitrine �-barrel structure is that the barrel bends slightly to oneside (data not shown). This deformation is communicated tothe chromophore. It would be of interest to mechanically bendthe barrel to one side by pushing on it with the AFM tip to seewhether the spectrum shifts. Although this would be a verydifficult experiment to perform, it is in principle feasible.
The pressure dependent behavior of citrine provides a testof models of protein f luorescence (32–33). This type ofsimultaneous study of the activity and structure of proteinmolecules under progressive deformation will provide chal-lenging tests for, and may allow the improvement of, manycomputer models of protein function. An improvement inprotein function prediction algorithms may have importantbenefits for rational protein design. It is likely that small (�1Å) structural deformations in the active sites of many proteinsmay have measurable effects on their functions. It is alsopossible that seemingly small refinement errors (on the orderof 0.1 Å) in atomic structures of proteins, derived fromlow-resolution data or by homology modeling of known struc-tures, could lead to substantial errors on the predicted catalyticactivities of these proteins (34). These results also suggest that,to achieve maximum efficiency in their design goal, designedmacromolecules may need to be engineered with subangstromstructural accuracy. High-pressure perturbation may provide ameans to explore catalytic rate enhancement, and to achieveit, by suggesting sites at which strain-inducing mutations (35)may be introduced into the protein scaffold to mimic theeffects of high-pressure under ambient conditions that wouldnot be highlighted by other methods.
Materials and MethodsProtein Expression, Purification, and Crystallization. The gene for citrine waskindly provided by R. Y. Tsien (University of California at San Diego) in apRSETB (Invitrogen) plasmid. The gene was extracted from the plasmid by PCR,
the N-terminal enterokinase cut site was replaced by a Tobacco Etch Virus(TEV) protease cut site, and the resulting gene was ligated into a pET28plasmid (Novagen). Citrine was expressed in E. coli strain BL21 and waspurified by affinity chromatography. Polyhistidine affinity tags were digestedby the TEV protease and removed by affinity chromatography using a Ni-NTAcolumn (HisTrap HP, catalog number 17-5248-01, GE Healthcare). Gel filtrationwas performed as a final purification step. Citrine was stored in 50 mM HEPES(pH 7.5) and concentrated to 20 mg/ml with a centrifugal concentrator (cat-alog number OD010C37, Pall Separation Systems).
A citrine crystal was initially grown at 9% wt/vol PEG 3350 (catalognumber HR2-591, Hampton Research) in 50 mM sodium acetate and 50 mMammonium acetate, at pH 4.5 and 4°C. This crystal was used to produce aseed stock from which further crystals were grown (Fig. S3). Later citrinecrystals were produced by using a Seed Bead (Hampton Research) toproduce a seeded 1:1 mixture of 5% wt/vol PEG 3350, 50 mM sodiumacetate, and 50 mM ammonium acetate (pH 5.0). Ten-microliter droplets ofthis mixture were dispensed onto glass cover-slides and sealed over wellscontaining a 5% wt/vol PEG 3350, 50 mM sodium acetate, and 50 mMammonium acetate (pH 5.0) precipitant solution, in a hanging dropletconfiguration. Complete details can be found in SI Text.
Data Collection and Macromolecular Refinement. X-ray diffraction data werecollected from high-pressure cryocooled citrine crystals at Cornell High EnergySynchrotron Source Station F2. Crystals were transferred by hand to thestation goniometer and cryogenic nitrogen cold stream. Typically, 120–180oscillation images were taken from each crystal, with an angular separation of1°, a 1° oscillation angle, and exposure times from 30 to 60 seconds. Full datacollection details are shown in Table S1. The diffraction data were indexedwith Rossmann and van Beek’s (36) Data Processing Suite algorithm, inte-grated with MOSFLM, scaled with Scala (37) and truncated with Truncate (38).Indexing quality indicators for each structure are shown in Table S2. Unit cellaxes for each model are shown in Table S3. A full description of data collectioncan be found in SI Text. Model refinement was standardized for all models.Molecular replacement was performed with Molrep (39), followed by rigidbody refinement, restrained refinement with an overall B-factor, and re-strained refinement with an isotropic B-factor by refmac5 (40). Alternatingcycles of solvent addition and restrained refinement were performed withARP/wARP (41) and refmac5. Finally, the structures were validated with Coot(42) and PROCHECK (43). Full details of the crystallographic refinement pro-cedure, quality indicators for all datasets, and the PDB accession codes can befound in SI Text and Tables S4–S5. Protein graphics were prepared with PyMOL(DeLano Scientific).
Low Temperature Spectroscopy. A fiber-fed, backscattering spectrophotom-eter, based upon designs by Hadfield and Hajdu (23) and Klink et al. (24),was constructed to measure the fluorescence spectra of high-pressurecryocooled citrine solution samples. Samples were contained in polycar-bonate capillaries (914.4 �m outer diameter, 304.8 �m inner diameter,plastic part number 8-000-1000, Drummond Scientific) and excited with a473-nm diode laser (catalog number LRS-473-TM-10, LaserGlow). Spectrawere recorded with a USB2000 spectrophotometer (Ocean Optics). Thesample temperature was controlled with a cryogenic nitrogen stream(Molecular Structure). Complete details are available in SI Text.
ACKNOWLEDGMENTS. We thank Dr. Cynthia Kinsland and the staff of theCornell Life Sciences Core Lab Center’s Protein Facility for assistance withthe modification and expression of citrine vectors and protein purification;Professors Roald Hoffmann and Jason D’Acchioli for invaluable assistancein quantum chemistry; the MacCHESS staff at the Cornell High EnergySynchrotron Source (CHESS) for assistance in data collection and reduction;Martin Novak for invaluable assistance with the construction of experi-ments; Yi-Fan Chen and Dr. Mark Tate for the construction of the internalsof the high-pressure cryocooling apparatus; Odin Wojcik and AccuFab, Inc.,for the construction of the high-pressure cryocooling safety enclosure;Professor Warren Zipfel for providing a sample of monomeric EGFP; Pro-fessor Roger Tsien for providing the citrine plasmid; Dr. Ismail Hafez andProfessors Lois Pollack, Brian Crane, and John Marohn for useful discus-sions; Professor Robert Campbell for assistance with crystallization ofcitrine; Elizabeth Landrum and Darren Southworth for assistance in datacollection; and Joan Lenz and Dr. Raymond Molloy for assistance withmolecular biology. This work is supported by Department of Energy Officeof Biological and Envrionmental Research Grant FG02-97ER62443 andNational Institutes of Health Protein Structure Initiative Grant GM074899.CHESS is supported by the National Institutes of Health via National ScienceFoundation Award DMR-0225180, and MacCHESS is supported by NationalInstitutes of Health Grant RR001646.
Barstow et al. PNAS � September 9, 2008 � vol. 105 � no. 36 � 13365
BIO
PHYS
ICS
1. Perutz MF, Fermi G, Luisi B, Shaanan B, Liddington RC (1987) Stereochemistry ofcooperative mechanisms in hemoglobin. Acc Chem Res 20:309–321.
2. Daopin S, Davies DR, Schlunegger MP, Grutter MG (1994) Comparison of two crystalstructures of TGF-�2: The accuracy of refined protein structures. Acta Crystallogr D50:85–92.
3. Suydam IT, Snow CD, Pande VS, Boxer SG (2006) Electric fields at the active site of anenzyme: Direct comparison of experiment with theory. Science 313(5784):200–204.
4. Frauenfelder H, et al. (1990) Proteins and pressure. J Phys Chem 94:1024–1037.5. Ueda I, Minami H, Matsuki H, Inoue T (1999) Does pressure antagonize anesthesia?
High-pressure stopped-flow study of firefly Luciferase and anatomy of initial flash.Biophys J 76:478–482.
6. Carey FG (1977) Effect of hydrostatic pressure on ligand binding to hemoglobin. J BiolChem 252:4102–4107.
7. Hay S, Sutcliffe MJ, Scrutton NS (2007) Promoting motions in enzyme catalysis probedby pressure studies of kinetic isotope effects. Proc Natl Acad Sci USA 104:507–512.
8. Urayama P, Phillips GN, Gruner SM (2002) Probing substates in sperm whale myoglobinusing high-pressure crystallography. Structure 10:51–60.
9. Kim CU, Kapfer R, Gruner SM (2005) High-pressure cooling of protein crystals withoutcryoprotectants. Acta Crystallogr D 61:881–890.
10. Kundrot CE, Richards FM (1986) Collection and processing of x-ray diffraction datafrom protein crystals at high pressure. J Appl Crystallogr 19:208–213.
11. Kundrot CE, Richards FM (1987) Crystal structure of hen egg-white lysozyme at ahydrostatic pressure of 1000 atmospheres. J Mol Biol 193:157–170.
12. Fourme R., et al. (2001) High-pressure protein crystallography (HPPX): Instrumenta-tion, methodology and results on lysozyme crystals. J Synchrotron Radiat 8(Pt 5):1149–1156.
13. Refaee M, Tezuka T, Akasaka K, Williamson MP (2003) Pressure-dependent changes inthe solution structure of hen egg-white lysozyme. J Mol Biol 327:857–865.
14. Williamson MP, Akasaka K, Refaee M (2003) The solution structure of bovine pancre-atic trypsin inhibitor at high pressure. Protein Sci 12:1971–1979.
15. Collins MD, Hummer G, Quillin ML, Matthews BW, Gruner SM (2005) Cooperative waterfilling of a nonpolar protein cavity observed by high-pressure crystallography andsimulation. Proc Natl Acad Sci USA 102:16668–16671.
16. Collins MD, Quillin ML, Hummer G, Matthews BW, Gruner SM (2007) Structural rigidityof a large cavity-containing protein revealed by high-pressure crystallography. J MolBiol 367:752–763.
17. Griesbeck O, Baird GS, Campbell RE, Zacharias DA, Tsien RY (2001) Reducing theenvironmental sensitivity of yellow fluorescent protein. J Biol Chem 276:29188–29194.
18. Wachter RM, Elsliger MA, Kallio K, Hanson GT, Remington SJ (1998) Structural basis ofspectral shifts in the yellow-emission variants of green fluorescent protein. Structure6:1267–1277.
19. Tsien RY (1998) The green fluorescent protein. Annu Rev Biochem 67: 509–544.20. Verkhusha V, et al. (2003) Effect of high pressure and reversed micelles on the
fluorescent proteins. Biochim Biophys Acta 1622:192–195.21. Kim CU, Chen Y, Tate MW, Gruner SM (2008) Pressure-induced high-density amorphous
ice in protein crystals. J Appl Crystallogr 41:1–7.
22. Frauenfelder H, et al. (1987) Thermal Expansion of a Protein. Biochemistry 26:254–261.23. Hadfield A, Hajdu J (1993) A fast and portable microspectrophotometer for protein
crystallography. J Appl Crystallogr 26:839–842.24. Klink BU, Goody RS, Scheidig AJ (2006) A newly designed microspectrofluorometer for
kinetic studies on protein crystals in combination with x-ray diffraction. Biophys J91:981–992.
25. Kim CU, Hao Q, Gruner SM (2007) High-pressure cryocooling for capillary samplecryoprotection and diffraction phasing at long wavelengths. Acta Crystallogr D63:653–659.
26. Cruickshank DWJ (1999) Remarks about protein structure precision. Acta Crystallogr D55:583–601.
27. Kabsch W (1976) Solution for best rotation to relate 2 sets of vectors. Acta CrystallogrA 32:922–923.
28. Heremans K, Smeller L (1998) Protein structure and dynamics at high pressure. BiochimBiophys Acta 1386:353–370.
29. Dietz H, Rief M (2004) Exploring the energy landscape of GFP by single-moleculemechanical experiments. Proc Natl Acad Sci USA 101:16192–16197.
30. Dietz H, Rief M (2006) Protein structure by mechanical triangulation. Proc Natl Acad SciUSA 103:1244–1247.
31. Dietz H, Berkemeier F, Bertz M, Rief M (2006) Anisotropic deformation response ofsingle protein molecules. Proc Natl Acad Sci USA 103:12724–12728.
32. Toniolo A, Granucci G, Martınez TJ (2003) Conical intersections in solution: A QM/MMstudy using floating occupation semiempirical configuration interaction wave func-tions. J Phys Chem A 107:3822–3830.
33. Sinicropi A, Andruniow T, Ferre N, Basosi R, Olivucci M (2005) Properties of the emittingstate of the green fluorescent protein resolved at the CASPT2//CASSCF/CHARMM level.J Am Chem Soc 127:11534–11535.
34. DePristo M, Bakker PIW, Blundell TL (2004) Heterogeneity and inaccuracy in proteinstructures solved by x-ray crystallography. Structure 12:831–838.
35. Liu R, Baase W, Matthews BW (2000) The introduction of strain and its effects on thestructure and stability of T4 lysozyme. J Mol Biol 295:127–145.
36. Rossmann MG, van Beek CG (1999) Data processing. Acta Crystallogr D 55:1631–1640.37. Kabsch W (1988) Evaluation of single-crystal x-ray diffraction data from a position-
sensitive detector. J Appl Crystallogr 21:916–924.38. French S, Wilson K (1978) On the treatment of negative intensity observations. Acta
Crystallogr A 34:517–525.39. Vagin A, Teplyakov A (1997) MOLREP: An automated program for molecular replace-
ment. J Appl Crystallogr 30:1022–1025.40. Murshudov G, Vagin A, Dodson E (1997) Refinement of macromolecular structures by
the maximum-likelihood method. Acta Crystallogr D 53:240–255.41. Perrakis A, Morris RJ, Lamzin VS (1999) Automated protein model building combined
with iterative structure refinement. Nat Struct Biol 6:458–463.42. Emsley P, Cowtan K (2004) Coot: Model-building tools for molecular graphics. Acta
Crystallogr D 60:2126–2132.43. Laskowski R, MacArthur M, Moss D, Thornton JM (1993) PROCHECK: A program to
check the stereochemical quality of protein structures. J Appl Crystallogr 26:283–291.
13366 � www.pnas.org�cgi�doi�10.1073�pnas.0802252105 Barstow et al.
Supporting InformationBarstow et al. 10.1073/pnas.0802252105SI TextExpression and Crystallization. The gene for weakly dimeric citrine(1) (where residue 206 is an alanine) was kindly provided by R.Y. Tsien (University of California at San Diego) in a pRSETBplasmid (Invitrogen). To achieve higher expression and affinitytag digestion efficiency, the citrine plasmid was copied from thepRSETB plasmid by PCR, simultaneously replacing the EKMax(Invitrogen) protease cut site linking the protein and its poly-histidine affinity tag with a Tobacco Etch Virus (TEV) proteasecut site. The new construct was then ligated into a pET28 vector(Novagen). The procedure resulted in a protein with an addi-tional glycine residue at the N terminus when compared with theprotein originally studied by Griesbeck et al. (1).
The plasmid was used to transform Escherichia coli strainBL21 (Invitrogen), grown for 24 h in a LB broth with kanamycinat 37°C, and induced with 100 mM IPTG. Protein overexpressionwas allowed to proceed for 6 h. The cell cultures were then spunat 14,000 � g for �30 min to pellet the cells and were resus-pended in an alkaline lysis buffer. The cells were then lysed ina French Press style cell disruptor. The lysate was then spun at20,000 � g at 4°C for �30 min to pellet the cellular debris.Uncoiled genomic DNA was precipitated from the supernatantby slowing stirring in polyethylenimine to a final concentrationof 0.5% vol/vol.
The supernatant was then loaded onto a Ni-NTA affinitycolumn (HisTrap HP, catalog number 17-5248-01, GE Health-care) and washed with an increasing concentration of imidazolesolution. The citrine was then eluted with a high concentrationimidazole solution. The affinity tags were digested by TEVprotease overnight at 4°C in a TEV reaction buffer. Undigestedprotein and cleaved his-tags were removed by washing theprotein through a Ni-NTA column. The flow through, thedigested citrine, was collected and finally purified by gel filtrationchromatography. The final gel filtration step appears to beredundant, and its absence appears to have no impact on thecrystallizability of the protein.
After the final purification step, the protein was concentratedto 20 mg/ml with a Pall centrifugal concentrator (catalog numberOD010C37, Pall Separation Systems), and its buffer was simul-taneously exchanged for 50 mM HEPES at pH 7.5. The proteinconcentration was checked by measuring the absorption of theprotein at 514 nm with a Nanodrop ND-1000 absorption spec-trophotometer. Because citrine does not cold denature, largealiquots of the protein may be slow-frozen and thawed. Fifty-microliter aliquots of citrine solution were frozen at �70°C forlong-term storage. Citrine appears to keep quite well at 4°C forat least 2 years.
The protein was crystallized by using a crystallization screenaround the conditions reported by Griesbeck et al. (1) (50 mMsodium acetate, 50 mM ammonium acetate, and 7% PEG 3400;pH 5.0 and temperature at 4°C) using hanging drop crystalliza-tion. Hanging drops were initially a mixture of 1 �l of wellsolution and 1 �l of 20 mg/ml citrine in 50 mM HEPES at pH 7.5.The droplets were mixed thoroughly by pipetting. A singlespontaneously nucleated crystal was found by using this screenwith 50 mM sodium acetate (for later experiments, we usedcatalog number 71183-250G, lot number 71183-250G, Fluka), 50mM ammonium acetate (for later experiments, we used catalognumber 431311-50G, lot number 11019JC, Sigma–Aldrich), and9% PEG 3350 (catalog number HR2-591, lot numbers 259134and 259147, Hampton Research), at pH 4.5. We believe that thechoice of sodium and ammonium acetate does not affect the
crystallization of citrine, although the choice of PEG may,explaining the difference in crystallization experience in Gries-beck et al. (1). To avoid dilution of the hanging droplets byevaporation from the crystallization wells, it was found that thecrystallization trays must be packed in styrofoam containers,before storage, at 4°C. The first crystal appeared after 7 days.
Further crystals were grown by seeding of the single sponta-neously nucleated crystal, using a 5% PEG 3350, 50 mM sodiumacetate, 50 mM ammonium acetate, pH 5.0 precipitant solution,and a Seed Bead (catalog number HR2-320, Hampton Re-search). No more than 12 crystal wells were set up at a singletime. Sixty microliters of precipitant and 60 �l of 10 mg/ml citrinein 50 mM HEPES (pH 7.5) were mixed in a Seed Bead, and then10 �l of this mixture was dispensed onto the cap of the SeedBead. A crystal of citrine was transferred to the cap, and the SeedBead was then centrifuged in a centrifuge precooled to 4°C for10 seconds to remove the droplet from the cap. The Seed Beadwas then vortexed for approximately one-quarter of a second,making sure that the bead moved around inside the Seed Bead.The Seed Bead was then recentrifuged to pellet the solution andimmediately transferred to ice. The seeding solution was thendispensed onto cover-slides in 10-�l droplets, and each slidesealed onto a well before proceeding to the next well. The SeedBead was chilled on ice between dispensations, and the wholeprocedure lasted no longer than 5 min. The sealed wells wereimmediately transferred to a styrofoam box and refrigerated at4°C. Crystals appeared overnight, and grew to �300 � 50 � 50�m within a few days (Fig. S1).
At least three forms of citrine crystals will grow under theseconditions: bricks with the most equal dimensions, plates withtwo long dimensions and a very thin third dimension, and rodswith one long dimension and two very short dimensions. Theplate form of the citrine crystal does not appear to diffract welland has imperfect symmetry, only indexing well in a P2 or P1space-group. The rod crystals have not been tested.
X-Ray Diffraction. To investigate the structural origin of citrine’sf luorescence shift, a high-pressure cryocooling technique de-scribed by Kim et al. (2) was used to prepare citrine crystals atcooling pressures ranging from 50 to 500 MPa. In this technique,a protein crystal is pressurized to a target pressure with heliumgas and is then cooled to liquid nitrogen temperature (77 K),locking in any structural changes induced by the elevatedpressure (3). The pressure may then be released, but the proteinmolecules that compose the crystal will remain in their pressur-ized state as long as the crystal’s temperature remains well belowthe glass transition temperature of the protein-solvent mixture(4, 5). A consequence of this preparation method is that eachstructure at each pressure is from a different crystal, and thateach structure is derived at cryogenic temperatures.
X-ray diffraction data were collected at Cornell High EnergySynchrotron Source (CHESS) macromolecular crystallographystation F2 at an x-ray wavelength of 0.9795 Å (the selenium edge)and with a 0.1-mm x-ray collimator, by using a Quantum 210CCD detector (Area Detector Systems). For datasets taken inApril and November 2007, the detector used an upgradedcomputer for image processing.
Crystals were transferred by hand from a liquid nitrogenstorage dewar to a cryogenic nitrogen stream at 100 K (OxfordCryosystems). Care should be taken when performing thetransfer as even slight warming of the sample will allow thepressure-induced deformations in the sample to relax and re-
Barstow et al. www.pnas.org/cgi/content/short/0802252105 1 of 11
lease the helium gas trapped in the crystal. Typically, 120–180oscillation images were taken from each crystal, with an angularseparation of 1°, a 1° oscillation angle, and exposure timesranging from 30 to 60 seconds. Full data collection details areshown in Table S1.
The diffraction data were indexed with Rossmann and vanBeek’s (6) Data Processing Suite algorithm, integrated withMOSFLM (7), scaled with Scala (8) and truncated with Truncate(9). Indexing quality indicators for each structure are shown inTable S2. Unit cell axes for each model are shown in Table S3.
Crystallographic Refinement. The crystallographic refinement pro-cess was standardized for all datasets by performing manyrefinement trials in which the refinement parameters were variedto find a globally good procedure that minimized the RFree factorfor the maximum number of structures. This large search wasconducted by using the Feynman parallel computer cluster atCHESS.
The procedure that was found to be most satisfactory wassimilar to that suggested by Kleywegt and Jones (10). Eachdataset was truncated at a resolution where the average signal-to-noise calculated by Scala (�I�/���) was 3.0, minimizing theRFree factor and minimizing the Log Likelihood Gain (LLG) (11)of the resulting model. For each structure, molecular replace-ment was performed by Molrep (12) in the space group P212121,by using the 1HUY structure of Griesbeck et al. (1), stripped ofsolvent and with residue 80 mutated from an arginine to aglutamine as a search model.
Molecular replacement was followed by 10 cycles of rigid bodyrefinement using refmac5 (11). Next, 10 cycles of restrainedrefinement with overall temperature factor refinement wereperformed by refmac5, followed by 10 cycles of restrainedrefinement with isotropic B-factor refinement for each atom. Forall steps using refmac5, the maximum likelihood residual wasused (11).
Finally, five cycles of solvent addition, followed by five cyclesof restrained refinement with isotropic B-factor refinement,were performed using the ARP/wARP program by Perrakis et al.(13, 14) and refmac5, until the RFree factor (15) and LLGfunction (11) were simultaneously minimized. The number ofrestrained refinement cycles in the final solvent addition-restrained refinement cycle was chosen to minimize RFree andLLG. Finally, the structures were validated with Coot (16) andPROCHECK (17). The resolutions of the datasets ranged from2.46 to 1.5 Å. Refinement quality indicators for each structureare shown in Table S4. PDB accession codes for the structuresare shown in Table S5.
Room Temperature Spectroscopy. Room temperature, high-pressure spectra of citrine were measured by using an ISShigh-pressure fluorescence cell and an ISS Chronos spectropho-tometer. Temperature control of the sample was provided bywater cooling the high-pressure cell using a Neslab (ThermoScientific) water bath set to 25°C, with feedback provided by athermocouple directly attached to the high-pressure cell. One-half-millimeter slits with a 4-nm bandwidth were used.
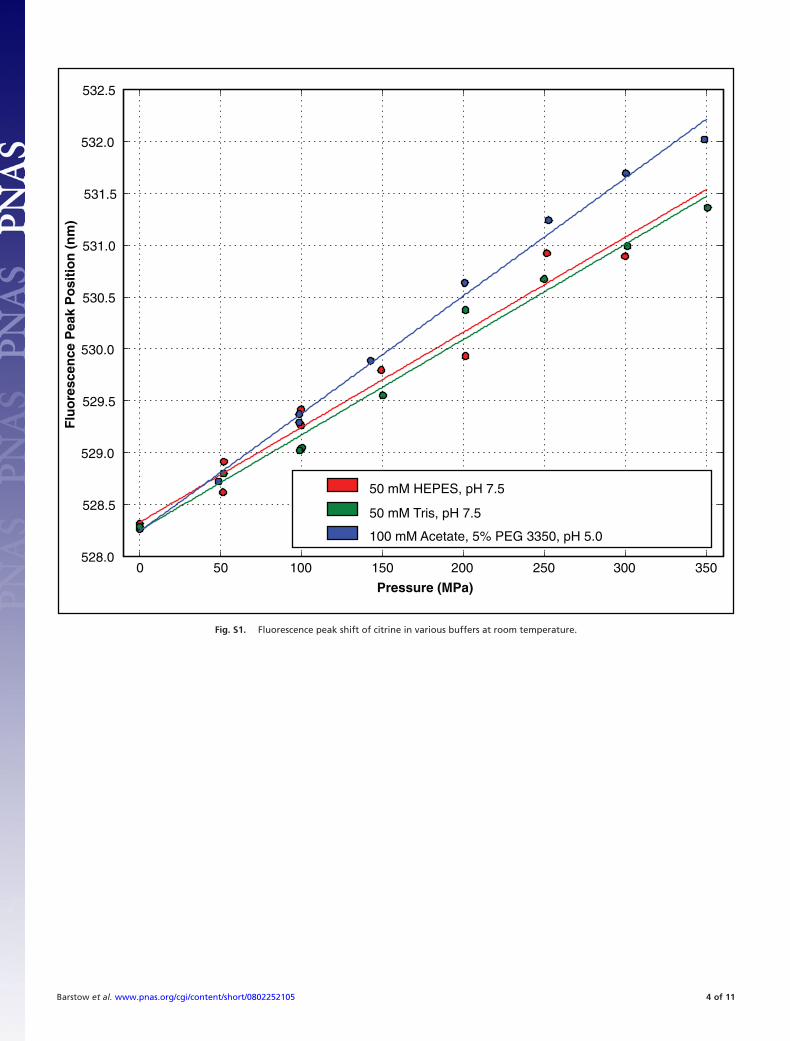
Solutions of citrine were prepared at a concentration of 0.0053mg/ml, giving an absorbance of 0.1 over the 0.7-cm path lengthof the fluorescence cuvette. At this concentration, citrine ismonomeric. Citrine was prepared in three buffers: 50 mMHEPES at pH 7.5; 50 mM Tris at pH 7.5 [a buffer known to beinsensitive to high pressure (18, 19)]; and a precipitant solution,50 mM sodium acetate, 50 mM ammonium acetate, and 5%wt/vol PEG 3350 at pH 5.0. The fluorescence spectrum of citrinein each of these solutions was measured over the pressure range0.1–350 MPa. In each case, the fluorescence shift was linear withpressure. In both pH 7.5 buffers, the fluorescence shift wasindistinguishable, with the peak of fluorescence shifting from
528.3 nm at ambient pressure by 0.912 nm per 100 MPa (per 1000atmospheres). At pH 5.0, the fluorescence peak begins at 528.3nm at ambient pressure, but shifts at a similar but slightly higherrate: 1.14 nm per 100 MPa. A plot of this behavior is shown inFig. S2.
Low Temperature Spectroscopy. As the thermal contraction of aprotein molecule between room temperature and 100 K iscomparable with the changes because of pressurization (20), itwas important to measure the fluorescence spectra of pressure-cooled samples to establish a direct link between structure of themolecule and its f luorescence properties.
We constructed a low-temperature fluorescence and absorp-tion spectroscopy apparatus, drawing upon the designs of Had-field (21) and Klink et al. (22). Like Hadfield’s apparatus, thedevice has the ability to measure the absorption of smallcrystalline samples and, like that of Klink et al. (22), featuresbackscattering fluorescence, allowing easy measurement of thefluorescence spectrum of a sample without the need to align thecollection and excitation optics, because they are both the samecombined in a single optic.
Fluorescence excitation was provided by a high stability473-nm diode laser (catalog number LRS-473-TM-10, Laser-Glow). The power output of the device was limited upon ourrequest to 5 mW to ensure classification as a class IIIa laser,coupled by a bifurcated fiber optic bundle (Romack) to a longworking length, high numerical aperture reflecting objective(catalog number NT58-417, Edmund Optics), and used for bothexcitation and collection optics in the fluorescence backscatter-ing mode. The laser beam spectral width was narrowed by a trainof band-pass optical interference filters; one high transmission473-nm filter (catalog number LD01-473/10-12.5, Semrock), andtwo lower transmission filters at 470 (catalog number NT43-062,Edmund Optics) and 467 nm (catalog number NT43-061, Ed-mund Optics).
The backscattered fluorescence light was analyzed with anOcean Optics USB2000 spectrophotometer with a 200-�m slitand a #2 grating. The spectrophotometer was calibrated beforeuse by fiber connection to a blackbody calibration source (DH-2000 Calibration lamp*, Ocean Optics).
Because of the high optical density and overlapping absorptionand fluorescence spectra of citrine crystals, we were unable torepeatedly measure the position of the peak of the fluorescencespectra of pressure-cooled citrine crystals because of small sizevariations in the crystals. Thus, we were forced to seek asubstitute: pressure cryocooled solutions in capillaries.
Citrine stock solution (20 mg/ml citrine in 50 mM HEPES, pH7.5) was slowly dialyzed into crystallization precipitant solution(5% PEG 3350, 50 mM sodium acetate, 50 mM ammoniumacetate, pH 5.0) and diluted to 1 mg/ml. The solution was loadedinto optically clear polycarbonate capillaries (plastic part num-ber 8-000-1000, length 5 inches (127 mm), inner diameter 0.012inches (304.8 �m), outer diameter 0.036 inches (914.4 �m),Drummond Scientific), cut to �18 mm in length so as to matchthe length of a mounted cryoloop, and frozen in the high-pressure cryocooling apparatus (23). The frozen capillaries weretransferred inside a liquid nitrogen dewar to the crystal spec-trophotometer and transferred by hand to the station’s goniom-eter mount.
The sample was aligned to the excitation/collection optics bytranslations of the crystal station goniometer, viewing with a40� telescope with a working distance of 1 inch (2.54 cm), using
*Ocean Optics sells a blackbody lamp and blackbody calibration source both called theDH-2000. We used the calibration version that has a carefully calibrated spectrum butmuch lower intensity.
Barstow et al. www.pnas.org/cgi/content/short/0802252105 2 of 11

a grid reticule (catalog number NT39,446, Edmund Optics) as areference mark.
In addition to measuring the peak of high-pressure cryocooledcitrine solutions as a function of temperature as described in themain text, the fluorescence peak of pressure cryocooled citrinecrystals was also measured, and it was found that the peak of thecrystal would remain approximately constant, as the tempera-ture of the cold stream was raised, until it passed a critical
transition temperature of the crystal. The peak would thenrapidly shift to the yellow, suggesting that the citrine moleculeshad relaxed to their ambient pressure state, as was observed inhigh-pressure cryocooled solutions. Upon recooling, the fluo-rescence peak remained in a yellow-shifted state. A plot of thisbehavior for a citrine crystal cryocooled at 175 MPa is shown inFig. S3.
1. Griesbeck O, Baird GS, Campbell RE, Zacharias DA, Tsien RY (2001) Reducing theenvironmental sensitivity of yellow fluorescent protein. J Biol Chem 276:29188 –29194.
2. Kim CU, Kapfer R, Gruner SM (2005) High-pressure cooling of protein crystals withoutcryoprotectants. Acta Crystallogr D 61:881–890.
3. Urayama P, Phillips GN, Gruner SM (2002) Probing substates in sperm whale myoglobinusing high-pressure crystallography. Structure 10:51–60.
4. Frauenfelder H, et al. (1990) Proteins and pressure. J Phys Chem 94:1024–1037.5. Kim CU, Chen Y, Tate MW, Gruner SM (2008) Pressure-induced high-density amorphous
ice in protein crystals. J Appl Crystallogr 41:1–7.6. Rossmann MG, van Beek CG (1999) Data processing. Acta Crystallogr D 55:1631–1640.7. Leslie AGW (1992) Joint CCP4 � ESF-EAMCB Newsletter on Protein Crystallography 26.8. Kabsch W (1988) Evaluation of single-crystal x-ray diffraction data from a position-
sensitive detector. J Appl Crystallogr 21:916–924.9. French S, Wilson K (1978) On the treatment of negative intensity observations. Acta
Crystallogr A 34:517–525.10. Kleywegt GJ, Jones TA (1995) Braille for pugilists in Making the Most of Your Model,
eds Hunter WN, Thornton JM, Bailey S (SERC Daresbury Laboratory, Warrington, UK),pp 11–24.
11. Murshudov G, Vagin A, Dodson E (1997) Refinement of macromolecular structures bythe maximum-likelihood method. Acta Crystallogr D 53:240–255.
12. Vagin A, Teplyakov A (1997) MOLREP: An automated program for molecular replace-ment. J Appl Crystallogr 30:1022–1025.
13. Perrakis A, Morris RJ, Lamzin VS (1999) Automated protein model building combinedwith iterative structure refinement. Nat Struct Biol 6:458–463.
14. Morris RJ, Perrakis A, Lamzin VS (2003) ARP/wARP and automatic interpretation ofprotein electron density maps. Methods Enzymol 374:229–244.
15. Brunger AT (1992) Assessment of phase accuracy by cross validation: The free R value.Methods and applications. Nature 355:472–475.
16. Emsley P, Cowtan K (2004) Coot: Model-building tools for molecular graphics. ActaCrystallogr D60:2126–2132.
17. Laskowski R, MacArthur M, Moss D, Thornton JM (1993) PROCHECK: A program tocheck the stereochemical quality of protein structures. J Appl Crystallogr 26:283–291.
18. Zipp A, Kauzmann W (1973) Pressure denaturation of metmyoglobin. Biochemistry12:4217–4228.
19. Neuman RC, Kauzmann W, Zipp A (1973) Pressure dependence of weak acid ionizationin aqueous buffers. J Phys Chem 77:2687–2691.
20. Frauenfelder H, et al. (1987) Thermal Expansion of a protein. Biochemistry 26:254–261.21. Hadfield A, Hajdu J (1993) A fast and portable microspectrophotometer for protein
crystallography. J Appl Crystallogr 26:839–842.22. Klink BU, Goody RS, Scheidig AJ (2006) A newly designed microspectrofluorometer for
kinetic studies on protein crystals in combination with x-ray diffraction. Biophys J91:981–992.
23. Kim CU, Hao Q, Gruner SM (2007) High-pressure cryocooling for capillary samplecryoprotection and diffraction phasing at long wavelengths. Acta Crystallogr D63:653–659.
Barstow et al. www.pnas.org/cgi/content/short/0802252105 3 of 11
0 50 100 150 200 250 300 350
Pressure (MPa)
528.0
528.5
529.0
529.5
530.0
530.5
531.0
531.5
532.0
532.5
Flu
ore
scen
ce P
eak
Po
siti
on
(n
m)
50 mM HEPES, pH 7.5
50 mM Tris, pH 7.5
100 mM Acetate, 5% PEG 3350, pH 5.0
Fig. S1. Fluorescence peak shift of citrine in various buffers at room temperature.
Barstow et al. www.pnas.org/cgi/content/short/0802252105 4 of 11

− 200 − 150 − 100 − 50 0
526
528
530
532
534
Start; in pressure cryo-cooled state.
Relaxation as temperature rises above glass transition.
Finish; in relaxed cold state.
Temperature (˚C)
Flu
ore
scen
ce P
eak
(nm
)
Fig. S2. Fluorescence peak of high pressure cooled citrine crystal as it is warmed and then recooled.
Barstow et al. www.pnas.org/cgi/content/short/0802252105 5 of 11

Fig. S3. Citrine crystals used in x-ray diffraction experiments.
Barstow et al. www.pnas.org/cgi/content/short/0802252105 6 of 11

Table S1. Crystallographic data collection information
Crystal Pressure, MPa Run Distance, mm Exposure time, s Frames Mosaicity, °
CitrineFF1 0.1 1 200.67 90 30 0.496CitrineFF2 0.1 1 201.17 90 30 0.74CitrineOFF2 0.1 1 200.42 25 120 0.538Citrine0001�10 0.1 1 170.43 30 190 0.402Citrine0500�1 50 1 199.35 60 120 0.527Citrine0500�2 50 1 169.37 60 120 0.668Citrine0500�3 50 1 194.7 30 180 0.546Citrine0750�2 75 1 169.49 60 120 0.593Citrine0750�4 75 1 194.71 60 120 1.038Citrine1000�1 100 1 169.35 60 120 0.61Citrine1000�2 100 1 169.3 60 120 0.551Citrine1000�3 100 1 169.28 60 180 0.872Citrine1000�5 100 1 194.89 30 180 0.912Citrine1000�7 100 1 194.83 30 180 0.365Citrine1000�8 100 1 195.35 30 105 0.524Citrine1250�1 125 1 169.57 60 120 0.402Citrine1250�2 125 1 169.09 60 120 0.912Citrine1250�3 125 1 169.4 60 120 0.719Citrine1250�4 125 1 179.89 25 200 0.672Citrine1500�1 150 1 169.37 60 120 0.598Citrine1500�2 150 1 169.3 60 120 0.843CitrineOPF2 192 1 200.82 60 10 0.078
192 2 160.84 60 7 0.113192 3 140.77 60 120 0.159192 4 140.71 60 120 0.125
CitrineOPF3 192 1 200.62 60 90 0.162192 2 199.66 60 90 0.086
Citrine1960�2 196 1 179.34 30 120 0.685Citrine2000�2 200 1 195.05 30 120 0.566
200 2 194.91 30 120 0.481Citrine2000�3 200 1 194.95 60 151 0.44
200 2 194.89 30 120 0.412Citrine2500�1 250 1 197.71 20 120 0.291Citrine4000�1 400 1 177.49 45 180 0.362Citrine4000�2 400 1 177.67 30 180 0.904Citrine4000�3 400 1 177.54 30 180 0.632Citrine5000�3 500 1 167.75 30 180 0.554
All datasets were taken at Cornell High Energy Synchrotron Source macromolecular crystallography station F2 with a Quantum 210 CCD detector (AreaDetector Systems). All datasets were taken by using a 0.1-mm X-ray collimator with an X-ray wavelength of 0.9795. Datasets Citrine0001�10 and Citrine2500�1to Citrine5000�3 were taken after an upgrade to this detector. All datasets were taken with an oscillation angle of 1° and a step of 1°, except CitrineFF1 andCitrineFF2, which were taken with a 3° oscillation angle and step.
Barstow et al. www.pnas.org/cgi/content/short/0802252105 7 of 11
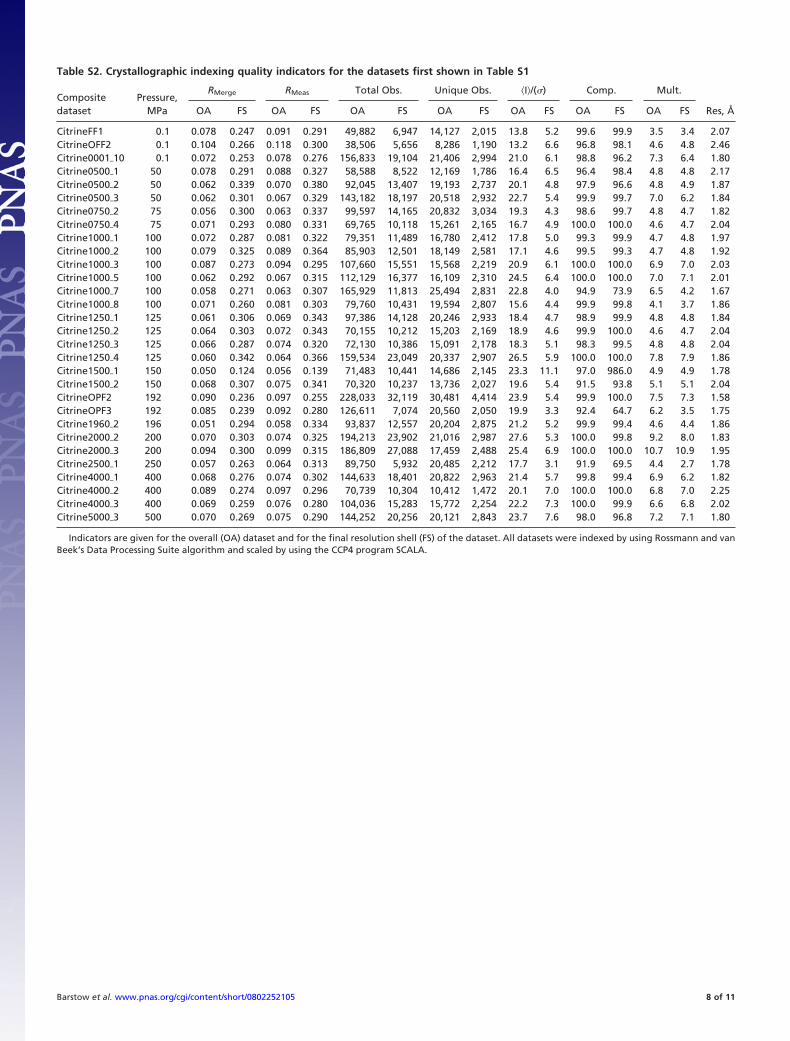
Table S2. Crystallographic indexing quality indicators for the datasets first shown in Table S1
Compositedataset
Pressure,MPa
RMerge RMeas Total Obs. Unique Obs. �I�/(�) Comp. Mult.
Res, ÅOA FS OA FS OA FS OA FS OA FS OA FS OA FS
CitrineFF1 0.1 0.078 0.247 0.091 0.291 49,882 6,947 14,127 2,015 13.8 5.2 99.6 99.9 3.5 3.4 2.07CitrineOFF2 0.1 0.104 0.266 0.118 0.300 38,506 5,656 8,286 1,190 13.2 6.6 96.8 98.1 4.6 4.8 2.46Citrine0001�10 0.1 0.072 0.253 0.078 0.276 156,833 19,104 21,406 2,994 21.0 6.1 98.8 96.2 7.3 6.4 1.80Citrine0500�1 50 0.078 0.291 0.088 0.327 58,588 8,522 12,169 1,786 16.4 6.5 96.4 98.4 4.8 4.8 2.17Citrine0500�2 50 0.062 0.339 0.070 0.380 92,045 13,407 19,193 2,737 20.1 4.8 97.9 96.6 4.8 4.9 1.87Citrine0500�3 50 0.062 0.301 0.067 0.329 143,182 18,197 20,518 2,932 22.7 5.4 99.9 99.7 7.0 6.2 1.84Citrine0750�2 75 0.056 0.300 0.063 0.337 99,597 14,165 20,832 3,034 19.3 4.3 98.6 99.7 4.8 4.7 1.82Citrine0750�4 75 0.071 0.293 0.080 0.331 69,765 10,118 15,261 2,165 16.7 4.9 100.0 100.0 4.6 4.7 2.04Citrine1000�1 100 0.072 0.287 0.081 0.322 79,351 11,489 16,780 2,412 17.8 5.0 99.3 99.9 4.7 4.8 1.97Citrine1000�2 100 0.079 0.325 0.089 0.364 85,903 12,501 18,149 2,581 17.1 4.6 99.5 99.3 4.7 4.8 1.92Citrine1000�3 100 0.087 0.273 0.094 0.295 107,660 15,551 15,568 2,219 20.9 6.1 100.0 100.0 6.9 7.0 2.03Citrine1000�5 100 0.062 0.292 0.067 0.315 112,129 16,377 16,109 2,310 24.5 6.4 100.0 100.0 7.0 7.1 2.01Citrine1000�7 100 0.058 0.271 0.063 0.307 165,929 11,813 25,494 2,831 22.8 4.0 94.9 73.9 6.5 4.2 1.67Citrine1000�8 100 0.071 0.260 0.081 0.303 79,760 10,431 19,594 2,807 15.6 4.4 99.9 99.8 4.1 3.7 1.86Citrine1250�1 125 0.061 0.306 0.069 0.343 97,386 14,128 20,246 2,933 18.4 4.7 98.9 99.9 4.8 4.8 1.84Citrine1250�2 125 0.064 0.303 0.072 0.343 70,155 10,212 15,203 2,169 18.9 4.6 99.9 100.0 4.6 4.7 2.04Citrine1250�3 125 0.066 0.287 0.074 0.320 72,130 10,386 15,091 2,178 18.3 5.1 98.3 99.5 4.8 4.8 2.04Citrine1250�4 125 0.060 0.342 0.064 0.366 159,534 23,049 20,337 2,907 26.5 5.9 100.0 100.0 7.8 7.9 1.86Citrine1500�1 150 0.050 0.124 0.056 0.139 71,483 10,441 14,686 2,145 23.3 11.1 97.0 986.0 4.9 4.9 1.78Citrine1500�2 150 0.068 0.307 0.075 0.341 70,320 10,237 13,736 2,027 19.6 5.4 91.5 93.8 5.1 5.1 2.04CitrineOPF2 192 0.090 0.236 0.097 0.255 228,033 32,119 30,481 4,414 23.9 5.4 99.9 100.0 7.5 7.3 1.58CitrineOPF3 192 0.085 0.239 0.092 0.280 126,611 7,074 20,560 2,050 19.9 3.3 92.4 64.7 6.2 3.5 1.75Citrine1960�2 196 0.051 0.294 0.058 0.334 93,837 12,557 20,204 2,875 21.2 5.2 99.9 99.4 4.6 4.4 1.86Citrine2000�2 200 0.070 0.303 0.074 0.325 194,213 23,902 21,016 2,987 27.6 5.3 100.0 99.8 9.2 8.0 1.83Citrine2000�3 200 0.094 0.300 0.099 0.315 186,809 27,088 17,459 2,488 25.4 6.9 100.0 100.0 10.7 10.9 1.95Citrine2500�1 250 0.057 0.263 0.064 0.313 89,750 5,932 20,485 2,212 17.7 3.1 91.9 69.5 4.4 2.7 1.78Citrine4000�1 400 0.068 0.276 0.074 0.302 144,633 18,401 20,822 2,963 21.4 5.7 99.8 99.4 6.9 6.2 1.82Citrine4000�2 400 0.089 0.274 0.097 0.296 70,739 10,304 10,412 1,472 20.1 7.0 100.0 100.0 6.8 7.0 2.25Citrine4000�3 400 0.069 0.259 0.076 0.280 104,036 15,283 15,772 2,254 22.2 7.3 100.0 99.9 6.6 6.8 2.02Citrine5000�3 500 0.070 0.269 0.075 0.290 144,252 20,256 20,121 2,843 23.7 7.6 98.0 96.8 7.2 7.1 1.80
Indicators are given for the overall (OA) dataset and for the final resolution shell (FS) of the dataset. All datasets were indexed by using Rossmann and vanBeek’s Data Processing Suite algorithm and scaled by using the CCP4 program SCALA.
Barstow et al. www.pnas.org/cgi/content/short/0802252105 8 of 11

Table S3. Unit cell axes for all citrine models
Model name a, Å b, Å c, Å
citrine0001�2 51.385 62.624 69.994citrine0001�18 51.376 62.375 70.639citrine0500�9 51.383 63.056 70.804citrine0750�16 51.336 62.886 71.1citrine1000�1 51.408 62.99 71.315citrine1000�2 51.362 62.928 71.297citrine1000�3 51.413 63.122 71.225citrine1000�5 51.475 62.935 71.664citrine1000�7 51.401 61.976 70.561citrine1000�8 51.45 62.272 70.366citrine1250�1 51.36 62.8 71.0citrine1250�2 51.193 62.977 71.128citrine1250�3 51.44 63.356 71.575citrine1250�4 51.462 63.34 71.672citrine1500�1 51.459 62.784 71.163citrine1500�2 51.343 62.982 71.084citrine1920�2 51.447 63.223 66.653citrine1920�3 51.271 62.77 66.11citrine1960�2 51.549 63.127 71.464citrine2000�2 51.428 62.944 71.205citrine2000�3 51.418 63.207 70.904citrine2500�1 51.363 62.74 70.185citrine4000�1 51.366 69.993 62.499citrine4000�2 51.126 60.56 67.209citrine4000�3 51.531 62.653 71.471citrine5000�3 51.621 61.06 68.132
All models were indexed in space group P212121 with unit cell angles � � � 90 Å.
Barstow et al. www.pnas.org/cgi/content/short/0802252105 9 of 11
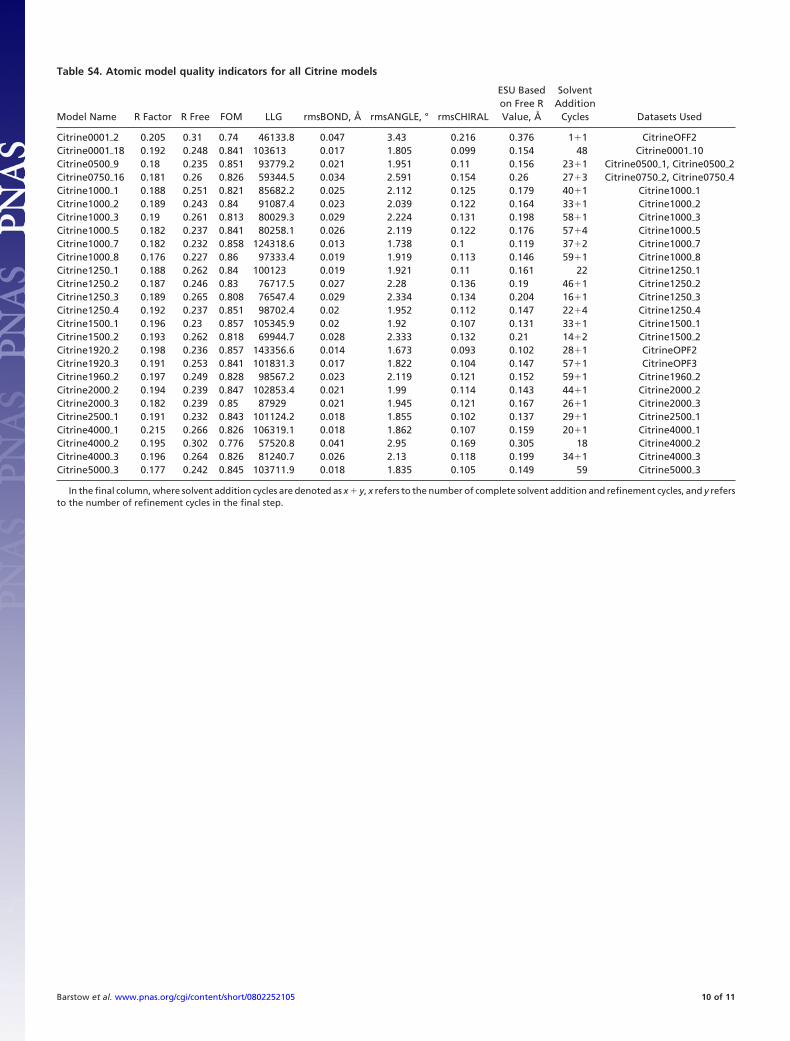
Table S4. Atomic model quality indicators for all Citrine models
Model Name R Factor R Free FOM LLG rmsBOND, Å rmsANGLE, ° rmsCHIRAL
ESU Basedon Free RValue, Å
SolventAddition
Cycles Datasets Used
Citrine0001�2 0.205 0.31 0.74 46133.8 0.047 3.43 0.216 0.376 1�1 CitrineOFF2Citrine0001�18 0.192 0.248 0.841 103613 0.017 1.805 0.099 0.154 48 Citrine0001�10Citrine0500�9 0.18 0.235 0.851 93779.2 0.021 1.951 0.11 0.156 23�1 Citrine0500�1, Citrine0500�2Citrine0750�16 0.181 0.26 0.826 59344.5 0.034 2.591 0.154 0.26 27�3 Citrine0750�2, Citrine0750�4Citrine1000�1 0.188 0.251 0.821 85682.2 0.025 2.112 0.125 0.179 40�1 Citrine1000�1Citrine1000�2 0.189 0.243 0.84 91087.4 0.023 2.039 0.122 0.164 33�1 Citrine1000�2Citrine1000�3 0.19 0.261 0.813 80029.3 0.029 2.224 0.131 0.198 58�1 Citrine1000�3Citrine1000�5 0.182 0.237 0.841 80258.1 0.026 2.119 0.122 0.176 57�4 Citrine1000�5Citrine1000�7 0.182 0.232 0.858 124318.6 0.013 1.738 0.1 0.119 37�2 Citrine1000�7Citrine1000�8 0.176 0.227 0.86 97333.4 0.019 1.919 0.113 0.146 59�1 Citrine1000�8Citrine1250�1 0.188 0.262 0.84 100123 0.019 1.921 0.11 0.161 22 Citrine1250�1Citrine1250�2 0.187 0.246 0.83 76717.5 0.027 2.28 0.136 0.19 46�1 Citrine1250�2Citrine1250�3 0.189 0.265 0.808 76547.4 0.029 2.334 0.134 0.204 16�1 Citrine1250�3Citrine1250�4 0.192 0.237 0.851 98702.4 0.02 1.952 0.112 0.147 22�4 Citrine1250�4Citrine1500�1 0.196 0.23 0.857 105345.9 0.02 1.92 0.107 0.131 33�1 Citrine1500�1Citrine1500�2 0.193 0.262 0.818 69944.7 0.028 2.333 0.132 0.21 14�2 Citrine1500�2Citrine1920�2 0.198 0.236 0.857 143356.6 0.014 1.673 0.093 0.102 28�1 CitrineOPF2Citrine1920�3 0.191 0.253 0.841 101831.3 0.017 1.822 0.104 0.147 57�1 CitrineOPF3Citrine1960�2 0.197 0.249 0.828 98567.2 0.023 2.119 0.121 0.152 59�1 Citrine1960�2Citrine2000�2 0.194 0.239 0.847 102853.4 0.021 1.99 0.114 0.143 44�1 Citrine2000�2Citrine2000�3 0.182 0.239 0.85 87929 0.021 1.945 0.121 0.167 26�1 Citrine2000�3Citrine2500�1 0.191 0.232 0.843 101124.2 0.018 1.855 0.102 0.137 29�1 Citrine2500�1Citrine4000�1 0.215 0.266 0.826 106319.1 0.018 1.862 0.107 0.159 20�1 Citrine4000�1Citrine4000�2 0.195 0.302 0.776 57520.8 0.041 2.95 0.169 0.305 18 Citrine4000�2Citrine4000�3 0.196 0.264 0.826 81240.7 0.026 2.13 0.118 0.199 34�1 Citrine4000�3Citrine5000�3 0.177 0.242 0.845 103711.9 0.018 1.835 0.105 0.149 59 Citrine5000�3
In the final column, where solvent addition cycles are denoted as x � y, x refers to the number of complete solvent addition and refinement cycles, and y refersto the number of refinement cycles in the final step.
Barstow et al. www.pnas.org/cgi/content/short/0802252105 10 of 11
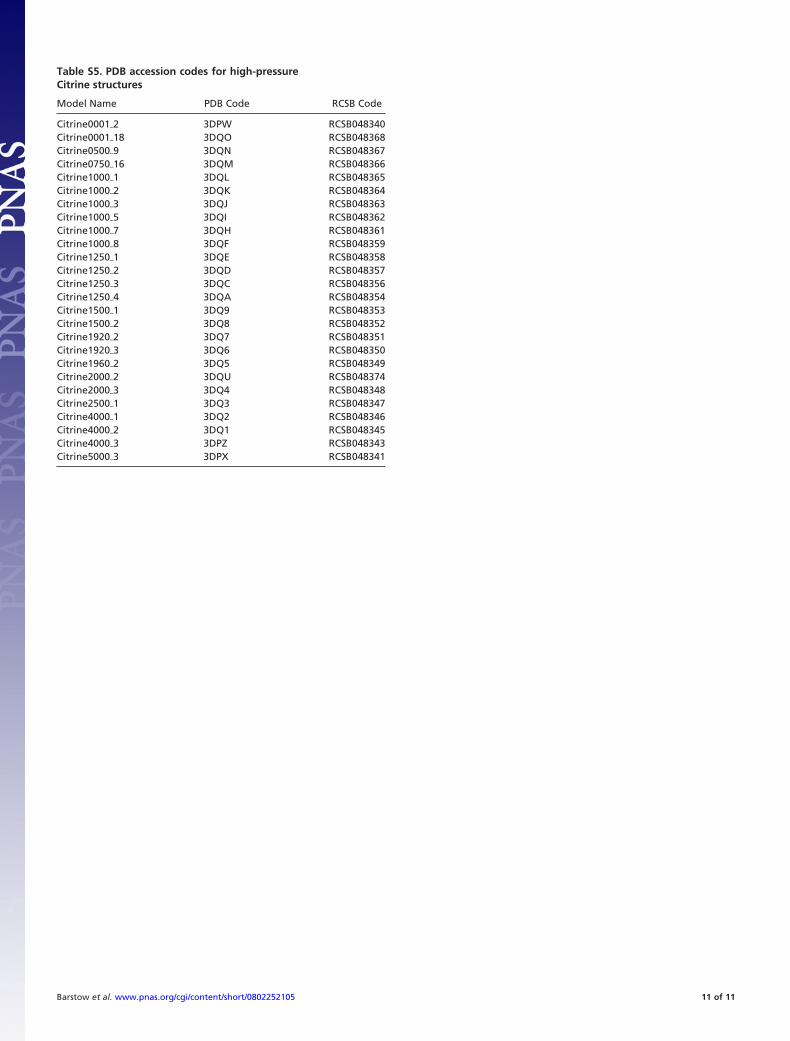
Table S5. PDB accession codes for high-pressureCitrine structures
Model Name PDB Code RCSB Code
Citrine0001�2 3DPW RCSB048340Citrine0001�18 3DQO RCSB048368Citrine0500�9 3DQN RCSB048367Citrine0750�16 3DQM RCSB048366Citrine1000�1 3DQL RCSB048365Citrine1000�2 3DQK RCSB048364Citrine1000�3 3DQJ RCSB048363Citrine1000�5 3DQI RCSB048362Citrine1000�7 3DQH RCSB048361Citrine1000�8 3DQF RCSB048359Citrine1250�1 3DQE RCSB048358Citrine1250�2 3DQD RCSB048357Citrine1250�3 3DQC RCSB048356Citrine1250�4 3DQA RCSB048354Citrine1500�1 3DQ9 RCSB048353Citrine1500�2 3DQ8 RCSB048352Citrine1920�2 3DQ7 RCSB048351Citrine1920�3 3DQ6 RCSB048350Citrine1960�2 3DQ5 RCSB048349Citrine2000�2 3DQU RCSB048374Citrine2000�3 3DQ4 RCSB048348Citrine2500�1 3DQ3 RCSB048347Citrine4000�1 3DQ2 RCSB048346Citrine4000�2 3DQ1 RCSB048345Citrine4000�3 3DPZ RCSB048343Citrine5000�3 3DPX RCSB048341
Barstow et al. www.pnas.org/cgi/content/short/0802252105 11 of 11