Allianz – in good shape · PDF fileAllianz – in good shape. ... Dividend policy...
34
Allianz – in good shape Merrill Lynch Banking and Insurance Conference London, September 2012 Michael Diekmann Chief Executive Officer
Transcript of Allianz – in good shape · PDF fileAllianz – in good shape. ... Dividend policy...
Allianz – in good shape
Merrill Lynch Banking and Insurance ConferenceLondon, September 2012
Michael DiekmannChief Executive Officer
©A
llian
z S
E 2
012
2
A Allianz at a glance
B Well positioned for an uncertain world
C Building franchise value in an uncertain world
D Summary
Agenda
©A
llian
z S
E 2
012
3
1
)
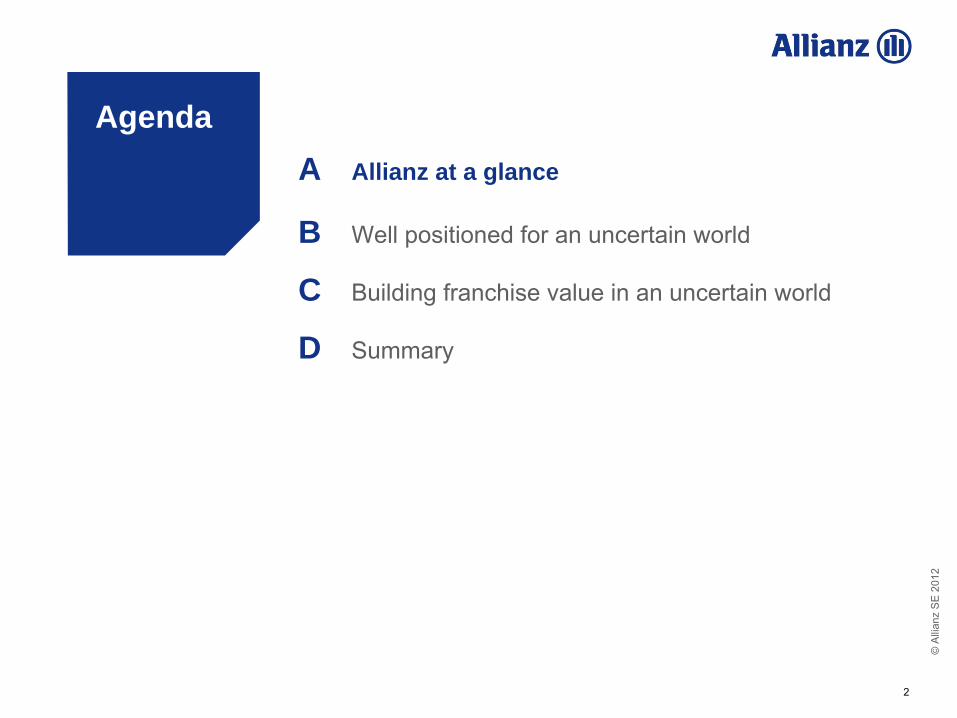
12/20112
)
06/20123
)
Based on dividend for fiscal 2011; no forecast4
)
Relation of business segments excluding Corporate & Other and consolidation
P/C
Allianz at a glance
EUR 104bn total revenues1
EUR 1,748bn total
AuM2
EUR 7.9bn operating profit1
178% economic solvency ratio2
EUR 48.0bn S/H equity2
EUR 36.0bn market cap2
About
78mn (direct) and 250mn (indirect) customers1
Approx. 5%3
dividend yield
Segments1,4
Operating profit in %Regions1,4
Operating profit in %
AM
L/H Western
Europe
GermanyEmerging markets
Specialty insurance
Broker markets US, UK, AUS
27%
26%
47%
6%11%
30%33%
20%
Allianz at a glance
©A
llian
z S
E 2
012
4
Leading P/C insurer globally
Top 5 in Life business globally
Top 5 asset manager globally
Largest global assistance provider
Worldwide leader in credit insurance
One of the leading industrial insurers globally
Building the leading global automotive provider
1
)
All rankings based on 2011 data
Strong market positions and brands1
Allianz at a glance
Unlimited access to
business opportunities
©A
llian
z S
E 2
012
5
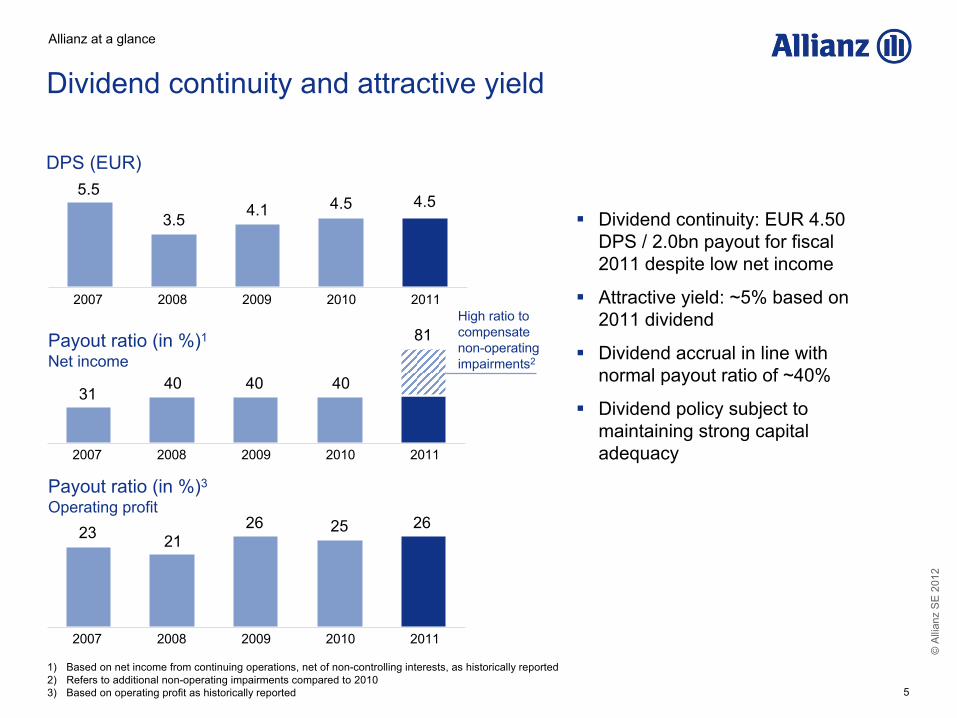
Dividend continuity: EUR 4.50 DPS / 2.0bn payout for fiscal 2011 despite low net income
Attractive yield: ~5% based on 2011 dividend
Dividend accrual in line with normal payout ratio of ~40%
Dividend policy subject to maintaining strong capital adequacy
Dividend continuity and attractive yield
2007 2008 2009 2010 2011
DPS (EUR)5.5
4.1 4.53.5
2007 2008 2009 2010 2011
4.5
Payout ratio (in %)1
Net income
Payout ratio (in %)3
Operating profit
3140 40 40
23 2126 25 26
2007 2008 2009 2010 2011
High ratio to compensate non-operating impairments2
81
1
)
Based on net income from continuing operations, net of non-controlling interests, as historically reported2
)
Refers to additional non-operating impairments compared to 20103
)
Based on operating profit as historically reported
Allianz at a glance
©A
llian
z S
E 2
012
6
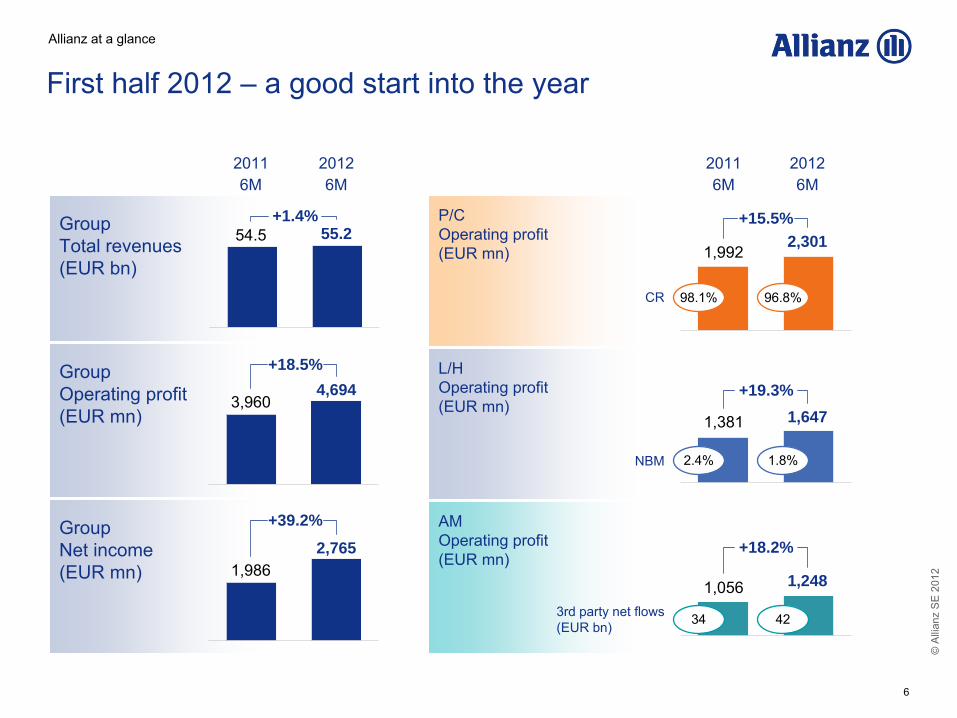
GroupNet income
(EUR mn)
GroupOperating profit
(EUR mn)
GroupTotal revenues(EUR bn)
First half 2012 –
a good start into the year
55.2
2011 2012
54.5
6M6M
+1.4%
4,6943,960
+18.5%
2,7651,986
+39.2%
P/COperating profit(EUR mn)
L/HOperating profit
(EUR mn)
AMOperating profit
(EUR mn)
2,301
2011 2012
1,992
6M6M
+15.5%
1,6471,381
+19.3%
1,2481,056
+18.2%
98.1% 96.8%CR
2.4% 1.8%NBM
34 423rd party net flows
(EUR bn)
Allianz at a glance

©A
llian
z S
E 2
012
7
A Allianz at a glance
B Well positioned for an uncertain world
C Building franchise value in an uncertain world
D Summary
Agenda
©A
llian
z S
E 2
012
8
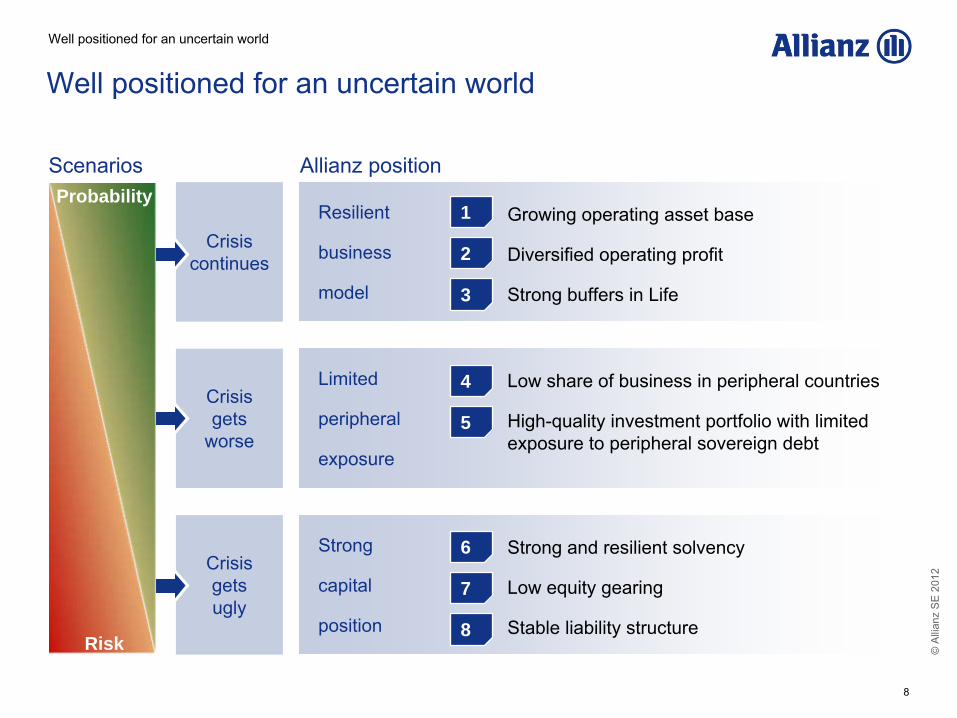
Well positioned for an uncertain world
Scenarios Allianz position
Crisis
continues
Resilient
business
model
Growing operating asset base
Diversified operating profit
Strong buffers in Life
Crisis
gets
worse
Limited
peripheral
exposure
Low share of business in peripheral countries
High-quality investment portfolio with limited exposure to peripheral sovereign debt
Crisis
gets
ugly
Strong
capital
position
Strong and resilient solvency
Low equity gearing
Stable liability structure
High probability
High risk
Well positioned for an uncertain world
1
2
3
4
5
6
7
8
Probability
Risk
©A
llian
z S
E 2
012
9
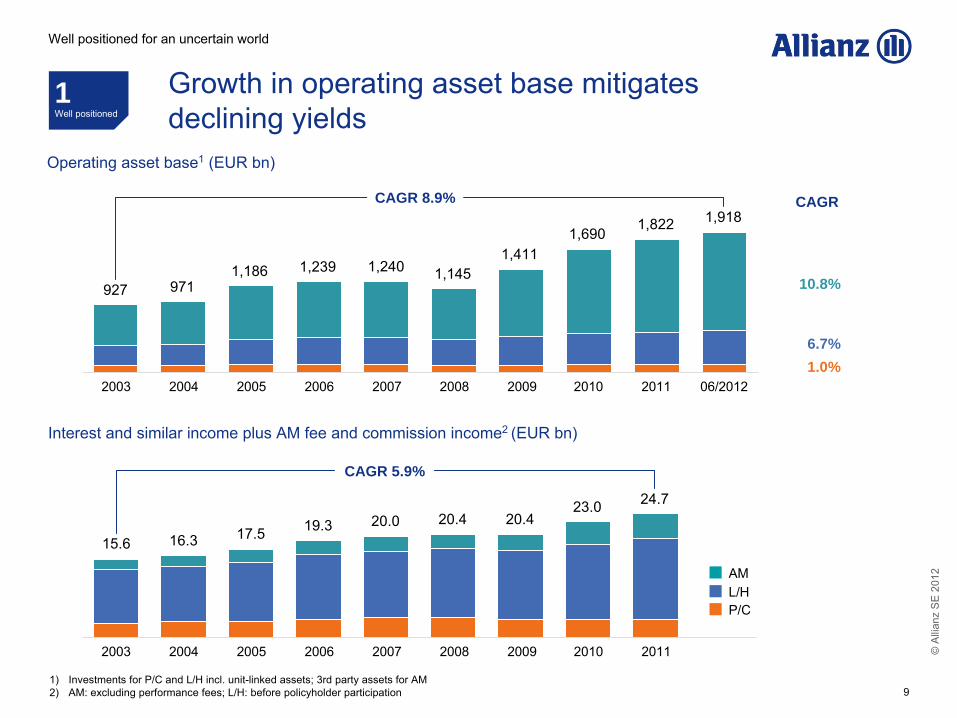
Growth in operating asset base mitigates declining yields
1) Investments for P/C and L/H incl. unit-linked assets; 3rd party assets for AM
2)
AM: excluding performance fees; L/H: before policyholder participation
Interest and similar income plus AM fee and commission income2 (EUR bn)
15.6 16.3 17.5 19.3 20.0 20.4
CAGR 5.9%
20.4
CAGR
Operating asset base1
(EUR bn)
927 9711,186 1,239 1,240 1,145
1,4111,690
10.8%
6.7%1.0%
CAGR 8.9%
2003 2004 2005 2006 2007 2008 2009 2010
23.0
1Well positioned
Well positioned for an uncertain world
1,918
2011
24.7
06/2012
1,822
2003 2004 2005 2006 2007 2008 2009 2010 2011
P/CL/HAM
©A
llian
z S
E 2
012
10
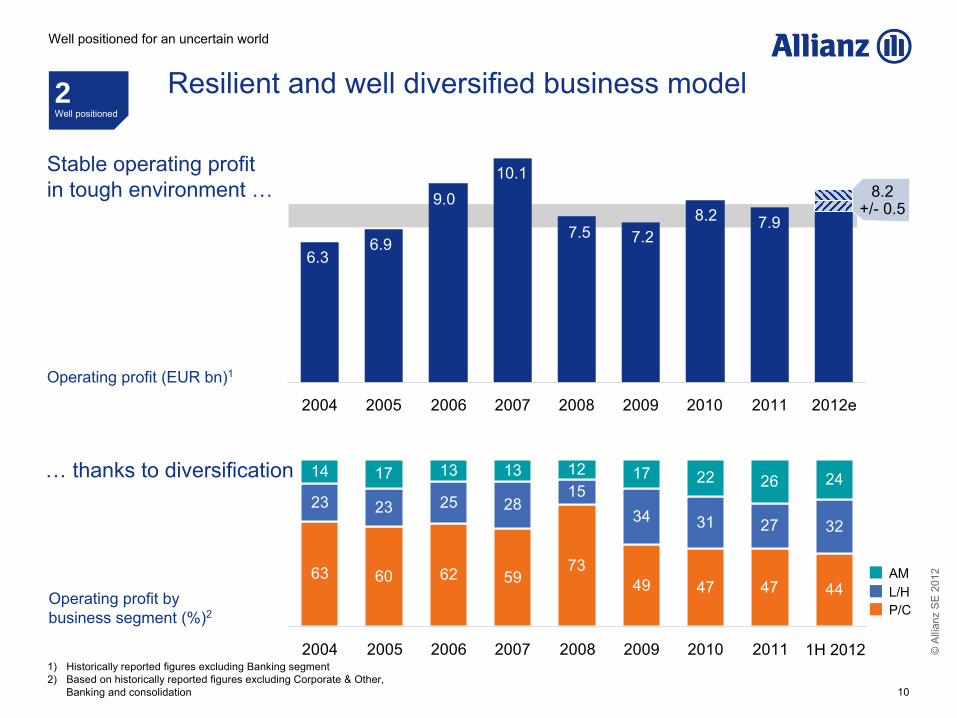
63 60 62 5973
49 47 47 44
23 23 25 2815
34 31 27 32
14 17 13 13 12 17 22 26 24
2004 2005 2006 2007 2008 2009 2010 2011 1H20121)
Historically reported figures excluding Banking segment 2) Based on historically reported figures excluding Corporate & Other,
Banking and consolidation
P/CL/HAM
Resilient and well diversified business model2Well positioned
Well positioned for an uncertain world
Stable operating profit
in tough environment …
… thanks to diversification
2004 2005 2006 2007 2008 2009 2010 2011 2012e
6.3
Operating profit (EUR bn)1
Operating profit by
business segment (%)2
9.010.1
8.2 7.96.9
7.5 7.2
8.2
+/-
0.5
1H 2012
©A
llian
z S
E 2
012
11
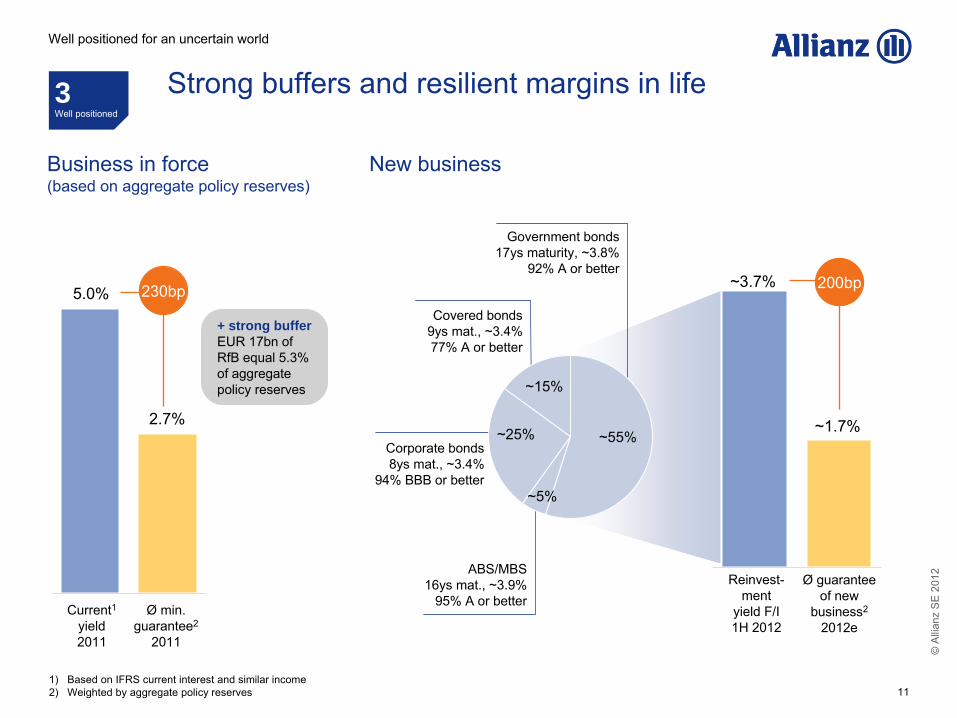
2012e
~2.0%
Business in force
(based on aggregate policy reserves)
New business
2.7%
1
)
Based on IFRS current interest and similar income2
)
Weighted by aggregate policy reserves
5.0%
Ø
guarantee
of new
business2
2012e
Reinvest-
ment
yield F/I 1H 2012
Current1
yield
2011
Ø min. guarantee2
2011
230bpCovered bonds
9ys mat., ~3.4%
77% A or better
~15%
~25%
Government bonds
17ys maturity, ~3.8%
92% A or better
Corporate bonds 8ys mat., ~3.4%
94% BBB or better
~1.7%
200bp
~5%
ABS/MBS
16ys mat., ~3.9%
95% A or better
~55%
+ strong buffer EUR 17bn of RfB equal 5.3% of aggregate policy reserves
~3.7%
Well positioned for an uncertain world
3Well positioned
Strong buffers and resilient margins in life
©A
llian
z S
E 2
012
12
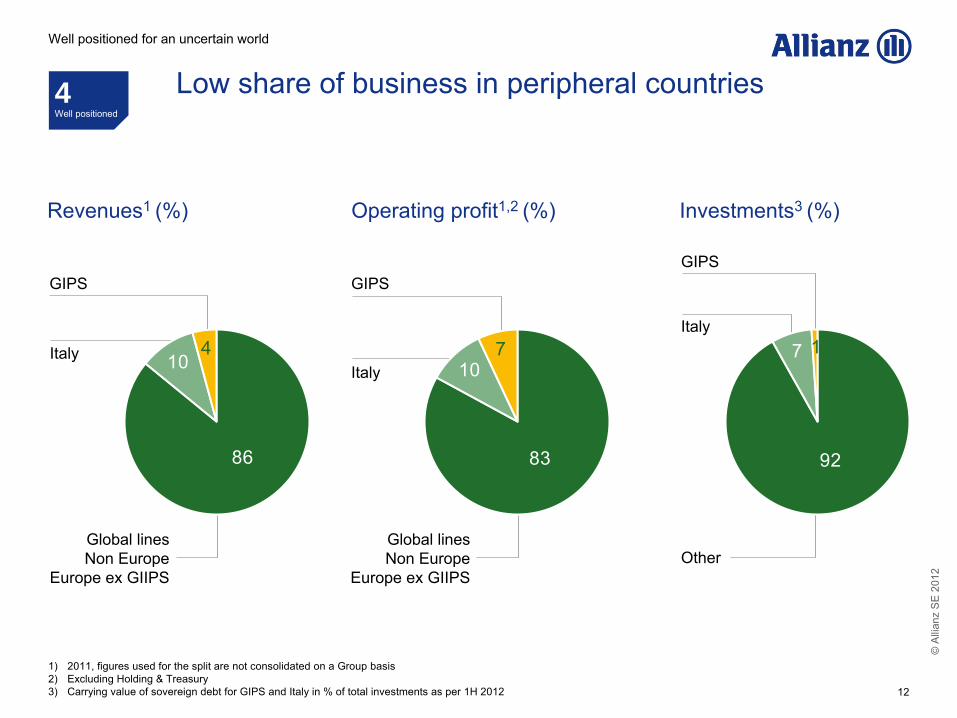
Operating profit1,2 (%)
GIPS
Italy 10
83
7
GIPS
Revenues1 (%)
Italy
Global lines
Non Europe
Europe ex GIIPS
104
86
1
)
2011, figures used for the split are not consolidated on a Group
basis2
)
Excluding Holding & Treasury3
)
Carrying value of sovereign debt for GIPS and Italy in % of total investments as per 1H 2012
Low share of business in peripheral countries4Well positioned
Well positioned for an uncertain world
Global lines
Non Europe
Europe ex GIIPS
Investments3 (%)
7
92
1
Other
Italy
GIPS
©A
llian
z S
E 2
012
13
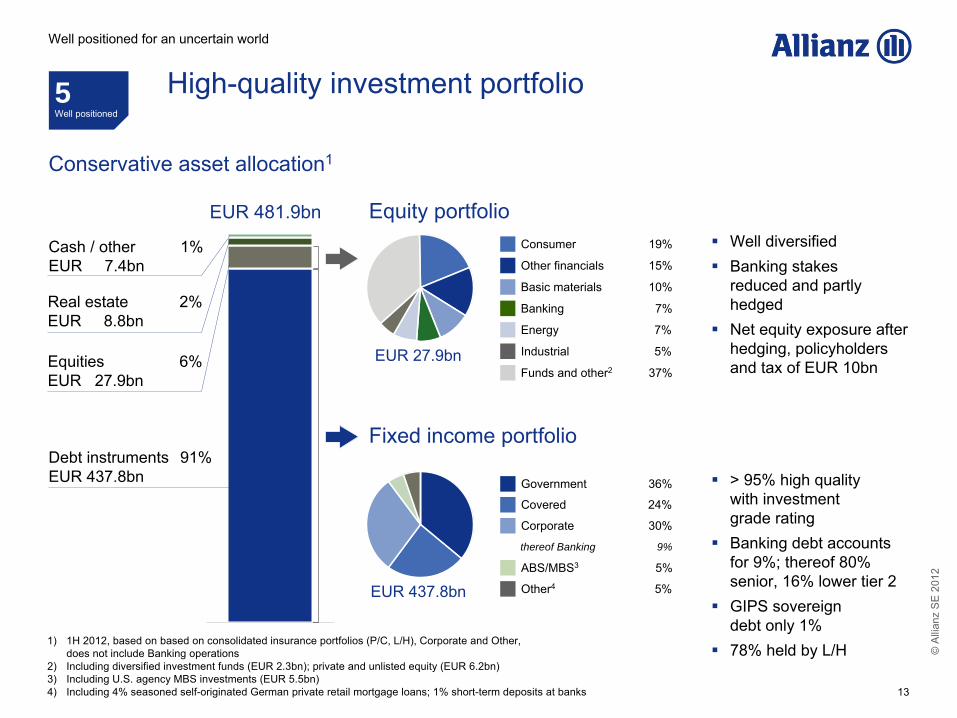
Conservative asset allocation1
> 95% high quality with investment grade ratingBanking debt accounts for 9%; thereof 80% senior, 16% lower tier 2GIPS sovereign debt only 1%78% held by L/H
Well diversifiedBanking stakes reduced and partly hedgedNet equity exposure after hedging, policyholders and tax of EUR 10bn
Equity portfolio
Fixed income portfolio
EUR 481.9bn
Cash / other
1%
EUR 7.4bn
Real estate
2%
EUR 8.8bn
Equities
6%
EUR 27.9bn
Debt instruments 91%
EUR 437.8bn
1
)
1H 2012, based on based on consolidated insurance portfolios (P/C, L/H), Corporate and Other, does not include Banking operations
2
)
Including diversified investment funds (EUR 2.3bn); private and unlisted equity (EUR 6.2bn)3
)
Including U.S. agency MBS investments (EUR 5.5bn)4
)
Including 4% seasoned self-originated German private retail mortgage loans; 1% short-term deposits at banks
EUR 437.8bn
Industrial 5%
Energy 7%
Consumer 19%
Funds and other2
37%
Basic materials 10%
Other financials
15%
Banking
7%
EUR 27.9bn
ABS/MBS3
5%
Government
36%
Covered
24%
Corporate
30%
Other4
5%
thereof Banking 9%
High-quality investment portfolio5Well positioned
Well positioned for an uncertain world
©A
llian
z S
E 2
012
14
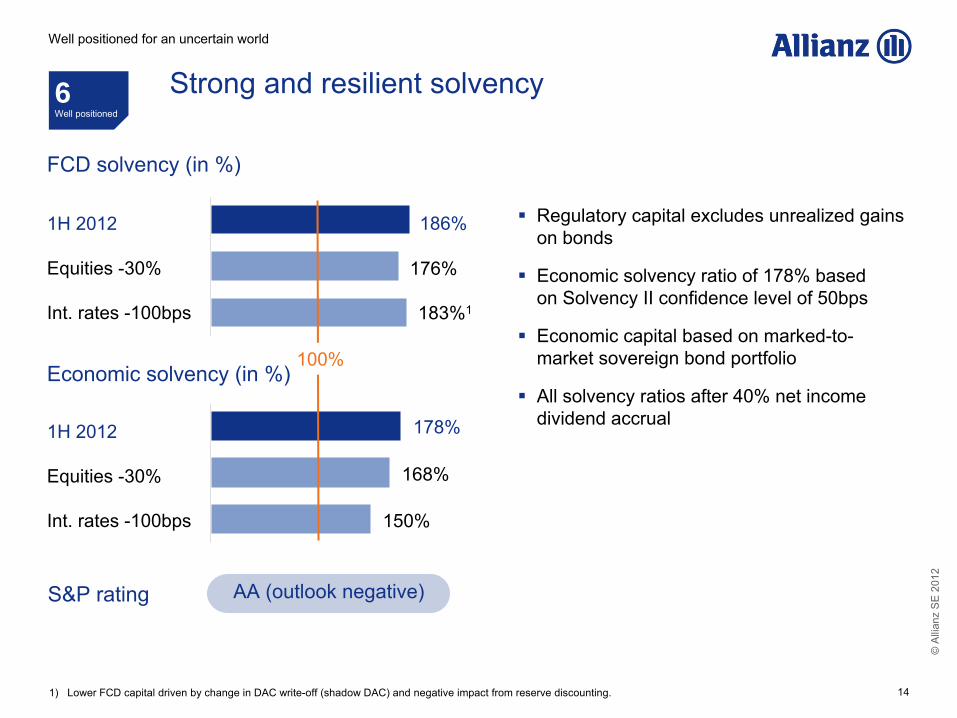
Strong and resilient solvency
FCD solvency (in %)
1H 2012
Equities -30%
Int. rates -100bps
1H 2012
Equities -30%
Int. rates -100bps
186%
176%
183%1
178%
168%
150%
100%
1
)
Lower FCD capital driven by change in DAC write-off (shadow DAC) and negative impact from reserve discounting.
Regulatory capital excludes unrealized gains on bonds
Economic solvency ratio of 178% basedon Solvency II confidence level of 50bps
Economic capital based on marked-to-market sovereign bond portfolio
All solvency ratios after 40% net income dividend accrual
S&P rating AA (outlook negative)
Economic solvency (in %)
6Well positioned
Well positioned for an uncertain world
©A
llian
z S
E 2
012
15
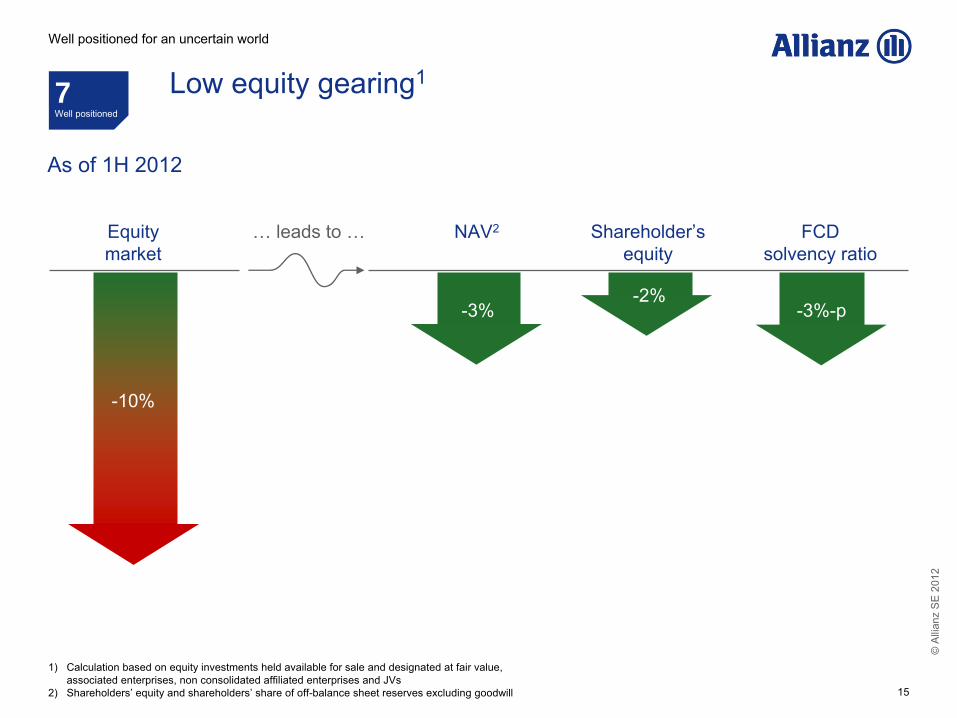
Shareholder’s
equity
Equity
market
NAV2 FCD
solvency ratio
1
)
Calculation based on equity investments held available for sale and designated at fair value,
associated enterprises, non consolidated affiliated enterprises and JVs2)
Shareholders’
equity and shareholders’
share of off-balance sheet reserves excluding goodwill
Well positioned for an uncertain world
As of 1H 2012
7Well positioned
Low equity gearing1
-10%
-3%-2%
-3%-p
… leads to …

©A
llian
z S
E 2
012
16
P/C
L/H
Group4
1) Group excluding bank subsidiaries; nominal values
2) Amount may vary depending on prevailing regulatory conditions3) Duration adjusted to allow for asset overhang 4) Including Corporate & Other
Appropriate maturity profile
Effective diversification between debt instruments
Over EUR 250bn group assets eligible as collateral with central banks2
Closely matched ALM structure
Stable liabilities with long duration profile
Resilient surrender ratios in L/HAssets Liabilities
4.1
7.2
6.5
3.3
9.1
8.0
Duration3
(as of 1H 2012, years)
8Well positioned
Stable liability structure
Well positioned for an uncertain world
Maturity structure1
(EUR bn, as of 1H 2012)
2011
2012
2013
2014
2015
2016
2017
2018
2019
2020
2021
2022
2023
2024
2025
2041
Per
petu
al
Senior bondsSubordinated bonds
1.5 1.5 1.5 1.0
5.7
2.5
0.91.5
©A
llian
z S
E 2
012
17
A Allianz at a glance
B Well positioned for an uncertain world
C Building franchise value in an uncertain world
D Summary
Agenda
©A
llian
z S
E 2
012
18
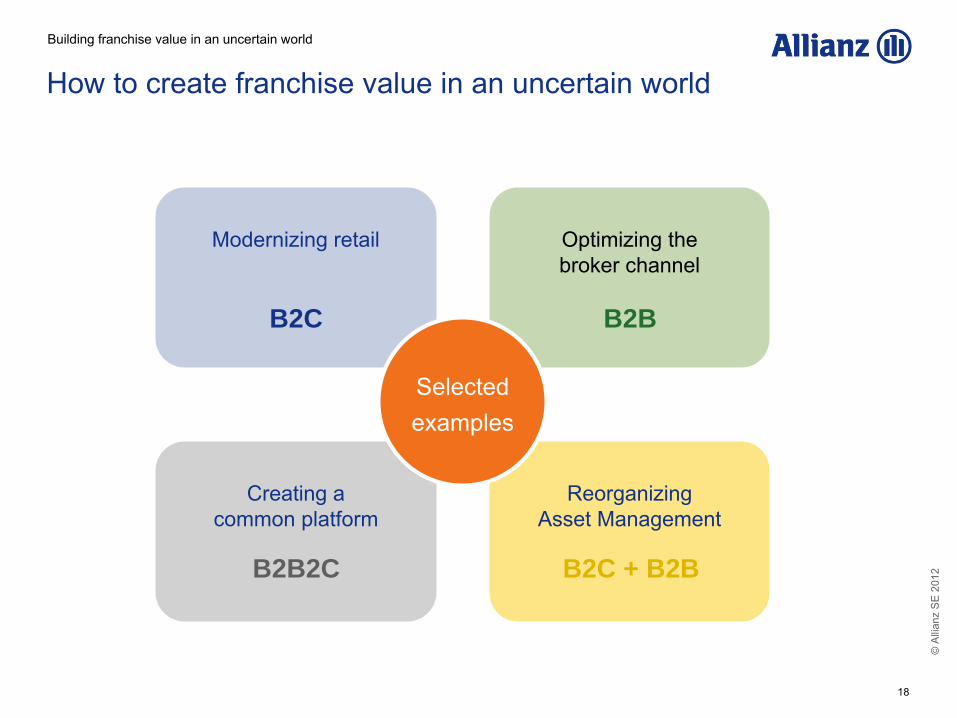
How to create franchise value in an uncertain world
Reorganizing
Asset Management
Optimizing the
broker channel
Creating a
common platform
Modernizing retail
Selected examples
B2C B2B
B2B2C B2C + B2B
Building franchise value in an uncertain world
©A
llian
z S
E 2
012
19
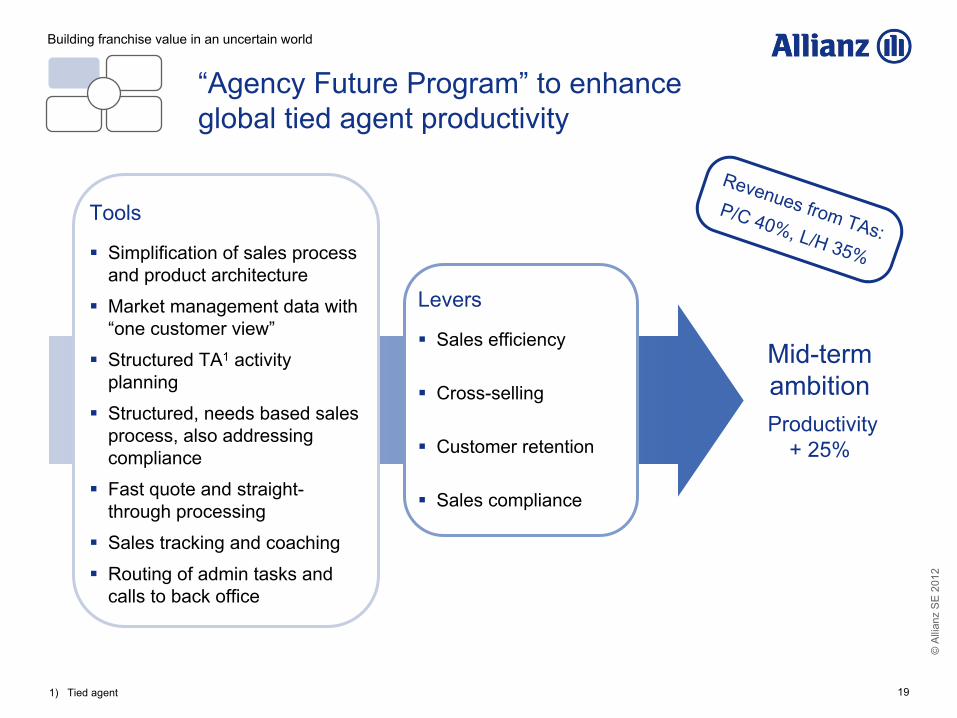
Mid-term ambitionProductivity
+ 25%
Levers
Sales efficiency
Cross-selling
Customer retention
Sales compliance
Tools
Simplification of sales process and product architecture
Market management data with “one customer view”
Structured TA1 activity planning
Structured, needs based sales process, also addressing compliance
Fast quote and straight-through processing
Sales tracking and coaching
Routing of admin tasks and calls to back office
Revenues from TAs:P/C 40%, L/H 35%
“Agency Future Program”
to enhance global tied agent productivity
Building franchise value in an uncertain world
1
)
Tied agent
©A
llian
z S
E 2
012
20
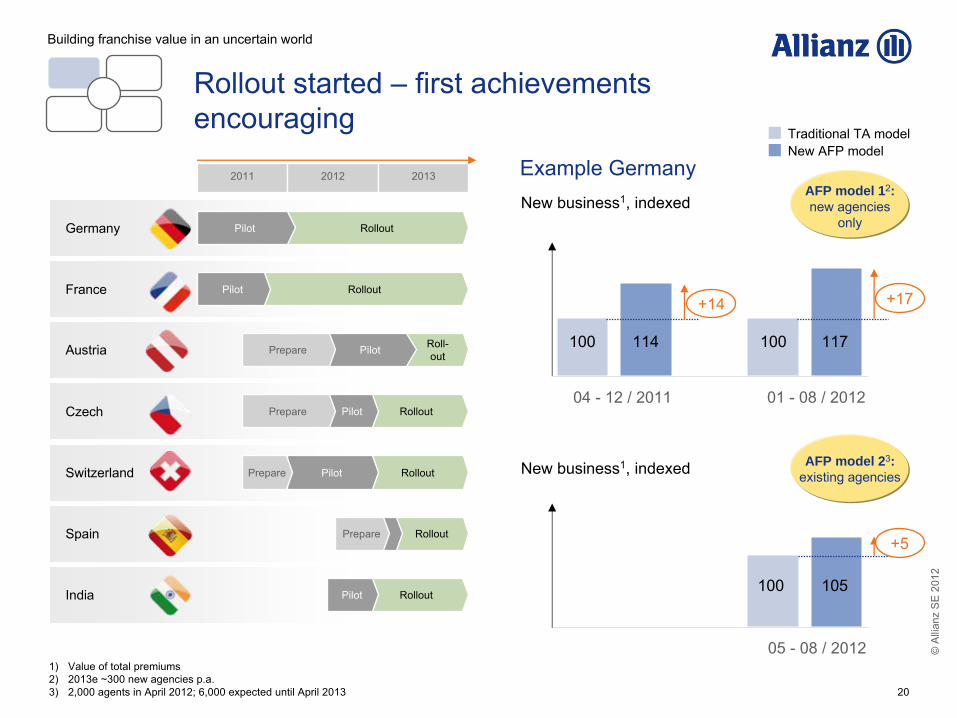
Example GermanyNew business1, indexed
04 -
12 / 2011 01 -
08 / 2012
100 114
+14 +17
117100
New business1, indexed
05 -
08 / 2012
+5
105100
Traditional TA modelNew AFP model
Germany
Austria
Czech
Switzerland
France
Spain
India
RolloutPilot
2011 2012 2013
RolloutPilot
Roll-
outPilotPrepare
RolloutPilotPrepare
RolloutPilotPrepare
RolloutPrepare
RolloutPilot
1)
Value of total premiums
2)
2013e ~300 new agencies p.a.
3)
2,000 agents in April 2012; 6,000 expected until April 2013
AFP model 12: new agencies
only
AFP model 23: existing agencies
Rollout started –
first achievements encouraging
Building franchise value in an uncertain world
©A
llian
z S
E 2
012
21
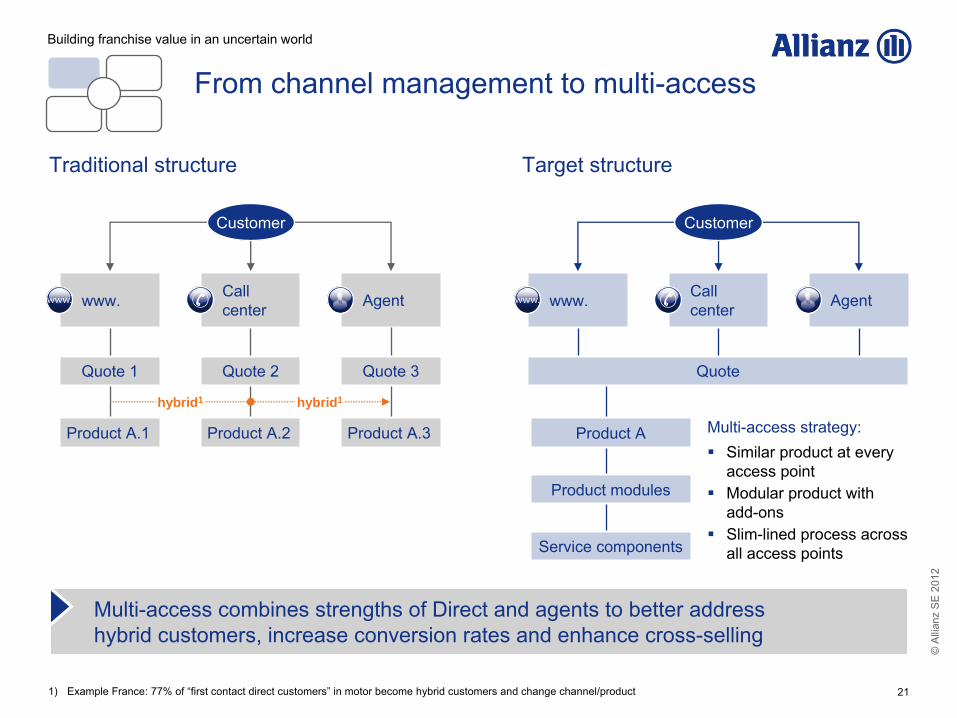
Multi-access combines strengths of Direct and agents to better address
hybrid customers, increase conversion rates and enhance cross-selling
From channel management to multi-access
Building franchise value in an uncertain world
Traditional structure Target structure
Agentwww.
Quote 1
Product A.1
Call
center
Quote 2
Product A.2
Quote 3
Product A.3
hybrid1 hybrid1
Customer
Agentwww. Call
center
Quote
Customer
Product A
Product modules
Service components
Multi-access strategy:Similar product at every access pointModular product with add-onsSlim-lined process across all access points
1
)
Example France: 77% of “first contact direct customers”
in motor become hybrid customers and change channel/product

©A
llian
z S
E 2
012
22
Total GWP non-motor
(EUR mn)
# of products
non-motor
534
201039
383
2013e
914
244
100
148
232
749
771
2013e
493
20101934
516
-1.2%
Under Group-wide implementation
Closed productsrelevant by size
Open products
1,299 1,283
Closed productsnegligible by size
Allianz OE example
Complexity reduction leads to …
… reducedclaims leakage
… enhanced sales productivity
-58%
Complexity reduction to enhance sales productivity
Building franchise value in an uncertain world

©A
llian
z S
E 2
012
23
FA / other proprietary networks 1%
Building franchise value in an uncertain world
2011
Tied Agents
40%
Auto 5%Banks 3%
Direct 2%Other 4%
Broker44%
Other brokers
Other channelsGlobal brokers
2009 2011
38.3 40.4
13.1 14.1
3.3 3.7
21.9 22.6
+2.7%
+3.7%
+5.9%
P/C revenues Allianz Group
(EUR bn)
CAGR
+1.6%
Allianz broker initiative to accelerate growth
Broker channel accounts for 44%of AZ Group P/C revenues in 2011
Above average growth of broker andespecially global broker revenuesdue to …
… global account management,e.g. with Aon, Marsh, Willis andJardine Lloyd Thompson
… best practice exchange onunder- writing and claims inmid-corp. segment
©A
llian
z S
E 2
012
241
)
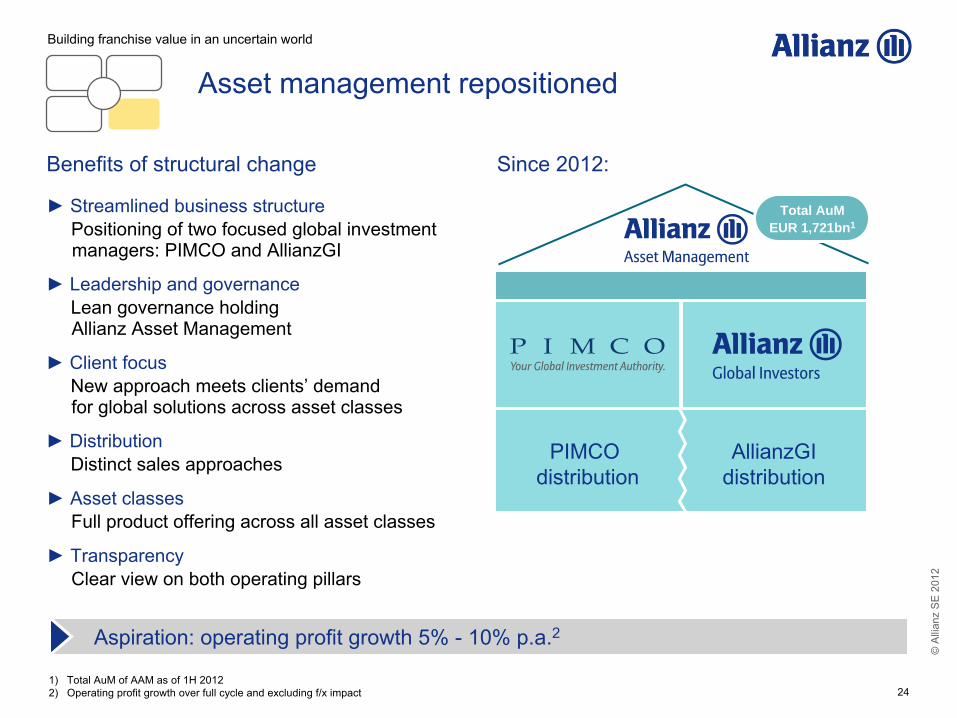
Total AuM of AAM as of 1H 20122
)
Operating profit growth over full cycle and excluding f/x impact
► Client focusNew approach meets clients’
demand for global solutions across asset classes
► DistributionDistinct sales approaches
► Asset classesFull product offering across all asset classes
► Leadership and governanceLean governance holding Allianz Asset Management
Benefits of structural change Since 2012:
Building franchise value in an uncertain world
► Streamlined business structurePositioning of two focused global investment managers: PIMCO and AllianzGI
Aspiration: operating profit growth 5% -
10% p.a.2
PIMCO distribution
AllianzGIdistribution
Total AuMEUR 1,721bn1
► Transparency Clear view on both operating pillars
Asset management repositioned
©A
llian
z S
E 2
012
25
New setup
New setup
New setup
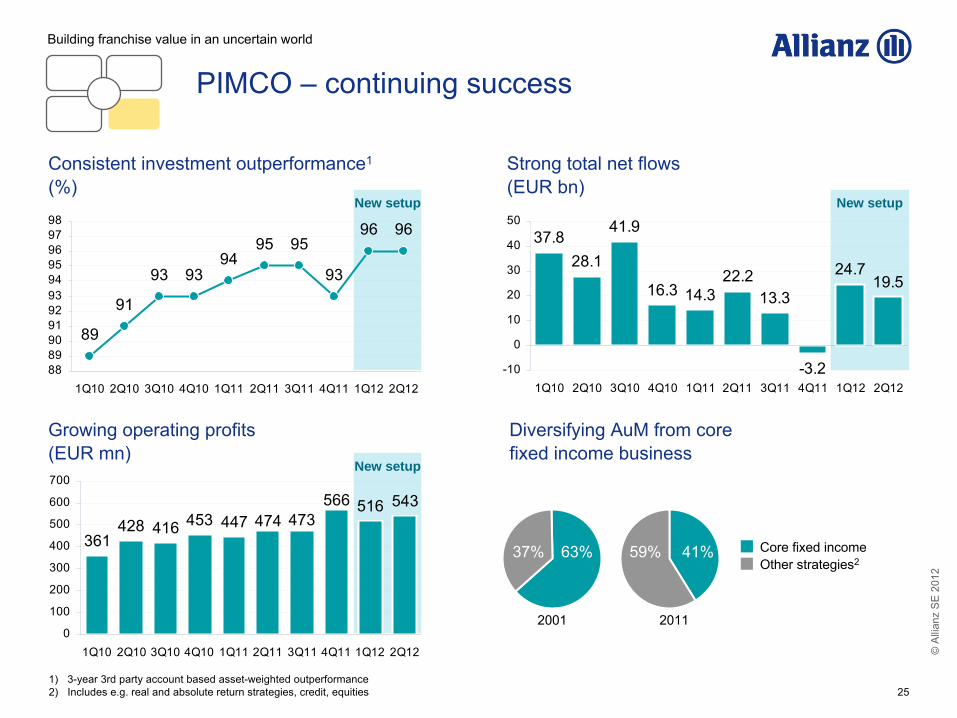
Consistent investment outperformance1
(%)Strong total net flows
(EUR bn)
96 9695
9393
91
93
95
89
94
8889909192939495969798
1Q10 2Q10 3Q10 4Q10 1Q11 2Q11 3Q11 4Q11 1Q12 2Q12
2001 2011
Core fixed incomeOther strategies2
41%59%63%37%
Growing operating profits(EUR mn)
Diversifying AuM from core fixed income business
361428 416 453 447
516 543566473474
0
100
200
300
400
500
600
700
1Q10 2Q10 3Q10 4Q10 1Q11 2Q11 3Q11 4Q11 1Q12 2Q12
Building franchise value in an uncertain world
19.524.722.2
-3.2
13.314.316.3
41.9
28.137.8
-10
0
10
20
30
40
50
1Q10 2Q10 3Q10 4Q10 1Q11 2Q11 3Q11 4Q11 1Q12 2Q12
1
)
3-year 3rd party account based asset-weighted outperformance2
)
Includes e.g. real and absolute return strategies, credit, equities
PIMCO –
continuing success
©A
llian
z S
E 2
012
26
New setupNew setup
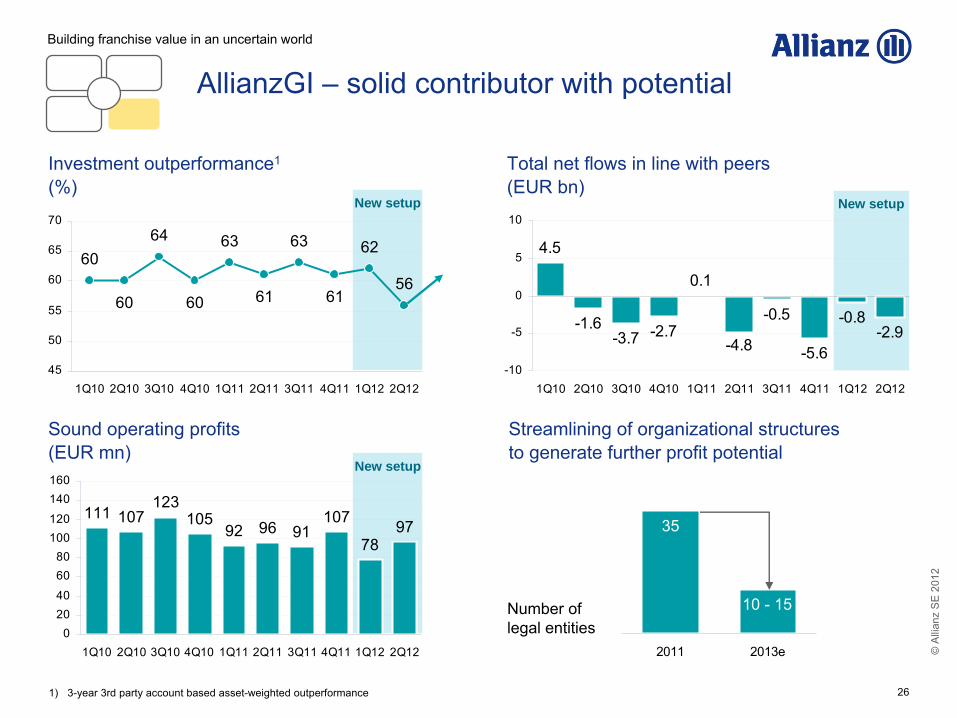
2011 2013e
Investment outperformance1
(%)
Total net flows in line with peers
(EUR bn)
62
566160
64
60 61
6360
63
45
50
55
60
65
70
1Q10 2Q10 3Q10 4Q10 1Q11 2Q11 3Q11 4Q11 1Q12 2Q12
Sound operating profits(EUR mn)
Streamlining of organizational structures to generate further profit potential
Building franchise value in an uncertain world
-2.9-0.8
-5.6
-0.5
-4.8
0.1
-2.7-3.7
4.5
-1.6
-10
-5
0
5
10
1Q10 2Q10 3Q10 4Q10 1Q11 2Q11 3Q11 4Q11 1Q12 2Q12
Number of
legal entities
1
)
3-year 3rd party account based asset-weighted outperformance
35
10 -
15
New setup
111 107123
10592 96 91
107
7897
02040
6080
100120
140160
1Q10 2Q10 3Q10 4Q10 1Q11 2Q11 3Q11 4Q11 1Q12 2Q12
AllianzGI –
solid contributor with potential
©A
llian
z S
E 2
012
27
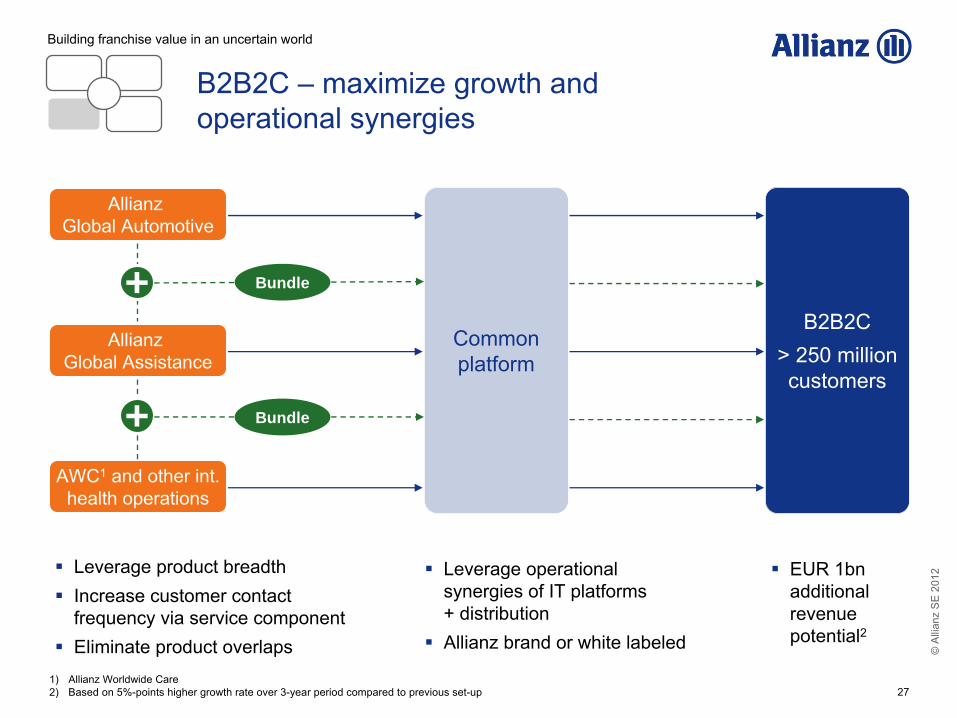
B2B2C> 250 million
customers
Allianz Global Automotive
Allianz Global Assistance
AWC1
and other int.
health operations
Common platform
Building franchise value in an uncertain world
B2B2C –
maximize growth and operational synergies
Leverage product breadth Increase customer contactfrequency via service componentEliminate product overlaps
Leverage operationalsynergies of IT platforms + distributionAllianz brand or white labeled
EUR 1bnadditional revenuepotential2
1)
Allianz Worldwide Care2
)
Based on 5%-points higher growth rate over 3-year period compared to previous set-up
Bundle
Bundle
©A
llian
z S
E 2
012
28
A Allianz at a glance
B Well positioned for an uncertain world
C Building franchise value in an uncertain world
D Summary
Agenda

©A
llian
z S
E 2
012
29
Operating asset base growing to EUR 452bn
Total net inflows of EUR 41bnCIR 57.5%
Please mind the seasonality of the business and our disclaimer3!
Benign NatCatCR 96.8%
As planned
L/H
AM
CO
P/C 2.34.0 –
5.0
1.62.2 –
2.8
1.2
-0.5
Solid operating profit outlook for 2012
Operating profit (EUR bn)
-0.9 –
-1.1
1
)
For FY 20122
)
As % of target range mid-point3
)
Disclaimer: impact from NatCat, financial markets and global economic development not predictable!
6M 2012 Outlook1
published 02/12 6M 2012
2.0 –
2.4
8.2 +/-
0.5
57%2
64%2
55%2
50%2
51%2
Total 4.7
Summary

©A
llian
z S
E 2
012
30
To sum it up
Resilient and well diversified business model
Limited peripheral exposure
Strong market positions and brands
Strong capital position
Continuing generation of franchise value
Attractive dividend yield
1
Summary
2
3
4
5
6

©A
llian
z S
E 2
012
31
Appendix

©A
llian
z S
E 2
012
32
Investor Relations contacts
Oliver SchmidtHead of Investor Relations
Phone +49 89 [email protected]
Peter Hardy
Phone +49 89 [email protected]
Holger Klotz
Phone +49 89 [email protected]
Reinhard Lahusen
Phone +49 89 [email protected]
Christian Lamprecht
Phone +49 89 [email protected]
Stephanie AldagIR Events
Phone +49 89 [email protected]
Investor Relations
Fax +49 89 [email protected]
Internet
(English): www.allianz.com/investor-relations(German): www.allianz.com/ir
Appendix

©A
llian
z S
E 2
012
33
Financial calendar
November 9, 2012
Interim Report
3rd quarter 2012
February 21, 2013
Financial Press Conference for Fiscal Year 2012
May 7, 2013
Annual General Meeting 2013
May 7, 2014
Annual General Meeting 2014
May 6, 2015
Annual General Meeting 2015
The German Securities Trading Act ("Wertpapierhandelsgesetz")
obliges issuers to announce immediately any information which
may have
a substantial
price impact, irrespective of the communicated schedules. Therefore we cannot exclude that
we
have to
announce key figures of
quarterly and fiscal year results ahead of the dates mentioned above. As we can never rule out changes of dates, we recommend checking them on the Internet at www.allianz.com/financialcalendar.
Appendix
©A
llian
z S
E 2
012
34
Disclaimer
These assessments are, as always, subject to the disclaimer provided below.
Cautionary Note Regarding Forward-Looking StatementsThe statements contained herein may include statements of future
expectations and other forward-looking statements that are based
on management’s current views and assumptions and involve known
and unknown risks and uncertainties that could cause actual results,
performance or events to differ materially from those expressed or
implied in such statements. In addition to statements which are forward-
looking by reason of context, the words “may”, “will”, “should”, “expects”,
“plans”, “intends”, “anticipates”, “believes”, “estimates”, “predicts”,
“potential”, or “continue”
and similar expressions identify forward-looking
statements. Actual results, performance or events may differ materially
from those in such statements due to, without limitation, (i) general economic
conditions, including in particular economic conditions in the Allianz Group’s
core business and core markets, (ii) performance of financial markets,
including emerging markets, and including market volatility, liquidity and
credit events (iii) the frequency and severity of insured loss events,
including from natural catastrophes and including the development of loss
expenses, (iv) mortality and morbidity levels and trends, (v) persistency
levels, (vi) the extent of credit defaults, (vii) interest rate levels, (viii) currency
exchange rates including the Euro/U.S. Dollar exchange rate, (ix) changing
levels of competition, (x) changes in laws and regulations, including monetary
convergence and the European Monetary Union, (xi) changes in the
policies
of central banks and/ or foreign governments, (xii) the impact of acquisitions,
including related integration issues, (xiii) reorganization measures, and (xiv)
general competitive factors, in each case on a local, regional, national and/ or
global basis. Many of these factors may be more likely to occur,
or more
pronounced, as a result of terrorist activities and their consequences. The
company assumes no obligation to update any forward-looking statement.
No duty to update The company assumes no obligation to update any information contained
herein.


![[Go Igo Baduk Weiqi] Mastering the Basics Vol.3 - Making Good Shape - Scan](https://static.fdocuments.net/doc/165x107/54926fedac7959013e8b489d/go-igo-baduk-weiqi-mastering-the-basics-vol3-making-good-shape-scan.jpg)