Allianz · PDF fileAllianz Global Wealth Report 2015 5 136,000,000,000,000 or 136 trillion...
121
Economic Research Allianz Global Wealth Report 2015
Transcript of Allianz · PDF fileAllianz Global Wealth Report 2015 5 136,000,000,000,000 or 136 trillion...

Economic Research
Allianz Global Wealth
Report 2015

Allianz Global Wealth Report 2015
Kathrin BrandmeirDr. Michaela GrimmDr. Michael HeiseDr. Arne Holzhausen
Allia
nz G
loba
l Wea
lth R
epor
t 201
5
5136,000,000,000,000 or 136 trillion euros: this vast amount of money is how much personal finan-cial assets across the globe were worth at the end of 2014. In theory, it would be enough for private households to settle all of the world‘s sovereign debt roughly three times over. So is this the much talked about ”flood of savings” that is engulfing the capital markets and pushing interest rates down to ever new lows?
It is true that personal financial assets showed very robust development last year, increasing by more than 7 percent for the third year running - and the strong growth was, indeed, fueled increasingly by moves taken by households to step up their savings efforts. This is a phenomenon that has swept across virtually the entire planet, with even US citizens setting more money aside again; crisis-ridden Europe is the only region that is still lagging behind a bit.
But these savings should not be denounced as a ”flood”. Instead, the trend is more of a ”savings paradox”: because what can, perhaps, be interpreted as an excess supply of savings capital on the macroeconomic side looks like something entirely different at the level of a specific individual. Faced with over-indebted governments and aging societies, each individual is being called upon to do more, and not less, to make provisions for his or her own future. After all, the high total amount of personal financial assets should not distract us from the fact that these assets remain very unevenly distrib-uted. On average, the ”poorer” half of the population holds only around five percent of the assets in the countries we have analyzed. In other words: every second person has very meager/insufficient reserves to fall back on in old age.
But if, from an individual perspective, we are actually still putting too little aside, then the current level of the capital supply should not be the problem. Rather, the question should be asked the other way round: why is the demand for capital still lagging behind the supply? The answer cannot really be a lack of investment opportunities, because the challenges that lie ahead are huge: climate change, poverty and migration, digital revolution, outdated infrastructure – to name but a few. Instead, the root of the problem seems to lie in the fact that the global capital markets are not currently perform-ing their resource allocation function to the best of their ability. This is where action has to be taken, for example by enabling easier access to the market, strengthening the role of institutional inves-tors and making the markets more efficient. After years in which security was the overarching goal of market regulation and supervision alike, the time has now come to focus more on ensuring fully functional markets.
I hope that the in-depth analysis of the global wealth situation of private households that this sixth issue of the ”Allianz Global Wealth Report” offers will help us to tackle the tasks that lie ahead with a clear view of where we stand.
Oliver BäteChairman of the Board of Management of Allianz SE
Preface

Table of Contents

9 Summary
13 Development in global financial assets: Saving in the face of low interest rates
33 Development in global liabilities: Normalization in debt growth
43 Wealth distribution: Concentration and density
55 Regional differences: Financial assets in individual regions
57 Latin America 65 North America 73 Western Europe 85 Eastern Europe 97 Asia 109 Australia and New Zealand
115 Literature
16 Box 1: Introduction of the European System of Accounts 2010
28 Box 2: Differences in the impact of the low interest rates within the eurozone
116 Appendix A: Methodological comments
119 Appendix B: Financial assets by country
121 Appendix C: Global ranking

Summary
Allia
nz G
loba
l Wea
lth R
epor
t 201
5
9
Savers versus low interest rates
Across the globe, the gross financial assets of
private households in 2014 were up by 7.1% on a
year earlier. This means that the robust growth
witnessed in previous years continued, albeit to
a lesser extent, not least thanks to households
moving up a gear with their savings efforts. All
three asset classes - bank deposits, securities
and insurance and pension funds - contributed
equally to growth. This brought total global as-
sets up to a new record high of EUR 135.7 trillion.
This amount is higher than the value of all of the
world‘s listed companies and all sovereign debt.
The unrivalled growth champion remains Asia
(ex. Japan), where gross financial assets grew by
16.6% in 2014. The main driving force behind this
trend was the stark increase in securities assets
of 27%, particularly in China. In the world‘s other
two emerging regions, Latin America and eastern
Europe, on the other hand, developments were
much more subdued: financial assets increased
by ”only” just under 8% in both regions which,
from eastern Europe‘s perspective, meant that
the pace of growth had dwindled by around four
percentage points compared with 2013.
In 2014, western Europe was able to report higher
growth than North America again for the first
time since the financial crisis. The strong growth
of 6.7% (compared with 4.8% in North America)
was thanks largely to the marked increase in
the ”insurance and pensions” asset class in a
small number of countries. As has traditionally
been the case, Japan came bottom of the growth
league again in 2014.
2014 saw households in the world‘s advanced
economies setting much more of their money
aside in savings, despite the low interest rate
environment. Fund inflows increased by almost
16% in total. But while current savings in western
Europe have only reached half the pre-crisis level
despite this increase, they have already bounced
back to levels well above those seen in the pre-
crisis years in other developed regions. The fact
that western Europe is lagging behind here is a
clear indication that the consequences of the
euro crisis are still making themselves felt.
China overtakes Japan
The slow shift in weightings on the world asset
map continued in 2014: the three emerging
market regions of Latin America, eastern Europe
and Asia (ex Japan) accounted for just under 20%
of the world‘s gross financial assets. This figure
is up by 1.4 percentage points since 2013 and
means that the proportion of assets held by
these regions has almost trebled since 2000. Last
year also saw a major landmark being passed as
part of this catch-up process: China‘s total gross
financial assets exceeded those of Japan for the
first time at the end of 2014.
Debt growth returns to normal
The global liabilities of private households
climbed by 4.3% to total EUR 35.2 trillion last year,
bringing global debt growth up to the highest
level seen since the outbreak of the crisis. In order
words: debt growth is in the process of returning
to normal. This also comes hand-in-hand with a
split between the world‘s richer and poorer areas
in terms of where the development is headed:
whereas debt growth tailed off slightly in eastern
Europe, Latin America and Asia (ex. Japan), it
increased again ever so slightly in the world‘s
developed regions. All in all, however, the rates of
change were still down considerably on the pre-
crisis years. Private households remained very
cautious about borrowing and the trend certainly
cannot be described as a return to the status quo
ante. In no other region is this more evident than
in western Europe, where households in many
countries remained firmly focused on reducing
their debt.
Sum
mar
y
10
The global debt ratio, i.e. private household
liabilities measured as a percentage of nominal
economic output, remained at 64.4% in 2014,
roughly on a par with the year before. Whereas
in the period from 2010 to 2013, economic
growth clearly outpaced personal debt growth
- pushing the ratio down by around seven
percentage points - debt and economic growth
last year were pretty much neck-and-neck. The
global deleveraging process that has been ongo-
ing for a few years now gradually appears to be
coming to an end.
Global net financial assets break through the 100-trillion-euro-mark
If we subtract debt from the gross financial as-
sets, we arrive at a figure for net financial assets,
which came in at a new high of EUR 100.6 trillion
at the close of 2014. This figure is up by 8.1% on
a year earlier - above-average development in a
long-term comparison (average rate of +5.3%
p.a.). In the regional ranking, households in North
America are crowned the richest worldwide,
with net financial assets averaging EUR 132,540
per capita. Eastern Europe is at the lower end of
the scale (EUR 2,720 per capita).
Global wealth middle class swells considerably
3.5 billion people in the countries included in our
analysis, or 71% of the total population, belong
to the wealth lower class. This group‘s share of
the world‘s net financial assets is in stark contrast
to its size, with less than five percent of total
net financial assets in their hands. The situation
among the wealth upper class is the exact op-
posite: although only just under ten percent of
the total population of the countries we analyzed
(420 million people) can count themselves as
members of this group, the wealth upper class
holds around 80% of the world‘s total assets. Nev-
ertheless, we are now witnessing a downward
trend not just in the number of members of the
wealth upper class, but also in their share of total
global net financial assets: since the turn of the
millennium, their share has dwindled by twelve
percentage points.
But it is not the wealth lower class that has
reaped the most benefits from this development
- their share has only grown by a percentage
point or so over the past 14 years. The real win-
ner is the middle class, which has upped its share
by more than ten percentage points and now
holds almost 17% of global assets. This is also
reflected in the number of people who fall into
this category: last year, the number of people
that fall into the wealth middle class in global
terms surpassed the 1 billion mark for the first
time. Since 2000, almost 600 million people from
the ”low wealth” category have been promoted
to the wealth middle class. All in all, membership
of this group has trebled since the turn of the
millennium. This development highlights the
inclusive nature of asset growth in a global com-
parison: more and more people are managing to
participate in global prosperity.
This momentum is, however, concentrated
primarily in only one region, or rather actually in
only one country: China. Around two-thirds of
the global wealth middle class are now recruited
from Asia - and 85% of them hail from China. This
means that the Asian population that falls into
the middle class bracket has increased almost
tenfold since the start of the millennium.
Allia
nz G
loba
l Wea
lth R
epor
t 201
5
11
USA = Unequal States of America
In order to show how wealth is distributed at
national level, we have calculated a Gini coef-
ficient for each country, based on the average net
financial assets per population decile, for the first
time in this report, namely for the past (period
around 2000) and for the present day.
Looking at all of the countries in our analysis, the
number of countries in which the Gini coefficient
of wealth distribution has ”improved” over time
(i.e. showing more equal distribution) is roughly
on a par with the number of countries in which
it has deteriorated. This does not necessarily
mean that the general trend is towards greater
inequality.
The Gini wealth distribution coefficients for the
emerging markets in Latin America, Asia and
eastern Europe look more or less as one would
expect: wealth distribution in the Latin American
countries is, on average, less equal than in Asia
and eastern Europe. At the same time, most of
these countries have made progress in moving
towards greater social participation in recent
years, a trend that reflects the turbulent nature
of asset growth that has affected large parts of
society. But the same applies here: exceptions like
Russia or Indonesia confirm the rule.
The world‘s developed countries, on the other
hand, paint a much more heterogeneous picture,
with exceptionally large gaps between both the
levels of, and the rates of change in, the Gini
coefficients. Most of these countries have seen
a (sometimes considerable) increase in the
inequality of distribution in recent years.
This holds true for the US in particular, where the
crisis and the sluggish economic recovery that
followed have caused a dramatic deterioration
in wealth distribution. The increase in inequal-
ity is more pronounced here than in any other
country during the period analyzed. The result:
the USA (= ”Unequal States of America”) has the
highest Gini coefficient in our analysis. Develop-
ments have not been quite as dramatic in the
other countries. It is, however, striking that trends
towards a greater concentration of wealth are not
found primarily in the European crisis countries,
but rather in countries like Switzerland, France,
Austria or Italy.


Development in global financial assets
Saving in the
face of low
interest rates
Deve
lopm
ent i
n gl
obal
fina
ncia
l ass
ets
14Seemingly unfazed by the record low interest ra-
tes and by what has, in some cases, been a marked
slowdown on the stock markets, the global financi-
al assets of private households showed extremely
robust growth to the tune of 7.1% last year.1 In pre-
sent times, when the world‘s major central banks are
keeping monetary policy looser than ever and the
low-risk investments offering attractive returns that
were once so sought-after among savers have been
condemned to the history books, asset accumulation
depends increasingly on fluctuations in value on the
market as well as on how prepared individuals are to
save and less on interest income.
Private households have decided to up their
savings efforts in response to the negative income
effects of the low interest rates. In North America,
western Europe, Japan and Australia alone - an area
which accounted for almost four-fifths of the global
asset base in total at the end of 2014 - financial as-
set accumulation was up by almost 16% on 2013 to
total just shy of EUR 1.9 trillion. Although this puts
the savings level roughly on a par with 2012, the rate
of growth in global financial assets slowed ever so
slightly last year compared with the two previous ye-
ars, when the growth rate came in at 8.1% (2012) and
9.6% (2013). This is largely because investors reaped
particular benefits from booming stock markets in
2012 and 2013.
1 In order to rule out exchange rate
distortions over time, the financial
assets were conver-ted into the national
currency based on the fixed exchange
rate at the end of 2014.
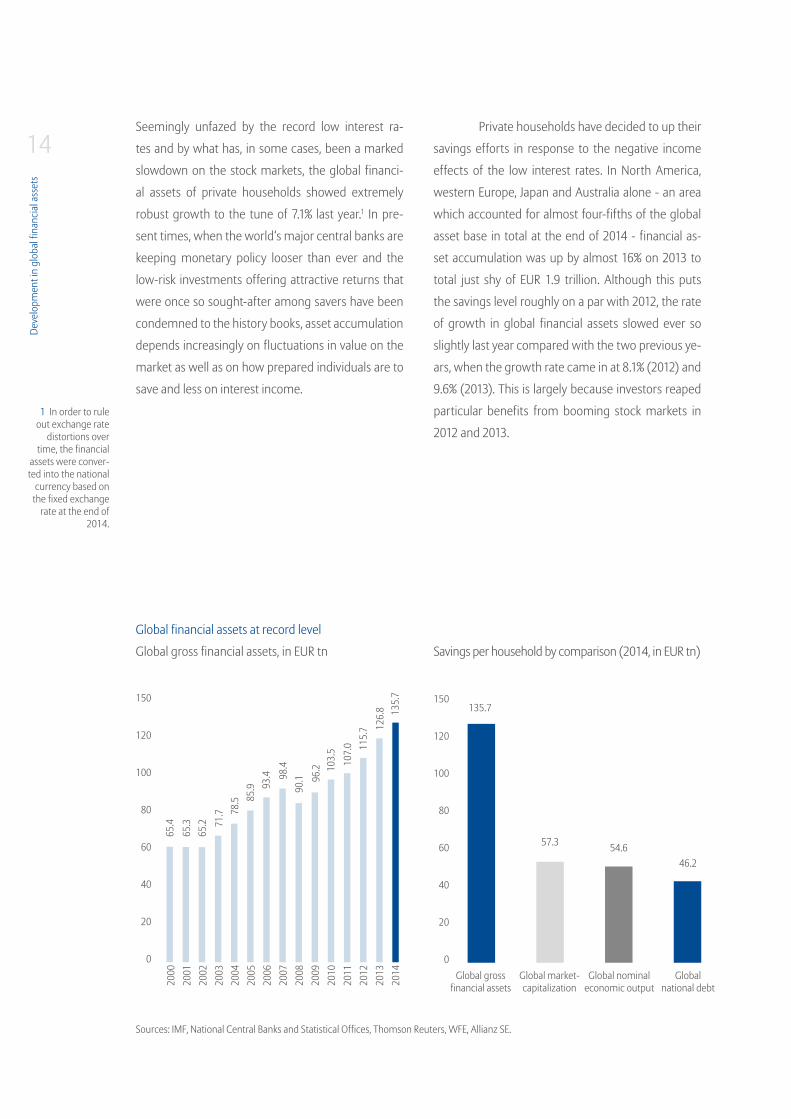
Global gross financial assets, in EUR tn Savings per household by comparison (2014, in EUR tn)
Global financial assets at record level
2000
2001
2002
2003
2004
2005
2006
2007
2008
2009
2010
2011
2012
2013
2014
150
120
100
80
60
40
20
0
150
120
100
80
60
40
20
0
Sources: IMF, National Central Banks and Statistical Offices, Thomson Reuters, WFE, Allianz SE.
65.4
65.3
65.2 71
.7 78.5 85
.9 93.4 98
.490
.1 96.2 10
3.5
107.
0 115.
7 126.
8 135.
7
Global grossfinancial assets
135.7
57.3 54.646.2
Global market-capitalization
Global nominal economic output
Global national debt
Allia
nz G
loba
l Wea
lth R
epor
t 201
5
15All in all, gross financial assets in the 53
countries included in our analysis came to EUR 135.7
trillion last year. This means that private savings ac-
counted for almost 250% of global economic output
and close to 240% of global market capitalization. In
theory, households could use their financial assets to
settle the aggregate sovereign debt of these coun-
tries almost three times over.
Private savings have more than doubled
since the end of 2000, rising at an average annual
growth rate of 5.3%. This means that the asset growth
of 7.1% in 2014 was actually well above the historical
average, a trend that can be seen across all asset clas-
ses. In a long-term analysis, asset growth has there-
fore been moving in tandem with nominal economic
output, which has been rising at an average rate of
5.2% a year during the same period. Taking the conti-
nuous growth in the global population into account,
the long-term growth rates in per capita terms drop
back by almost one percentage point to 4.5% p.a. for
wealth and 4.3% p.a. for economic output. Based on
an average global inflation rate of 2.6% p.a., this re-
sults in average real asset growth of 1.9% per year and
capita - meaning that more than half of annual asset
growth has been eaten away by inflation. At the end
of 2014, gross per capita financial assets at global le-
vel averaged EUR 27,480, with average nominal eco-
nomic output of EUR 11,060 per capita.
16 Box 1: Introduction of the European System of Accounts 2010The process associated with the introduction of the European System of Accounts 2010 (ESA 2010) in September
2014 involved updating and harmonizing the guidelines governing the preparation of many macroeconomic
statistics. In terms of its concept, the ESA 2010 is largely consistent with the global recommendations made by
the United Nations on national accounts, the System of National Accounts 2008 (SNA 2008).
The new requirements also apply to the national financial accounts. One change relates to private households:
under the ESA 2010 regulations, the two sectors ”Private households” and ”non-profit institutions serving
households” (NPISHs) are no longer grouped together, but are now reported separately. This also has implica-
tions for the Allianz Global Wealth Report, which takes data from the national financial accounts as a basis where
available. For many countries, however – particularly those outside of the European Union – there is no separate
data available for these sectors in general, or at least not at present. So in order to ensure global comparability, this
publication analyzes both sectors together under the heading ”Private households”.
But what would the impact be if the non-profit institutions serving households sector were no longer put in the
same category as private households? To examine this question, the section below analyzes the data on these
two sectors from those countries that publish separate statistics for private households and NPISHs. In addition to
22 EU member states2, Japan, Canada and Norway all report these statistics separately.
In terms of the overall volumes in this group of countries, private households alone accounted for an average of
97.6% of gross financial assets and 96.9% of liabilities in the combined sector at the end of 2014. So the non-profit
institutions serving households (churches, political parties, trade unions, etc.) only play a marginal role, albeit one
that varies from country to country. Whereas NPISHs in Lithuania, for example, only accounted for 0.6% of gross
financial assets, the same figure for Finland came in at 6.7%. In Poland, only 0.03% of liabilities were attributable to
NPISHs, whereas in Romania these organizations accounted for a share of 11%.
Last year, the growth in both the assets and liabilities of private households lagged well behind the non-profit
institutions serving households. On the assets side of the wealth balance sheet, households saw an increase of
4.8%, compared with as much as 8.2% for NPISHs. The growth differential was even more pronounced on the
liabilities side: the outstanding debt volume of private households swelled by only 1.7% as against 2013, whereas
the debt of non-profit institutions serving households increased by 6.4%. Looking at the two sectors combined,
however, the higher rates of growth for the NPISHs had barely any impact: the rate of asset growth came in at
4.9%, almost exactly the same rate as that reported for private households, while the rate of change in liabilities
was only marginally higher than the rate reported for private households alone, at 1.8%.
2 These coun-tries are Austria,
Belgium, Bulgaria, Croatia, Denmark,
Estonia, Finland, France, Germany, Greece, Hungary,
Latvia, Lithuania, the Netherlands, Poland,
Portugal, Romania, Sweden, Slovakia,
Slovenia, Spain and the Czech Republic.
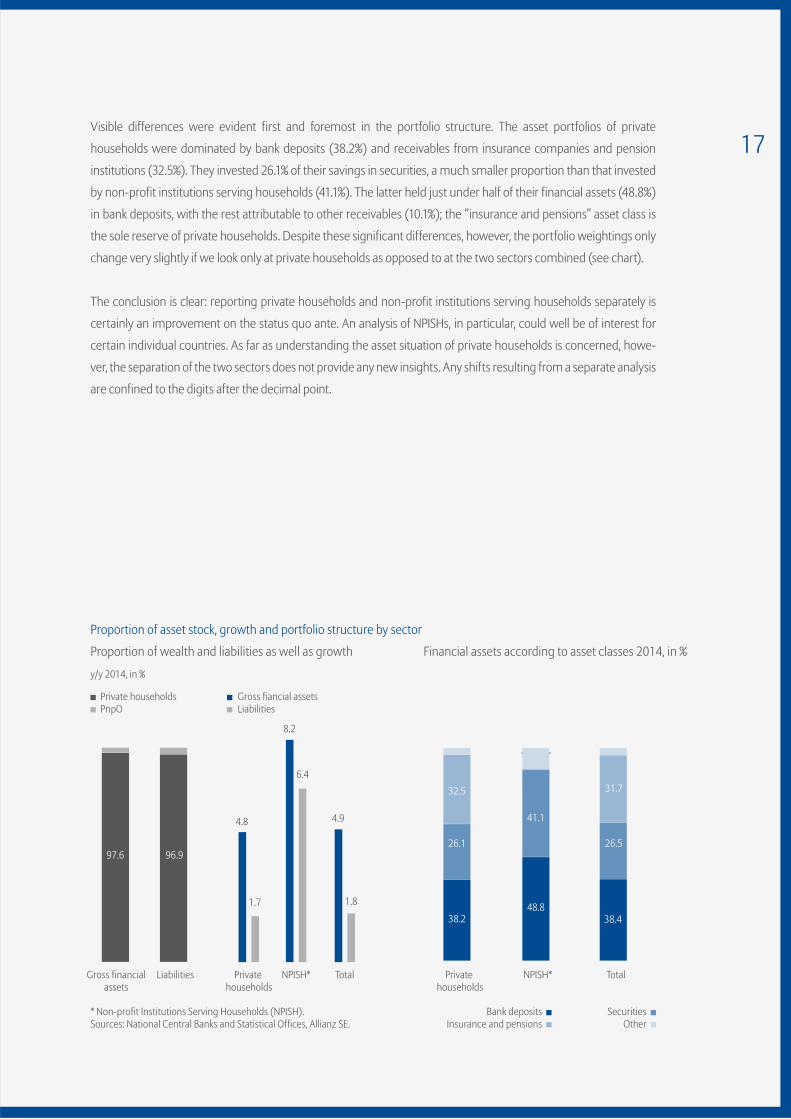
17Visible differences were evident first and foremost in the portfolio structure. The asset portfolios of private
households were dominated by bank deposits (38.2%) and receivables from insurance companies and pension
institutions (32.5%). They invested 26.1% of their savings in securities, a much smaller proportion than that invested
by non-profit institutions serving households (41.1%). The latter held just under half of their financial assets (48.8%)
in bank deposits, with the rest attributable to other receivables (10.1%); the ”insurance and pensions” asset class is
the sole reserve of private households. Despite these significant differences, however, the portfolio weightings only
change very slightly if we look only at private households as opposed to at the two sectors combined (see chart).
The conclusion is clear: reporting private households and non-profit institutions serving households separately is
certainly an improvement on the status quo ante. An analysis of NPISHs, in particular, could well be of interest for
certain individual countries. As far as understanding the asset situation of private households is concerned, howe-
ver, the separation of the two sectors does not provide any new insights. Any shifts resulting from a separate analysis
are confined to the digits after the decimal point.
Financial assets according to asset classes 2014, in %
Proportion of asset stock, growth and portfolio structure by sector
Proportion of wealth and liabilities as well as growth
y/y 2014, in %
* Non-profit Institutions Serving Households (NPISH).Sources: National Central Banks and Statistical Offices, Allianz SE.
97.6
Gross financialassets
96.9
Liabilities
4.8
1.7
Private households
8.2
6.4
NPISH*
4.9
1.8
Total NPISH*
41.1
48.8
Total
26.5
38.4
31.7
Private households
38.2
26.1
32.5
Private householdsPnpO
Gross fiancial assetsLiabilities
SecuritiesOther
Bank depositsInsurance and pensions
Deve
lopm
ent i
n gl
obal
fina
ncia
l ass
ets
18 Securities: The tide turns against the stock marketsAfter two consecutive years of spectacular stock
market developments, the tide started to turn on
the capital market again last year. Geopolitical ten-
sions stemming from the escalating Russia-Ukraine
conflict unsettled market players, putting pressu-
re on share prices in Europe, in particular. The Euro
Stoxx 50 virtually stagnated as against 2013 (+1.2%)
and even Germany‘s share index, the DAX, closed
the stock market year having gained only 2.7%. In
general, the European stock markets returned much
poorer performance than their counterparts in the
US and Japan, sometimes considerably so. The S&P
500, for example, gained 11.4% in the course of the
year, with the Japanese Nikkei still rising by 7.1% after
reporting a record increase of 56.7% in 2013.
At global level, securities assets expanded
by 7.5% last year, with the bulk of the growth mo-
mentum coming from Asia. Japanese households
benefited from value gains but also started investing
in this asset class again after withdrawing money
on the whole over the past two years. In the rest of
Asia, assets held in equities and fixed-income secu-
rities rose by 27% in total. China was the undisputed
front-runner in this respect, with the Shanghai stock
exchange gaining around 53% last year alone; assets
held in securities, which account for around 40% of
household portfolios, grew by more than 36%.
Developments in other regions of the world
were much less dynamic. Western Europe and North
America were virtually neck-and-neck in the growth
stakes, with an increase of 4.8% and 4.4% respectively,
while Oceania‘s securities assets increased by 5.7%.
In western Europe3, the growth was attributable to
value gains alone - especially on bonds - with the
asset class witnessing around EUR 100 billion in cash
outflows on balance.
The share of the global asset portfolio that
was attributable to securities remained stable in a
year-on-year comparison at just under 39%. Due to
the previous losses induced by the crisis and the re-
sulting tendency to flee towards supposedly low-risk
investments, this proportion was still three percen-
tage points down on the 2007 level. It was not until
2013 that the value of securities assets held by private
households living in the world‘s advanced economies
bounced back to the pre-crisis level, whereas at glo-
bal level, these losses had already been fully compen-
sated for by 2012. Global securities assets totaled EUR
52.6 trillion at the end of 2014.
3 The cash inflows/outflows relate to
the western Europe region, excluding
Switzerland.
Allia
nz G
loba
l Wea
lth R
epor
t 201
5
19Bank deposits: Inflows des-pite low interest ratesAs a ”safe haven” and a source of guaranteed liquidi-
ty, bank deposits have become increasingly popular
as an asset class since the outbreak of the economic
and financial crisis. Global overnight money, term
deposits and savings deposits totaled around EUR 38
trillion at the end of 2014, up by a good 52% on the
level seen in 2007.
Despite rock-bottom interest rates and va-
lue losses in real terms, most savers once again han-
ded over a large part of their savings to banks last
year. This brought the global rate of growth to 6.5%
in 2014, slightly ahead of the long-term average (6.0%
p.a.) Compared with the previous year, growth picked
up particular speed in North America, where it rose
from 4.3% to 6.6%; the ”fresh” investment funds that
private households put into bank deposits were up by
as much as 43% on 2013. In a global context this asset
class also showed above-average growth in Oceania,
where the rate of expansion came in at 8.7%. Fund
inflows in Australia were up by a good 20% year-on-
year. In western Europe and Japan, on the other hand,
this asset class grew by only 3.0% and 2.0% respec-
tively, with some European crisis countries, including
Greece in particular but also Spain, still suffering from
outflows. Latin America and Asia (ex Japan), on the
other hand, achieved growth of 12.7% and 12.1% re-
spectively last year, albeit from what was still a very
low starting point. In per capita terms, Latin Ameri-
can households held an average of EUR 1,280, whe-
reas the global overnight money, term deposits and
savings deposits held by Japanese households, for
example, averaged EUR 50,720 per capita.
Insurance policies and pen-sions: Unflagging popularity The third-largest asset class in the asset portfolio,
namely private household claims vis-à-vis insurance
companies and pension institutions, experienced
strong growth totaling 7.2% at global level in the
course of 2014, up again in a year-on-year compari-
son. This growth, however, was driven not only by va-
luation gains, but also by substantial fund inflows. In
fact, the inflow of funds into this asset class was hig-
her than into any other for the second year running.
A look at this asset class once again reveals
significant differences in the pace of growth in an in-
terregional comparison. As expected, Latin America
and Asia (ex Japan) topped the growth league last
year, with 13.6% and 11.1% respectively. Western Eu-
rope also, however, achieved a double-digit increase
(+11.1%), largely due to the strong development in
the UK and the Netherlands. North America and Oce-
ania were in the middle of the rankings, with growth
rates of 4.8% and 8.9% respectively. Eastern Europe,
on the other hand, was hit by a sizable slump of -7.9%,
although this is due solely to the nationalization of
some of the retirement provision funds managed by
private pension funds in Poland.

Deve
lopm
ent i
n gl
obal
fina
ncia
l ass
ets
20The global rate of change last year was well
ahead of the average growth rate for the past 14 years
of 5.6% p.a. In a global analysis, private households
have kept the share of their financial assets invested
in insurance and pensions relatively constant throug-
hout this period; 31% of their assets were tied up in
these products last year. In total, private household
claims vis-à-vis insurance companies and pension in-
stitutions tallied up to around EUR 42 trillion - a good
two-fifths more than before the outbreak of the glo-
bal economic and financial crisis.
Latin America and eastern Europe fall behindIf we compare asset development in the individual re-
gions, the fairly weak development in Latin America
in a historical context is one trend that really stands
out: after achieving asset growth of 6.5% in 2013, the
region continued to lag well behind the emerging
market average (+17% as against 2013) last year, too,
when assets expanded by 7.7%.
The slowdown in asset development went
hand-in-hand with a decline in economic activity. Af-
ter adjustments for inflation, gross domestic product
in the Latin American countries included in our ana-
lysis rose by only 1.2% last year.
Robust growth in all asset classes
Change in asset classes, in % Asset classes as % of gross financial assets
6.5
7.5
7.2
7.1
5.6
5.3
6.0
4.8Securities
Gross financialassets
Insurance and pensions
Bank deposits
2000
2007
2008
2009
2010
2011
2012
2013
2014
2014/2013CAGR* 2001-2014
*CAGR = Compound Annual Growth Rate.Sources: National Central Banks and Statistical Offices, Allianz SE.
25 30 29 29 30 29 28 28
42 35 36 36 35 36 39 39
30 32 32 32 33 32 31 31
2642
30
SecuritiesOther
Bank depositsInsurance and pensions
Allia
nz G
loba
l Wea
lth R
epor
t 201
5
21In a long-term comparison, however, the
slowdown witnessed over the past two years starts
to look less significant. The assets of Latin American
households, which grew at an average annual rate
of 12.2% in the period between 2001 and 2014, have
increased fivefold since the end of 2000. During this
period, the region‘s slice of the global gross financial
asset cake has more than doubled, coming in at 2.0%
at the end of 2014.
The pace of growth slowed in eastern Euro-
pe, too, in 2014, with household savings rising by 7.8%
compared with 2013. The rate of growth in the pre-
vious year had come in at 11.7%. Generally, the asset
accumulation process in the region has shifted back
a gear, or in some cases two gears, since late 2007. In
the eastern European EU member states, the average
annual growth rate has slid from a total of 15.1% p.a.
in the period between 2001 and 2007, to 5.8% p.a.
over the last seven years.
Last year, in particular, brought a marked
slowdown in the eastern European countries out-
side of the European Union as well. In Russia alone, a
country which is home to more than two-fifths of the
total financial assets in this group of countries, the
rate of growth in 2014 was not even half as high as in
the previous year, at 8.5%. Looking at the long-term
trend, this group of countries tops the growth table
with average asset growth of almost 24% p.a. - fas-
ter than in any other region. If, however, we include
the eastern European EU members in the compari-
son, then the eastern European region as a whole is
forced to hand the title of last year‘s growth champi-
on over to Asia (ex Japan) - albeit in a close finish: in
the Far East, assets have increased more than sixfold
since the turn of the millennium with an average
growth rate of 14.1% p.a., whereas the eastern Euro-
pean region as a whole has achieved average long-
term growth of 13.3% p.a.
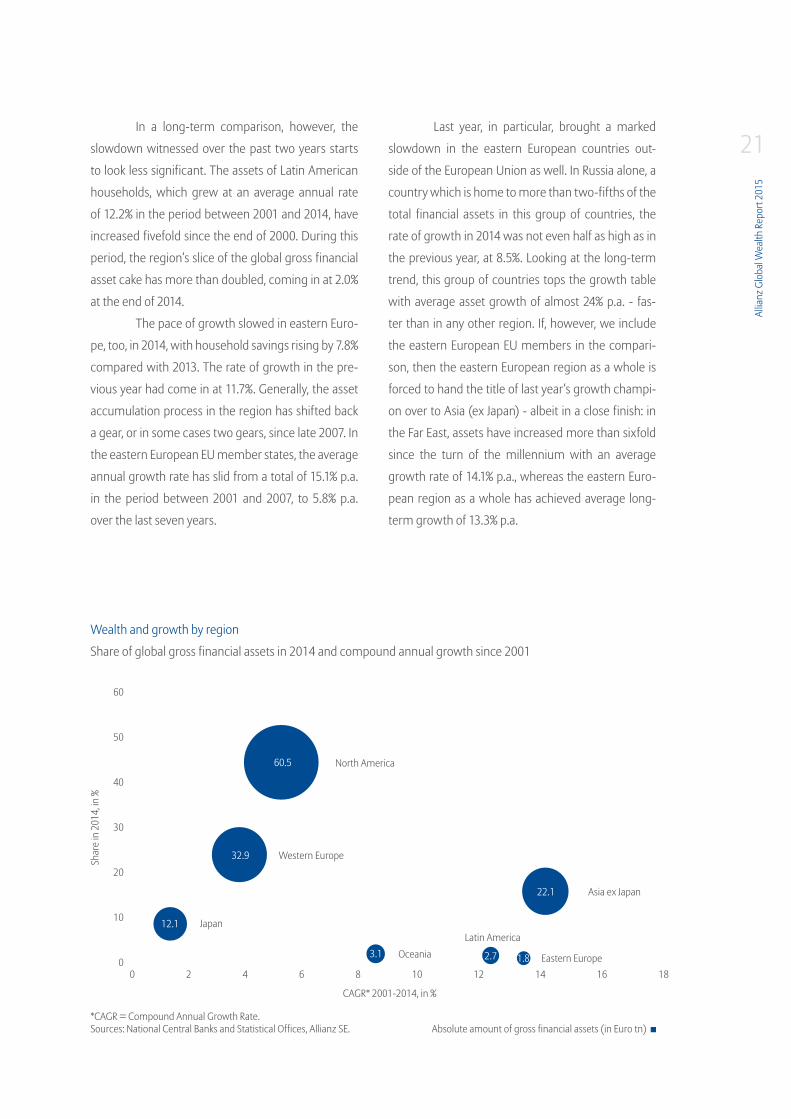
Wealth and growth by region
Share of global gross financial assets in 2014 and compound annual growth since 2001
CAGR* 2001-2014, in %
*CAGR = Compound Annual Growth Rate.Sources: National Central Banks and Statistical Offices, Allianz SE.
North America
Western Europe
Asia ex Japan
Eastern EuropeOceaniaLatin America
Japan
60
50
40
30
20
10
00 2 4 6 8 10 12 14 16 18
Absolute amount of gross financial assets (in Euro tn)
Shar
e in
201
4, in
%
12.1
32.9
60.5
22.1
3.1 2.7 1.8
Deve
lopm
ent i
n gl
obal
fina
ncia
l ass
ets
22Asia (ex Japan) came top of the table not
just in a long-term comparison, but also in terms of
developments last year. In 2014, asset growth in the
region came in at 16.6%, which was not just ahead of
the historical average but also outstripped the global
growth rate by more than double. As explained abo-
ve, the main driving force behind this trend was the
stark increase in securities assets of 27%, particularly
in China.
Households step up their savings effortsThe pace at which financial assets have grown since
the turn of the millennium has been much more se-
date in the richer parts of the world, where private
households already have a substantial asset cushion
behind them. Japan comes bottom of the league in
this respect: the average growth rate for the period
from 2001 to 2014 came in at 1.3% p.a., a long way off
the average rate for the industrialized nations of 4.3%.
There are two main reasons behind the
weak asset development in Japan: first, Japanese
households hold the lion‘s share of their financial as-
sets, or around 53%, in bank deposits. The low interest
rates that have now been on the scene for decades,
however, mean that this asset class does not provide
savers with adequate nominal returns. Second, it has
been virtually impossible to generate any value gains
on the stock market; the first decade of the new mil-
lennium saw the Nikkei fall back to levels which, in
some cases, were last seen in the early 1980s. This
situation has, however, turned around over the past
few years, which mark the start of what is known as
”Abenomics”. Whereas Japan‘s leading index was still
down by almost 25% on the 2000 level at the end of
2012, only two years later - thanks to a spectacular
increase of almost 57% in 2013 and robust develop-
ment last year - it had exceeded this level by almost
27%. Over the past two years alone, the assets of pri-
vate households held in equities and fixed-income
securities have shot up by a good 37% to total just
under EUR 2.2 trillion.
In the Asia-Pacific region, households in
Oceania enjoyed asset growth of 7.7% last year, ahead
of the average for the world‘s advanced regions. This
solid performance applied to all three major asset
classes, with insurance policies and pensions wit-
nessing the biggest increase, namely 8.9%. Thanks,
not least, to the last commodities boom, the long-
term average growth rate in the region is also fairly
high, at 8.3%.
The development in gross financial assets in
North America was positively subdued in compari-
son. In the period between 2001 and 2014, the assets
of private households grew at an average rate of 5.1%
a year. US households had to digest painful losses du-
ring the financial crisis of 2008 due to their more risk-
prone asset structure. It ultimately took three years
to make up again for the biggest asset slump of the
post-war era.
Bank deposits proved a popular choice
among savers last year in North America as well, with
this asset class witnessing greater growth than any
other. All in all, the region achieved asset growth of
4.8% last year, with financial asset accumulation up
by 17%. Among other things, this trend reflects the
improved situation on the labor market and positive
income development.
Allia
nz G
loba
l Wea
lth R
epor
t 201
5
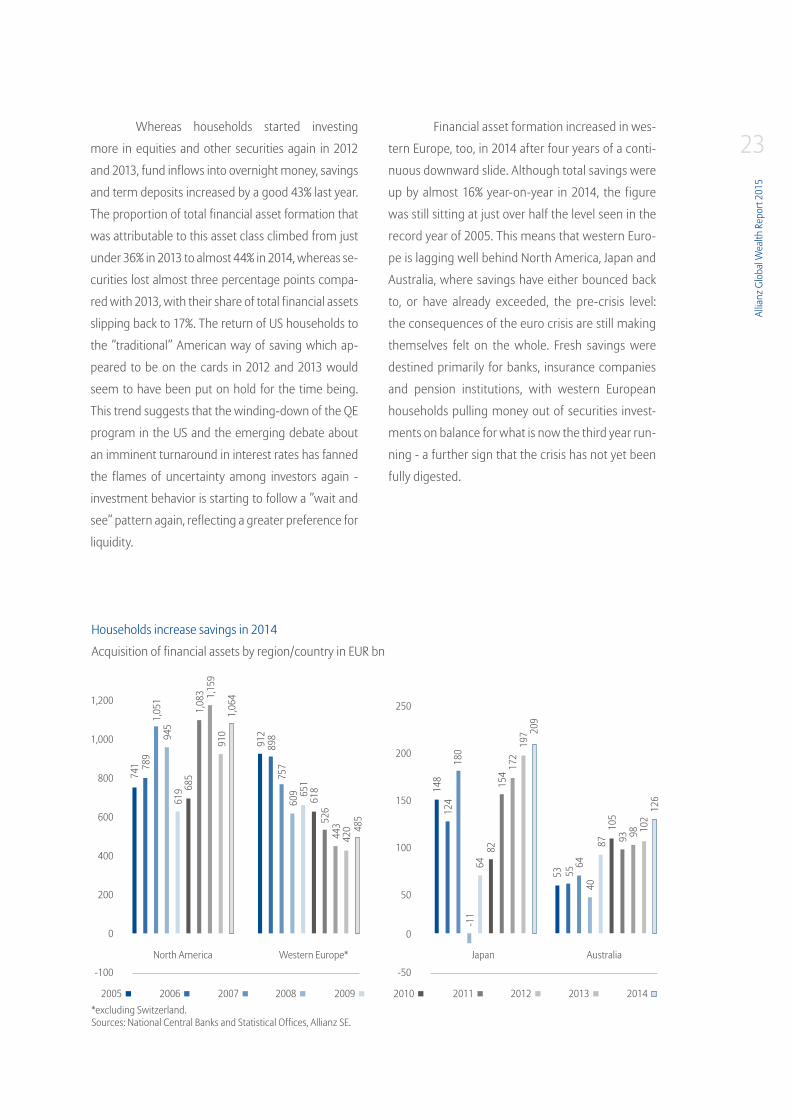
23Whereas households started investing
more in equities and other securities again in 2012
and 2013, fund inflows into overnight money, savings
and term deposits increased by a good 43% last year.
The proportion of total financial asset formation that
was attributable to this asset class climbed from just
under 36% in 2013 to almost 44% in 2014, whereas se-
curities lost almost three percentage points compa-
red with 2013, with their share of total financial assets
slipping back to 17%. The return of US households to
the ”traditional” American way of saving which ap-
peared to be on the cards in 2012 and 2013 would
seem to have been put on hold for the time being.
This trend suggests that the winding-down of the QE
program in the US and the emerging debate about
an imminent turnaround in interest rates has fanned
the flames of uncertainty among investors again -
investment behavior is starting to follow a ”wait and
see” pattern again, reflecting a greater preference for
liquidity.
Financial asset formation increased in wes-
tern Europe, too, in 2014 after four years of a conti-
nuous downward slide. Although total savings were
up by almost 16% year-on-year in 2014, the figure
was still sitting at just over half the level seen in the
record year of 2005. This means that western Euro-
pe is lagging well behind North America, Japan and
Australia, where savings have either bounced back
to, or have already exceeded, the pre-crisis level:
the consequences of the euro crisis are still making
themselves felt on the whole. Fresh savings were
destined primarily for banks, insurance companies
and pension institutions, with western European
households pulling money out of securities invest-
ments on balance for what is now the third year run-
ning - a further sign that the crisis has not yet been
fully digested.
Acquisition of financial assets by region/country in EUR bn
Households increase savings in 2014
*excluding Switzerland.Sources: National Central Banks and Statistical Offices, Allianz SE.
1,200
1,000
800
600
400
200
0
-100
250
200
150
100
50
0
-50
North America JapanWestern Europe* Australia
2005 20092006 20102007 2011 20132008 2012 2014
741
148
53 5564
4087 93 98 10
212
6
10512
418
0
6482
154
172
197 20
9
-11
789
1,05
194
561
9 685
910
912
898
757
609 65
161
852
644
342
0 485
1,08
3 1,15
9
1,06
4
Deve
lopm
ent i
n gl
obal
fina
ncia
l ass
ets
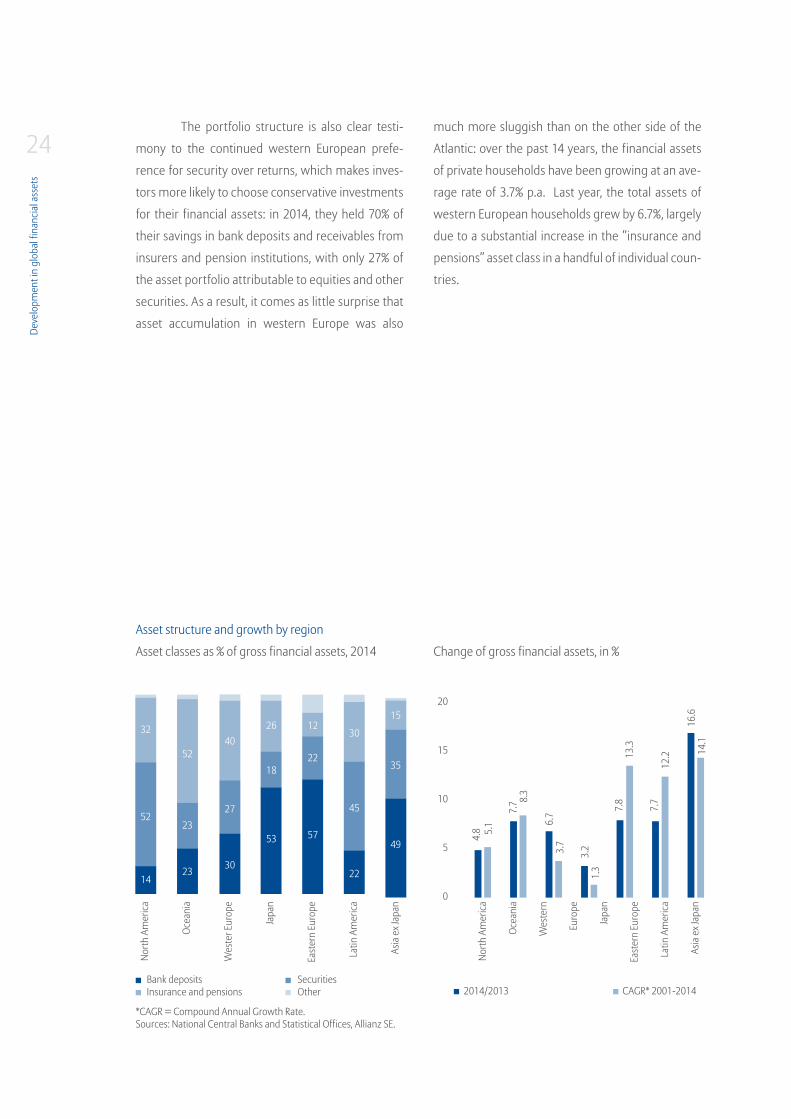
24The portfolio structure is also clear testi-
mony to the continued western European prefe-
rence for security over returns, which makes inves-
tors more likely to choose conservative investments
for their financial assets: in 2014, they held 70% of
their savings in bank deposits and receivables from
insurers and pension institutions, with only 27% of
the asset portfolio attributable to equities and other
securities. As a result, it comes as little surprise that
asset accumulation in western Europe was also
much more sluggish than on the other side of the
Atlantic: over the past 14 years, the financial assets
of private households have been growing at an ave-
rage rate of 3.7% p.a. Last year, the total assets of
western European households grew by 6.7%, largely
due to a substantial increase in the ”insurance and
pensions” asset class in a handful of individual coun-
tries.
Asset structure and growth by region
Asset classes as % of gross financial assets, 2014 Change of gross financial assets, in %
*CAGR = Compound Annual Growth Rate.Sources: National Central Banks and Statistical Offices, Allianz SE.
North
Am
erica
Ocea
nia
Wes
ter E
urop
e
Japa
n
East
ern
Euro
pe
Latin
Am
erica
Asia
ex J
apan
North
Am
erica
Ocea
nia
Wes
tern
Euro
pe
Japa
n
East
ern
Euro
pe
Latin
Am
erica
Asia
ex J
apan
14
52
52
32
23
23 30
53 57
22
49
35
15
45
30
22
12
18
26
27
40
CAGR* 2001-20142014/2013
20
15
10
5
0
SecuritiesOther
Bank depositsInsurance and pensions
5.1
4.8
8.3
7.7
6.7
3.2
7.8
7.7
16.6
13.3
12.2 14
.1
3.7
1.3

Allia
nz G
loba
l Wea
lth R
epor
t 201
5
25China overtakes Japan
Although the developed countries have shown much
lower levels of asset growth, the weightings on the
global asset map are only shifting very slowly. Since
the end of 2000, the proportion of global gross fi-
nancial assets that is attributable to North America
and western Europe has fallen by around seven per-
centage points. That said, both regions still accoun-
ted for a combined total of almost 70% of the global
asset base at the end of 2014. With a ”global share”
of almost 45%, North America was the richest regi-
on on the planet. In Asia-Pacific, a further 8.9% was
concentrated in Japan, and 2.3% in Australia and New
Zealand. This means that, all in all, a good four-fifths
of global financial assets are still in the hands of priva-
te households living in the world‘s richer areas, even
though these households make up less than one-fifth
(19%) of the Earth‘s population.
The remaining 19.6% or so of the world‘s fi-
nancial assets are distributed among Latin America
(2.0%), eastern Europe (1.3%) and the other Asian
countries (just under 16.3%), i.e. among a total of
3.96 billion people. Last year alone, however, their
share of global financial assets rose by 1.4 percen-
tage points and it has almost trebled in the space of
the last 14 years. One particular development in Asia
really stood out last year: China‘s total gross financial
assets had exceeded those of Japan for the first time
by the end of 2014. But the fact that Japan has been
overtaken by China is not only due to China‘s better
performance last year. The devaluation of the Japa-
nese yen also had its part to play.
Compared with economic output, however,
the gains made by the up-and-coming economies
on the asset landscape start to look less impressive.
In terms of gross domestic product, the weightings
have already shifted further away from the richer re-
gions and much further towards to the world‘s poo-
rer regions. By way of example, the proportion of glo-
bal gross domestic product attributable to the two
heavyweights, North America and western Europe,
was not only far lower than their share of global as-
sets, coming in at a good 54% at the end of 2014; the
decline to the tune of around 14 percentage points
since the end of 2000 was also far more pronounced
than the extent to which their share of the asset base
has contracted. Vice versa, the world‘s poorer regions
have upped their share of global economic activity by
almost 21 percentage points, to 37.2%, during the
same period, the share in assets rose by only 13 per-
centage points to a total of 19,6%. The increasing role
Deve
lopm
ent i
n gl
obal
fina
ncia
l ass
ets
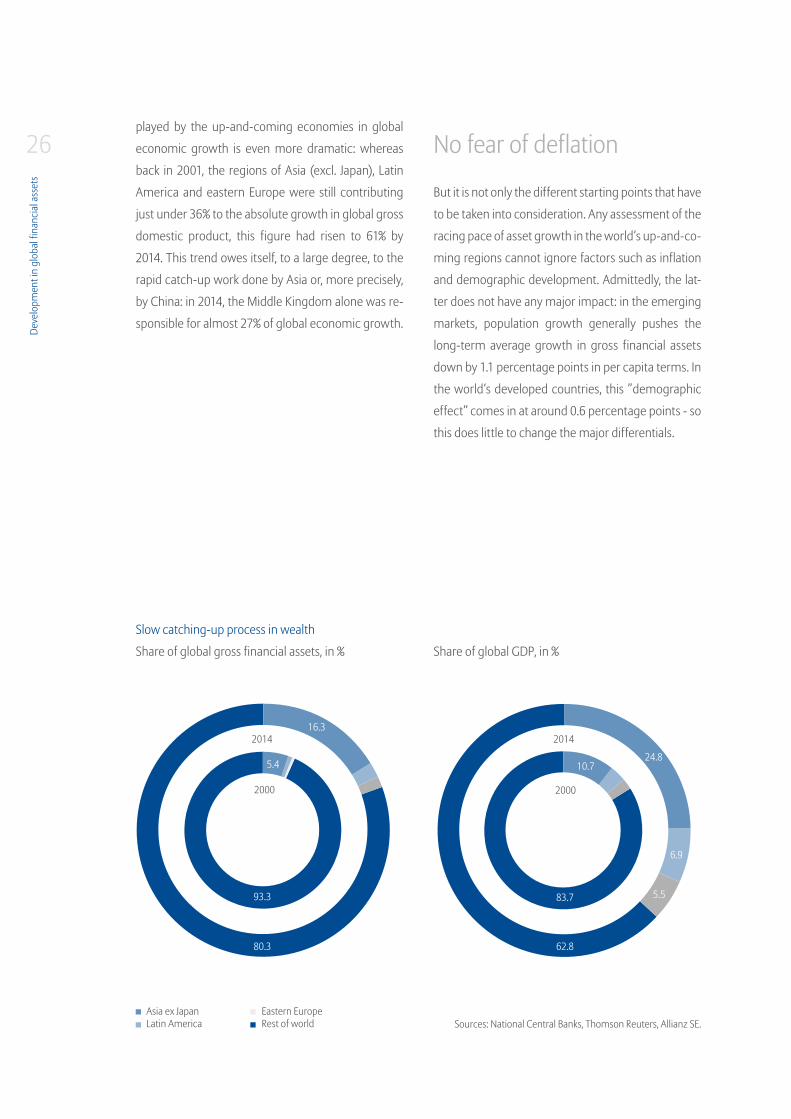
26played by the up-and-coming economies in global
economic growth is even more dramatic: whereas
back in 2001, the regions of Asia (excl. Japan), Latin
America and eastern Europe were still contributing
just under 36% to the absolute growth in global gross
domestic product, this figure had risen to 61% by
2014. This trend owes itself, to a large degree, to the
rapid catch-up work done by Asia or, more precisely,
by China: in 2014, the Middle Kingdom alone was re-
sponsible for almost 27% of global economic growth.
No fear of deflation
But it is not only the different starting points that have
to be taken into consideration. Any assessment of the
racing pace of asset growth in the world‘s up-and-co-
ming regions cannot ignore factors such as inflation
and demographic development. Admittedly, the lat-
ter does not have any major impact: in the emerging
markets, population growth generally pushes the
long-term average growth in gross financial assets
down by 1.1 percentage points in per capita terms. In
the world‘s developed countries, this ”demographic
effect” comes in at around 0.6 percentage points - so
this does little to change the major differentials.
Share of global gross financial assets, in % Share of global GDP, in %
Slow catching-up process in wealth
Sources: National Central Banks, Thomson Reuters, Allianz SE.
2000
93.3
5.4 10.724.8
6.9
5.5
16.3
80.3 62.8
83.7
2014
Asia ex Japan Latin America
Eastern EuropeRest of world
2000
2014
Allia
nz G
loba
l Wea
lth R
epor
t 201
5
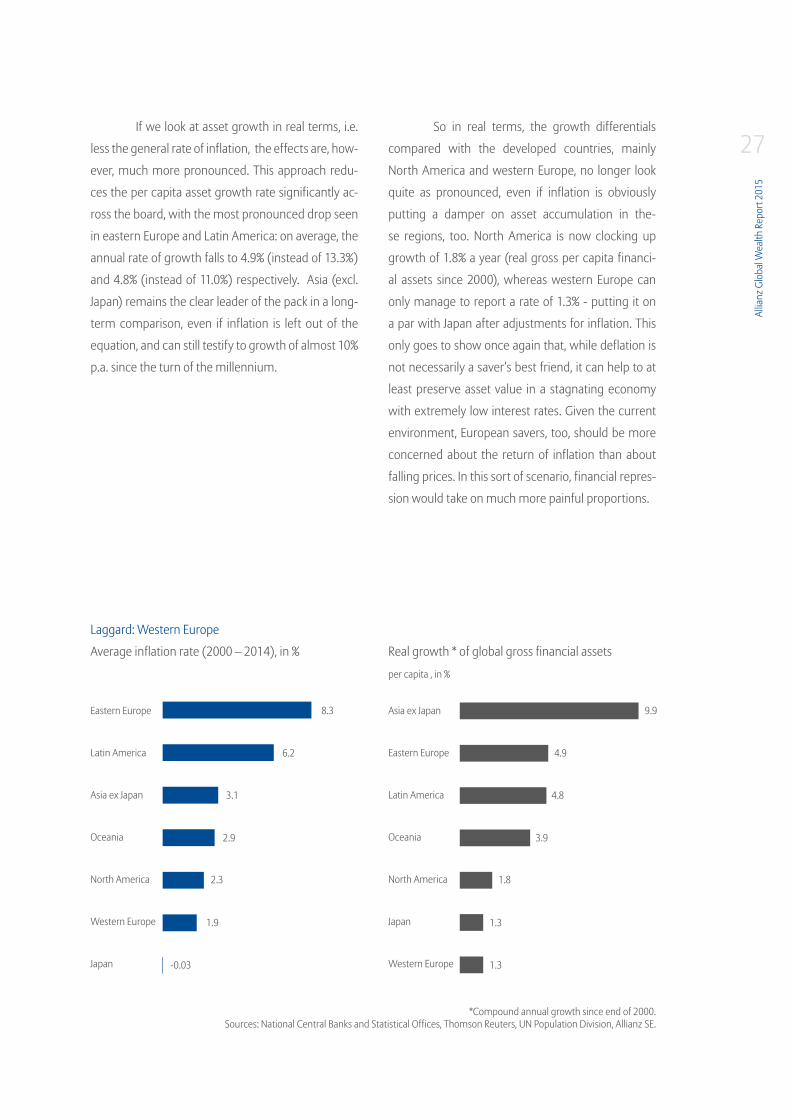
27If we look at asset growth in real terms, i.e.
less the general rate of inflation, the effects are, how-
ever, much more pronounced. This approach redu-
ces the per capita asset growth rate significantly ac-
ross the board, with the most pronounced drop seen
in eastern Europe and Latin America: on average, the
annual rate of growth falls to 4.9% (instead of 13.3%)
and 4.8% (instead of 11.0%) respectively. Asia (excl.
Japan) remains the clear leader of the pack in a long-
term comparison, even if inflation is left out of the
equation, and can still testify to growth of almost 10%
p.a. since the turn of the millennium.
So in real terms, the growth differentials
compared with the developed countries, mainly
North America and western Europe, no longer look
quite as pronounced, even if inflation is obviously
putting a damper on asset accumulation in the-
se regions, too. North America is now clocking up
growth of 1.8% a year (real gross per capita financi-
al assets since 2000), whereas western Europe can
only manage to report a rate of 1.3% - putting it on
a par with Japan after adjustments for inflation. This
only goes to show once again that, while deflation is
not necessarily a saver‘s best friend, it can help to at
least preserve asset value in a stagnating economy
with extremely low interest rates. Given the current
environment, European savers, too, should be more
concerned about the return of inflation than about
falling prices. In this sort of scenario, financial repres-
sion would take on much more painful proportions.
Average inflation rate (2000 – 2014), in % Real growth * of global gross financial assets
per capita , in %
Laggard: Western Europe
*Compound annual growth since end of 2000.Sources: National Central Banks and Statistical Offices, Thomson Reuters, UN Population Division, Allianz SE.
Eastern Europe
Latin America
Asia ex Japan
Oceania
North America
Western Europe
Japan
Asia ex Japan
Eastern Europe
Latin America
Oceania
North America
Japan
Western Europe
4.9
9.9
4.8
3.9
1.8
1.3
1.3
8.3
6.2
3.1
2.9
2.3
1.9
-0.03

28 Box 2: Differences in the impact of the low interest rates within the eurozoneThe zero interest rate policy pursued by the ECB and, in particular, the purchase of securities (QE) are having a
direct and indirect impact on the incomes and assets of private households in the euro area. As a result, they
automatically have implications for distribution policy, both within and between countries.
We had already looked at the impact the low interest rates were having on the incomes of private households in
the eurozone last year. This time round, we have enhanced this analysis considerably. This year‘s report looks not
only at the direct impact that changes in the interest rates for bank deposits and loans are having on incomes, but
also at the effect the low interest rates are having on asset prices and the individual implications for the portfolios
of different income groups.
When it comes to the direct income effects, i.e. the balance of interest losses on the deposit side and interest
gains on the credit side, the situation is more or less the same as it has been in previous years. We are comparing
the actual interest payments and income with hypothetical ones. To get those, on loans and deposits volumes
we apply the reference interest rates at pre-crisis level (average 2003-2008). All in all, private households in the
euro area are benefiting from the zero interest rate policy. Over the past six years (2010 to 2015, inclusive), the
cumulative ”gains” have come in at EUR 130 billion (1.4 percent of GDP) or EUR 400 per capita. Among the biggest
winners are the peripheral countries such as Portugal, Greece and Spain. In all of these countries, the cumulative
”interest gains” have exceeded EUR 1,200 per capita since 2010; in Portugal and Greece, these gains came in at
around 12 percent of GDP, compared with six percent in Spain. Germany, on the other hand (together with Bel-
gium and Slovakia), ranks among the losers: German households have certainly had to digest ”losses” over the
past six years, with the figure amounting to a total of EUR 367 per capita or EUR 29.8 billion (-1.1 percent of GDP).

29
This means that the ECB‘s zero interest rate policy is having a clear redistribution effect between the EMU countries
via the income channels. In this respect, the idea of a ”transfer union” is already a reality. It is a different story when
it comes to the asset effects. These have not only been relatively limited over the entire period since 2010 - private
households have only lost out on EUR 130 billion (one percent of the assets included in this analysis). Rather, the
differences between the individual countries are also minimal. Whereas Italy, for instance, profited (+ EUR 36bn),
the losses in the Netherlands were particularly high (- EUR 78bn); German households recorded a loss of EUR 55bn.
The only changes emerge in a shorter-term analysis: since the ECB launched its explicit euro rescue policy in 2012,
eurozone private households in all asset classes have been generating ”gains” of EUR 1100 billion (8.2 percent); this
is primarily due to the positive developments on the stock market.
Total income effects as percentage of GDP, 2014
12.0 %
10.0 %
8.0 %
6.0 %
4.0 %
2.0 %
0.0%
-2.0 %
-4.0 %
Euro
zone
Germ
any
Fran
ce
Spai
n
Italy
Austr
ia
Belg
ium
Finla
nd
Gree
ce
Irela
nd
Neth
erla
nds
Portu
gal
1.4 %1.1 %
6.0 %
3.6 %
0.2 %
6.1 %
12.0 % 11.9 %
2.9 %
1.1 %
-1.1 %
-2.3 %
Sources: ECB, Eurostat, own calculations.
30To find out whether and to which extent the low interest rates are having the impact on distribution across dif-
ferent categories of households, we applied the same approach as for the overall income effect calculations. We
used the weighted average interest rates on loans and deposits and a six-year pre-crisis average as a reference,
and we applied them on the simple average volumes distributed according to households’ average income.4
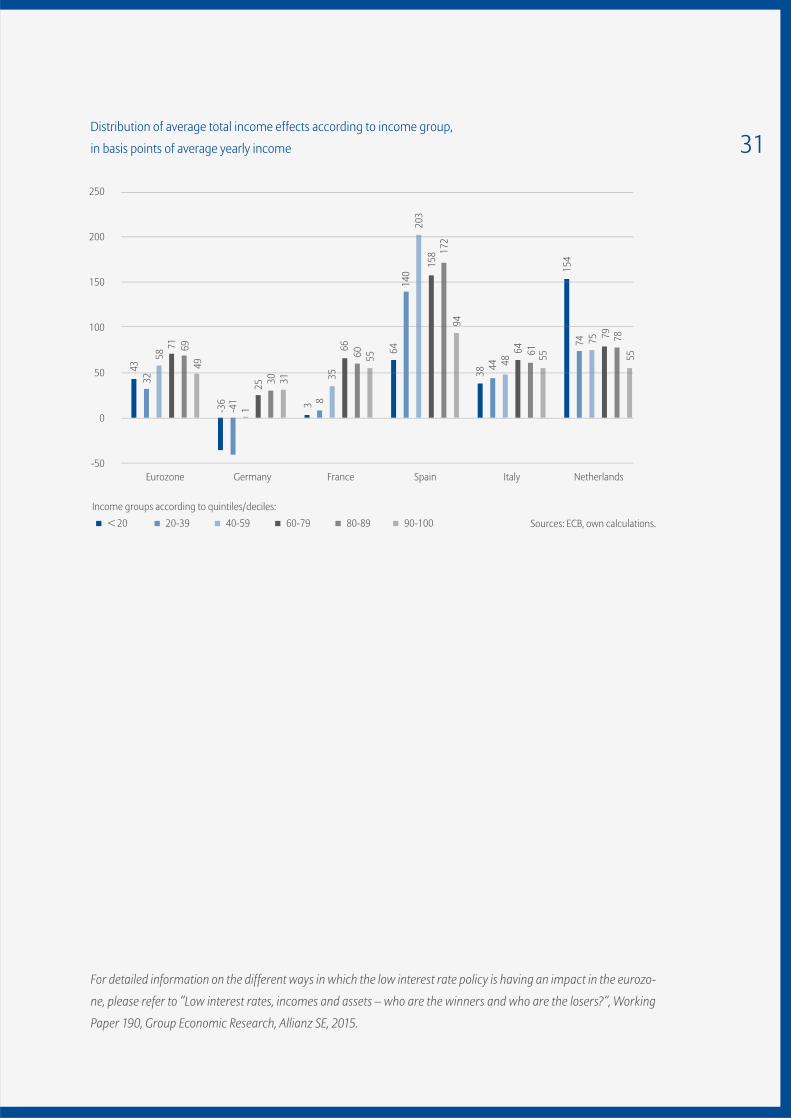
So how are the income effects, in particular, distributed among the individual income groups? At European level,
while the positive income effects continue to increase the further up the income ladder we go, it is the upper-mid
income group that is benefitting the most in relative terms. Nevertheless, the distribution effects vary conside-
rably from country to country. In Germany, the upper income groups are also reaping the most benefits in relative
terms, while the lower groups are either benefiting the least or actually losing out. No other EMU country shows
the same sort of ”redistribution from the bottom to the top”. In Germany‘s neighboring country, the Netherlands,
for example, the effect is the exact opposite: here, the lowest income group is enjoying by far the biggest income
effects in relative terms, with the highest group benefiting the least. In Spain and (to a lesser extent) in France,
on the other hand, the positive income effects are concentrated in the middle class, with the top ten percent of
earners benefiting less from the zero interest rate policy. Finally, Italy stands out based on its relatively egalitarian
distribution of income effects. So at the end of the day, although the zero interest rate policy is having a real im-
pact in terms of distribution policy, the effects are not as prominent if we look at the EMU region as a whole. The
differences at country level, on the other hand, are significant, although no uniform pattern can be identified. In
some countries, the lower income groups are benefiting the most, whereas in others, it is the income groups in
the mid-field that are reaping the benefits. But there is only one country in which the top income decile is bene-
fiting the most in relative terms, and that country is Germany.
With regards to the wealth effect among households in the eurozone, all of the categories recorded a cumulative
loss in 2010-2015. Bottom quintile households are affected to a much lower extent both absolutely, and relatively,
having less of considered assets in their portfolio in comparison with the top decile household category. Thus,
putting the income and wealth effects together, the distribution pattern is confirmed, with mid-income groups
benefitting the most.5
So all in all, the impact of the ECB‘s zero interest rate policy is an inconsistent one. The policy‘s implications only
emerge upon closer inspection, namely when we compare countries, wealth classes and income groups. The
picture for Germany in particular, however, is a rather negative one: German households rank among the ”losers”
in terms of both income and asset effects; what is more, the zero interest rate policy is favoring the country‘s
higher income groups - albeit not to too great an extent. So it comes as little surprise that the ECB is particularly
criticized in Germany for its monetary policy.
4 The data come from the ECB’s
Eurosystem Household Finance
and Consumption Survey.
5 However, in the shorter term since 2012, the highest
income group – thanks to large
equity holdings – is the clear ”winner”.
31
For detailed information on the different ways in which the low interest rate policy is having an impact in the eurozo-
ne, please refer to ”Low interest rates, incomes and assets – who are the winners and who are the losers?”, Working
Paper 190, Group Economic Research, Allianz SE, 2015.
Distribution of average total income effects according to income group,
in basis points of average yearly income
Eurozone France Spain Italy NetherlandsGermany
250
200
150
100
50
0
-50
20-39 40-59 60-79 80-89 90-100< 20 Sources: ECB, own calculations.
Income groups according to quintiles/deciles:
43
-36
-41
1
3258
71 6949
25
3
6414
020
315
8 172
94
835
66 60 55
38
154
44 4864 61 55
74 75 79 7855
30 31

Development in global liabilities
Normalization in
debt growth

Deve
lopm
ent i
n gl
obal
liab
ilitie
s
34As is to be expected, households in richer regions not
only account for the lion‘s share of the world‘s finan-
cial assets, but also bear the majority of the global
debt burden: at the end of 2014, around 71% of global
debt was being carried on the collective shoulders of
North America, western Europe and Oceania, which
is almost exactly the same as the share of gross fi-
nancial assets that is attributable to these regions. A
further 7.8% is being borne by Japanese households,
with 15.5% attributable to other Asian countries. With
a share of 2.0%, eastern Europe is bottom of the debt
league, followed by Latin America (3.3%) in second-
last place. While this gives Asia (incl. Japan) a share of
global debt that is slightly below average - compared
with the continent‘s share of global assets - the situ-
ation is the other way round entirely in the other two
regions.
All in all, global liabilities climbed by 4.3%
year-on-year in 2014 to total EUR 35.2 trillion. This puts
private household debt significantly below that shoul-
dered by governments and the corporate sector. Last
year, however, global debt growth reached the highest
level seen since the outbreak of the crisis; it is in the
process of gradually returning to normal. This also
comes hand-in-hand with a split between the world‘s
richer and poorer areas in terms of where the develop-
ment is headed: whereas the high rate of debt growth
tailed off slightly in eastern Europe, Latin America and
Asia (ex. Japan) compared with 2013, it increased again
ever so slightly in North America, Oceania, western Eu-
rope and Japan; with the exception of Japan, however,
the rates of change were still at a much lower level
than in the years prior to the crisis. As a result, private
households in the world‘s developed countries remain
Liabilities and growth by region
Share of global debt burden 2014 and compound annual growth since 2001
CAGR* 2001 - 2014, in %
*CAGR = Compound Annual Growth Rate.Sources: National Central Banks and Statistical Offices, Allianz SE.
North America
Western Europe
Asia ex Japan
Eastern EuropeOceania Latin America
Japan
45.0
40.0
35.0
30.0
25.0
20.0
15.0
10.0
5.0
0.00.0 5.0 10.0 15.0 20.0 25.0 30.0
2.7
Absolute amount of liabilities (in Euro tn)
Shar
e in
201
4, in
%
5.4
13.1
10.4
1.5 1.20.7
Allia
nz G
loba
l Wea
lth R
epor
t 201
5
35very cautious about borrowing and the trend certainly
cannot be described as a return to the status quo ante.
This restraint is a global trend: the average global rate
of change in liabilities has slowed to an average of 2.9%
p.a. since the end of 2007, compared with a rate of 7.9%
in the years between 2001 and 2007.
Emerging markets take their foot off the gas...Although eastern Europe accounts for the smal-
lest proportion of the global debt burden, at 2.0%,
households in this region lead the growth pack on
the liabilities side of the asset balance sheet: over
the past 14 years, eastern European households have
been upping their liabilities by an average of almost
22% a year, with the absolute debt level climbing by
a factor of 16 since the end of 2000. It is, however,
important to put these figures somewhat into per-
spective: the rapid growth is attributable primarily
to the major non-EU countries in the region, namely
Russia and Turkey, which started at an extremely low
level; the region‘s EU member states ”only” achieved
growth of just under 17% a year.
The financial crisis did, nonetheless, trigger
a marked slowdown in borrowing; in the whole regi-
on of eastern Europe the average annual growth rate
has fallen from around 33% in the pre-crisis years to a
good 11% since the end of 2007; in the eastern Euro-
pean EU countries, this rate has fallen to below 7%. In
2014, debt growth was actually almost sliced in two
year-on-year, coming in at 6.7%. The major differen-
ces between the region‘s EU and non-EU members
are also becoming less pronounced again: in the EU
member states, growth picked up from 1.7% in 2013
to 3.2% last year, whereas the pace of growth in the
eastern European countries outside of the European
Union slipped back from 25.2% to 10.5%. This is a sign
that the Russia-Ukraine crisis, in particular, is taking
its toll.
Deve
lopm
ent i
n gl
obal
liab
ilitie
s
36Developments in eastern Europe are also
moving in a very different direction to the other
emerging regions of Latin America and Asia (excl. Ja-
pan), which were not hit as hard by the financial crisis
as eastern Europe, whose economy is heavily reliant
on the situation in the eurozone. Private households
in Latin America have kept their average debt growth
fairly constant in the period before and after 2007, at
almost 16%. In Asia (excl. Japan), the average annual
growth rate has actually increased from 10.1% in the
period between 2001 and 2007 to 15.1% in the period
between 2008 and 2014. But the increasing growth
problems faced by the emerging markets also left
their mark (at least to some extent) on private borro-
wing last year: in Latin America, debt growth slowed
from 14.5% in 2013 to 12.8%, while in Asia (ex Japan),
the drop was even more pronounced, with debt
growth sliding from 15.8% to 12.1%. Nevertheless, this
still puts debt growth ahead of the (nominal) econo-
mic growth rate, meaning that the region‘s private
households are still a long way off a trend that could
be described as ”deleveraging”.
In terms of average per capita debt,
households in eastern Europe and Asia (ex Japan)
were on an equal footing, with EUR 1,770 and EUR
1,760 respectively at the end of 2014. Latin American
households were in the red to the tune of EUR 2,500
per capita on average, a good 70% higher than the
average for the emerging markets.
… and the industrialized nations are taking their foot off the brake
In a long-term comparison, it was private households
in the world‘s richer regions, in particular, that mo-
ved down a gear in terms of debt accumulation. US
households made a particular effort to slash their
borrowing: whereas liabilities were still growing at
an average rate of 10% p.a. in the pre-crisis years, the
debt burden had actually shrunk in absolute terms by
the end of 2014, when it was down by a total of 1.6%
compared with the record high seen in 2007 - also
due to payment defaults and write-downs on mor-
tgage loans.
Since 2012, however, the outstanding debt
volume has been gradually creeping up again, with
the rate of growth in the North American region as
a whole doubling year-on-year in 2014 to come in at
2.9%. But this sort of debt accumulation is still light-
years away from the excessive trends witnessed in
the past, with debt still growing at a much slower rate
than nominal economic output, at least in the US.
Down under, debt had been growing at an
ever faster rate than in North America, with Australi-
an households stepping up their liabilities by an ave-
rage of 12.5% p.a. in the run-up to the crisis. Here, too,
however, the population has been adopting a more
restrained approach to further borrowing since the
end of 2007. At 6.4%, the average annual growth rate
has been sliced almost in half since then. The rate of
change last year came in at 6.9% as against 2013, up
slightly on the level seen in the prior year (6.2%). This
still, however, means that personal debt is growing at
around twice the rate of the economy as a whole.
Allia
nz G
loba
l Wea
lth R
epor
t 201
5
37In western Europe, debt growth progressed
at a slower pace than in North America and Oceania
in the years between 2001 and 2007, with the rate of
increase averaging 7.6% p.a. This trend is, however,
primarily attributable to the region‘s largest econo-
my in terms of economic output, Germany, where
private households took an extremely disciplined
approach to debt even in the years prior to the crisis.
Leaving Germany out of the equation, the region‘s
average rate of growth comes in at 9.7% p.a., putting
it virtually neck-and-neck with North America. After
the outbreak of the crisis, many private households
were forced to follow the example set by Germany,
pushing average annual debt growth in the region as
a whole down to 1.5%. In 2014, the rate of growth ac-
celerated to 1.3% after two years of virtual stagnation
in the outstanding debt volume (+0.2% in both 2012
and 2013). This means, however, that western Europe
had the lowest growth rate in a regional comparison
- albeit with major differences between the individu-
al countries: whereas personal debt is still on the dec-
line in crisis countries like Greece, Ireland, Portugal or
Spain, the Scandinavian countries, in particular, have
already bounced back to - or indeed are still reporting
- robust growth rates of 5 percent or more.
At the end of 2014, per capita debt in wes-
tern Europe averaged EUR 25,170, meaning that
western Europeans have far less debt, in per capita
terms, than their counterparts in North America (EUR
36,490) and Oceania (EUR 53,690). Per capita debt le-
vels in Japan (EUR 21,430), which have been on the
wane for years now, are even lower than in western
Europe: even before the financial crisis erupted, the
liabilities of Japanese households were falling by an
average of 1.4% a year, with virtual stagnationsince
the end of 2007 (an average of +0.1% a year). All in
all, liabilities were down by 8.6% on 2000 at the end
of 2014.
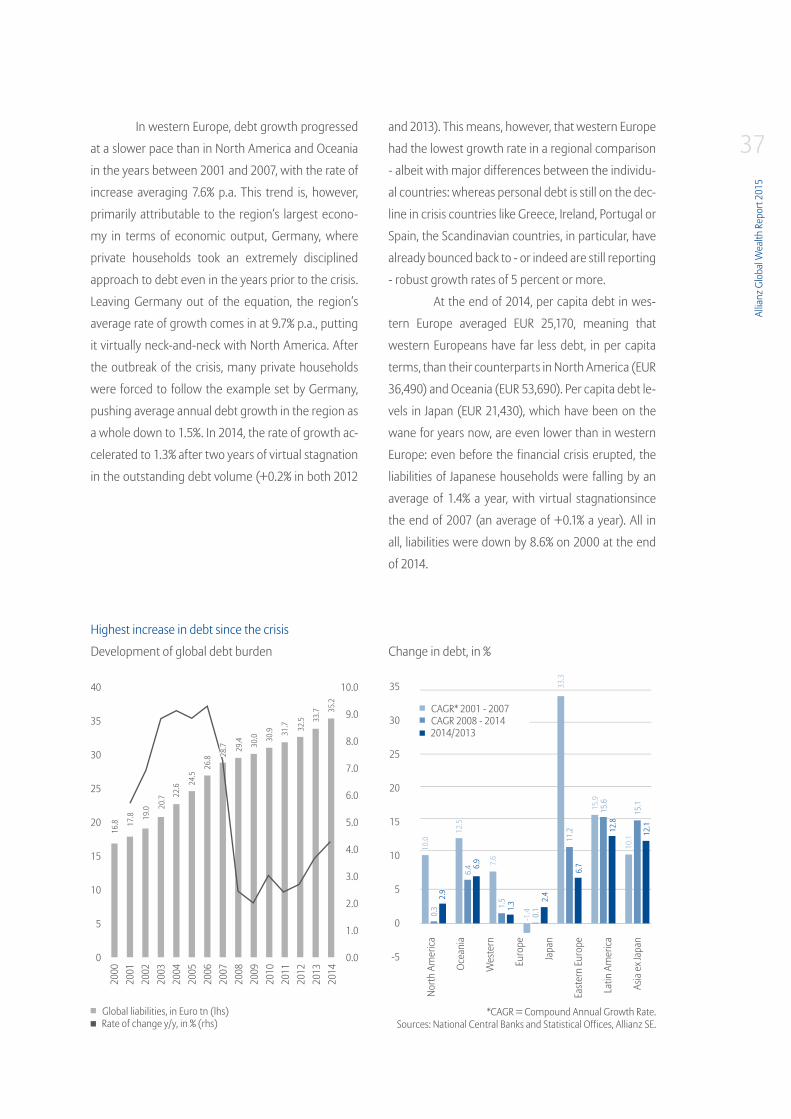
Development of global debt burden
Highest increase in debt since the crisis
*CAGR = Compound Annual Growth Rate.Sources: National Central Banks and Statistical Offices, Allianz SE.
40
35
30
25
20
15
10
5
0
10.0
9.0
8.0
7.0
6.0
5.0
4.0
3.0
2.0
1.0
0.0
35
30
25
20
15
10
5
0
-5
Rate of change y/y, in % (rhs)
2014/2013
Global liabilities, in Euro tn (lhs)
CAGR 2008 - 2014CAGR* 2001 - 2007
Change in debt, in %
North
Am
erica
Ocea
nia
Wes
tern
Euro
pe
Japa
n
East
ern
Euro
pe
Latin
Am
erica
Asia
ex J
apan
200
020
0120
0220
0320
0420
0520
0620
0720
0820
0920
1020
1120
1220
1320
14
10.0
0.3
6.4
1.5
11.2
15.6
15.1
0.1
2.9
6.9
1.3
6.7
12.8
12.1
2.4
16.8 17
.8 19.0 20
.7 22.6 24
.5
26.8 28
.7 29.4 30
.0 30.9 31
.7 32.5 33
.7 35.2
12.5
7.6
-1.4
33.3
15.9
10.1

Deve
lopm
ent i
n gl
obal
liab
ilitie
s
38
Liabilities, in EUR
Regional differences in debt per capita
Sources: National Central Banks and Statistical Offices, UN Population Division, Allianz SE.
55,000
50,000
45,000
40,000
35,000
30,000
25,000
20,000
15,000
10,000
5,000
0
201420072001
North America Oceania Western Europe Japan Eastern Europe Latin America Asia ex Japan World
mained stable, at just under 24%, in a year-on-year
comparison. In the region‘s EU member states, the
ratio was - not surprisingly - much higher than in the
rest of the region at almost 33% on average, although
it was still the case that not one of the countries from
this region that are included in our analysis overshot
the 50% mark. The ratio in Latin America is a good
seven percentage points higher than in eastern Eu-
rope at 31%, with liabilities growing at a much faster
rate (almost 16% a year on average) than economic
output (just under 11% a year on average) since late
2000. That said, no country has overshot the 50%
mark to date in this region either. There is more cause
for concern when it comes to Asia (excl. Japan). The
highest debt ratio among the emerging regions can
be found in this particular area, with the ratio clim-
bing by another 1.4 percentage points to around 40%
in 2014. In Thailand and Malaysia, for example, the
debt ratios are already sitting at just under 80% and
85% respectively - a level that is comparable to the US
(around 81%).
Global deleveraging on its last legsThe global debt ratio, i.e. private household liabilities
measured as a percentage of nominal economic out-
put, at 64.4% in 2014, remained roughly on a par with
the year before (64.8%). In the period from 2010 to
2013, economic growth clearly outpaced personal
debt growth - pushing the ratio down by around
seven percentage points compared with 2009. Last
year, in contrast, debt and economic growth were
pretty much neck-and-neck (+4.3% versus +4.9%).
This would suggest that the global deleveraging pro-
cess that has been ongoing for a few years now is co-
ming to an end.
Although the debt ratio of eastern European
households has more than trebled since the end of
2000 on the back of the rampant credit growth seen
in the past, it remains the region with the lowest ra-
tio of debt to general economic activity. After debt
growth slowed considerably last year, the ratio re-
22,2
96
20,3
21
15,4
1323
,296
22,7
58
150
432
399
4,06
7
849
976
701
6,22
5
21,2
4421
,434
1,77
1
2,49
7
1,75
8
7,19
6
25,1
65
38,4
4353
,691
37,9
9236
,485

Allia
nz G
loba
l Wea
lth R
epor
t 201
5
39The ratio for Japanese households came in
at 81% at the end of 2014, up by 0.7 percentage points
year-on-year and in line with the average for the ad-
vanced economies. Since 2000, however, the ratio
of debt to economic output has dropped by almost
four percentage points, whereas North America and
western Europe reported an increase of twelve and
around 15 percentage points respectively over the
same period. Nevertheless, the global deleveraging
process sparked by the outbreak of the financial crisis
is attributable almost exclusively to these two regi-
ons. North America has made the most progress in
this respect, having shaved almost 15 percentage
points off the debt ratio since the end of 2009, brin-
ging it down to just under 83%. In western Europe, the
ratio has been slashed by a far from insignificant four
percentage points during the same period, pushing
it down to 76%.
In no other region of the world is the relative
debt burden as high as in Oceania. Over the past 14
years, the debt ratio of private households has clim-
bed by a whopping 43 percentage points to total a
good 122%. After dropping slightly for two years on
the trot in 2010 and 2011, the ratio has since climbed
back up by almost nine percentage points in total -
largely due to the slowdown in economic growth.
Global net financial assets break through the 100-trilli-on-euro mark
If we subtract debt from the gross financial assets, we
arrive at a figure for net financial assets, which came
in at a new record high of EUR 100.6 trillion at the
close of last year. All in all, private household assets
held in bank deposits, securities, insurance policies
and pensions, as well as other receivables, grew at a
rate that was 2.8 percentage points faster than debt
in 2014. In net terms, this figure is up by 8.1% on a year
earlier - above-average development in a long-term
comparison (an average rate of +5.3% p.a.).
Economic growth vs. debt growth
y/y in %
Economic growth now faster than debt growth – Global debt-to-GDP ratio shrinks
10
9
8
7
6
5
4
3
2
1
0
-1
130
120
110
100
90
80
70
60
50
40
30
20
10
0
Sources: National Central Banks and Statistical Offices, Thomson Reuters, Allianz SE.Global nominal GDPGlobal liabilities
Liabilities as % of nominal GDP
North America
Oceania
Western EuropeJapan
Eastern EuropeLatin America
Asia ex Japan
World
200
020
0120
0220
0320
0420
0520
0620
0720
0820
0920
1020
1120
1220
1320
14
5.7
6.9
8.9 9.
0
7.2
2.4
2.0
3.0
2.4 2.
7
9.2
8.8
200
120
0220
0320
0420
0520
0620
0720
0820
0920
1020
1120
1220
1320
14
3.6
4.3
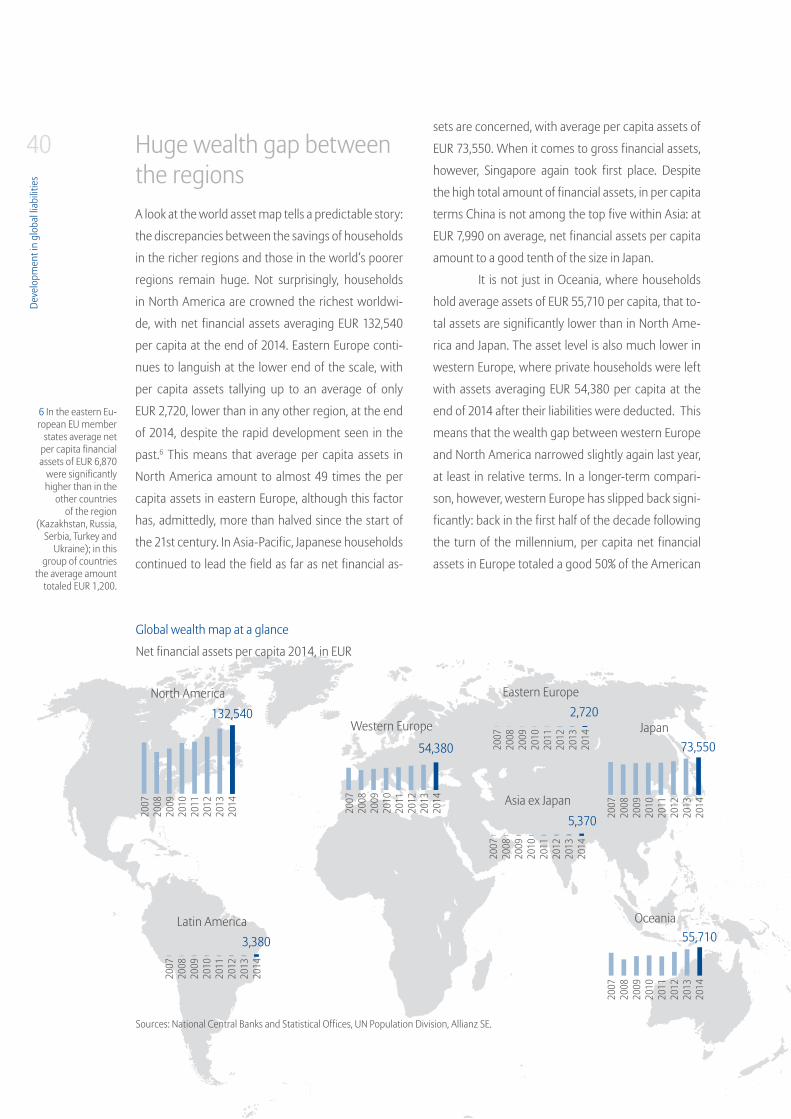
Deve
lopm
ent i
n gl
obal
liab
ilitie
s
40 Huge wealth gap between the regionsA look at the world asset map tells a predictable story:
the discrepancies between the savings of households
in the richer regions and those in the world‘s poorer
regions remain huge. Not surprisingly, households
in North America are crowned the richest worldwi-
de, with net financial assets averaging EUR 132,540
per capita at the end of 2014. Eastern Europe conti-
nues to languish at the lower end of the scale, with
per capita assets tallying up to an average of only
EUR 2,720, lower than in any other region, at the end
of 2014, despite the rapid development seen in the
past.6 This means that average per capita assets in
North America amount to almost 49 times the per
capita assets in eastern Europe, although this factor
has, admittedly, more than halved since the start of
the 21st century. In Asia-Pacific, Japanese households
continued to lead the field as far as net financial as-
sets are concerned, with average per capita assets of
EUR 73,550. When it comes to gross financial assets,
however, Singapore again took first place. Despite
the high total amount of financial assets, in per capita
terms China is not among the top five within Asia: at
EUR 7,990 on average, net financial assets per capita
amount to a good tenth of the size in Japan.
It is not just in Oceania, where households
hold average assets of EUR 55,710 per capita, that to-
tal assets are significantly lower than in North Ame-
rica and Japan. The asset level is also much lower in
western Europe, where private households were left
with assets averaging EUR 54,380 per capita at the
end of 2014 after their liabilities were deducted. This
means that the wealth gap between western Europe
and North America narrowed slightly again last year,
at least in relative terms. In a longer-term compari-
son, however, western Europe has slipped back signi-
ficantly: back in the first half of the decade following
the turn of the millennium, per capita net financial
assets in Europe totaled a good 50% of the American
6 In the eastern Eu-ropean EU member
states average net per capita financial assets of EUR 6,870
were significantly higher than in the
other countries of the region
(Kazakhstan, Russia, Serbia, Turkey and
Ukraine); in this group of countries
the average amount totaled EUR 1,200.
North America
Japan
Latin America Oceania
132,540
73,550
5,370
2,720
55,710
54,380
3,380
Western Europe
Eastern Europe
Asia ex Japan
Net financial assets per capita 2014, in EUR
Global wealth map at a glance
2007
2008
2009
2010
2011
2012
2013
2014
2007
2008
2009
2010
2011
2012
2013
2014
2007
2008
2009
2010
2011
2012
2013
2014
2007
2008
2009
2010
2011
2012
2013
2014
2007
2008
2009
2010
2011
2012
2013
2014
2007
2008
2009
2010
2011
2012
2013
2014
2007
2008
2009
2010
2011
2012
2013
2014
Sources: National Central Banks and Statistical Offices, UN Population Division, Allianz SE.
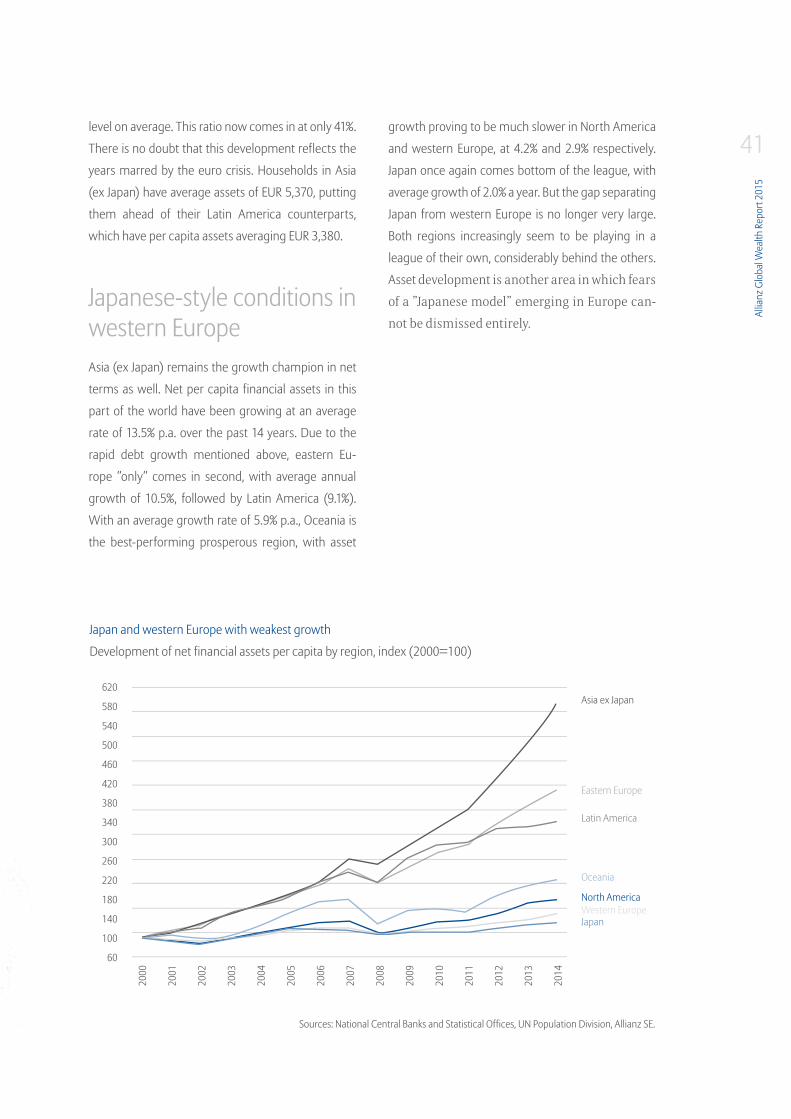
Allia
nz G
loba
l Wea
lth R
epor
t 201
5
41level on average. This ratio now comes in at only 41%.
There is no doubt that this development reflects the
years marred by the euro crisis. Households in Asia
(ex Japan) have average assets of EUR 5,370, putting
them ahead of their Latin America counterparts,
which have per capita assets averaging EUR 3,380.
Japanese-style conditions in western EuropeAsia (ex Japan) remains the growth champion in net
terms as well. Net per capita financial assets in this
part of the world have been growing at an average
rate of 13.5% p.a. over the past 14 years. Due to the
rapid debt growth mentioned above, eastern Eu-
rope ”only” comes in second, with average annual
growth of 10.5%, followed by Latin America (9.1%).
With an average growth rate of 5.9% p.a., Oceania is
the best-performing prosperous region, with asset
growth proving to be much slower in North America
and western Europe, at 4.2% and 2.9% respectively.
Japan once again comes bottom of the league, with
average growth of 2.0% a year. But the gap separating
Japan from western Europe is no longer very large.
Both regions increasingly seem to be playing in a
league of their own, considerably behind the others.
Asset development is another area in which fears
of a ”Japanese model” emerging in Europe can-
not be dismissed entirely.
Development of net financial assets per capita by region, index (2000=100)
Japan and western Europe with weakest growth
Sources: National Central Banks and Statistical Offices, UN Population Division, Allianz SE.
620
580
540
500
460
420
380
340
300
260
220
180
140
100
60
North America
Oceania
Western EuropeJapan
Eastern Europe
Latin America
Asia ex Japan
2000
2001
2002
2003
2004
2005
2006
2007
2008
2009
2010
2011
2012
2013
2014


Wealth distribution
Concentration
and density

Wea
lth d
istrib
utio
n
44The question of wealth distribution can be approa-
ched from two angles: first, it is obviously of interest
to look at how wealth is concentrated - how big is the
slice of the cake held by the richest households? – se-
cond, the question of participation is also significant –
how many people have any wealth to speak of? As in
previous years, we have made a distinction between
the national and global level.
Global wealth upper class gradually becoming less of a force
The division of all households/individuals into global
wealth classes is based on the average global net per
capita financial assets, which came in at EUR 20,360
in 2014. The middle wealth (MW) class encompasses
all individuals with assets corresponding to between
30% and 180% of the global average. This means that
for 2014, the asset thresholds for the global wealth
middle class stand at EUR 6,100 and EUR 36,700. The
”low wealth” (LW) category, on the other hand, inclu-
des those individuals with net financial assets that are
below the EUR 6,100 threshold, while the term ”high
wealth” (HW) applies to those with net financial as-
sets of more than EUR 36,700 (for details on how the
asset thresholds are set, please refer to Appendix A).7
Population (53 countries analyzed), in million, 2014
Global wealth middle class crosses the one-billion-mark
7 These asset bands can, of course, also
be used for the purposes of coun-
try classification. Whether a country‘s
average net finan-cial assets come to
less than EUR 6,100 or more than EUR 36,700 per capita
determines whether it is classed as a ”low
wealth country” (LWC) or a ”high wealth country”
(HWC). This means that countries with per capita assets of between EUR 6,100 and EUR 36,700 are
classed as ”middle wealth countries”
(MWCs).
<6,100 6,100 - 36,700 >36,700LW MW HW
3,50
3
Net financial assets per capita, in Euro
1,01
3
422
Oceania / South AfricaNorth AmericaWestern EuropeEastern EuropeLatin AmericaAsia
Sources: ECB, National Central Banks, UN Population Division, UNU WIDER, World Bank, Allianz SE.

Allia
nz G
loba
l Wea
lth R
epor
t 201
5
453.5 billion people, the vast majority of the five billion
people living in the countries included in our analy-
sis, still belong to the wealth lower class. Although
the absolute figure has risen slightly compared with
the previous year, it still corresponds - as in 2013 - to
71% of the total population, meaning that the incre-
ase is primarily due to population growth, largely in
India. This group‘s share of the world‘s net financial
assets is in stark contrast to its size, with less than 5%
percent of assets in their hands. The situation among
the wealth upper class is the exact opposite: although
only just under 10% of the total population of the
countries we analyzed (420 million people) can count
themselves as members of this group, the wealth up-
per class holds around 80% of the world‘s total assets.
This means that, in global terms, assets are still very
highly concentrated.
The number of members of the wealth up-
per class is, however, on the decline in general. Last
year alone, the figure fell by around 14 million - a
trend that was primarily attributable to Italy and Ja-
pan; in Japan‘s case, one of the main factors at play
here is the weak yen, which means that Japanese
households are falling behind in an international
comparison. But the downward trend is impossible
to ignore in a longer-term comparison, too. There are
now fewer people of ”high wealth” than there were
at the start of the millennium, particularly in those
countries that have set the stage for a massive incre-
ase in debt in recent years and whose financial assets
have been hit hard by the crisis. All in all, just under 60
million people have been demoted from the ”wealth
upper class” over the past few years. This exodus is
not, however, concentrated exclusively in ”typical”
crisis countries such as Greece, Ireland or the US, but
can also be seen in Austria, Switzerland, France, Italy
and Japan. But all of these countries have something
else in common other than the drop in the number
of people assigned to the wealth upper class: the dis-
tribution of wealth within the countries themselves
has also become significantly ”less equal”, with assets
concentrated in the hands of ever fewer people.
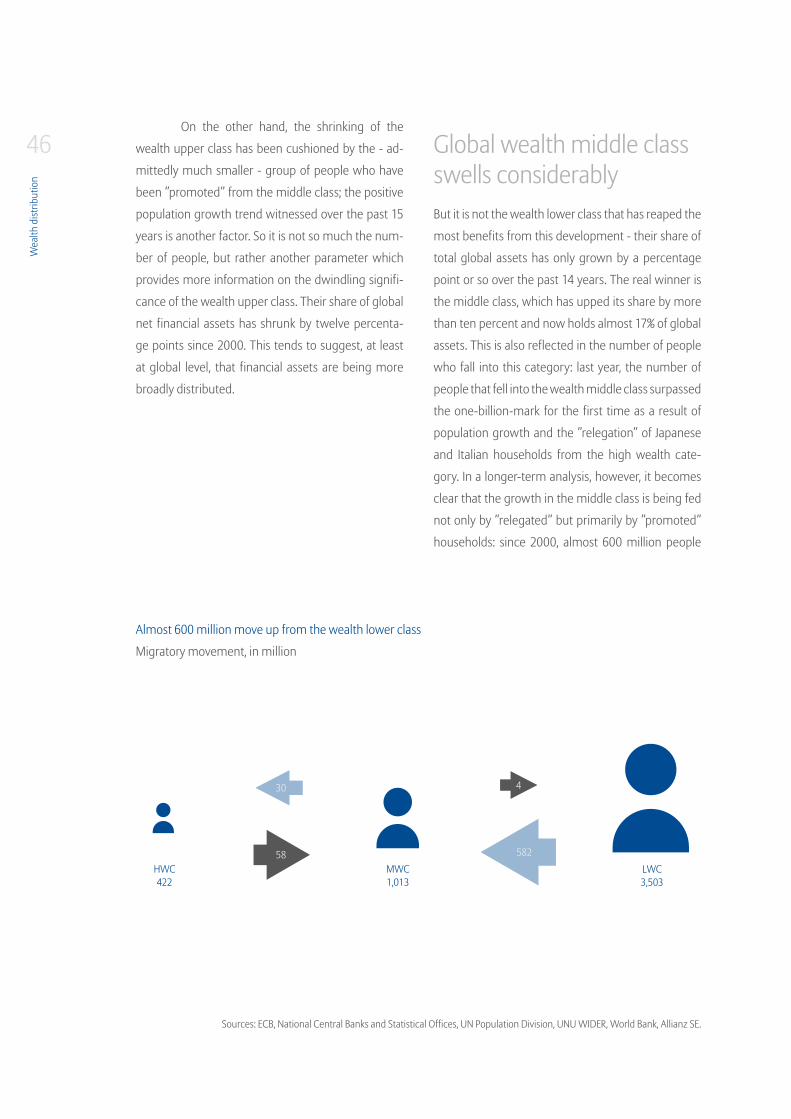
Wea
lth d
istrib
utio
n
46On the other hand, the shrinking of the
wealth upper class has been cushioned by the - ad-
mittedly much smaller - group of people who have
been ”promoted” from the middle class; the positive
population growth trend witnessed over the past 15
years is another factor. So it is not so much the num-
ber of people, but rather another parameter which
provides more information on the dwindling signifi-
cance of the wealth upper class. Their share of global
net financial assets has shrunk by twelve percenta-
ge points since 2000. This tends to suggest, at least
at global level, that financial assets are being more
broadly distributed.
Global wealth middle class swells considerablyBut it is not the wealth lower class that has reaped the
most benefits from this development - their share of
total global assets has only grown by a percentage
point or so over the past 14 years. The real winner is
the middle class, which has upped its share by more
than ten percent and now holds almost 17% of global
assets. This is also reflected in the number of people
who fall into this category: last year, the number of
people that fell into the wealth middle class surpassed
the one-billion-mark for the first time as a result of
population growth and the ”relegation” of Japanese
and Italian households from the high wealth cate-
gory. In a longer-term analysis, however, it becomes
clear that the growth in the middle class is being fed
not only by ”relegated” but primarily by ”promoted”
households: since 2000, almost 600 million people
Migratory movement, in million
Almost 600 million move up from the wealth lower class
Sources: ECB, National Central Banks and Statistical Offices, UN Population Division, UNU WIDER, World Bank, Allianz SE.
LWC3,503
MWC1,013
HWC422
30
58
4
582
Allia
nz G
loba
l Wea
lth R
epor
t 201
5
47from the ”low wealth” category have been promoted
to the wealth middle class. This means that, all in all,
taking population growth into account, membership
of this group has trebled since the turn of the mill-
ennium. The fact that the wealth lower class has not
shrunk to the same extent can be explained by the
strong population growth within this wealth cate-
gory, which made up virtually in full for the number
of people being promoted. Nevertheless, more than
anything else, this development highlights the inclu-
sive nature of asset growth in a global comparison:
more and more people are managing to participate
in global prosperity. So from this angle, inequality
certainly cannot be said to be on the increase.
The development cannot, however, be
described as an evenly distributed one, because
the momentum is concentrated primarily in only
one region, or actually in only one country: China.
Around two-thirds of the global wealth middle class
are now recruited from Asia - and 85% of them hail
from China. The Asian population that falls into the
middle class bracket in global terms has increased
almost tenfold since the start of the millennium. De-
velopments in other regions are lagging behind this
spectacular growth. It is particularly striking that the
middle class in the other two emerging regions, Latin
America and eastern Europe, is growing at a much
more subdued rate. Although current growth pro-
blems are certainly a factor, especially in the most
populous countries in these two regions, Brazil and
Russia, the fact that these countries lag so far behind
is testimony to the massive amount of catch-up work
they need to do. Whereas in 2000, the percentage
of the population that was considered to be middle-
class in Asia was still much lower than in eastern Eu-
rope and Latin America, it is now almost twice as high
as in these two regions at 20% - despite the fact that
India, the second biggest country in Asia, is still light-
years away from exploiting its potential in full. And
finally, a word on the growth of the wealth middle
class in western Europe and North America: along-
side population growth, which mainly applies to the
US, the growth seen here is attributable exclusively to
households being demoted from the ”high wealth”
segment, meaning that it is much more a sign of
”fallout” from the major financial crisis than reason
to celebrate.
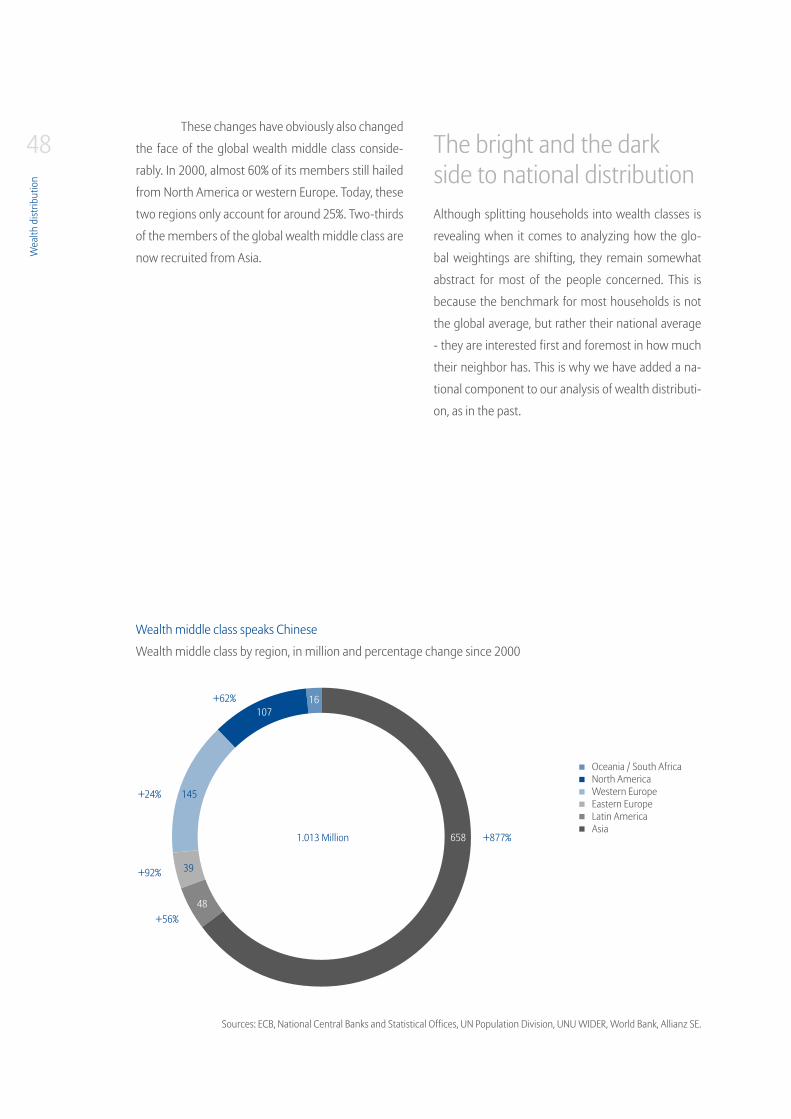
Wea
lth d
istrib
utio
n
48These changes have obviously also changed
the face of the global wealth middle class conside-
rably. In 2000, almost 60% of its members still hailed
from North America or western Europe. Today, these
two regions only account for around 25%. Two-thirds
of the members of the global wealth middle class are
now recruited from Asia.
The bright and the dark side to national distributionAlthough splitting households into wealth classes is
revealing when it comes to analyzing how the glo-
bal weightings are shifting, they remain somewhat
abstract for most of the people concerned. This is
because the benchmark for most households is not
the global average, but rather their national average
- they are interested first and foremost in how much
their neighbor has. This is why we have added a na-
tional component to our analysis of wealth distributi-
on, as in the past.
Wealth middle class by region, in million and percentage change since 2000
Wealth middle class speaks Chinese
Oceania / South AfricaNorth AmericaWestern EuropeEastern EuropeLatin AmericaAsia
Sources: ECB, National Central Banks and Statistical Offices, UN Population Division, UNU WIDER, World Bank, Allianz SE.
658 +877%
+24%
+62%
+92%
+56%
145
39
48
10716
1.013 Million
Allia
nz G
loba
l Wea
lth R
epor
t 201
5
49In order to show how wealth is distributed
at national level, we have, for the first time, calcula-
ted a Gini coefficient for each country, based on the
average net financial assets per population decile.
In order to see how things have developed, we have
performed this calculation for the period around
2000 and for the present day. The higher the Gini
coefficient, the greater the inequality of wealth dis-
tribution. This allows us not only to compare the in-
dividual countries with each other in terms of wealth
distribution (in)equality, but also to see how things
have developed in a national context. After all, it is not
so much the absolute level, which is determined by
a large number of social and historical development
factors, but rather the change in distribution that de-
termines whether the situation in a particular count-
ry is seen as being ”fair” or ”unfair”.
Looking at all of the countries in our analysis,
the number of countries in which the Gini coefficient
of wealth distribution has fallen over time (i.e. show-
ing an improvement towards more equal distributi-
on) is roughly on a par with the number of countries
in which the Gini coefficient has risen (i.e. deteriora-
ted with a trend towards less equal distribution). This
does not necessarily mean that the general trend is
towards greater inequality. More than anything else,
however, it highlights how important it is to analyze
distribution trends by applying a differentiated ap-
proach.
Asia and Latin America: Moving in the right direction
The Gini wealth distribution coefficients for the coun-
tries in Latin America, Asia and eastern Europe look
more or less as one would expect: wealth distribu-
tion in the Latin American countries is, on average,
less equal than in more egalitarian regions like Asia;
exceptions like Indonesia confirm the rule. The La-
tin American Gini coefficients are also well above the
international average. Developments in recent years,
however, are unreservedly positive: with the excepti-
on of Colombia, where wealth distribution has barely
changed since 2000, all other Latin American coun-
tries have made real progress in terms of moving
towards greater social participation, i.e. the Gini coef-
ficient has dropped. These positive changes are parti-
cularly pronounced in the two economies in the regi-
on that have made the most economic progress over
the past decade: Mexico and Brazil. So while growth
would appear to pay off when it comes to more equal
distribution, the fact that the Gini coefficients remain
high suggests that further action needs to be taken.
The wealth picture in Asia, on the other hand, is not
just a much more mixed one - while Gini coefficients
in China, Japan and South Korea are below the inter-
national average, conditions in countries like Indone-
sia, Malaysia and Thailand are more ”Latin American”.
The picture is equally mixed in terms of the progress
made: in four of the countries in our analysis, there
has been a deterioration over the past decade (=in-
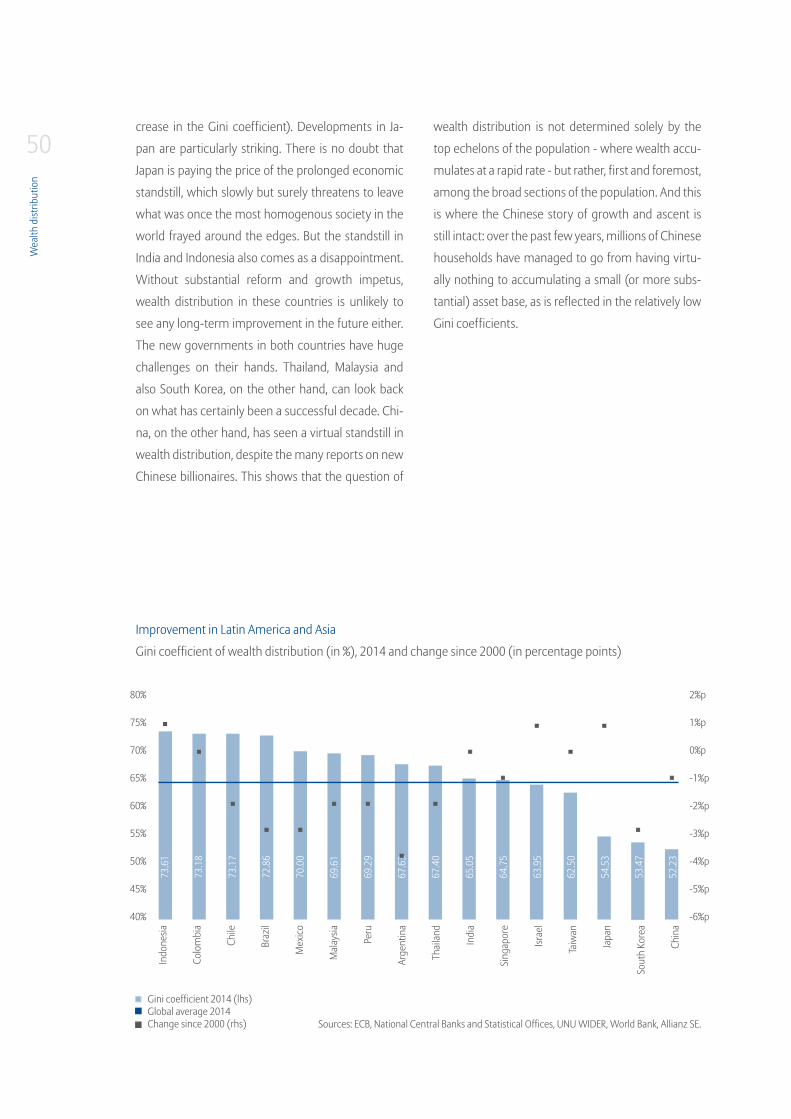
Wea
lth d
istrib
utio
n
50crease in the Gini coefficient). Developments in Ja-
pan are particularly striking. There is no doubt that
Japan is paying the price of the prolonged economic
standstill, which slowly but surely threatens to leave
what was once the most homogenous society in the
world frayed around the edges. But the standstill in
India and Indonesia also comes as a disappointment.
Without substantial reform and growth impetus,
wealth distribution in these countries is unlikely to
see any long-term improvement in the future either.
The new governments in both countries have huge
challenges on their hands. Thailand, Malaysia and
also South Korea, on the other hand, can look back
on what has certainly been a successful decade. Chi-
na, on the other hand, has seen a virtual standstill in
wealth distribution, despite the many reports on new
Chinese billionaires. This shows that the question of
wealth distribution is not determined solely by the
top echelons of the population - where wealth accu-
mulates at a rapid rate - but rather, first and foremost,
among the broad sections of the population. And this
is where the Chinese story of growth and ascent is
still intact: over the past few years, millions of Chinese
households have managed to go from having virtu-
ally nothing to accumulating a small (or more subs-
tantial) asset base, as is reflected in the relatively low
Gini coefficients.
Gini coefficient of wealth distribution (in %), 2014 and change since 2000 (in percentage points)
Improvement in Latin America and Asia
Sources: ECB, National Central Banks and Statistical Offices, UNU WIDER, World Bank, Allianz SE.
Gini coefficient 2014 (lhs)Global average 2014Change since 2000 (rhs)
80%
75%
70%
65%
60%
55%
50%
45%
40%
2%p
1%p
0%p
-1%p
-2%p
-3%p
-4%p
-5%p
-6%p
Indo
nesia
Colo
mbi
a
Chile
Braz
il
Mex
ico
Mal
aysia
Peru
Arge
ntin
a
Thai
land
Indi
a
Sing
apor
e
Israe
l
Taiw
an
Japa
n
Sout
h Ko
rea
Chin
a
73.6
1
73.1
8
73.1
7
72.8
6
70.0
0
69.6
1
69.2
9
67.6
3
67.4
0
65.0
5
64.7
5
63.9
5
62.5
0
54.5
3
53.4
7
52.2
3

Allia
nz G
loba
l Wea
lth R
epor
t 201
5
51Eastern Europe: Freedom and equalityThe Gini coefficients for wealth distribution in eastern
Europe make a fairly uniform impression. Most coun-
tries are clustered closely together, slightly below the
international average; the only countries that buck
the trend are Russia and Turkey, where distribution
is much less equal, and, at the other end of the scale,
Slovenia and Slovakia; in the case of the latter, this is
likely due largely to systematic privatization and re-
form measures in the past. The relatively homogenous
distribution of wealth on the whole is likely to be a di-
rect consequence of the fact that these countries only
opened their doors to the West and embraced a free
market economy 25 years ago; so there has not yet
been much time to (legally) accumulate private assets
which, as a result, means that no marked differences
have emerged to date.
In many eastern European countries, distri-
bution has also improved over the past decade. This is
due to the turbulent nature of asset growth that has
affected large parts of society. There are, however, a
few exceptions, namely Hungary, Bulgaria and Russia.
Although the deterioration in these countries‘ Gini co-
efficients remains within bounds, it highlights just how
important economic growth and zest for reform are in
ensuring balanced wealth development. The situation
in Russia, where disparities in wealth are already the
greatest in the region and risk becoming even more
pronounced, is particularly concerning. Developments
in Turkey, on the other hand, are more encouraging,
with the ascent of the Turkish economy also reflected
in wealth development and distribution. Nevertheless,
”South American” conditions still tend to prevail in Tur-
key, too, as the country does not share the experience
that the other countries in the region have had of re-
setting the clock, so to speak, 25 years ago.
Gini coefficient 2014 (lhs)Global average 2014Change since 2000 (rhs)
67.7
1
67.1
5
63.9
1
63.9
1
63.7
4
62.5
4
61.9
5
61.8
1
61.7
8
61.4
0
60.7
6
60.6
5
59.9
7
59.6
4
52.2
0 9
Gini coefficient of wealth distribution (in %), 2014 and change since 2000 (in percentage points)
Egalitarian eastern Europe
Sources: ECB, National Central Banks and Statistical Offices, UNU WIDER, World Bank, Allianz SE.
80%
75%
70%
65%
60%
55%
50%
45%
40%
2%p
1%p
0%p
-1%p
-2%p
-3%p
-4%p
-5%p
-6%p
Russ
ia
Turk
ey
Bulg
aria
Latv
ia
Lithu
ania
Esto
nia
Rum
ania
Kaza
khst
an
Pola
nd
Serb
ia
Croa
tia
Hung
ary
Ukra
ine
Czec
h Re
publ
ic
Slov
enia
Slov
akia
42.3
0
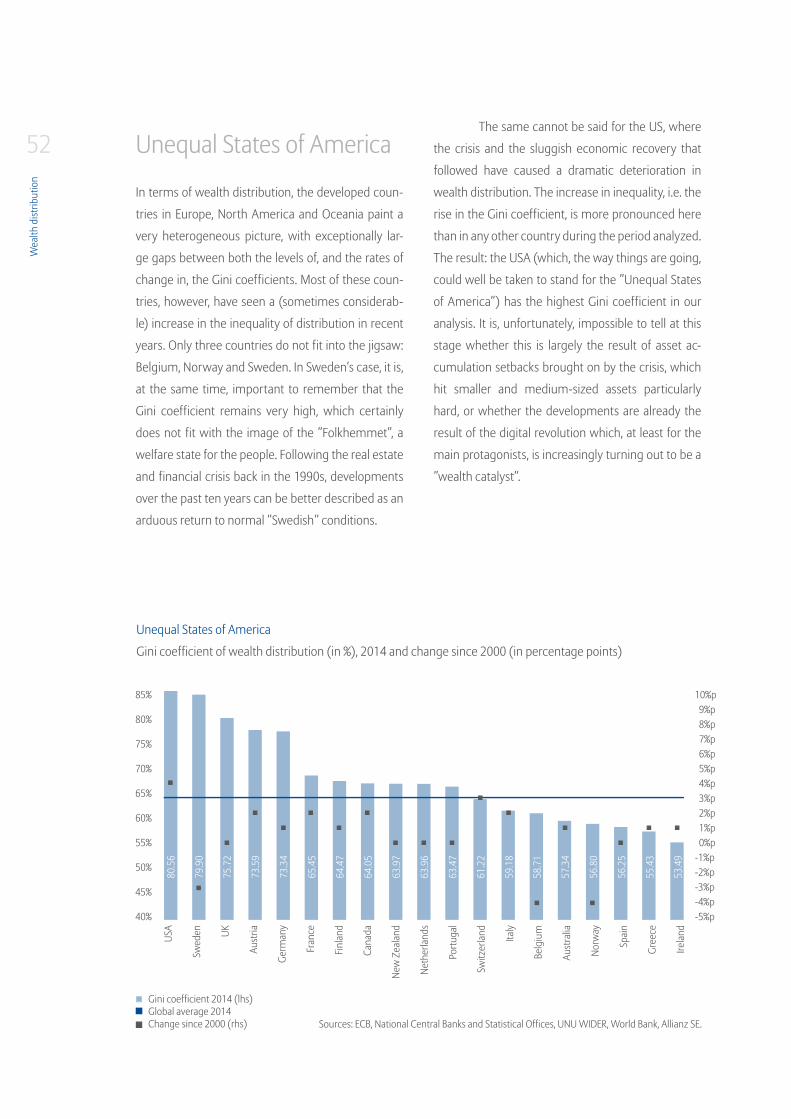
Wea
lth d
istrib
utio
n
52 Unequal States of America
In terms of wealth distribution, the developed coun-
tries in Europe, North America and Oceania paint a
very heterogeneous picture, with exceptionally lar-
ge gaps between both the levels of, and the rates of
change in, the Gini coefficients. Most of these coun-
tries, however, have seen a (sometimes considerab-
le) increase in the inequality of distribution in recent
years. Only three countries do not fit into the jigsaw:
Belgium, Norway and Sweden. In Sweden‘s case, it is,
at the same time, important to remember that the
Gini coefficient remains very high, which certainly
does not fit with the image of the ”Folkhemmet”, a
welfare state for the people. Following the real estate
and financial crisis back in the 1990s, developments
over the past ten years can be better described as an
arduous return to normal ”Swedish” conditions.
The same cannot be said for the US, where
the crisis and the sluggish economic recovery that
followed have caused a dramatic deterioration in
wealth distribution. The increase in inequality, i.e. the
rise in the Gini coefficient, is more pronounced here
than in any other country during the period analyzed.
The result: the USA (which, the way things are going,
could well be taken to stand for the ”Unequal States
of America”) has the highest Gini coefficient in our
analysis. It is, unfortunately, impossible to tell at this
stage whether this is largely the result of asset ac-
cumulation setbacks brought on by the crisis, which
hit smaller and medium-sized assets particularly
hard, or whether the developments are already the
result of the digital revolution which, at least for the
main protagonists, is increasingly turning out to be a
”wealth catalyst”.
Gini coefficient of wealth distribution (in %), 2014 and change since 2000 (in percentage points)
Unequal States of America
Sources: ECB, National Central Banks and Statistical Offices, UNU WIDER, World Bank, Allianz SE.
85%
80%
75%
70%
65%
60%
55%
50%
45%
40%
10%p 9%p 8%p 7%p 6%p 5%p 4%p 3%p 2%p 1%p 0%p-1%p-2%p-3%p-4%p-5%p
USA
Swed
en UK
Aust
ria
Germ
any
Fran
ce
Finla
nd
Cana
da
New
Zea
land
Neth
erla
nds
Portu
gal
Switz
erla
nd Italy
Belg
ium
Aust
ralia
Norw
ay
Spai
n
Gree
ce
Irela
nd
80.5
6
79.9
0
75.7
2
73.5
9
73.3
4
65.4
5
64.4
7
64.0
5
63.9
7
63.9
6
63.4
7
61.2
2
59.1
8
58.7
1
57.3
4
56.8
0
56.2
5
55.4
3
53.4
9
Gini coefficient 2014 (lhs)Global average 2014Change since 2000 (rhs)
Allia
nz G
loba
l Wea
lth R
epor
t 201
5
53Developments have not been quite as dra-
matic in the other countries. One aspect, however,
is striking: the countries where the distribution of
wealth is particularly unequal and has deteriorated
drastically in recent years are certainly not the Eu-
ropean crisis countries, such as Greece, Ireland and
Spain. Rather, the countries that stand out as having
suffered the biggest setbacks in recent years are
Switzerland, France, Austria or Italy. A word on the
situation in Germany: the distribution of wealth has
barely changed since 2000; Germany is, however,
one of the countries with relatively uneven wealth
distribution in an international context. This is, howe-
ver, likely to be one of the relics of the country‘s long
division into East and West more than anything else.
Growth is the best medici-ne for distributionIt is virtually impossible to draw a universally valid con-
clusion from our tour d’horizon through the national
statistics on wealth distribution, since developments
vary so much from country to country. Most impor-
tantly, there is no sign of any reversion to the mean:
our analysis has identified countries with above-ave-
rage inequality of distribution where the situation has
deteriorated further in recent years, but also more
egalitarian countries that have continued to make pro-
gress. In general, however, high asset growth would
appear to go hand-in-hand with increasingly ”equal”
distribution, even if this is by no means an automatic
mechanism. There is, however, no question that, whe-
rever total assets experience rapid growth, there is a
better chance of more and more people being able to
participate in this prosperity. If you choose only to look
at the (similarly meteoric) rise in the number of millio-
naires, you lose sight of the positive developments ta-
king place ”lower down”, among the population at lar-
ge. The progress made by many countries in Asia, Latin
America and eastern Europe is, on the whole, a success
story from a distribution policy perspective, too.
But the opposite holds true as well: low
growth tends to be correlated with a (slow) erosion in
equitable distribution, with Japan serving as a prime
example of this. As a result, the best distribution policy
is likely to be one that promotes asset development on
the whole. Here, too, there is real truth in the theory
that growth is the best way of achieving social justice.
57 Latin America 65 North America 73 Western Europe 85 Eastern Europe 97 Asia 109 Australia and New Zealand
Regional differences
Financial assets in
individual regions
56
Vorwort . Zusammenfassung . Entwicklung des globalen Geldvermögens . Verteilung des globalen Geldvermögens . Regionale Unterschiede . Literatur . Appendix
56

Latin America
PopulationIn the analyzed countries · · · · · · · · · · · · · · · · · · · · · · · · · · · · · · · · · · · · · · · · · · · · · · · · · · · · · · · · · 465 mAnalyzed countries’ share of the region as a whole · · · · · · · · · · · · · · · · · · · · · · · · · · · · · · · · · 76.5%Analyzed countries’ share of the global population · · · · · · · · · · · · · · · · · · · · · · · · · · · · · · · · · · ·6.5%
GDPIn the analyzed countries · · · · · · · · · · · · · · · · · · · · · · · · · · · · · · · · · · · · · · · · · · · · · · · · · · ·EUR 3,740bnAnalyzed countries’ share of the region as a whole · · · · · · · · · · · · · · · · · · · · · · · · · · · · · · · · · 86.6%Analyzed countries’ share of global GDP · · · · · · · · · · · · · · · · · · · · · · · · · · · · · · · · · · · · · · · · · · · · ·6.5%
Gross financial assets of private householdsTotal· · · · · · · · · · · · · · · · · · · · · · · · · · · · · · · · · · · · · · · · · · · · · · · · · · · · · · · · · · · · · · · · · · · · · · ·EUR 2,735bnAverage · · · · · · · · · · · · · · · · · · · · · · · · · · · · · · · · · · · · · · · · · · · · · · · · · · · · · · · · · · · EUR 5,880 per capitaShare of global financial assets · · · · · · · · · · · · · · · · · · · · · · · · · · · · · · · · · · · · · · · · · · · · · · · · · · · · · ·2.0%
Debt of private householdsTotal· · · · · · · · · · · · · · · · · · · · · · · · · · · · · · · · · · · · · · · · · · · · · · · · · · · · · · · · · · · · · · · · · · · · · · ·EUR 1,162bnAverage · · · · · · · · · · · · · · · · · · · · · · · · · · · · · · · · · · · · · · · · · · · · · · · · · · · · · · · · · · · EUR 2,500 per capitaAs % of GDP· · · · · · · · · · · · · · · · · · · · · · · · · · · · · · · · · · · · · · · · · · · · · · · · · · · · · · · · · · · · · · · · · · · · · · 31.0%

Regi
onal
diff
eren
ces:
Latin
Am
eric
a
58The commodities boom witnessed over the
last decade ensured that the Latin American subcon-
tinent, which is rich in natural resources, enjoyed high
export revenues and capital inflows over a period of
many years. In particular, China‘s increased appetite
for raw materials sent prices surging and fueled a Latin
American boom. As Chinese economic growth started
to slow, so too did the demand for raw materials, and
prices started to slide back down. Without the tail-
wind provided by the commodity markets, the South
American growth engine, in turn, started to splutter.
Economic growth in the countries included in our
analysis has been on a constant downward trajectory
over the last four years, coming in at only 1.2% in real
terms in 2014. Consumers have also started to tighten
their belts and the annual rate of change in consumer
spending has been dropping continually since the end
of 2010.
But it is not just plummeting commodity
prices that have been plaguing Latin America of late.
Signals sent out by the Fed regarding a possible re-
duction in the bond-purchasing program in May 2013
triggered a real sell-off of assets from up-and-coming
economies across the globe. The pronounced uncer-
tainty on the international financial markets translated
into substantial corrections on the capital markets and
currency weakening in the emerging markets. Finan-
cing conditions deteriorated considerably, putting
added strain on the Latin American economy, which
was already stalling. A second wave of selling came
towards the end of the year, although unlike with the
first wave, investors were paying more heed to fun-
damental data when making investment decisions. In
particular, those countries faced with an increasingly
gloomy economic outlook and substantial macroeco-
nomic imbalances were hit by further capital outflows.
The economies in question had to cope with repeated
slides on the stock, bond and currency markets.
Commodity prices and economic growth since 2010 Net financial assets and liabilities, in EUR tn
Sinking commodity prices weigh on economic growth
*CAGR = Compound Annual Growth Rate.Sources: IMF, National Central Banks and Statistical Offices, Thomson Reuters, Allianz SE.
Net financial assetsLiabilities
240
220
200
180
160
140
120
100
80
60
40
20
0
3.0
2.5
2.0
1.5
1.0
0.5
0.0
7.0
6.0
5.0
4.0
3.0
2.0
1.0
0.02010 2011 2012 2013 2014 2000 2007 2008 2009 2010 2011 2012 2013 2014
CAGR* 2001 - 2014Net financial assets: +10.4 % p.a.Liabilities: +15.8 % p.a.
Gross financial assets: +12.2 % p.a.
Food prices (lhs)Agricultural prices (lhs)Metal prices (lhs)
Oil prices (lhs)Real GDP, y/y in % (rhs)
Inde
x 200
5 =
100 15
0.1
179.
9
175.
6
177.
6
170.
2
125.
1
153.
5
134.
0
136.
2
138.
8
202.
3
229.
7
191.
0
182.
9
164.
1
148.
1
194.
9
196.
8
195.
1
180.
4
150 394
4221,014
495931
5541,165
6611,295
7801,336
9001,485
1,0301,510
1,1621,573
Allia
nz G
loba
l Wea
lth R
epor
t 201
5
59One of the South American countries to be
hit particularly hard by this development was Brazil. In
the largest country in Latin America in terms of area,
population and economic output, real gross domestic
product stagnated last year, while consumer prices
were up by 6.3% on 2013. This put the rate of inflation
at the upper end of the 4.5% target corridor (+/- 2%). In
this environment, consumer spending among private
households was also subdued, with the annual rate of
change falling for the fourth consecutive year to only
0.9% in 2014.
After adjustments for inflation, households
have been left with nothing to show for last year‘s
asset growth: the savings of Brazilian households not
only grew at a much slower rate (6.4% year-on-year)
than the long-term average (12.6% p.a. since the end
of 2000); the savings growth rate was the same as the
rate of inflation.
The developments in Brazil are representati-
ve of the entire region. Boosted by a decade of high
growth, Latin America had written an impressive story
of advancement: starting at the turn of the millenni-
um, savings in the region grew at an average rate of
12.2% p.a., more than doubling the region‘s share of
global assets from 0.8% in 2000 to 2.0% 14 years later.
At the end of last year, the gross financial assets of pri-
vate households in Argentina, Brazil, Chile, Colombia,
Mexico and Peru came to around EUR 2.7 trillion in to-
tal. But as economic momentum has recently tapered
off, so too has the pace of growth in private savings,
especially over the past two years. The annual growth
rates, which came in at 6.5% in 2013 and 7.7% last year,
are well below the historical average.
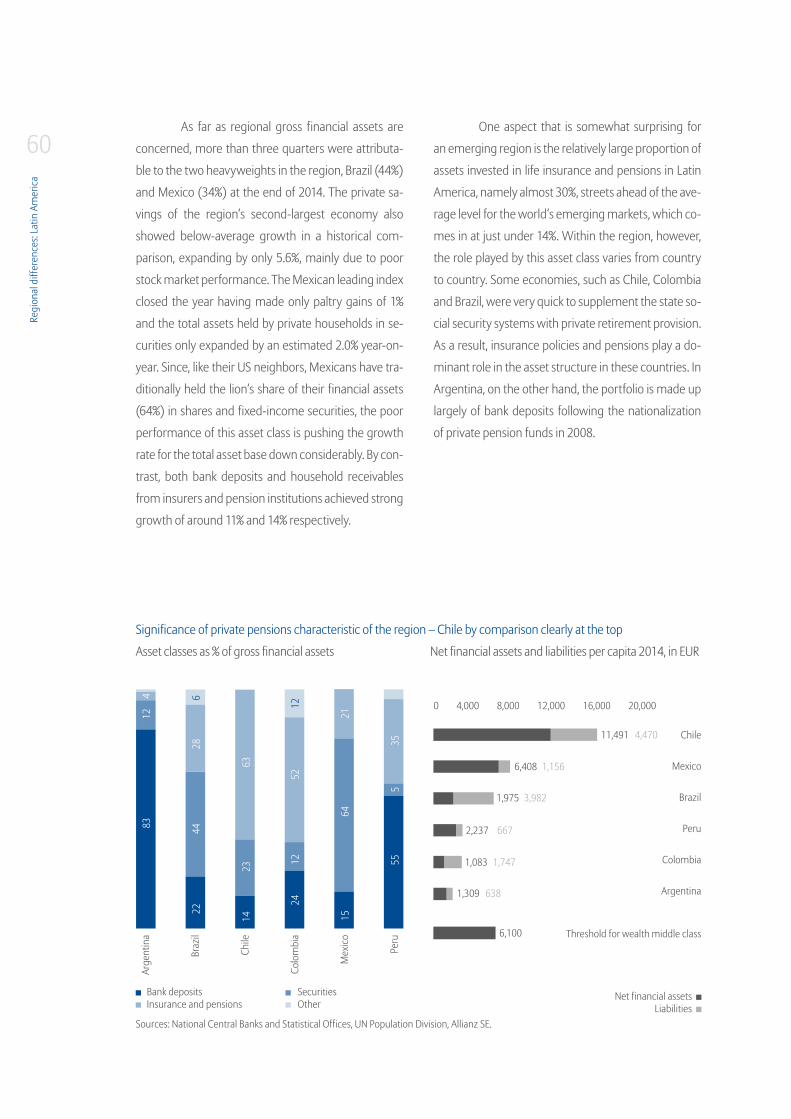
Regi
onal
diff
eren
ces:
Latin
Am
eric
a
60As far as regional gross financial assets are
concerned, more than three quarters were attributa-
ble to the two heavyweights in the region, Brazil (44%)
and Mexico (34%) at the end of 2014. The private sa-
vings of the region‘s second-largest economy also
showed below-average growth in a historical com-
parison, expanding by only 5.6%, mainly due to poor
stock market performance. The Mexican leading index
closed the year having made only paltry gains of 1%
and the total assets held by private households in se-
curities only expanded by an estimated 2.0% year-on-
year. Since, like their US neighbors, Mexicans have tra-
ditionally held the lion‘s share of their financial assets
(64%) in shares and fixed-income securities, the poor
performance of this asset class is pushing the growth
rate for the total asset base down considerably. By con-
trast, both bank deposits and household receivables
from insurers and pension institutions achieved strong
growth of around 11% and 14% respectively.
One aspect that is somewhat surprising for
an emerging region is the relatively large proportion of
assets invested in life insurance and pensions in Latin
America, namely almost 30%, streets ahead of the ave-
rage level for the world‘s emerging markets, which co-
mes in at just under 14%. Within the region, however,
the role played by this asset class varies from country
to country. Some economies, such as Chile, Colombia
and Brazil, were very quick to supplement the state so-
cial security systems with private retirement provision.
As a result, insurance policies and pensions play a do-
minant role in the asset structure in these countries. In
Argentina, on the other hand, the portfolio is made up
largely of bank deposits following the nationalization
of private pension funds in 2008.
Asset classes as % of gross financial assets
Significance of private pensions characteristic of the region – Chile by comparison clearly at the top
Sources: National Central Banks and Statistical Offices, UN Population Division, Allianz SE.
Arge
ntin
a
Braz
il
Chile
Colo
mbi
a
Mex
ico
Peru
Chile
Mexico
Brazil
Peru
Colombia
Argentina
2,237 667
1,083 1,747
1,309 638
6,100
1,975 3,982
6,408 1,156
11,491 4,470
Threshold for wealth middle class
83 4422
12
28
63
52
6415
555
35
21
1224
12
2314
4 6
Net financial assets and liabilities per capita 2014, in EUR
0 4,000 8,000 12,000 16,000 20,000
Net financial assetsLiabilities
SecuritiesOther
Bank depositsInsurance and pensions

Allia
nz G
loba
l Wea
lth R
epor
t 201
5
61As far as the individual countries‘ asset shares
are concerned, the situation on the liabilities side mir-
rors that on the assets side of the balance sheet: almost
82% of liabilities are attributable to Brazilian and Mexi-
can households alone. Net financial assets, i.e. gross fi-
nancial assets less liabilities, came in at just under EUR
1.6 trillion in the region as a whole. The region‘s share
of global net financial assets has doubled from 0.8% at
the end of 2000 to the current level of 1.6%. Since debt
growth outpaced the accumulation of gross financial
assets, net financial assets have reported slightly slo-
wer growth than their gross counterparts, increasing
by a good 10% p.a. on average since the end of 2000.
The region‘s growth champion is Argentina,
where net financial assets grew by an average of al-
most 27% p.a. in the period between 2001 and 2014.
After adjustments for inflation, however, the average
growth rate comes down to just under 10% p.a. Ar-
gentina is plagued by rampant inflation. While official
statistics put the rate of inflation in the third quarter of
2014 at around 23%, independent experts believe that
the rate for 2014 as a whole is closer to 40%. Since the
last sovereign default of 2002, many of Argentina‘s citi-
zens have lost faith in their peso and their government:
the drastic slide in the national currency and the free-
zing of bank deposits have prompted Argentineans to
seek refuge in secure foreign currencies. Anyone who
has the choice opts to invest abroad or stash his dollars
or euros under his mattress. In circumstances like the-
se, it is, of course, extremely difficult to put a figure on
the financial assets of private households. If we leave
liabilities out of the equation, per capita assets at the
end of 2014 totaled an estimated EUR 1,310.
When it comes to Latin America‘s richest
households, Chile remains at the upper end of the ta-
ble. Chileans had average assets of EUR 11,490 per ca-
pita, compared with a Latin American average of only
EUR 3,380. The only country other than Chile to have
attained the status of a MWC is Mexico, where average
per capita net financial assets tallied up to EUR 6,410.
Despite what were, in some cases, double-digit ave-
rage growth rates in the past, MWC status is still well
out of reach for the rest of the continent.
In absolute terms, it is not with regard to per
capita financial assets that the Chileans lead the Latin
American field. Chile‘s average per capita debt of EUR
4,570 is also the highest in the region, followed by Bra-
zil with EUR 3,980 per capita. If, however, we compa-
re both countries based on the relative debt burden,
Brazil‘s households are carrying far more weight on
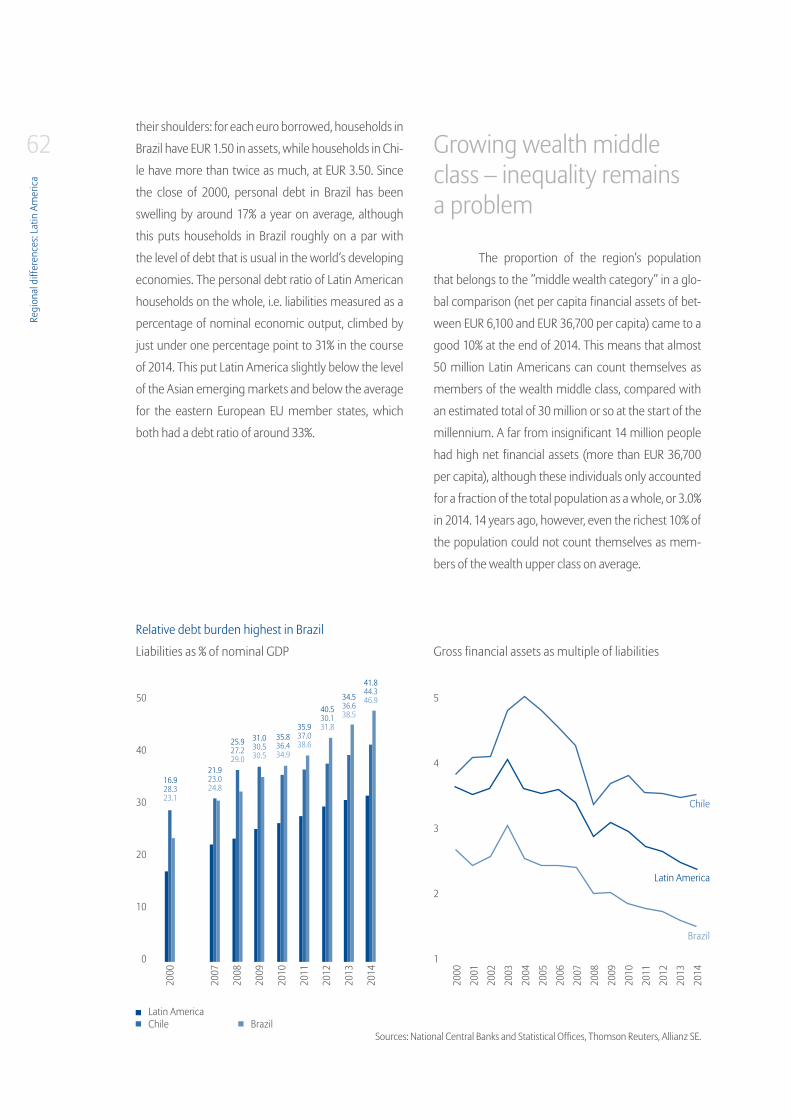
Regi
onal
diff
eren
ces:
Latin
Am
eric
a
62their shoulders: for each euro borrowed, households in
Brazil have EUR 1.50 in assets, while households in Chi-
le have more than twice as much, at EUR 3.50. Since
the close of 2000, personal debt in Brazil has been
swelling by around 17% a year on average, although
this puts households in Brazil roughly on a par with
the level of debt that is usual in the world‘s developing
economies. The personal debt ratio of Latin American
households on the whole, i.e. liabilities measured as a
percentage of nominal economic output, climbed by
just under one percentage point to 31% in the course
of 2014. This put Latin America slightly below the level
of the Asian emerging markets and below the average
for the eastern European EU member states, which
both had a debt ratio of around 33%.
Growing wealth middle class – inequality remains a problem
The proportion of the region‘s population
that belongs to the ”middle wealth category” in a glo-
bal comparison (net per capita financial assets of bet-
ween EUR 6,100 and EUR 36,700 per capita) came to a
good 10% at the end of 2014. This means that almost
50 million Latin Americans can count themselves as
members of the wealth middle class, compared with
an estimated total of 30 million or so at the start of the
millennium. A far from insignificant 14 million people
had high net financial assets (more than EUR 36,700
per capita), although these individuals only accounted
for a fraction of the total population as a whole, or 3.0%
in 2014. 14 years ago, however, even the richest 10% of
the population could not count themselves as mem-
bers of the wealth upper class on average.
Relative debt burden highest in Brazil
Liabilities as % of nominal GDP
2000
2007
2008
2009
2010
2011
2012
2013
2014
200
0
2001
2002
2003
2004
2005
2006
2007
2008
2009
2010
2011
2012
2013
2014
Sources: National Central Banks and Statistical Offices, Thomson Reuters, Allianz SE.
Latin AmericaChile Brazil
Brazil
Latin America
Chile
Gross financial assets as multiple of liabilities
50
40
30
20
10
0
5
4
3
2
1
16.928.323.1
21.923.024.8
25.927.229.0
31.030.530.5
35.836.434.9
35.937.038.6
40.530.131.8
34.536.638.5
41.844.346.9

Allia
nz G
loba
l Wea
lth R
epor
t 201
5
63Although more than six percentage points
have been shaved off this group‘s share of the overall
population since the end of 2000, almost 87% of Latin
Americans, i.e. the vast majority of the population, still
rank among the wealth lower class. This means that
around 400 million Latin Americans had average as-
sets of less than EUR 6,100.
One of the biggest challenges facing the
region will remain the quest to achieve a better dis-
tribution of income and wealth within the individual
societies. Both in a global comparison and measured
against other up-and-coming economies as a whole,
incomes and wealth in Latin America are much more
highly concentrated: the richest 20% in the region are
on the receiving end of almost 54% of the total income
and hold a good 76% of the total assets, compared with
ratios of around 46% and approximately 70% respec-
tively in the emerging markets as a whole, and avera-
ging 42% and 68% respectively in a global comparison.
It is, however, important to mention that si-
gnificant progress has been made in the fight against
poverty in recent years. In Chile, for example, the po-
verty rate has been more than sliced in two compared
to the level seen in the early 2000s.
Brazil and Colombia, countries with income
concentration levels that are similarly high to those in
Chile, have also been successful in the fight against po-
verty. The poverty rate has been slashed by around 19
percentage points in both countries since the early ye-
ars of the new millennium. Nevertheless, almost one
in five Brazilians and more than 30% of the Colombian
population were still living in poverty in 2013.
Poverty rate around 2000 and 2013, in % Average income distribution in comparison
Share of total income by income decile, in %
Clear progress in fight against poverty – but inequality remains enormous
Sources: Economic Commission for Latin America and the Caribbean (ECLAC), National Statistical Offices and Central Banks, UNU WIDER, World Bank, Allianz SE.
*2012 **2004
2013 around 2000
worldwidein emerging marketsin Latin America
Chile
Argentina
Brazil
Mexico
Colombia
Peru
39.437.1*
20.27.8
37.518.0
34.9**4.3*
49.730.7
54.723.9
40
30
20
10
0
1. D
ecile
2. D
ecile
3. D
ecile
4. D
ecile
5. D
ecile
6. D
ecile
7. D
ecile
8. D
ecile
9. D
ecile
10. D
ecile0 20 40 60
2.72.41.4
4.43.82.7
5.54.83.6
6.55.94.7
7.67.05.8
8.88.27.4
10.29.78.9
12.111.911.5
15.215.616.0
27.230.637.8

64
Vorwort . Zusammenfassung . Entwicklung des globalen Geldvermögens . Verteilung des globalen Geldvermögens . Regionale Unterschiede . Literatur . Appendix
64
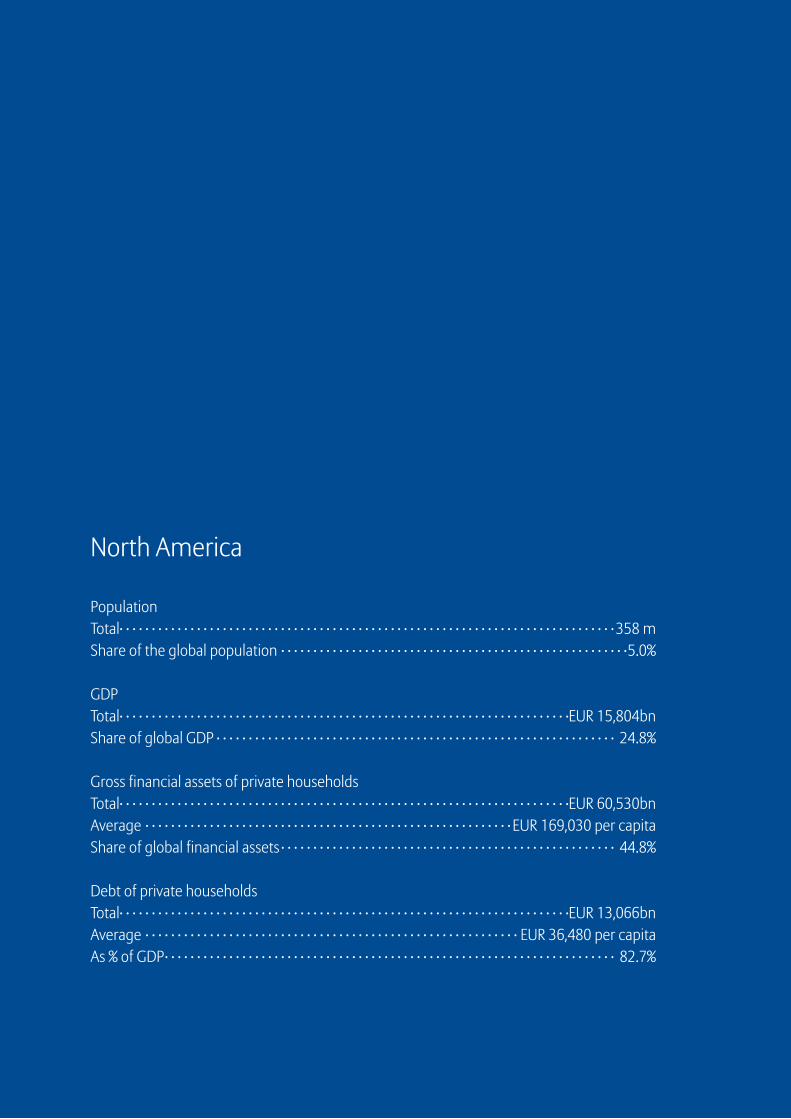
North America
PopulationTotal· · · · · · · · · · · · · · · · · · · · · · · · · · · · · · · · · · · · · · · · · · · · · · · · · · · · · · · · · · · · · · · · · · · · · · · · · · · · · 358 mShare of the global population · · · · · · · · · · · · · · · · · · · · · · · · · · · · · · · · · · · · · · · · · · · · · · · · · · · · · ·5.0%
GDPTotal· · · · · · · · · · · · · · · · · · · · · · · · · · · · · · · · · · · · · · · · · · · · · · · · · · · · · · · · · · · · · · · · · · · · · ·EUR 15,804bnShare of global GDP · · · · · · · · · · · · · · · · · · · · · · · · · · · · · · · · · · · · · · · · · · · · · · · · · · · · · · · · · · · · · · 24.8%
Gross financial assets of private householdsTotal· · · · · · · · · · · · · · · · · · · · · · · · · · · · · · · · · · · · · · · · · · · · · · · · · · · · · · · · · · · · · · · · · · · · · ·EUR 60,530bnAverage · · · · · · · · · · · · · · · · · · · · · · · · · · · · · · · · · · · · · · · · · · · · · · · · · · · · · · · · · EUR 169,030 per capitaShare of global financial assets · · · · · · · · · · · · · · · · · · · · · · · · · · · · · · · · · · · · · · · · · · · · · · · · · · · · 44.8%
Debt of private householdsTotal· · · · · · · · · · · · · · · · · · · · · · · · · · · · · · · · · · · · · · · · · · · · · · · · · · · · · · · · · · · · · · · · · · · · · ·EUR 13,066bnAverage · · · · · · · · · · · · · · · · · · · · · · · · · · · · · · · · · · · · · · · · · · · · · · · · · · · · · · · · · · EUR 36,480 per capitaAs % of GDP· · · · · · · · · · · · · · · · · · · · · · · · · · · · · · · · · · · · · · · · · · · · · · · · · · · · · · · · · · · · · · · · · · · · · · 82.7%

Regi
onal
diff
eren
ces:
North
Am
eric
a
66North America remains the richest region on
the planet. When 2014 came to a close, just under 45%
of the world‘s gross financial assets were attributable
to the almost 360 million inhabitants of Canada and
the US. In absolute terms, private savings in the region
came to a total of around EUR 60.5 trillion. Neverthel-
ess, at 4.8%, the growth rate lagged behind the global
asset development trend (+7.1%) last year.
But the two countries that make up this regi-
on certainly did not move in lockstep with each other:
the financial assets of Canadian households grew by
8.7%, almost twice the rate seen in the US (+4.5%).
Canadian assets held in securities topped the growth
stakes, swelling by 10.5%. This trend reflects both value
gains on the stock market, which worked in investors‘
favor, and rising fund inflows. Households ploughed
the bulk of their ”fresh” savings into this asset class,
investing a total of around EUR 63 billion or an average
of just under EUR 1,800 per capita. By the end of 2014,
securities accounted for 39.1% of total financial as-
sets, bringing Canadian households into line with the
average for the world‘s industrialized nations. In the
US, on the other hand, private households held more
than half of their financial assets (53.1%) in securiti-
es, although this asset class saw much lower growth
(+4.1%) than in Canada. Despite the fact that the S&P
500 gained a good 11% in the course of the year, secu-
rities only accounted for a tenth or so of total financial
asset formation. Compared with 2013, inflows into this
asset class were down by 17.1% to EUR 117 billion, or a
per capita average of around EUR 360. In terms of the
volume of these flows, however, US households were
still at a relatively high level in a historical comparison.
This is not the first time that the securities asset class
has been hit by cash outflows – sometimes significant
ones running into the treble digit billions – on balance.
Rather, this scenario has in fact occurred several times
before in the past.
70
60
50
40
30
20
10
0
12
10
8
6
4
2
0
North America: Asset development remains on growth course
2000
2007
2008
2009
2010
2011
2012
2013
2014
*CAGR = Compound Annual Growth Rate.Sources: Board of Governors of the Federal Reserve System, Statistics Canada, Allianz SE.
Bank deposits Securities Insurance and pensions
Gross financial assets
Net financial assetsLiabilities
USACanada
Net financial assets and liabilities, in EUR tn Asset classes, percentage change 2014 over 2013
6.8
4.8
4.1 4.
4
4.5
10.5
9.8
8.7
CAGR* 2001 - 2014Net financial assets: +5.1 % p.a.Liabilities: +5.0 % p.a.
Gross financial assets: +5.1 % p.a.
6.623.6
12.833.8
12.827.8
12.730.3
12.534.3
12.435.4
12.539.2
12.745.1
13.147.5
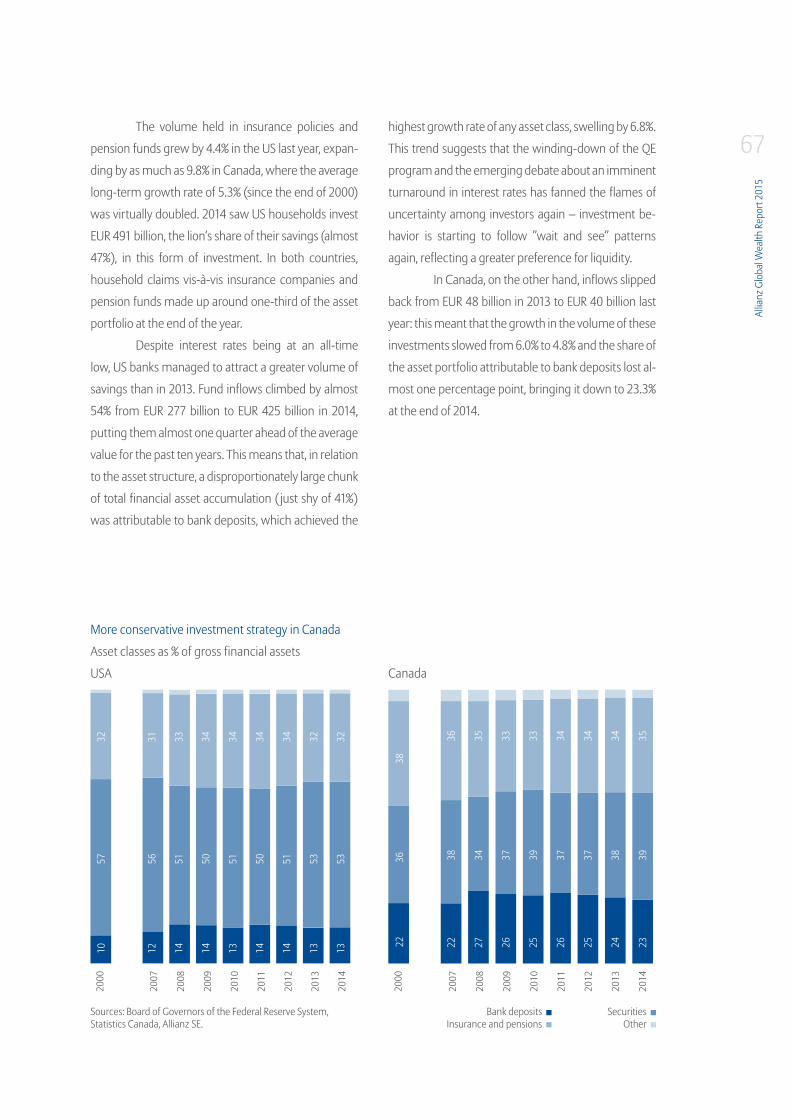
Allia
nz G
loba
l Wea
lth R
epor
t 201
5
67The volume held in insurance policies and
pension funds grew by 4.4% in the US last year, expan-
ding by as much as 9.8% in Canada, where the average
long-term growth rate of 5.3% (since the end of 2000)
was virtually doubled. 2014 saw US households invest
EUR 491 billion, the lion‘s share of their savings (almost
47%), in this form of investment. In both countries,
household claims vis-à-vis insurance companies and
pension funds made up around one-third of the asset
portfolio at the end of the year.
Despite interest rates being at an all-time
low, US banks managed to attract a greater volume of
savings than in 2013. Fund inflows climbed by almost
54% from EUR 277 billion to EUR 425 billion in 2014,
putting them almost one quarter ahead of the average
value for the past ten years. This means that, in relation
to the asset structure, a disproportionately large chunk
of total financial asset accumulation (just shy of 41%)
was attributable to bank deposits, which achieved the
highest growth rate of any asset class, swelling by 6.8%.
This trend suggests that the winding-down of the QE
program and the emerging debate about an imminent
turnaround in interest rates has fanned the flames of
uncertainty among investors again – investment be-
havior is starting to follow ”wait and see” patterns
again, reflecting a greater preference for liquidity.
In Canada, on the other hand, inflows slipped
back from EUR 48 billion in 2013 to EUR 40 billion last
year: this meant that the growth in the volume of these
investments slowed from 6.0% to 4.8% and the share of
the asset portfolio attributable to bank deposits lost al-
most one percentage point, bringing it down to 23.3%
at the end of 2014.
2000
2007
2008
2009
2010
2011
2012
2013
2014
2000
2007
2008
2009
2010
2011
2012
2013
2014
Asset classes as % of gross financial assets
More conservative investment strategy in Canada
Sources: Board of Governors of the Federal Reserve System, Statistics Canada, Allianz SE.
USA Canada
56 51 50 51 50 51 53 53 38 34 37 39 37 37 38 39
31 33 34 34 34 34 32 32 36 35 33 33 34 34 34 35
12 14 14 13 14 14 13 13 22 27 26 25 26 25 24 23
57 36
32
38
10 22
SecuritiesOther
Bank depositsInsurance and pensions
Regi
onal
diff
eren
ces:
North
Am
eric
a
68 Debt growth moving up a notch againIn a regional comparison, North America not only
claimed the largest share of global financial assets.
Around 37% of the world‘s debt burden – more than
in any other region – was also sitting on the other side
of the Atlantic. This share has, however, been falling
steadily in recent years. In 2007, it stood at almost 45%.
For one, households in the emerging markets have
been accumulating increasing liabilities as their finan-
cial sectors continue to develop. For another, the trend
also reflects the tighter hold that US households have
had on the debt reins since the outbreak of the finan-
cial crisis.
In the years before the crisis, the US personal
debt burden was growing at an average rate of a good
10% p.a., pushing the ratio of liabilities to disposable in-
come up from 99% in 2000 to 137% seven years later. In
2008, households started to borrow less in an attempt
to tidy up their asset balance sheets. In the period lea-
ding up to 2011, they cut their debt by an annual ave-
rage of 1.5%, shaving 22 percentage points off the debt
ratio in the space of these four years alone and brin-
ging it down to 115% of disposable income. By the end
of 2014, this figure had dropped further to 109%. By
the end of 2011 at EUR 35,610, per capita debt was also
gradually starting to resemble the sort of level seen in
2005, bolstered by population growth. After the liabili-
ties side of the asset balance sheet remained virtually
unchanged in the course of 2012 (+0.5% year-on-year),
the outstanding debt volume has been creeping back
up ever so slightly over the past two years (+1.1% in
2013 and +2.7% in 2014). In per capita terms, liabilities
edged up by 1.9% last year to total EUR 36,300.
A combination of historically low interest ra-
tes and a moderate increase in both employment and
incomes has made it easier for many households to
pay back their debt so far. The debt service ratio, i.e. the
ratio of capital and interest repayments to disposable
income, has fallen to an all-time low over the past two
years. The delinquency rate is also on the way down.
Although it has been sliced in two since 2009, falling
from almost 12% to 6% at the end of 2014, it is still abo-
ve the pre-crisis level of 4.7% (end of 2006). So all in all,
the household sector has corrected the excessive debt
behavior it displayed in the boom years and pushed its
liabilities back down to the historical average.
Nevertheless, many households remain in a
tight spot financially, as a survey8 conducted by the Fe-
deral Reserve System only serves to highlight. One of
the questions asked in the survey was how households
would cope with hypothetical costs of USD 400 re-
sulting from an unexpected emergency. Only 53%
of those surveyed said that they would have no pro-
blems settling this sort of amount via their current or
savings account, or using a credit card. The other 47%
said that they would either be unable to find the USD
400, or would have to sell something or borrow mo-
ney to cover the costs. These results only go to show
that there is still a long way to go before the recovery
has trickled down to all Americans. This has not been
helped by what has been poor wage development in
recent years on the whole, or by the marked income
disparity that continues to plague the US: almost 47%
of total income goes to the population‘s richest 10%,
with as much as 30.5% of income concentrated among
the top three percent of the income scale.
8 See ”Report on the Economic
Well-Being of U.S. Households in
2014”, Board of Governors of the
Federal Reserve System, May 2015.

Allia
nz G
loba
l Wea
lth R
epor
t 201
5
69The debt situation in Canada is much more
precarious than in the US. Although the outbreak of
the financial crisis at least helped to stall the country‘s
debt growth, bringing the average annual growth
rate down to a good 6% compared with around 9% in
the years prior to the crisis, liabilities in Canada were
up by 4.9% year-on-year in 2014, almost twice the
growth rate seen in the US. Per capita debt is climbing
to new record highs year in, year out. The Canadians
had already overtaken their US neighbors in 2012. At
the same time, however, their gross per capita finan-
cial assets averaged EUR 114,680 last year, one-third
lower than those of their counterparts to the south
(EUR 175,010). At the end of 2014, the liabilities of Ca-
nadian households averaged EUR 38,180 per capita,
around 5% higher than in the US. In relation to dispo-
sable income, the debt ratio has been constantly on
the rise since 2000, rising from a good 113% to around
170% last year – putting it 61 percentage points ahead
of the US level. The Canadian central bank has been
concerned about the growing debt burden on the
shoulders of its household sector for some time now.
According to its report on the stability of the financial
system, which was released in June 2015, negative em-
ployment trends across the board and falling income
levels pose the biggest domestic risk to the Canadian
financial system. Both could jeopardize the ability of
households to service their loans, which could, in turn,
trigger a house price correction. Although the proba-
bility of this risk materializing is low, the impact on the
economy and the financial system would be drastic.
Canada urgently needs to find its way back to a solid
and sustainable asset situation.
USA: Debt growing faster again Canada: Continuous increase of debt
Debt development since 2000
Sources: Board of Governors of the Federal Reserve System, Statistics Canada, Thomson Reuters, Allianz SE.
Liabilities indexed (2000=100)(lhs)Liabilities as % of disposable income (rhs)
280
260
240
220
200
180
160
140
120
100
280
260
240
220
200
180
160
140
120
100
180
170
160
150
140
130
120
110
100
180
170
160
150
140
130
120
110
100
2000
2001
2002
2003
2004
2005
2006
2007
2008
2009
2010
2011
2012
2013
2014
100
10010
8.5
104.
8
119.
2
112.
9
133.
8
122.
6
149.
7
135.
0
165.
5
149.
6
183.
2
164.
6
195.
9
183.
9194.
3 201.
0
191.
4
217.
2
187.
5
229.
5
184.
7
241.
8
185.
6
254.
0
187.
7
264.
7
192.
8
227.
6
2000
2001
2002
2003
2004
2005
2006
2007
2008
2009
2010
2011
2012
2013
2014
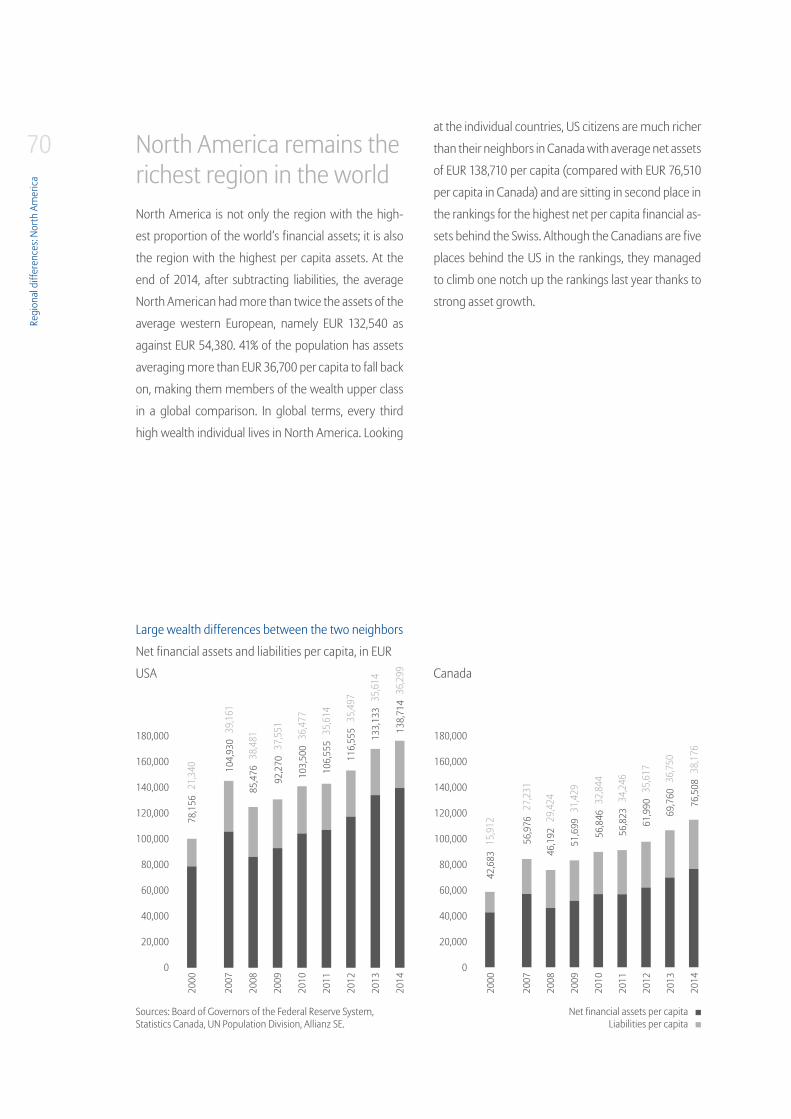
Regi
onal
diff
eren
ces:
North
Am
eric
a
70 North America remains the richest region in the worldNorth America is not only the region with the high-
est proportion of the world‘s financial assets; it is also
the region with the highest per capita assets. At the
end of 2014, after subtracting liabilities, the average
North American had more than twice the assets of the
average western European, namely EUR 132,540 as
against EUR 54,380. 41% of the population has assets
averaging more than EUR 36,700 per capita to fall back
on, making them members of the wealth upper class
in a global comparison. In global terms, every third
high wealth individual lives in North America. Looking
at the individual countries, US citizens are much richer
than their neighbors in Canada with average net assets
of EUR 138,710 per capita (compared with EUR 76,510
per capita in Canada) and are sitting in second place in
the rankings for the highest net per capita financial as-
sets behind the Swiss. Although the Canadians are five
places behind the US in the rankings, they managed
to climb one notch up the rankings last year thanks to
strong asset growth.
Net financial assets and liabilities per capita, in EUR
Large wealth differences between the two neighbors
Sources: Board of Governors of the Federal Reserve System, Statistics Canada, UN Population Division, Allianz SE.
USA Canada
180,000
160,000
140,000
120,000
100,000
80,000
60,000
40,000
20,000
0
180,000
160,000
140,000
120,000
100,000
80,000
60,000
40,000
20,000
0
Net financial assets per capitaLiabilities per capita
2000
2007
2008
2009
2010
2011
2012
2013
2014
2000
2007
2008
2009
2010
2011
2012
2013
2014
78,1
56
104,
930
85,4
76
92,2
70
103,
500
106,
555
116,
555
133,
133
138,
714
42,6
83
56,9
76
46,1
92
51,6
99
56,8
46
56,8
23
61,9
90
69,7
60
76,5
0821,3
40
39,1
61
38,4
81
37,5
51
36,4
77
35,6
14 35,4
97 35,6
14
36,2
99
15,9
12
27,2
31
29,4
24
31,4
29
32,8
44
34,2
46
35,6
17
36,7
50
38,1
76

Allia
nz G
loba
l Wea
lth R
epor
t 201
5
71
72
Vorwort . Zusammenfassung . Entwicklung des globalen Geldvermögens . Verteilung des globalen Geldvermögens . Regionale Unterschiede . Literatur . Appendix
72
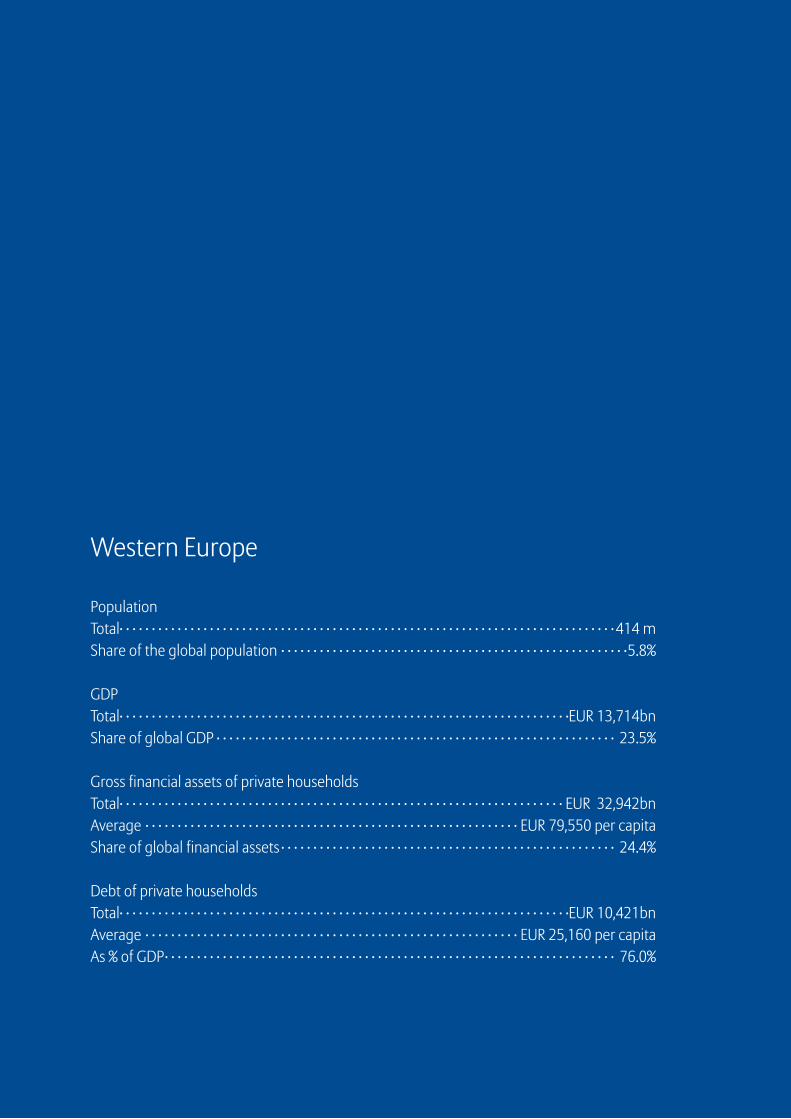
Western Europe
PopulationTotal· · · · · · · · · · · · · · · · · · · · · · · · · · · · · · · · · · · · · · · · · · · · · · · · · · · · · · · · · · · · · · · · · · · · · · · · · · · · · 414 mShare of the global population · · · · · · · · · · · · · · · · · · · · · · · · · · · · · · · · · · · · · · · · · · · · · · · · · · · · · ·5.8%
GDPTotal· · · · · · · · · · · · · · · · · · · · · · · · · · · · · · · · · · · · · · · · · · · · · · · · · · · · · · · · · · · · · · · · · · · · · ·EUR 13,714bnShare of global GDP · · · · · · · · · · · · · · · · · · · · · · · · · · · · · · · · · · · · · · · · · · · · · · · · · · · · · · · · · · · · · · 23.5%
Gross financial assets of private householdsTotal· · · · · · · · · · · · · · · · · · · · · · · · · · · · · · · · · · · · · · · · · · · · · · · · · · · · · · · · · · · · · · · · · · · · · EUR 32,942bnAverage · · · · · · · · · · · · · · · · · · · · · · · · · · · · · · · · · · · · · · · · · · · · · · · · · · · · · · · · · · EUR 79,550 per capitaShare of global financial assets · · · · · · · · · · · · · · · · · · · · · · · · · · · · · · · · · · · · · · · · · · · · · · · · · · · · 24.4%
Debt of private householdsTotal· · · · · · · · · · · · · · · · · · · · · · · · · · · · · · · · · · · · · · · · · · · · · · · · · · · · · · · · · · · · · · · · · · · · · ·EUR 10,421bnAverage · · · · · · · · · · · · · · · · · · · · · · · · · · · · · · · · · · · · · · · · · · · · · · · · · · · · · · · · · · EUR 25,160 per capitaAs % of GDP· · · · · · · · · · · · · · · · · · · · · · · · · · · · · · · · · · · · · · · · · · · · · · · · · · · · · · · · · · · · · · · · · · · · · · 76.0%
Regi
onal
diff
eren
ces:
Wes
tern
Eur
ope
74On the old continent, the savings of private
households grew by 6.7% last year to total around EUR
32.9 trillion. But it was not just in a historical compari-
son (average long-term growth of 3.7% a year since the
end of 2000) that western Europeans outperformed
the average. Asset growth in 2014 was also ahead of
the average for the industrialized nations, coming in at
5.4%.
Insurance policies and pensions remain the
favorite savings product among western Europe‘s
households. This asset class witnessed strong growth
of 11.1% last year, primarily driven by developments in
the Netherlands (+18.5%) and the UK (+17.0%). Private
retirement provision is already extremely important
in these countries, with this asset class accounting for
66.0% and 59.2% of the portfolio respectively at the
end of 2014. 45% of the total receivables of western
European households from insurers and pension ins-
titutions was attributable to these two countries alone.
Valuation gains on bonds are also likely to have made
a significant contribution to these above-average
growth rates. Looking at the region as a whole, this
asset class reached an all-time high, making up 40%
of the asset portfolio. This is, however, also likely due
to the growing awareness of the need to make more
independent provisions for old age. The significance of
state pensions, which make up the lion‘s share of in-
come in old age in most of these countries, is on the
wane due to tight budgets and pension reforms. In
per capita terms, however, receivables from insurance
companies and pension institutions were still lag-
ging behind the industrialized country average (EUR
37,860) at an average of EUR 31,790.
Bank deposits are also held in high esteem
by savers – at the end of 2014, they held no less than
30% of their financial assets in overnight money, term
deposits and savings deposits, up by 3% on 2013. In the
past, the share of total financial assets that is attributa-
ble to bank deposits has remained fairly stable. These
deposits accounted for almost 27% of total financial as-
sets in 2000, with the high to date coming in at around
32% in 2008. Leaving Greece aside, there is no sign
that the money that was pumped into bank deposits
by those seeking a safe haven when the financial crisis
hit is being pulled back out. Irrespective of the interest
rate level, households would appear to not want to do
without a certain degree of liquidity and to favor secu-
rity over returns. This is testimony to the uncertainty
that still hangs over investors.
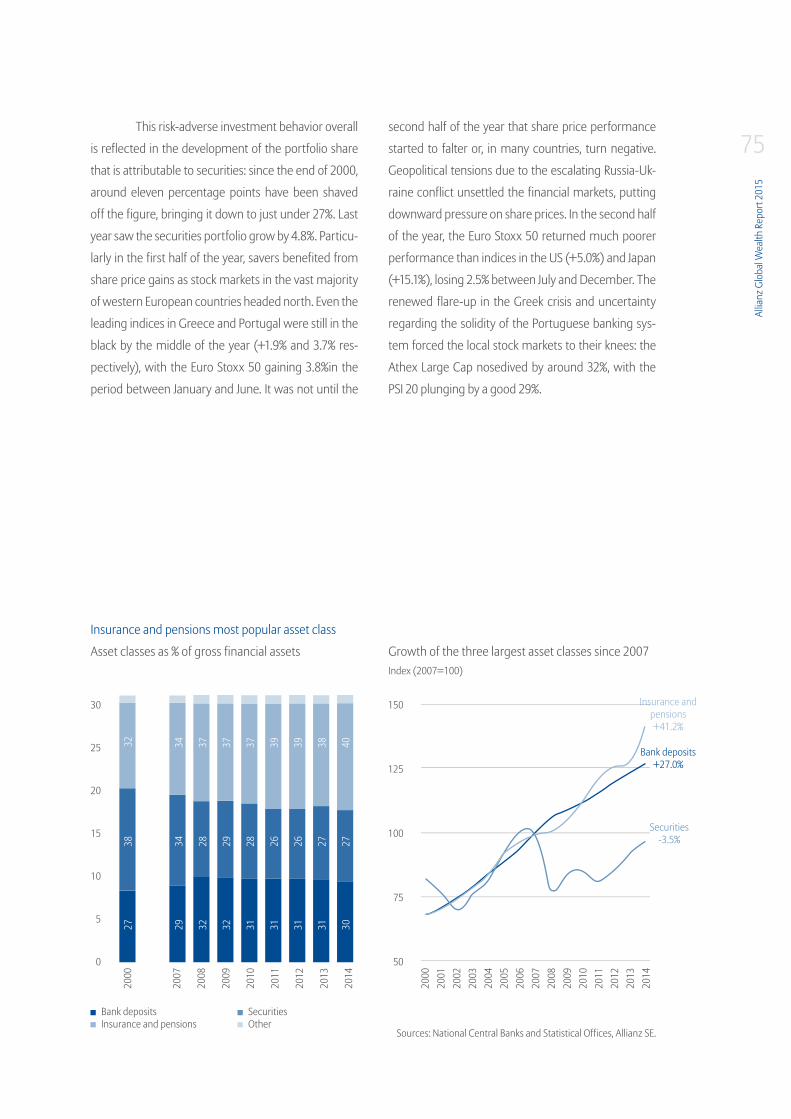
Allia
nz G
loba
l Wea
lth R
epor
t 201
5
75This risk-adverse investment behavior overall
is reflected in the development of the portfolio share
that is attributable to securities: since the end of 2000,
around eleven percentage points have been shaved
off the figure, bringing it down to just under 27%. Last
year saw the securities portfolio grow by 4.8%. Particu-
larly in the first half of the year, savers benefited from
share price gains as stock markets in the vast majority
of western European countries headed north. Even the
leading indices in Greece and Portugal were still in the
black by the middle of the year (+1.9% and 3.7% res-
pectively), with the Euro Stoxx 50 gaining 3.8%in the
period between January and June. It was not until the
second half of the year that share price performance
started to falter or, in many countries, turn negative.
Geopolitical tensions due to the escalating Russia-Uk-
raine conflict unsettled the financial markets, putting
downward pressure on share prices. In the second half
of the year, the Euro Stoxx 50 returned much poorer
performance than indices in the US (+5.0%) and Japan
(+15.1%), losing 2.5% between July and December. The
renewed flare-up in the Greek crisis and uncertainty
regarding the solidity of the Portuguese banking sys-
tem forced the local stock markets to their knees: the
Athex Large Cap nosedived by around 32%, with the
PSI 20 plunging by a good 29%.
Growth of the three largest asset classes since 2007 Index (2007=100)
Sources: National Central Banks and Statistical Offices, Allianz SE.
Asset classes as % of gross financial assets
Insurance and pensions most popular asset class
30
25
20
15
10
5
0
150
125
100
75
50
2000
2007
2008
2009
2010
2011
2012
2013
2014
2000
2001
2002
2003
2004
2005
2006
2007
2008
2009
2010
2011
2012
2013
2014
34 28 29 28 26 26 27 27
34 37 37 37 39 39 38 40
29 32 32 31 31 31 31 30
3832
27
Insurance and pensions+41.2%
Bank deposits+27.0%
Securities-3.5%
Ins
SecuritiesOther
Bank depositsInsurance and pensions
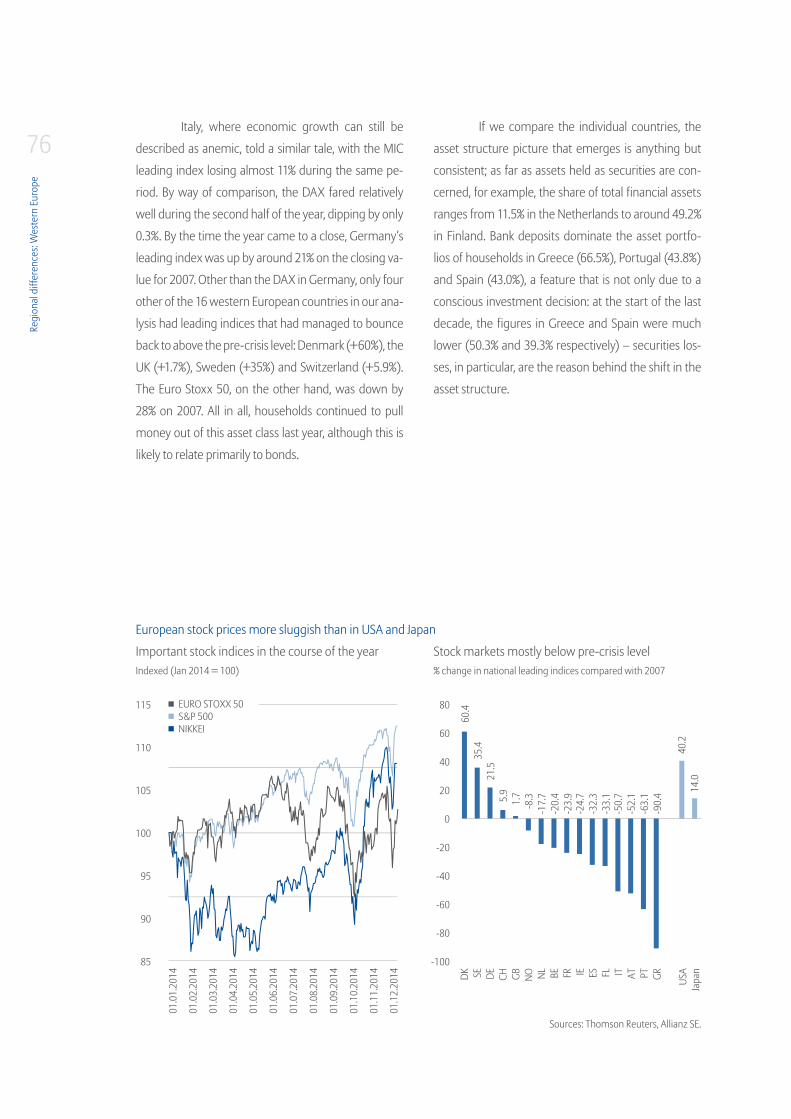
Regi
onal
diff
eren
ces:
Wes
tern
Eur
ope
76Italy, where economic growth can still be
described as anemic, told a similar tale, with the MIC
leading index losing almost 11% during the same pe-
riod. By way of comparison, the DAX fared relatively
well during the second half of the year, dipping by only
0.3%. By the time the year came to a close, Germany‘s
leading index was up by around 21% on the closing va-
lue for 2007. Other than the DAX in Germany, only four
other of the 16 western European countries in our ana-
lysis had leading indices that had managed to bounce
back to above the pre-crisis level: Denmark (+60%), the
UK (+1.7%), Sweden (+35%) and Switzerland (+5.9%).
The Euro Stoxx 50, on the other hand, was down by
28% on 2007. All in all, households continued to pull
money out of this asset class last year, although this is
likely to relate primarily to bonds.
If we compare the individual countries, the
asset structure picture that emerges is anything but
consistent; as far as assets held as securities are con-
cerned, for example, the share of total financial assets
ranges from 11.5% in the Netherlands to around 49.2%
in Finland. Bank deposits dominate the asset portfo-
lios of households in Greece (66.5%), Portugal (43.8%)
and Spain (43.0%), a feature that is not only due to a
conscious investment decision: at the start of the last
decade, the figures in Greece and Spain were much
lower (50.3% and 39.3% respectively) – securities los-
ses, in particular, are the reason behind the shift in the
asset structure.
Important stock indices in the course of the yearIndexed (Jan 2014 = 100)
Stock markets mostly below pre-crisis level% change in national leading indices compared with 2007
European stock prices more sluggish than in USA and Japan
Sources: Thomson Reuters, Allianz SE.
80
60
40
20
0
-20
-40
-60
-80
-100
115
110
105
100
95
90
85
01.0
1.20
14
01.0
2.20
14
01.0
3.20
14
01.0
4.20
14
01.0
5.20
14
01.0
6.20
14
01.0
7.20
14
01.0
8.20
14
01.0
9.20
14
01.1
0.20
14
01.1
1.20
14
01.1
2.20
14 DK SE DE CH GB NO NL BE FR IE ES FL IT AT PT GR USA
Japa
n
35.4
21.5
5.9
1.7
40.2
14.0
-8.3
-17.
7-2
0.4
-23.
9-2
4.7
-32.
3-3
3.1
-50.
7-5
2.1
-63.
1-9
0.4
60.4EURO STOXX 50
S&P 500 NIKKEI
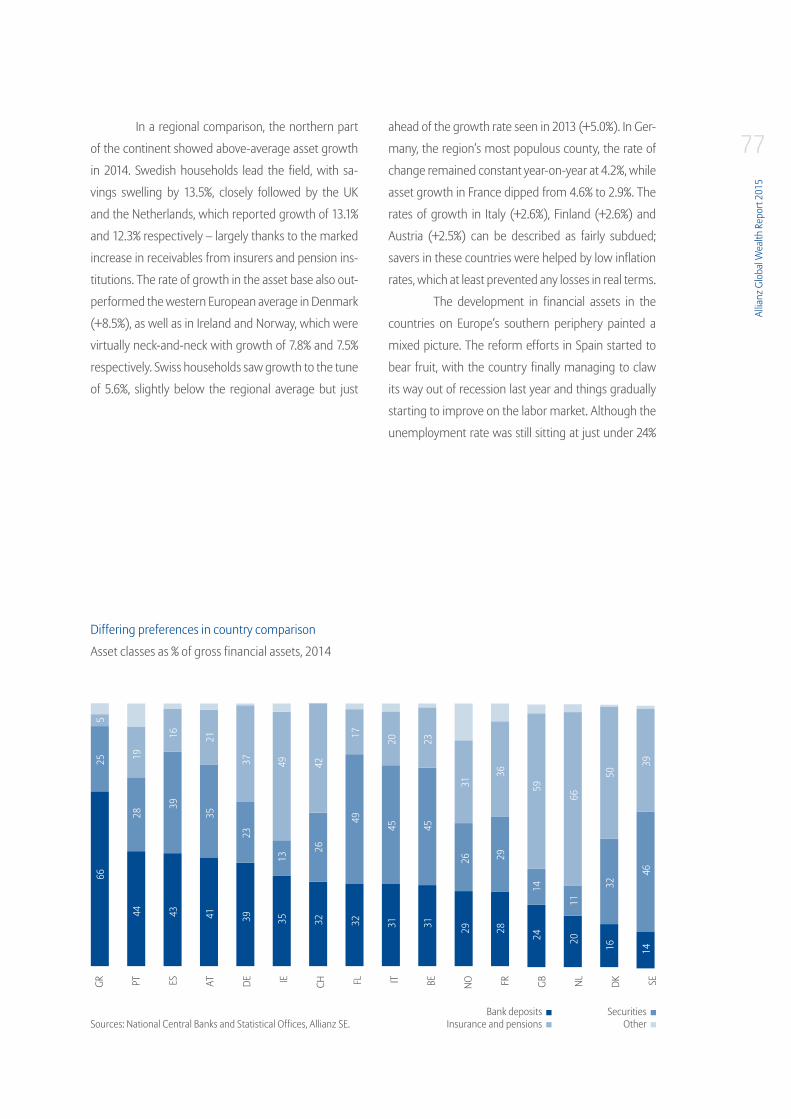
Allia
nz G
loba
l Wea
lth R
epor
t 201
5
77In a regional comparison, the northern part
of the continent showed above-average asset growth
in 2014. Swedish households lead the field, with sa-
vings swelling by 13.5%, closely followed by the UK
and the Netherlands, which reported growth of 13.1%
and 12.3% respectively – largely thanks to the marked
increase in receivables from insurers and pension ins-
titutions. The rate of growth in the asset base also out-
performed the western European average in Denmark
(+8.5%), as well as in Ireland and Norway, which were
virtually neck-and-neck with growth of 7.8% and 7.5%
respectively. Swiss households saw growth to the tune
of 5.6%, slightly below the regional average but just
ahead of the growth rate seen in 2013 (+5.0%). In Ger-
many, the region‘s most populous county, the rate of
change remained constant year-on-year at 4.2%, while
asset growth in France dipped from 4.6% to 2.9%. The
rates of growth in Italy (+2.6%), Finland (+2.6%) and
Austria (+2.5%) can be described as fairly subdued;
savers in these countries were helped by low inflation
rates, which at least prevented any losses in real terms.
The development in financial assets in the
countries on Europe‘s southern periphery painted a
mixed picture. The reform efforts in Spain started to
bear fruit, with the country finally managing to claw
its way out of recession last year and things gradually
starting to improve on the labor market. Although the
unemployment rate was still sitting at just under 24%
Asset classes as % of gross financial assets, 2014
Differing preferences in country comparison
Sources: National Central Banks and Statistical Offices, Allianz SE.
GR PT ES AT DE IE CH FL IT BE NO FR GB NL DK SE
4419
4316
3937
4121
3549
3242
3217
3120
3123
2931
2836
2459
2066
1650
1439
665
25
28
39
35
23
13
26
49
45 45
26 29
14
11
32
46
SecuritiesOther
Bank depositsInsurance and pensions
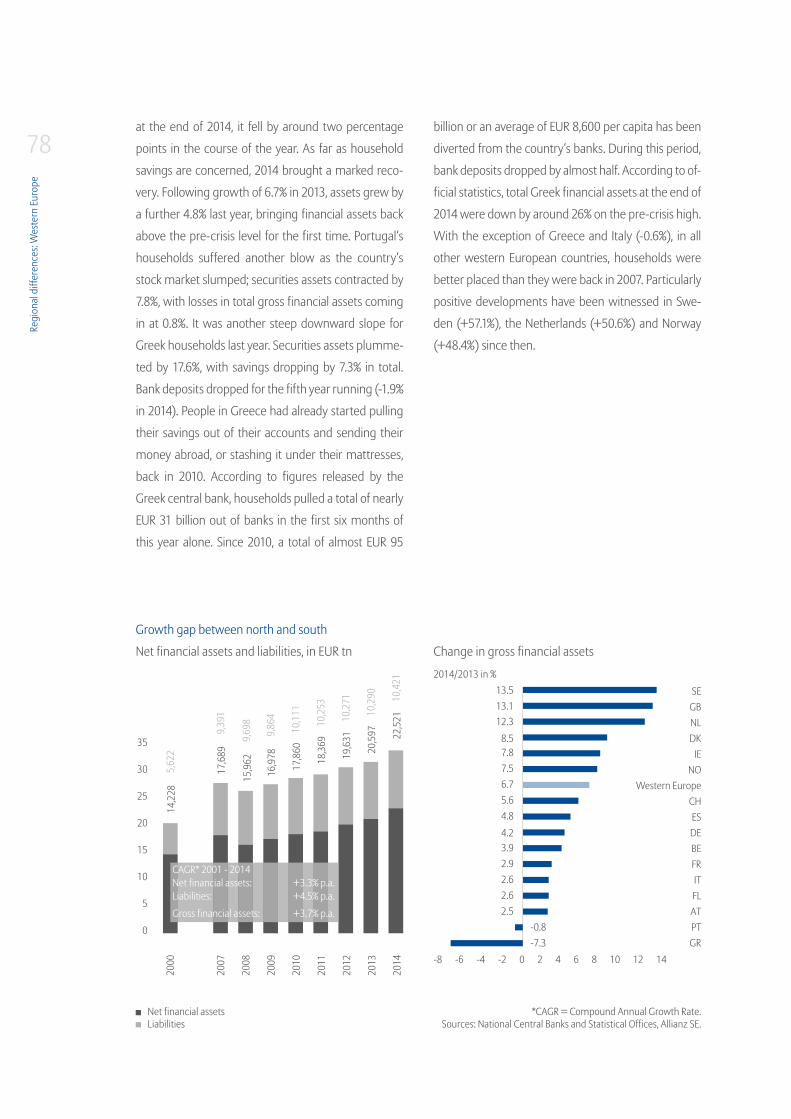
Regi
onal
diff
eren
ces:
Wes
tern
Eur
ope
78at the end of 2014, it fell by around two percentage
points in the course of the year. As far as household
savings are concerned, 2014 brought a marked reco-
very. Following growth of 6.7% in 2013, assets grew by
a further 4.8% last year, bringing financial assets back
above the pre-crisis level for the first time. Portugal‘s
households suffered another blow as the country‘s
stock market slumped; securities assets contracted by
7.8%, with losses in total gross financial assets coming
in at 0.8%. It was another steep downward slope for
Greek households last year. Securities assets plumme-
ted by 17.6%, with savings dropping by 7.3% in total.
Bank deposits dropped for the fifth year running (-1.9%
in 2014). People in Greece had already started pulling
their savings out of their accounts and sending their
money abroad, or stashing it under their mattresses,
back in 2010. According to figures released by the
Greek central bank, households pulled a total of nearly
EUR 31 billion out of banks in the first six months of
this year alone. Since 2010, a total of almost EUR 95
billion or an average of EUR 8,600 per capita has been
diverted from the country‘s banks. During this period,
bank deposits dropped by almost half. According to of-
ficial statistics, total Greek financial assets at the end of
2014 were down by around 26% on the pre-crisis high.
With the exception of Greece and Italy (-0.6%), in all
other western European countries, households were
better placed than they were back in 2007. Particularly
positive developments have been witnessed in Swe-
den (+57.1%), the Netherlands (+50.6%) and Norway
(+48.4%) since then.
Net financial assets and liabilities, in EUR tn Change in gross financial assets
2014/2013 in %
Growth gap between north and south
*CAGR = Compound Annual Growth Rate.Sources: National Central Banks and Statistical Offices, Allianz SE.
Net financial assetsLiabilities
35
30
25
20
15
10
5
0
2000
2007
2008
2009
2010
2011
2012
2013
2014
CAGR* 2001 - 2014Net financial assets: +3.3% p.a.Liabilities: +4.5% p.a.
Gross financial assets: +3.7% p.a.
SEGBNLDK
IENO
Western EuropeCHESDEBEFRITFLATPTGR
13.5
4.8
7.8
2.6
12.3
3.9
6.7
2.5
13.1
4.2
7.5
2.6
-7.3
8.5
2.9
5.6
-0.8
-8 -6 -4 -2 0 2 4 6 8 10 12 14
22,5
21
14,2
28
17,6
89
15,9
62
16,9
78
17,8
60
18,3
69
19,6
31
20,5
97
10,4
21
5,62
2
9,39
1
9,69
8
9,86
4
10,1
11
10,2
53
10,2
71
10,2
90
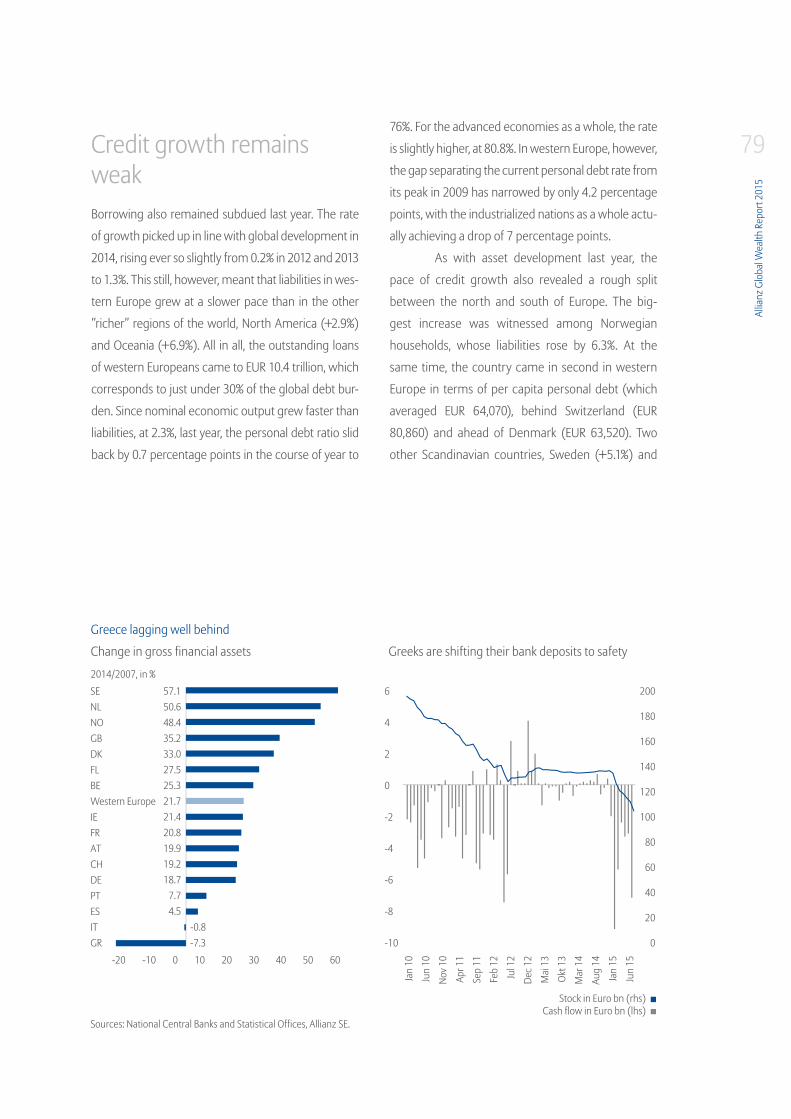
Allia
nz G
loba
l Wea
lth R
epor
t 201
5
79
Change in gross financial assets
2014/2007, in %
Greeks are shifting their bank deposits to safety
Greece lagging well behind
Sources: National Central Banks and Statistical Offices, Allianz SE.
Stock in Euro bn (rhs)Cash flow in Euro bn (lhs)
-7.3-0.8
SENLNO GBDKFLBE Western EuropeIEFRATCHDEPTESITGR
57.150.648.435.233.027.525.321.721.420.819.919.218.7
7.74.5
6
4
2
0
-2
-4
-6
-8
-10
200
180
160
140
120
100
80
60
40
20
0
-20 -10 0 10 20 30 40 50 60
Jan
10
Jun
10
Nov 1
0
Apr 1
1
Sep
11
Feb
12
Jul 1
2
Dec 1
2
Mai
13
Okt 1
3
Mar
14
Aug
14
Jan
15
Jun
15
Credit growth remains weakBorrowing also remained subdued last year. The rate
of growth picked up in line with global development in
2014, rising ever so slightly from 0.2% in 2012 and 2013
to 1.3%. This still, however, meant that liabilities in wes-
tern Europe grew at a slower pace than in the other
”richer” regions of the world, North America (+2.9%)
and Oceania (+6.9%). All in all, the outstanding loans
of western Europeans came to EUR 10.4 trillion, which
corresponds to just under 30% of the global debt bur-
den. Since nominal economic output grew faster than
liabilities, at 2.3%, last year, the personal debt ratio slid
back by 0.7 percentage points in the course of year to
76%. For the advanced economies as a whole, the rate
is slightly higher, at 80.8%. In western Europe, however,
the gap separating the current personal debt rate from
its peak in 2009 has narrowed by only 4.2 percentage
points, with the industrialized nations as a whole actu-
ally achieving a drop of 7 percentage points.
As with asset development last year, the
pace of credit growth also revealed a rough split
between the north and south of Europe. The big-
gest increase was witnessed among Norwegian
households, whose liabilities rose by 6.3%. At the
same time, the country came in second in western
Europe in terms of per capita personal debt (which
averaged EUR 64,070), behind Switzerland (EUR
80,860) and ahead of Denmark (EUR 63,520). Two
other Scandinavian countries, Sweden (+5.1%) and
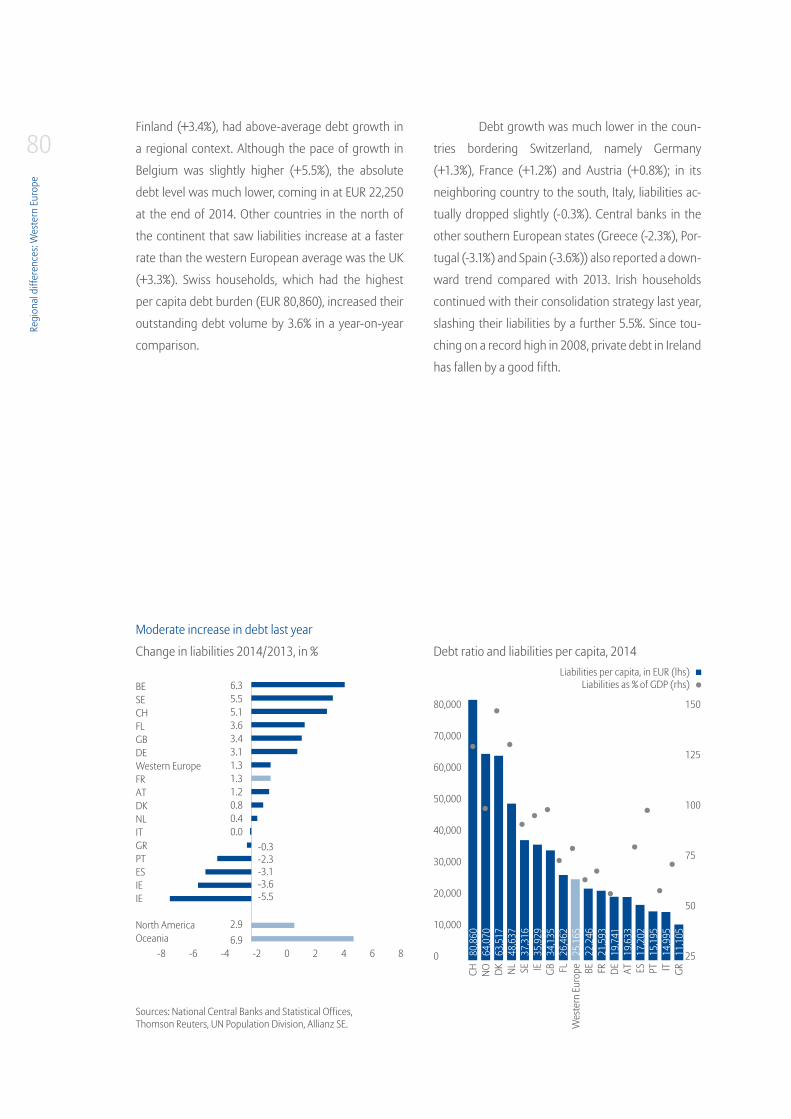
Regi
onal
diff
eren
ces:
Wes
tern
Eur
ope
80
Change in liabilities 2014/2013, in % Debt ratio and liabilities per capita, 2014
Moderate increase in debt last year
Sources: National Central Banks and Statistical Offices, Thomson Reuters, UN Population Division, Allianz SE.
BESECHFLGBDE Western EuropeFRATDKNLITGRPTESIEIE
North AmericaOceania
80,000
70,000
60,000
50,000
40,000
30,000
20,000
10,000
0
150
125
100
75
50
25-8 -6 -4 -2 0 2 4 6 8
CH NO DK NL SE IE GB FLW
este
rn E
urop
e BE FR DE AT ES PT IT GRLiabilities per capita, in EUR (lhs)
Liabilities as % of GDP (rhs)
6.92.9
6.35.55.13.63.43.11.31.31.20.80.40.0
-0.3-2.3-3.1-3.6-5.5
80,8
6064
,070
63,5
1748
,637
37,3
1635
,929
34,1
3526
,462
25,1
6522
,246
21,5
9319
,741
19,6
3317
,202
15,1
9514
,995
11,1
05
Debt growth was much lower in the coun-
tries bordering Switzerland, namely Germany
(+1.3%), France (+1.2%) and Austria (+0.8%); in its
neighboring country to the south, Italy, liabilities ac-
tually dropped slightly (-0.3%). Central banks in the
other southern European states (Greece (-2.3%), Por-
tugal (-3.1%) and Spain (-3.6%)) also reported a down-
ward trend compared with 2013. Irish households
continued with their consolidation strategy last year,
slashing their liabilities by a further 5.5%. Since tou-
ching on a record high in 2008, private debt in Ireland
has fallen by a good fifth.
Finland (+3.4%), had above-average debt growth in
a regional context. Although the pace of growth in
Belgium was slightly higher (+5.5%), the absolute
debt level was much lower, coming in at EUR 22,250
at the end of 2014. Other countries in the north of
the continent that saw liabilities increase at a faster
rate than the western European average was the UK
(+3.3%). Swiss households, which had the highest
per capita debt burden (EUR 80,860), increased their
outstanding debt volume by 3.6% in a year-on-year
comparison.
Allia
nz G
loba
l Wea
lth R
epor
t 201
5
81Although nowhere in the region was ave-
rage per capita debt as low as in Greece (EUR 11,100),
debt levels skyrocketed during the boom years lea-
ding up to the outbreak of the global economic and
financial crisis: whereas in the region as a whole, debt
was rising at an average rate of 7.6% p.a. in the period
between 2001 and 2007, the rate in Greece came in
at 22.3%, even higher than the average rate for the
emerging markets (17%). Since 2008, however, the
annual average growth rate in Greece has slipped
back to only 0.3%, a trend that can be explained by
more than just weaker demand and more stringent
lending guidelines; some households are simply no
longer in a position to repay their loans and creditors
are being forced to write off their receivables.
But the discrepancies in a regional compa-
rison are not just limited to the absolute debt level. If
we compare the liabilities of private households with
nominal economic output, marked national diffe-
rences emerge in terms of the relative debt burden,
too. Not surprisingly, the level of debt was highest in
those countries with the highest per capita debt, too.
Danish households came top of the table here, with
a clear lead over the Netherlands (123.3%), although
the Danish debt ratio has already fallen by almost
twelve percentage points since the end of 2009, fal-
ling to nearly 139%. The ratio in Switzerland (122.4%)
was also well above the 100% mark. The debt ratio
should, in general, be closer to the 100% mark to keep
debt servicing at a manageable level, even in an en-
vironment characterized by a return to rising interest
rates. Austria boasted the lowest ratio at the end of
2013: at only 50.9%, the debt level in Austria was al-
most 88 percentage points lower than in Denmark. In
per capita terms, too, the country was below the wes-
tern European average (EUR 25,160) with EUR 19,630.
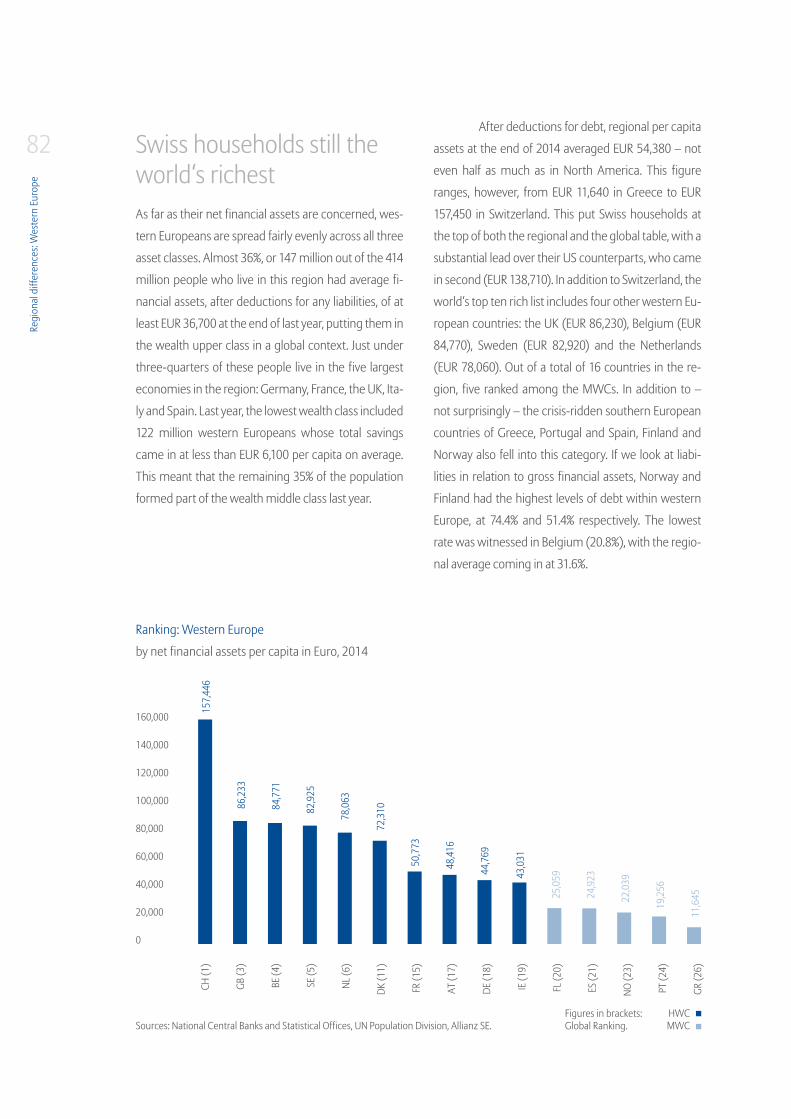
Regi
onal
diff
eren
ces:
Wes
tern
Eur
ope
82 Swiss households still the world‘s richestAs far as their net financial assets are concerned, wes-
tern Europeans are spread fairly evenly across all three
asset classes. Almost 36%, or 147 million out of the 414
million people who live in this region had average fi-
nancial assets, after deductions for any liabilities, of at
least EUR 36,700 at the end of last year, putting them in
the wealth upper class in a global context. Just under
three-quarters of these people live in the five largest
economies in the region: Germany, France, the UK, Ita-
ly and Spain. Last year, the lowest wealth class included
122 million western Europeans whose total savings
came in at less than EUR 6,100 per capita on average.
This meant that the remaining 35% of the population
formed part of the wealth middle class last year.
After deductions for debt, regional per capita
assets at the end of 2014 averaged EUR 54,380 – not
even half as much as in North America. This figure
ranges, however, from EUR 11,640 in Greece to EUR
157,450 in Switzerland. This put Swiss households at
the top of both the regional and the global table, with a
substantial lead over their US counterparts, who came
in second (EUR 138,710). In addition to Switzerland, the
world‘s top ten rich list includes four other western Eu-
ropean countries: the UK (EUR 86,230), Belgium (EUR
84,770), Sweden (EUR 82,920) and the Netherlands
(EUR 78,060). Out of a total of 16 countries in the re-
gion, five ranked among the MWCs. In addition to –
not surprisingly – the crisis-ridden southern European
countries of Greece, Portugal and Spain, Finland and
Norway also fell into this category. If we look at liabi-
lities in relation to gross financial assets, Norway and
Finland had the highest levels of debt within western
Europe, at 74.4% and 51.4% respectively. The lowest
rate was witnessed in Belgium (20.8%), with the regio-
nal average coming in at 31.6%.
by net financial assets per capita in Euro, 2014
Ranking: Western Europe
Sources: National Central Banks and Statistical Offices, UN Population Division, Allianz SE.Figures in brackets: Global Ranking.
160,000
140,000
120,000
100,000
80,000
60,000
40,000
20,000
0
CH (1
)
GB (3
)
BE
(4)
SE (5
)
NL (6
)
DK (1
1)
FR (1
5)
AT (1
7)
DE (1
8)
IE (1
9)
FL (2
0)
ES (2
1)
NO (2
3)
PT (2
4)
GR (2
6)
HWCMWC
157,
446
86,2
33
78,0
63
84,7
71
72,3
10
44,7
69
82,9
25
50,7
73
43,0
31
48,4
16
25,0
59
24,9
23
22,0
39
19,2
56
11,6
45

Allia
nz G
loba
l Wea
lth R
epor
t 201
5
83
84
Vorwort . Zusammenfassung . Entwicklung des globalen Geldvermögens . Verteilung des globalen Geldvermögens . Regionale Unterschiede . Literatur . Appendix
84
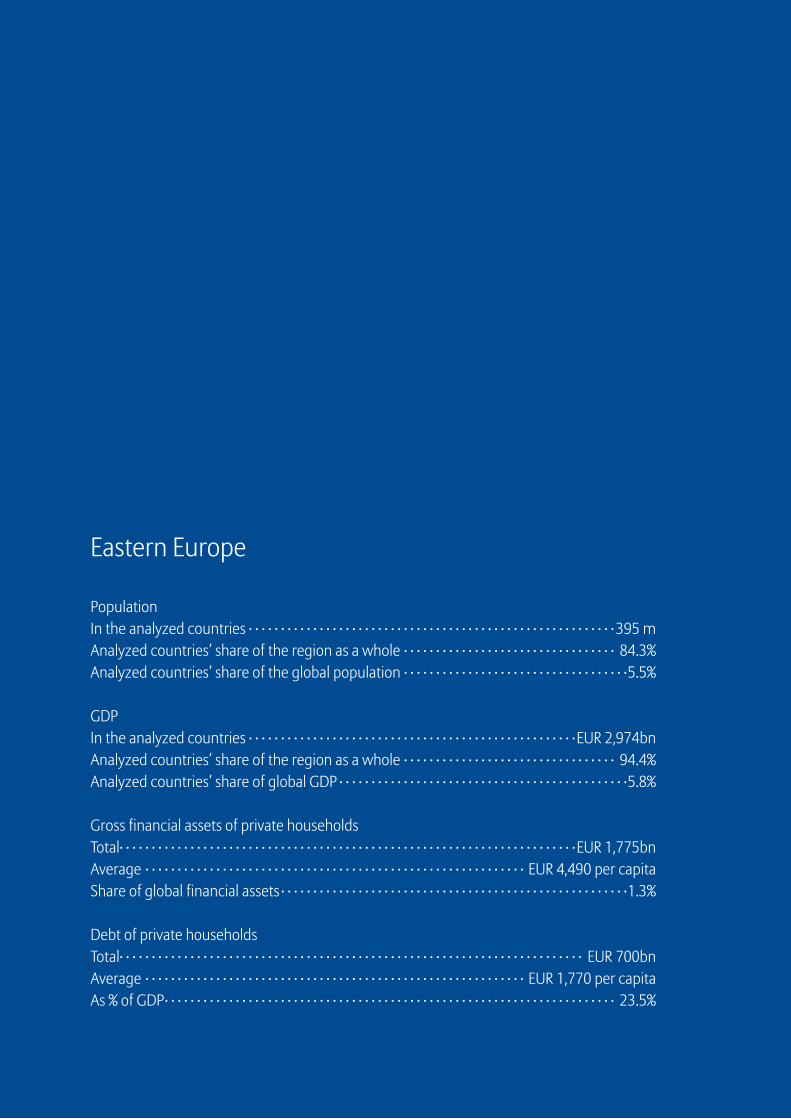
Eastern Europe
PopulationIn the analyzed countries · · · · · · · · · · · · · · · · · · · · · · · · · · · · · · · · · · · · · · · · · · · · · · · · · · · · · · · · · 395 mAnalyzed countries’ share of the region as a whole · · · · · · · · · · · · · · · · · · · · · · · · · · · · · · · · · 84.3%Analyzed countries’ share of the global population · · · · · · · · · · · · · · · · · · · · · · · · · · · · · · · · · · ·5.5%
GDPIn the analyzed countries · · · · · · · · · · · · · · · · · · · · · · · · · · · · · · · · · · · · · · · · · · · · · · · · · · ·EUR 2,974bnAnalyzed countries’ share of the region as a whole · · · · · · · · · · · · · · · · · · · · · · · · · · · · · · · · · 94.4%Analyzed countries’ share of global GDP · · · · · · · · · · · · · · · · · · · · · · · · · · · · · · · · · · · · · · · · · · · · ·5.8%
Gross financial assets of private householdsTotal· · · · · · · · · · · · · · · · · · · · · · · · · · · · · · · · · · · · · · · · · · · · · · · · · · · · · · · · · · · · · · · · · · · · · · ·EUR 1,775bnAverage · · · · · · · · · · · · · · · · · · · · · · · · · · · · · · · · · · · · · · · · · · · · · · · · · · · · · · · · · · · EUR 4,490 per capitaShare of global financial assets · · · · · · · · · · · · · · · · · · · · · · · · · · · · · · · · · · · · · · · · · · · · · · · · · · · · · ·1.3%
Debt of private householdsTotal· · · · · · · · · · · · · · · · · · · · · · · · · · · · · · · · · · · · · · · · · · · · · · · · · · · · · · · · · · · · · · · · · · · · · · · · EUR 700bnAverage · · · · · · · · · · · · · · · · · · · · · · · · · · · · · · · · · · · · · · · · · · · · · · · · · · · · · · · · · · · EUR 1,770 per capitaAs % of GDP· · · · · · · · · · · · · · · · · · · · · · · · · · · · · · · · · · · · · · · · · · · · · · · · · · · · · · · · · · · · · · · · · · · · · · 23.5%
Regi
onal
diff
eren
ces:
East
ern
Euro
pe
86 Eastern European EU membersLast year saw the financial assets of private
households in the EU‘s eastern European member
states increase by 6.0%. This marks a real slowdown
in asset development compared with the previous
two years, when savings increased by 10.7% and 8.9%
respectively.
Although the development witnessed last
year can still be described as extremely robust, the
outbreak of the economic and financial crisis cer-
tainly took considerable wind out of the sails of asset
growth. Whereas growth in the period from 2001 to
2007 averaged around 15%, the average growth rate
has since slipped back to just under 6%.
At the end of 2014, private households still
held the lion‘s share of their savings (around 43%)
in bank deposits, which grew by a substantial 7.9 %
in total in the course of the year. The rate of growth
for assets held as securities slowed considerably last
year from 11.2% in 2013 to 4.9%. Developments va-
ried from country to country. In Croatia, Slovakia and
Hungary, for example, the rate of change as against
2013 ran into the double digits, whereas households
in Poland and Estonia actually saw negative growth
to the tune of 1.8% and 3.5% respectively. Estonia is,
however, the only eastern European EU member sta-
te whose leading index has already surpassed its pre-
crisis high. Stock markets in all of the other countries
were still down on the 2007 level at the end of 2014,
with the gap separating them from the pre-crisis le-
vel ranging from 7.6% in Poland to a whopping 70.5%
in Bulgaria. All in all, the proportion of gross financial
assets held in securities came in at a good 32% – ne-
arly eight percentage points less than when this asset
class was at its peak in 2007.
The receivables of private households from
insurance companies and pension funds fell by 14.9%
last year. This pronounced drop is attributable solely
to developments in Poland: at the end of 2013, the
then Prime Minister Tusk announced that some of
the retirement provision funds managed by private
pension funds would be brought into the fold of the
state. In February of last year, the government then
actually transferred half of these investments over
into the state pension system. The investment funds
transferred related to Polish government bonds and
other securities featuring state guarantees, as well as
cash funds, amounting to a total value of a good PLN
150 billion or the equivalent of almost EUR 36 billion.
This transfer and further pension system reforms
slashed the country‘s public debt by more than 8%
of its gross domestic product virtually ”overnight”.
This move was important from the government‘s
perspective because it was faced with the prospect
of the multi-stage debt ceiling being imposed, which,
under Poland‘s laws and constitution, comes into
effect if the debt ratio exceeds 50%, 55% and 60%
percent of the country‘s economic output. The debt
ceiling limits the government‘s room for maneuver
by imposing increasingly restrictive measures. At
the end of 2013, the public debt ratio was hovering
dangerously close to the 55% mark at 53.1%, where-
as one year later, it came in at only 47.8%. This gave
the government scope to take out new debt again.
Following in the footsteps of Hungary, where Prime
Minister Viktor Orbán nationalized the private funded
pillar of the country‘s retirement provision system in
2010, Poland became the second eastern European
EU member to ”confiscate” private pension accounts.
After having reformed the state pension system
based on the World Bank‘s recommendations at the
end of the 1990s and enhancing the system to in-
clude additional private, funded components, these
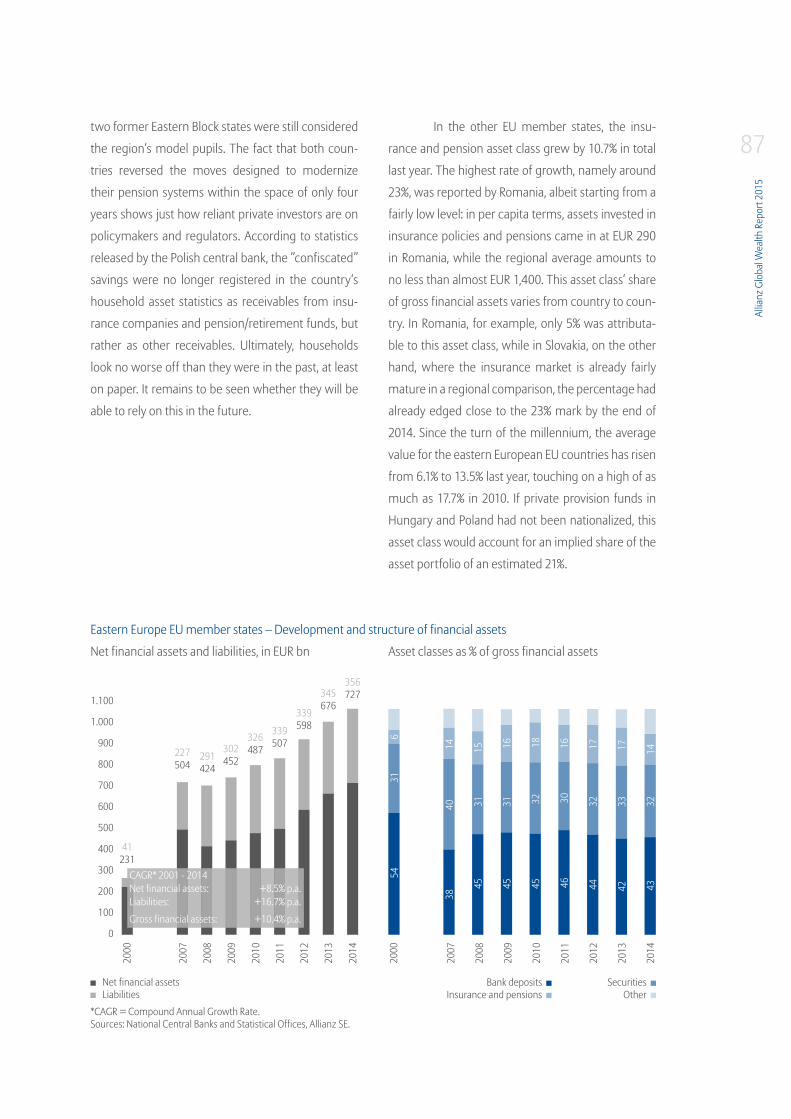
Allia
nz G
loba
l Wea
lth R
epor
t 201
5
87two former Eastern Block states were still considered
the region‘s model pupils. The fact that both coun-
tries reversed the moves designed to modernize
their pension systems within the space of only four
years shows just how reliant private investors are on
policymakers and regulators. According to statistics
released by the Polish central bank, the ”confiscated”
savings were no longer registered in the country‘s
household asset statistics as receivables from insu-
rance companies and pension/retirement funds, but
rather as other receivables. Ultimately, households
look no worse off than they were in the past, at least
on paper. It remains to be seen whether they will be
able to rely on this in the future.
In the other EU member states, the insu-
rance and pension asset class grew by 10.7% in total
last year. The highest rate of growth, namely around
23%, was reported by Romania, albeit starting from a
fairly low level: in per capita terms, assets invested in
insurance policies and pensions came in at EUR 290
in Romania, while the regional average amounts to
no less than almost EUR 1,400. This asset class‘ share
of gross financial assets varies from country to coun-
try. In Romania, for example, only 5% was attributa-
ble to this asset class, while in Slovakia, on the other
hand, where the insurance market is already fairly
mature in a regional comparison, the percentage had
already edged close to the 23% mark by the end of
2014. Since the turn of the millennium, the average
value for the eastern European EU countries has risen
from 6.1% to 13.5% last year, touching on a high of as
much as 17.7% in 2010. If private provision funds in
Hungary and Poland had not been nationalized, this
asset class would account for an implied share of the
asset portfolio of an estimated 21%.
1.100
1.000
900
800
700
600
500
400
300
200
100
0
2000
2007
2008
2009
2010
2011
2012
2013
2014
2000
2007
2008
2009
2010
2011
2012
2013
2014
CAGR* 2001 - 2014 Net financial assets: +8.5% p.a.Liabilities: +16.7% p.a.
Gross financial assets: +10.4% p.a.
Eastern Europe EU member states – Development and structure of financial assets
Net financial assets and liabilities, in EUR bn Asset classes as % of gross financial assets
4531
15 1631
45
1832
45
1630
46
1732
44
1733
42
1432
43
3840
14
5431
6
*CAGR = Compound Annual Growth Rate.Sources: National Central Banks and Statistical Offices, Allianz SE.
Net financial assetsLiabilities
41231
227504
291424
302452
326487
339507
339598
345676
356727
SecuritiesOther
Bank depositsInsurance and pensions
Regi
onal
diff
eren
ces:
East
ern
Euro
pe
88 Per capita debt well ahead of the level for the emer-ging markets
The eastern European countries‘ entry to the EU has
also given the financial sector a real boost in terms
of development. Austrian and Scandinavian banks, in
particular, have been on a major expansion trip in the
region, propelling lending to the private sector as a
whole from just under 32% of nominal economic out-
put in 2000 to around 56% eight years later. Among
private households alone, annual debt growth rates
in excess of 30% were not uncommon prior to the
outbreak of the financial crisis. By the end of 2008,
the household debt level had more than trebled from
9.5% of gross domestic product to around 32%. The
tremendous boom met with an abrupt end in 2009,
when the financial crisis forced banks to restrict len-
ding in, and to, eastern Europe. Since then, the annu-
al debt growth rate has slowed to 3.4% on average,
with six out of the eleven countries actually reporting
negative growth in liabilities overall last year. In ab-
solute terms, household liabilities swelled by EUR
11 billion in 2014 – only 17% of the peak value seen
in 2008. Average per capita debt in the EU member
states located in eastern Europe climbed by 3.4% in
the course of last year to total EUR 3,370. Within the
context of the emerging markets as a whole – ave-
rage per capita debt of EUR 1,460 – this is still fairly
high. A look at the regional debt ratio, however, puts
this into perspective: over the past few years, the ra-
tio of liabilities to economic output has stabilized at
approximately 33%. Some of Asia‘s emerging mar-
kets, such as Malaysia and Thailand, have rates that
are already much higher (85% and 80% respectively).
Within eastern Europe, there is considerable variati-
on in the debt level from country to country, ranging
from 23.8% in Romania to 44.1% in Estonia. Although
the Estonians have the highest debt ratio in this group
of countries, they are still a long way off the western
European average of 76%.

Allia
nz G
loba
l Wea
lth R
epor
t 201
5
89Over the past two years, however, debt
growth has been on the rise again in tandem with the
global trend. Whereas the outstanding debt volume
was still stagnating in 2012, the annual rate of change
rose from 1.7% in 2013 to 3.2% last year. Polish and
Slovakian households, which, combined, account for
half of the region‘s total debt burden, even came in
far higher than the average, with debt growth of 5.4%
and 11.1% respectively.
Payment difficulties due to the appreciation of the Swiss franc – policymakers take actionThe surprising move taken by the Swiss National Bank
(SNB) in mid-January of this year to abandon the cap
on the Swiss currency‘s value against the euro, and
the abrupt appreciation of the Swiss franc that follo-
wed, fueled a further increase in liabilities in eastern
Europe, where many households had taken a large
part of their (mortgage) loans out in Swiss francs to
benefit from lower interest rates. Particularly in Ro-
mania, Croatia and Poland, where the proportion of
loans taken out in Swiss francs is relatively high, any
further appreciation of the foreign currency could
pose a risk to the stability of the financial system:
borrowers will have to pay back more in their local
currencies, which could leave them struggling to pay.
Debt-to-GDP ratio by country 2014, in %
Sources: National Central Banks and Statistical Offices,Thomson Reuters, Allianz SE.
Debt development, index (2000=100) (lhs)Debt-to-GDP ratio, in % (rhs)
0 10 20 30 40 50 60 70 80
44.1
41.3
36.2
35.0
35.4
32.8
31.2
28.9
27.4
28.5
23.8
32.9
76.0
Estonia
Croatia
Slovakia
Poland
Czech Republic
Slovenia
Lithuania
Hungary
Bulgaria
Latvia
Romania
Debt development since end of 2000
Pace of debt growth up again
EU Eastern EuropeWestern Europe
2000
2001
2002
2003
2004
2005
2006
2007
2008
2009
2010
2011
2012
2013
2014
900
800
700
600
500
400
300
200
100
40
35
30
25
20
15
10
5
0
100.
013
4.3 17
6.7
202.
5 244.
8 313.
642
4.2
553.
170
9.7
736.
3 794.
7 827.
782
7.9
842.
386
9.7

Regi
onal
diff
eren
ces:
East
ern
Euro
pe
90In order to minimize the risk, the Hungarian autho-
rities had already decided to take action back in No-
vember 2014 – even before the SNB‘s decision: they
forced banks to convert mortgage loans denomina-
ted in Swiss francs into the local currency. In Croatia,
too, parliament implemented a fixed exchange rate
by law at the end of January 2015, which will apply
to consumer loans denominated in Swiss francs for
a period of up to one year. As in Hungary, the costs
associated with the exchange rate differential will
be borne by financial institutions. The Polish govern-
ment is also toying with the idea of lending a helping
hand to borrowers experiencing payment difficulties
in this election year. Based on the proposal put for-
ward in July, they are to be given the option of con-
verting their mortgage loans into Polish zloty, sub-
ject to certain restrictions, to hedge against future
exchange rate fluctuations. The government wants
financial institutions to shoulder half of the additional
burden caused by the appreciation of the Swiss franc.
Political measures like these will squeeze the profita-
bility of banks in the region.
Wealth gap between the east and the westAfter deductions for liabilities, households in the eas-
tern European EU member states had average per
capita assets of EUR 6,870 at the end of 2014. The
leader of the regional pack is and remains Slovenia,
where each citizen has average assets of EUR 12,630.
In a comparison with western Europe, the Slovenians
have overtaken their counterparts in Greece, whe-
re per capita assets dropped to EUR 11,640 on ave-
rage. Although net financial assets in Romania have
grown almost fourteen-fold during the same period,
households in this country still come bottom of the
regional league with average assets of EUR 4,230.
This means that Romania has still not shaken off its
status as a LWC. In Lithuania, which joined the euro-
zone on January 1 of this year, household financial as-
sets averaged EUR 6,750 per capita at the end of last
year, on a par with the regional average. Looking at
the big picture, the differences between the eastern
and western European EU member states are still
immense. Whereas eastern European households,
which account for 2.1% of the population, accounted
for only 0.7% of global net financial assets in the 53
countries included in our analysis, western Europe‘s
EU citizens, which represent 8.1% of the population,
account for 21% of global assets. At EUR 52,700, ave-
rage per capita assets in the EU countries in western
Europe were almost eight times as high as in the eas-
tern European member states.
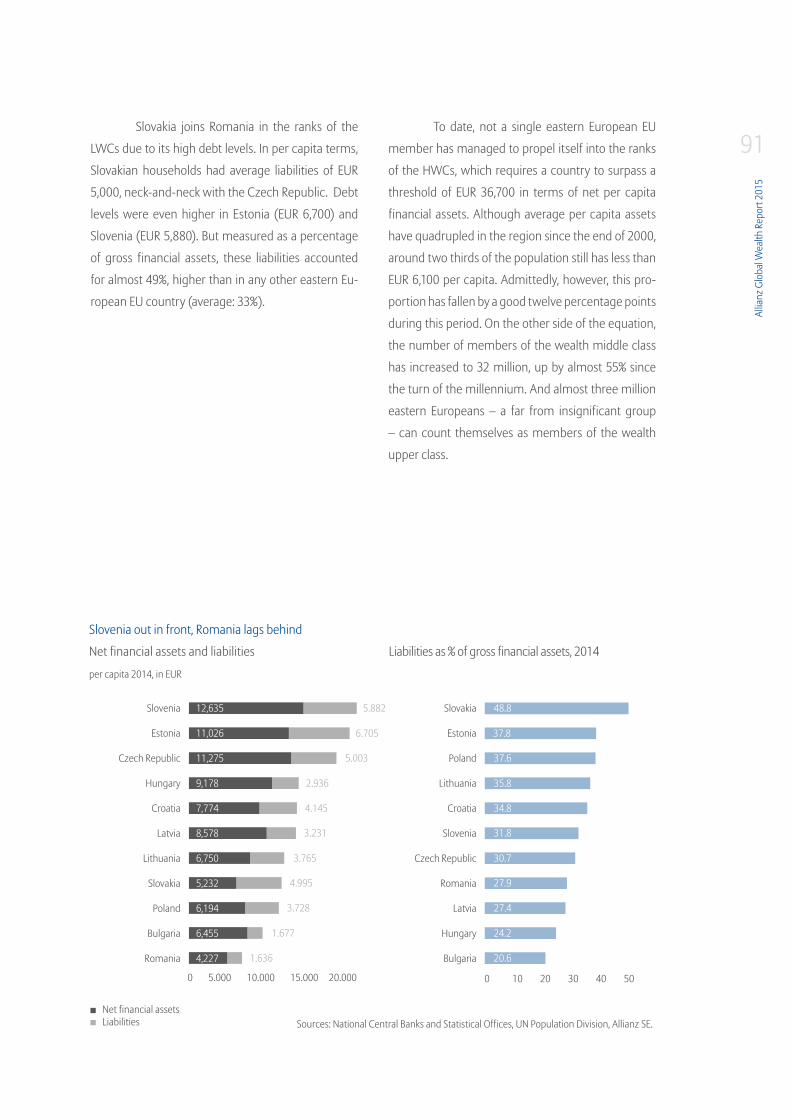
Allia
nz G
loba
l Wea
lth R
epor
t 201
5
91Slovakia joins Romania in the ranks of the
LWCs due to its high debt levels. In per capita terms,
Slovakian households had average liabilities of EUR
5,000, neck-and-neck with the Czech Republic. Debt
levels were even higher in Estonia (EUR 6,700) and
Slovenia (EUR 5,880). But measured as a percentage
of gross financial assets, these liabilities accounted
for almost 49%, higher than in any other eastern Eu-
ropean EU country (average: 33%).
To date, not a single eastern European EU
member has managed to propel itself into the ranks
of the HWCs, which requires a country to surpass a
threshold of EUR 36,700 in terms of net per capita
financial assets. Although average per capita assets
have quadrupled in the region since the end of 2000,
around two thirds of the population still has less than
EUR 6,100 per capita. Admittedly, however, this pro-
portion has fallen by a good twelve percentage points
during this period. On the other side of the equation,
the number of members of the wealth middle class
has increased to 32 million, up by almost 55% since
the turn of the millennium. And almost three million
eastern Europeans – a far from insignificant group
– can count themselves as members of the wealth
upper class.
Net financial assets and liabilities
per capita 2014, in EUR
Liabilities as % of gross financial assets, 2014
Slovenia out in front, Romania lags behind
Sources: National Central Banks and Statistical Offices, UN Population Division, Allianz SE.
Slovenia
Estonia
Czech Republic
Hungary
Croatia
Latvia
Lithuania
Slovakia
Poland
Bulgaria
Romania
12,635
11,026
11,275
9,178
7,774
8,578
6,750
5,232
6,194
6,455
4,227
Slovakia
Estonia
Poland
Lithuania
Croatia
Slovenia
Czech Republic
Romania
Latvia
Hungary
Bulgaria
0 5.000 10.000 15.000 20.000 0 10 20 30 40 50
Net financial assetsLiabilities
48.85.882
37.86.705
37.65.003
2.936
4.145
3.231
3.765
4.995
3.728
1.677
1.636
35.8
34.8
31.8
30.7
27.9
27.4
24.2
20.6

Regi
onal
diff
eren
ces:
East
ern
Euro
pe
92 Eastern European countries outside of the EUAt around EUR 690 billion, only 0.5% of the world‘s
gross financial assets were located in Kazakhstan,
Russia, Serbia, Turkey and Ukraine at the end of 2014,
although no less than 5.9% of the population inclu-
ded in our analysis live in these countries. In 2013, this
group of countries still accounted for a share of 0.7%;
the downward trend reflects the negative currency
developments in Russia and Ukraine, in particular.
The region with the smallest slice of the
global asset cake has experienced a decade of rapid
growth . Since the end of 2000, financial assets
have been growing at almost 24% p.a. on average.
This growth came, however, against the backdrop
of a very low starting point: at the start of the new
millennium, average gross per capita financial assets
totaled an estimated EUR 120 or so. Although the
outbreak of the financial crisis took some wind out of
the sails of growth, the annual growth rates have still
been averaging around 16% in the period since then.
Last year, on the other hand, the growth rate came in
at just under 11%, well below the historical average.
And it was not only savings in this group of
countries that were growing rapidly. Record growth
rates were witnessed on the liabilities side of the
asset balance sheet, too. And yet, despite average
annual growth rates of almost 39% since the end of
2000, the region‘s debt level was the lowest in the
world at the end of last year, corresponding to 18%
of nominal economic output or the equivalent of EUR
1,190 per capita.
Average net financial assets in this group
of countries were roughly on a par with per capita
debt at EUR 1,200. Since a good three-quarters of the
region‘s population lives in Russia and Turkey, it co-
mes as no surprise that the financial assets are also
concentrated in these two countries: around 82% of
regional net financial assets are in the hands of Russi-
an and Turkish private households.
In Russia, asset development came to a vir-
tual standstill last year: whereas growth in net finan-
cial assets of more than 30% has been anything but a
rare occurrence in a long-term comparison, growth
plummeted to 2.6% in 2014. The escalation of the cri-
sis in eastern Ukraine prompted the EU to step up its
sanctions against Russia. The import embargo on ag-
ricultural products imposed by the Kremlin in return
pushed domestic food prices up, forcing consumers
to spend a larger chunk of their income on food. In
addition to the sanctions, the drop in oil prices and
general uncertainty surrounding the continued geo-
political conflict also had a negative impact on the
economy. The Russian ruble lost more than 60% of its
value against the euro last year alone and the country
was plunged into a recession. This naturally puts Rus-
sian households in a much worse situation than they
were one year ago in euro terms: at the end of 2014,
net financial assets averaged EUR 900 per capita. If
the ruble-euro exchange rate had remained stable,
per capita assets would have totaled EUR 1,450.
Allia
nz G
loba
l Wea
lth R
epor
t 201
5
93Households in Ukraine suffered a similar
fate, with their domestic currency losing as much as
almost 69% against the euro in the course of year. In
per capita terms, the average financial assets of Uk-
rainians amounted to EUR 1,040 (net); if their curren-
cy had remained stable, this would have equated to
no less than EUR 1,750. Here too, households have
been feeling the impact of the crisis in their wallets
for some time now. Asset growth slowed further to
an estimated 8% last year. Given that the inflation rate
came to 12.1%, households actually incurred losses in
real terms.
The EU accession candidate, Turkey, also has
serious catch-up work to do when it comes to wealth
development. At an average of EUR 2,090, per capita
net financial assets were considerably lower than for
Romanian households, which already had per capita
wealth averaging EUR 3,160 when the country joined
the EU in 2007. Nevertheless, the Turkish population
has also been afflicted by currency crises and hyper-
inflation in the past. So it comes as no surprise that
rebuilding confidence in the Turkish economy and
the country‘s own currency has been a long, drawn-
out battle. As a result, Turkish households also tend to
be very conservative when it comes to investing their
savings: 82% of savings were held in bank deposits,
with almost one-quarter of these deposits still deno-
minated in foreign currencies.
Serbia‘s and Kazakhstan‘s households lag far
behind with average assets of only EUR 860 and EUR
410 per capita respectively. Bank deposits account for
the lion‘s share of financial assets in these countries,
with households favoring safe foreign currencies. In
Kazakhstan, more than two-thirds of bank deposits
were denominated in a foreign currency and in Ser-
bia, which launched its EU accession negotiations at
the start of this year, private households held almost
all of their savings (89%) in foreign currencies, pri-
marily in euros. This extremely high figure not only
reflects a lack of trust in the country‘s own currency,
but is also likely to be an indicator of high levels of
(illegal) monetary circulation in foreign currencies in
the economy as a whole, creating a breeding ground
for the black market. In circumstances like these,
getting to the bottom of the actual asset situation is
obviously very difficult – something that doubtlessly
applies to countries other than Serbia, too.
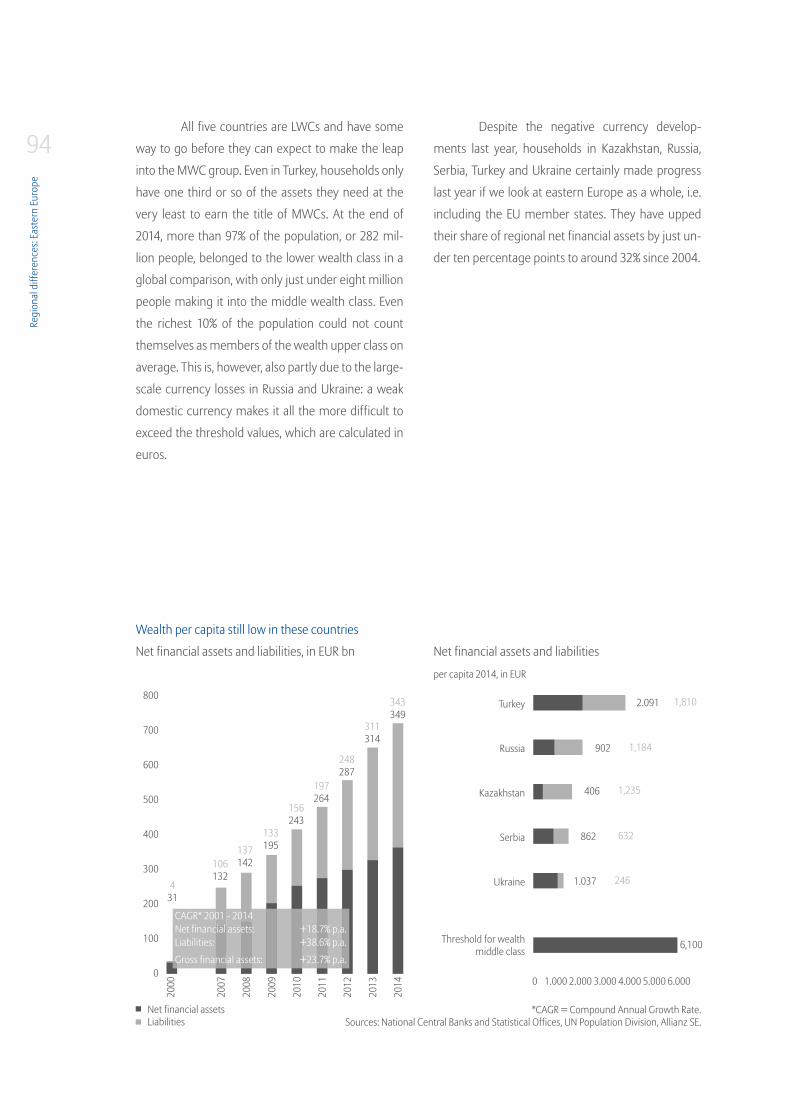
Regi
onal
diff
eren
ces:
East
ern
Euro
pe
94All five countries are LWCs and have some
way to go before they can expect to make the leap
into the MWC group. Even in Turkey, households only
have one third or so of the assets they need at the
very least to earn the title of MWCs. At the end of
2014, more than 97% of the population, or 282 mil-
lion people, belonged to the lower wealth class in a
global comparison, with only just under eight million
people making it into the middle wealth class. Even
the richest 10% of the population could not count
themselves as members of the wealth upper class on
average. This is, however, also partly due to the large-
scale currency losses in Russia and Ukraine: a weak
domestic currency makes it all the more difficult to
exceed the threshold values, which are calculated in
euros.
Despite the negative currency develop-
ments last year, households in Kazakhstan, Russia,
Serbia, Turkey and Ukraine certainly made progress
last year if we look at eastern Europe as a whole, i.e.
including the EU member states. They have upped
their share of regional net financial assets by just un-
der ten percentage points to around 32% since 2004.
Wealth per capita still low in these countries
Net financial assets and liabilities, in EUR bn Net financial assets and liabilities
per capita 2014, in EUR
*CAGR = Compound Annual Growth Rate.Sources: National Central Banks and Statistical Offices, UN Population Division, Allianz SE.
Net financial assetsLiabilities
800
700
600
500
400
300
200
100
0
2000
2007
2008
2009
2010
2011
2012
2013
2014
CAGR* 2001 - 2014 Net financial assets: +18.7% p.a.Liabilities: +38.6% p.a.
Gross financial assets: +23.7% p.a.
Turkey
Russia
Kazakhstan
Serbia
Ukraine
6,100Threshold for wealth middle class
0 1.000 2.000 3.000 4.000 5.000 6.000
431
106132
137142
133195
156243
197264
248287
311314
343349
2.091
902
406
862
1.037
1,810
1,184
1,235
632
246

Allia
nz G
loba
l Wea
lth R
epor
t 201
5
95
96
Vorwort . Zusammenfassung . Entwicklung des globalen Geldvermögens . Verteilung des globalen Geldvermögens . Regionale Unterschiede . Literatur . Appendix
96
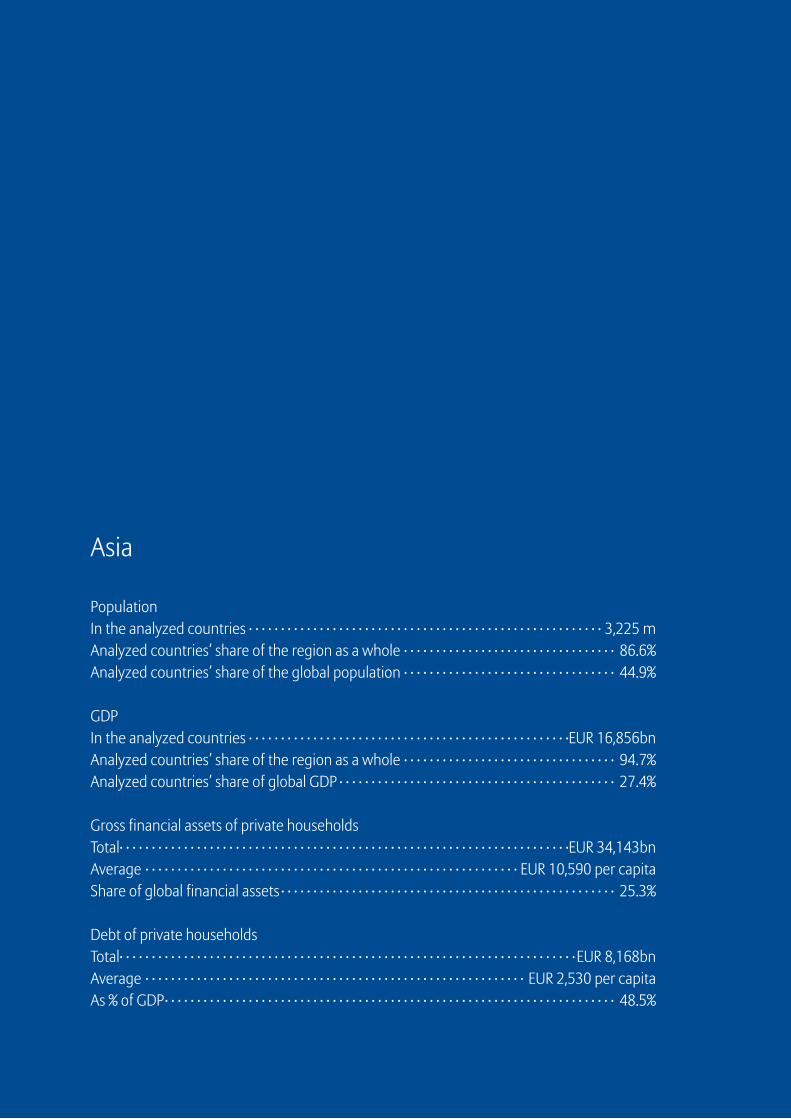
Asia
PopulationIn the analyzed countries · · · · · · · · · · · · · · · · · · · · · · · · · · · · · · · · · · · · · · · · · · · · · · · · · · · · · · · 3,225 m Analyzed countries’ share of the region as a whole · · · · · · · · · · · · · · · · · · · · · · · · · · · · · · · · · 86.6% Analyzed countries’ share of the global population · · · · · · · · · · · · · · · · · · · · · · · · · · · · · · · · · 44.9%
GDPIn the analyzed countries · · · · · · · · · · · · · · · · · · · · · · · · · · · · · · · · · · · · · · · · · · · · · · · · · ·EUR 16,856bnAnalyzed countries’ share of the region as a whole · · · · · · · · · · · · · · · · · · · · · · · · · · · · · · · · · 94.7% Analyzed countries’ share of global GDP · · · · · · · · · · · · · · · · · · · · · · · · · · · · · · · · · · · · · · · · · · · 27.4%
Gross financial assets of private householdsTotal· · · · · · · · · · · · · · · · · · · · · · · · · · · · · · · · · · · · · · · · · · · · · · · · · · · · · · · · · · · · · · · · · · · · · ·EUR 34,143bnAverage · · · · · · · · · · · · · · · · · · · · · · · · · · · · · · · · · · · · · · · · · · · · · · · · · · · · · · · · · · EUR 10,590 per capitaShare of global financial assets · · · · · · · · · · · · · · · · · · · · · · · · · · · · · · · · · · · · · · · · · · · · · · · · · · · · 25.3%
Debt of private householdsTotal· · · · · · · · · · · · · · · · · · · · · · · · · · · · · · · · · · · · · · · · · · · · · · · · · · · · · · · · · · · · · · · · · · · · · · ·EUR 8,168bnAverage · · · · · · · · · · · · · · · · · · · · · · · · · · · · · · · · · · · · · · · · · · · · · · · · · · · · · · · · · · · EUR 2,530 per capitaAs % of GDP· · · · · · · · · · · · · · · · · · · · · · · · · · · · · · · · · · · · · · · · · · · · · · · · · · · · · · · · · · · · · · · · · · · · · · 48.5%
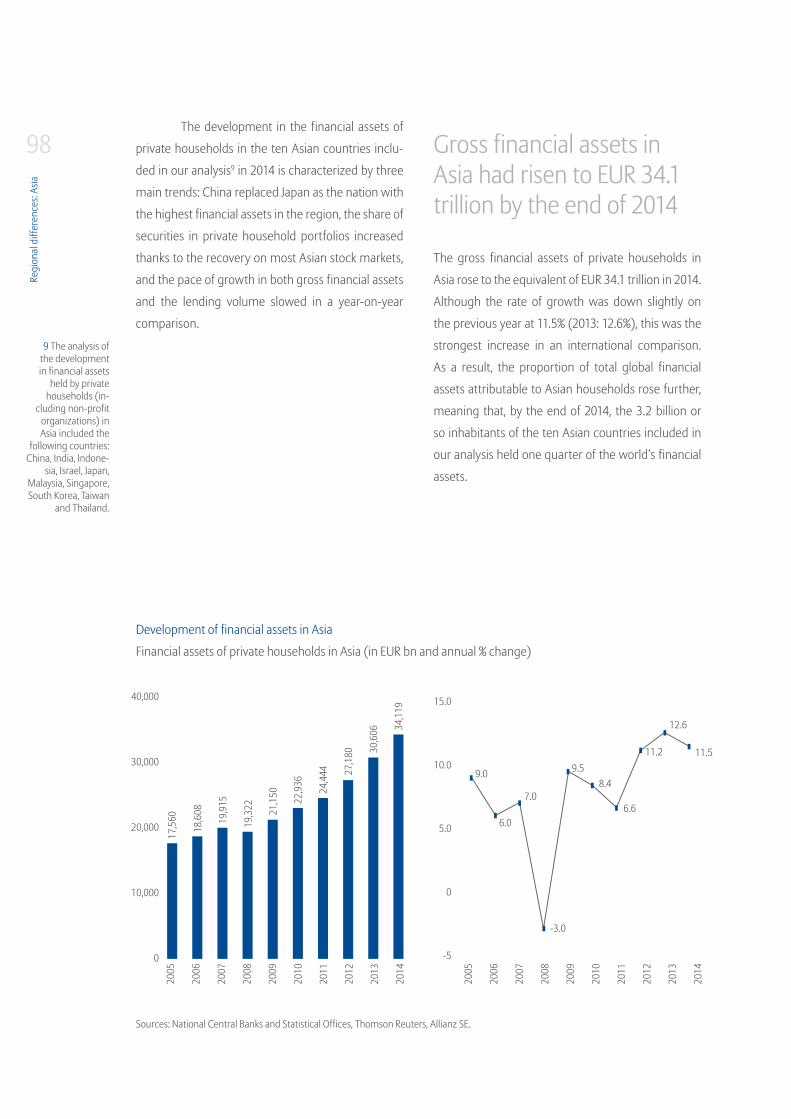
Regi
onal
diff
eren
ces:
Asia
98The development in the financial assets of
private households in the ten Asian countries inclu-
ded in our analysis9 in 2014 is characterized by three
main trends: China replaced Japan as the nation with
the highest financial assets in the region, the share of
securities in private household portfolios increased
thanks to the recovery on most Asian stock markets,
and the pace of growth in both gross financial assets
and the lending volume slowed in a year-on-year
comparison.
Gross financial assets in Asia had risen to EUR 34.1 trillion by the end of 2014
The gross financial assets of private households in
Asia rose to the equivalent of EUR 34.1 trillion in 2014.
Although the rate of growth was down slightly on
the previous year at 11.5% (2013: 12.6%), this was the
strongest increase in an international comparison.
As a result, the proportion of total global financial
assets attributable to Asian households rose further,
meaning that, by the end of 2014, the 3.2 billion or
so inhabitants of the ten Asian countries included in
our analysis held one quarter of the world‘s financial
assets.
Development of financial assets in Asia
Financial assets of private households in Asia (in EUR bn and annual % change)
Sources: National Central Banks and Statistical Offices, Thomson Reuters, Allianz SE.
2005
2006
2007
2008
2009
2010
2011
2012
2013
2014
2005
2006
2007
2008
2009
2010
2011
2012
2013
2014
40,000
30,000
20,000
10,000
0
15.0
10.0
5.0
0
-5
17,5
60
18,6
08
19,9
15
19,3
22 21,1
50 22,9
36
24,4
44 27,1
80
9.0
6.0
7.0
-3.0
9.58.4
6.6
11.2
12.6
11.530,6
06 34,1
19
9 The analysis of the development in financial assets
held by private households (in-
cluding non-profit organizations) in Asia included the
following countries: China, India, Indone-
sia, Israel, Japan, Malaysia, Singapore, South Korea, Taiwan
and Thailand.
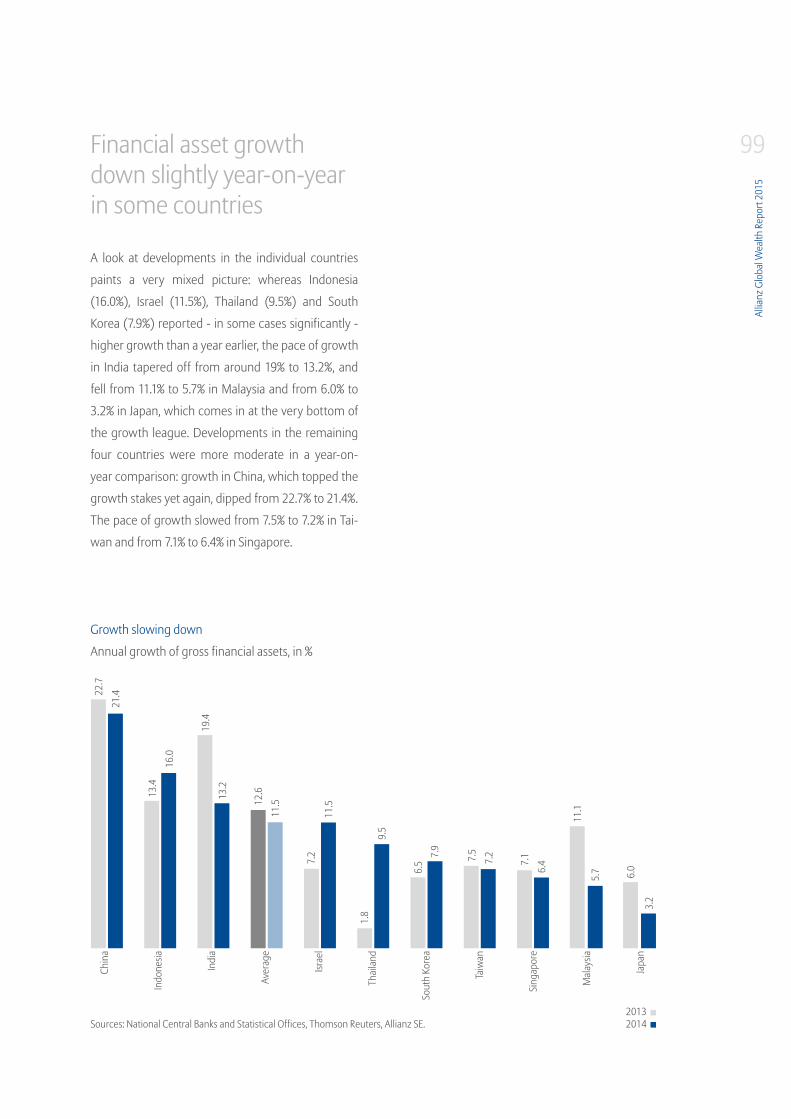
Allia
nz G
loba
l Wea
lth R
epor
t 201
5
99Financial asset growth down slightly year-on-year in some countries
A look at developments in the individual countries
paints a very mixed picture: whereas Indonesia
(16.0%), Israel (11.5%), Thailand (9.5%) and South
Korea (7.9%) reported - in some cases significantly -
higher growth than a year earlier, the pace of growth
in India tapered off from around 19% to 13.2%, and
fell from 11.1% to 5.7% in Malaysia and from 6.0% to
3.2% in Japan, which comes in at the very bottom of
the growth league. Developments in the remaining
four countries were more moderate in a year-on-
year comparison: growth in China, which topped the
growth stakes yet again, dipped from 22.7% to 21.4%.
The pace of growth slowed from 7.5% to 7.2% in Tai-
wan and from 7.1% to 6.4% in Singapore.
Annual growth of gross financial assets, in %
Growth slowing down
Sources: National Central Banks and Statistical Offices, Thomson Reuters, Allianz SE.20132014
Chin
a
Indo
nesia
Indi
a
Aver
age
Israe
l
Thai
land
Sout
h Ko
rea
Taiw
an
Sing
apor
e
Mal
aysia
Japa
n
22.7
21.4
13.4
16.0
19.4
13.2
12.6
11.5
7.2
11.5
1.8
9.5
6.5
7.9
7.5
7.2
7.1
6.4
11.1
5.7 6.0
3.2
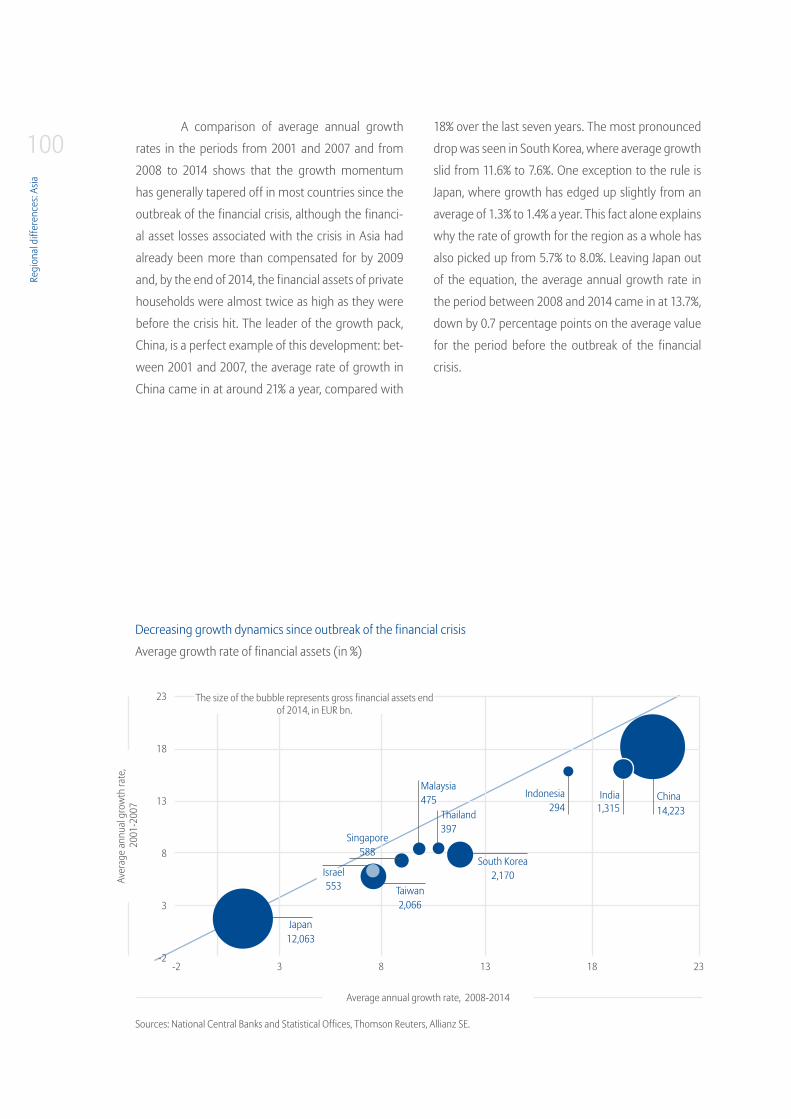
Regi
onal
diff
eren
ces:
Asia
100
Japan12,063
Taiwan2,066
Singapore588
Thailand397
Malaysia475 China
14,223India
1,315Indonesia
294
South Korea2,170
A comparison of average annual growth
rates in the periods from 2001 and 2007 and from
2008 to 2014 shows that the growth momentum
has generally tapered off in most countries since the
outbreak of the financial crisis, although the financi-
al asset losses associated with the crisis in Asia had
already been more than compensated for by 2009
and, by the end of 2014, the financial assets of private
households were almost twice as high as they were
before the crisis hit. The leader of the growth pack,
China, is a perfect example of this development: bet-
ween 2001 and 2007, the average rate of growth in
China came in at around 21% a year, compared with
18% over the last seven years. The most pronounced
drop was seen in South Korea, where average growth
slid from 11.6% to 7.6%. One exception to the rule is
Japan, where growth has edged up slightly from an
average of 1.3% to 1.4% a year. This fact alone explains
why the rate of growth for the region as a whole has
also picked up from 5.7% to 8.0%. Leaving Japan out
of the equation, the average annual growth rate in
the period between 2008 and 2014 came in at 13.7%,
down by 0.7 percentage points on the average value
for the period before the outbreak of the financial
crisis.
Decreasing growth dynamics since outbreak of the financial crisis
Average growth rate of financial assets (in %)
Sources: National Central Banks and Statistical Offices, Thomson Reuters, Allianz SE.
23
18
13
8
3
-2-2 3 8 13 18 23
Aver
age
annu
al g
row
th ra
te,
200
1-20
07
Average annual growth rate, 2008-2014
The size of the bubble represents gross financial assets end of 2014, in EUR bn.
Israel553
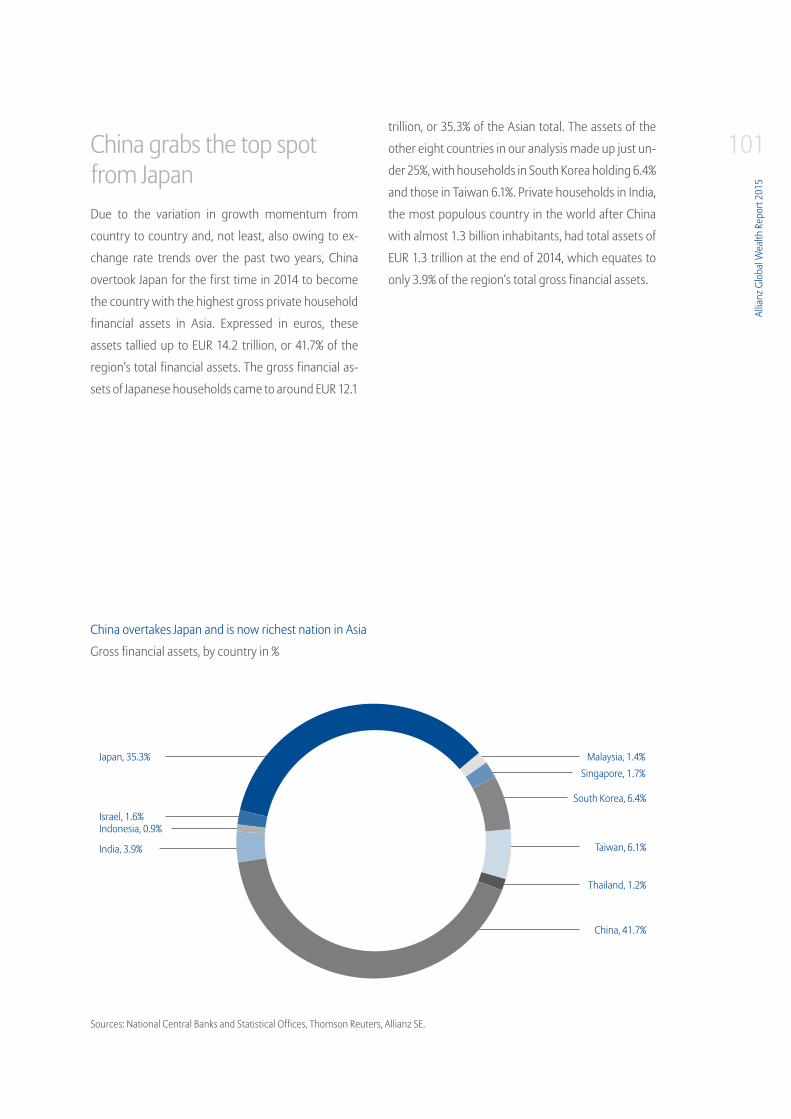
Allia
nz G
loba
l Wea
lth R
epor
t 201
5
101China grabs the top spot from JapanDue to the variation in growth momentum from
country to country and, not least, also owing to ex-
change rate trends over the past two years, China
overtook Japan for the first time in 2014 to become
the country with the highest gross private household
financial assets in Asia. Expressed in euros, these
assets tallied up to EUR 14.2 trillion, or 41.7% of the
region‘s total financial assets. The gross financial as-
sets of Japanese households came to around EUR 12.1
trillion, or 35.3% of the Asian total. The assets of the
other eight countries in our analysis made up just un-
der 25%, with households in South Korea holding 6.4%
and those in Taiwan 6.1%. Private households in India,
the most populous country in the world after China
with almost 1.3 billion inhabitants, had total assets of
EUR 1.3 trillion at the end of 2014, which equates to
only 3.9% of the region‘s total gross financial assets.
Singapore, 1.7%Malaysia, 1.4%Japan, 35.3%
Israel, 1.6%
India, 3.9%
Indonesia, 0.9%
South Korea, 6.4%
Taiwan, 6.1%
Thailand, 1.2%
China, 41.7%
Gross financial assets, by country in %
China overtakes Japan and is now richest nation in Asia
Sources: National Central Banks and Statistical Offices, Thomson Reuters, Allianz SE.

Regi
onal
diff
eren
ces:
Asia
102 Securities assets the most dynamic and, at the same time, the most volatile asset classA comparison of developments in individual asset
classes reflects the trend towards greater portfolio
diversification, developments on the capital markets
and, last but not least, the age structure in the indivi-
dual countries in the region.
Both in the seven years before the financial
crisis and in the seven years after it broke out, secu-
rities assets showed the strongest growth, averaging
11.6% and 11.1% a year in the respective periods. But
the development in bank deposits is clear testimony
to the fact that private households certainly did not
escape the financial crisis unscathed: before the crisis
hit, bank deposits were growing at an average rate of
4.3% a year, compared with 7.8% a year on average
since 2008 - a sign that investors have become a bit
more cautious. There has also been higher demand
for provision products, with receivables from life
insurance companies and pension funds growing
at a rate of 5.7% a year since 2008. The fact that the
growth in securities assets in the region has out-
stripped the growth in receivables from retirement
provision institutions is likely due not only to the ma-
turity of the region‘s insurance markets, but also to
the current age structure of individual societies. With
the exception of Japan, Asia‘s societies remain fairly
young. Looking ahead to the next few years, however,
private pension provision looks set to move higher up
the agenda as in most countries societies start to age
- sometimes rapidly.
Differing growth dynamics in asset classes
Development of asset classes, y/y in %
Sources: National Central Banks and Statistical Offices, Thomson Reuters, Allianz SE.
40
30
20
10
0
-10
-20
-30
-402004 2005 2006 2007 2008 2009 2010 2011 2012 20013 2014
SecuritiesOther
Bank depositsInsurance and pensions
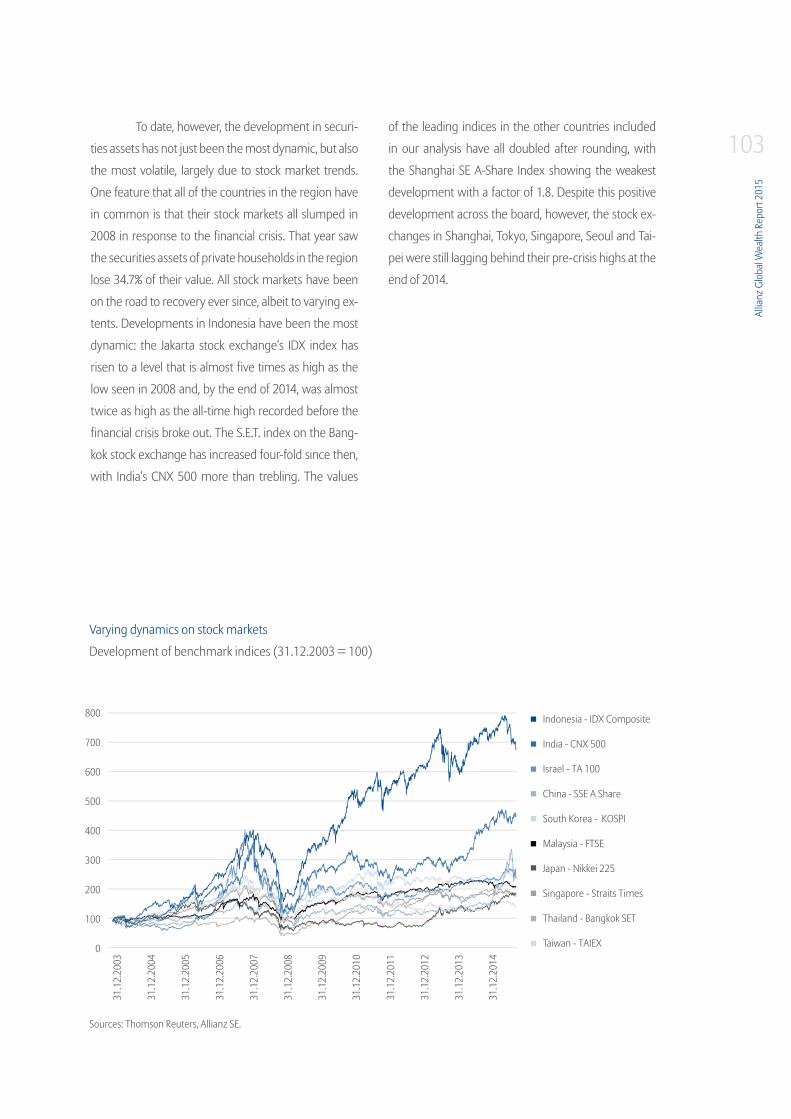
Allia
nz G
loba
l Wea
lth R
epor
t 201
5
103To date, however, the development in securi-
ties assets has not just been the most dynamic, but also
the most volatile, largely due to stock market trends.
One feature that all of the countries in the region have
in common is that their stock markets all slumped in
2008 in response to the financial crisis. That year saw
the securities assets of private households in the region
lose 34.7% of their value. All stock markets have been
on the road to recovery ever since, albeit to varying ex-
tents. Developments in Indonesia have been the most
dynamic: the Jakarta stock exchange‘s IDX index has
risen to a level that is almost five times as high as the
low seen in 2008 and, by the end of 2014, was almost
twice as high as the all-time high recorded before the
financial crisis broke out. The S.E.T. index on the Bang-
kok stock exchange has increased four-fold since then,
with India‘s CNX 500 more than trebling. The values
of the leading indices in the other countries included
in our analysis have all doubled after rounding, with
the Shanghai SE A-Share Index showing the weakest
development with a factor of 1.8. Despite this positive
development across the board, however, the stock ex-
changes in Shanghai, Tokyo, Singapore, Seoul and Tai-
pei were still lagging behind their pre-crisis highs at the
end of 2014.
Varying dynamics on stock markets
Development of benchmark indices (31.12.2003 = 100)
Sources: Thomson Reuters, Allianz SE.
Indonesia - IDX Composite
India - CNX 500
Israel - TA 100
China - SSE A Share
South Korea - KOSPI
Malaysia - FTSE
Japan - Nikkei 225
Singapore - Straits Times
Thailand - Bangkok SET
Taiwan - TAIEX
800
700
600
500
400
300
200
100
0
31.1
2.20
03
31.1
2.20
04
31.1
2.20
05
31.1
2.20
06
31.1
2.20
07
31.1
2.20
08
31.1
2.20
09
31.1
2.20
10
31.1
2.20
11
31.1
2.20
12
31.1
2.20
13
31.1
2.20
14
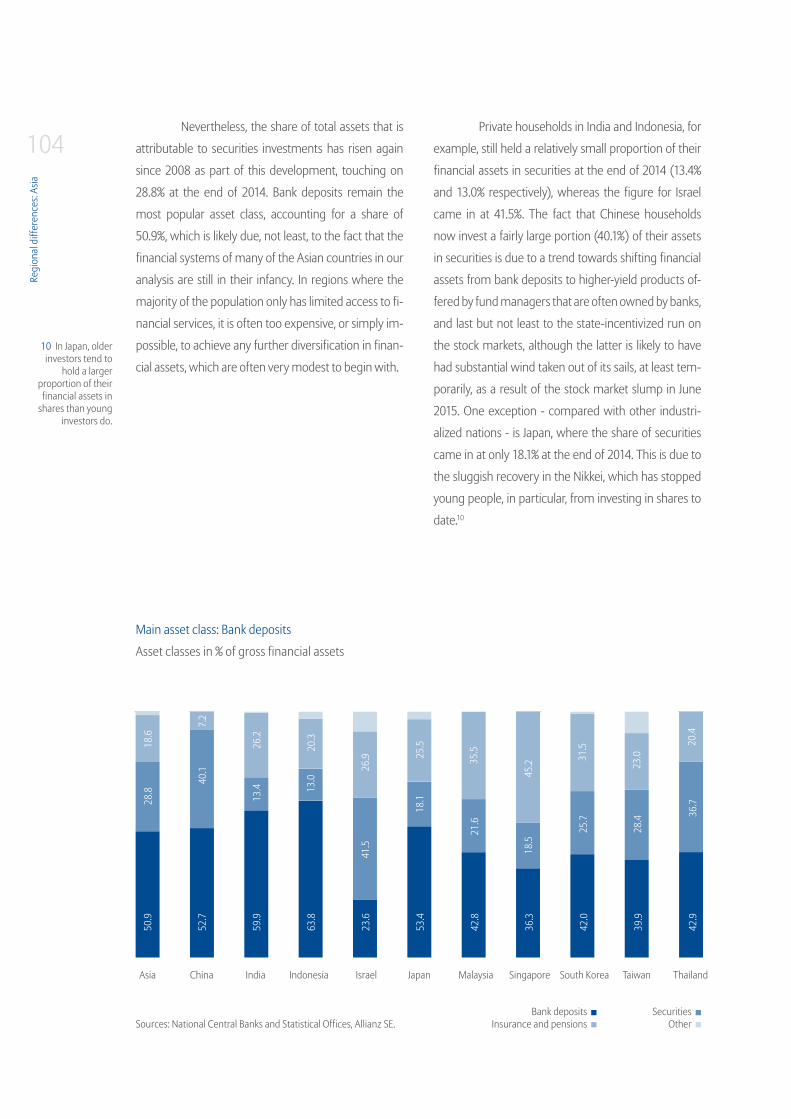
Regi
onal
diff
eren
ces:
Asia
104Nevertheless, the share of total assets that is
attributable to securities investments has risen again
since 2008 as part of this development, touching on
28.8% at the end of 2014. Bank deposits remain the
most popular asset class, accounting for a share of
50.9%, which is likely due, not least, to the fact that the
financial systems of many of the Asian countries in our
analysis are still in their infancy. In regions where the
majority of the population only has limited access to fi-
nancial services, it is often too expensive, or simply im-
possible, to achieve any further diversification in finan-
cial assets, which are often very modest to begin with.
Private households in India and Indonesia, for
example, still held a relatively small proportion of their
financial assets in securities at the end of 2014 (13.4%
and 13.0% respectively), whereas the figure for Israel
came in at 41.5%. The fact that Chinese households
now invest a fairly large portion (40.1%) of their assets
in securities is due to a trend towards shifting financial
assets from bank deposits to higher-yield products of-
fered by fund managers that are often owned by banks,
and last but not least to the state-incentivized run on
the stock markets, although the latter is likely to have
had substantial wind taken out of its sails, at least tem-
porarily, as a result of the stock market slump in June
2015. One exception - compared with other industri-
alized nations - is Japan, where the share of securities
came in at only 18.1% at the end of 2014. This is due to
the sluggish recovery in the Nikkei, which has stopped
young people, in particular, from investing in shares to
date.10
10 In Japan, older investors tend to
hold a larger proportion of their financial assets in
shares than young investors do.
Main asset class: Bank deposits
Asset classes in % of gross financial assets
Sources: National Central Banks and Statistical Offices, Allianz SE.
ChinaAsia Indonesia Malaysia Singapore South Korea Taiwan ThailandJapanIsrael
26.2
20.3
26.9 25
.5
35.5
45.2 31
.5
23.0
20.4
13.4 13
.0
41.5
18.1
21.6
18.5
25.7
28.4 36
.7
India
40.1
28.8
7.2
18.6
50.9
52.7
59.9
63.8
23.6
53.4
42.8
36.3
42.0
39.9
42.9
SecuritiesOther
Bank depositsInsurance and pensions
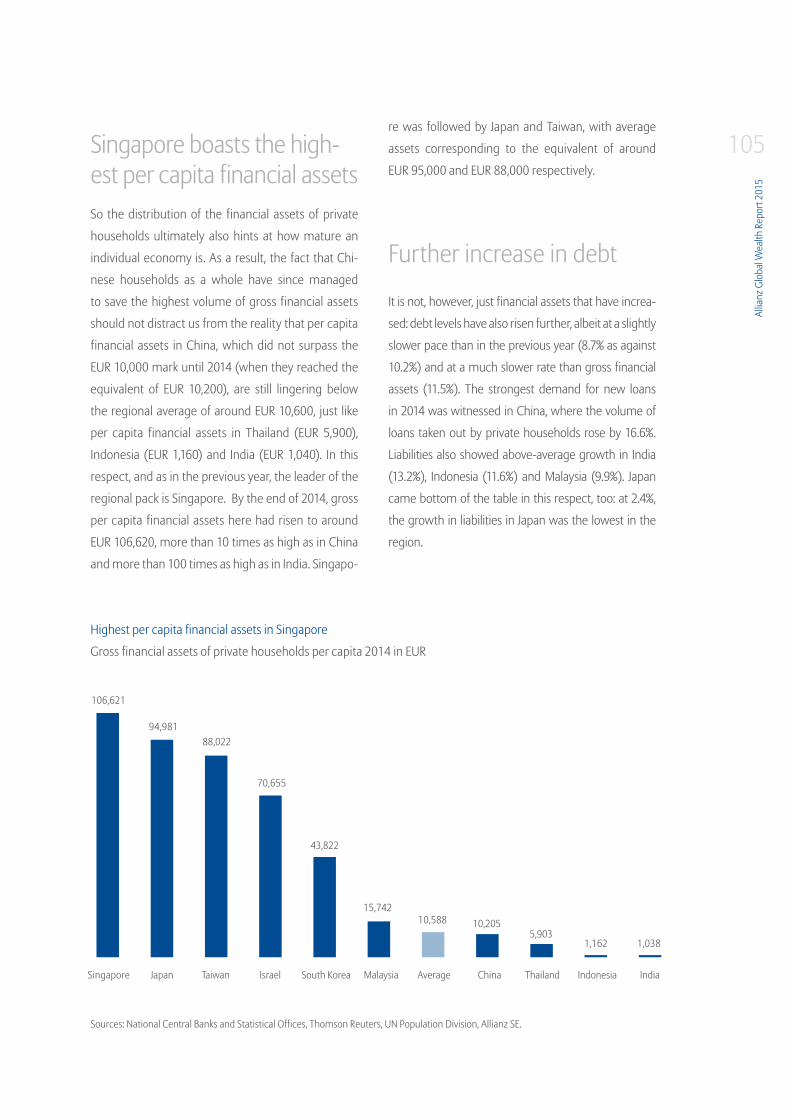
Allia
nz G
loba
l Wea
lth R
epor
t 201
5
105Singapore boasts the high-est per capita financial assets So the distribution of the financial assets of private
households ultimately also hints at how mature an
individual economy is. As a result, the fact that Chi-
nese households as a whole have since managed
to save the highest volume of gross financial assets
should not distract us from the reality that per capita
financial assets in China, which did not surpass the
EUR 10,000 mark until 2014 (when they reached the
equivalent of EUR 10,200), are still lingering below
the regional average of around EUR 10,600, just like
per capita financial assets in Thailand (EUR 5,900),
Indonesia (EUR 1,160) and India (EUR 1,040). In this
respect, and as in the previous year, the leader of the
regional pack is Singapore. By the end of 2014, gross
per capita financial assets here had risen to around
EUR 106,620, more than 10 times as high as in China
and more than 100 times as high as in India. Singapo-
re was followed by Japan and Taiwan, with average
assets corresponding to the equivalent of around
EUR 95,000 and EUR 88,000 respectively.
Further increase in debt
It is not, however, just financial assets that have increa-
sed: debt levels have also risen further, albeit at a slightly
slower pace than in the previous year (8.7% as against
10.2%) and at a much slower rate than gross financial
assets (11.5%). The strongest demand for new loans
in 2014 was witnessed in China, where the volume of
loans taken out by private households rose by 16.6%.
Liabilities also showed above-average growth in India
(13.2%), Indonesia (11.6%) and Malaysia (9.9%). Japan
came bottom of the table in this respect, too: at 2.4%,
the growth in liabilities in Japan was the lowest in the
region.
Highest per capita financial assets in Singapore
Gross financial assets of private households per capita 2014 in EUR
Sources: National Central Banks and Statistical Offices, Thomson Reuters, UN Population Division, Allianz SE.
China IndonesiaAverageMalaysiaSingapore
106,621
94,98188,022
70,655
43,822
15,74210,588 10,205
5,9031,162 1,038
South KoreaTaiwan ThailandJapan Israel India

Regi
onal
diff
eren
ces:
Asia
106The increase in private household debt and
the level of liabilities should, however, be considered
in relation to gross domestic product for the sake of
comparability. Despite the marked increase in 2014,
India still had the lowest private household debt ratio,
at 9.0%. South Korea topped the table here with a rate
of 87.2%, just ahead of Taiwan (86.5%) and Malaysia
(85.0%). Whereas in Taiwan, however, the (gross) asset
ratio of private households, which came in at 491% of
GDP, was more than five times as high as the debt ra-
tio, the asset ratio came in at only 182% in Malaysia and
194% in South Korea, i.e. financial assets in these coun-
tries are only almost twice as high as their liabilities.
The biggest cause for concern at the moment,
however, is the level of debt in Thailand: although credit
growth slowed in the course of last year, the debt ratio
of private households had reached 79.7% by the end
of 2014 - with an asset ratio of only 120%. The central
bank has cited the high demand for loans among the
population to repair the damage caused by flooding,
government stimulus measures to promote car sales in
the form of tax incentives for people buying new vehic-
les, and the low interest rates as the reasons behind the
high debt level. Although the central bank says that it
is mainly households with medium to high income le-
vels that have shown more demand for loans, the high
debt level has already put a damper on demand and, as
a result, on the economic recovery.11 At the same time,
the rate of outstanding bank loans rose from 5.7% at the
end of 2013 to 6.2% by the end of the third quarter of
2014, increasing the risk of financial institutions getting
themselves into difficulty. The situation is exacerbated
by the fact that property loans only make up around
27% of total debt in Thailand, well below the regional
average of 46.3%.
Highest per capita net assets in JapanAfter deductions for liabilities, Japan was the country
with the highest net per capita financial assets in Asia,
with the equivalent of just under EUR 73,550 attribu-
table to each inhabitant in 2014. Japan‘s lead over its
Liabilities of Thailand’s households almost as high as financial assets
Financial assets and liabilities of private households, 2014, as % of GDP
Sources: National Central Banks and Statistical Offices, Thomson Reuters, Allianz SE.
491.2
358.9
241.8
239.1
194.3
181.7
166.6
120.2
79.6
41.8
86.5
81.0
75.5
39.7
87.2
85.0
36.1
79.7
9.0
16.4
China
Indonesia
Malaysia
Singapore
South Korea
Taiwan
Thailand
Japan
Israel
India
Asset ratioDebt ratio
11 Cf. Bank of Thailand: Financial
Stability Report 2014, p. 7.

Allia
nz G
loba
l Wea
lth R
epor
t 201
5
107fellow Asian countries, however, continued to narrow:
net per capita financial assets in Singapore and Taiwan
were only slightly lower at EUR 73,330 and EUR 72,520
respectively. In Israel, the figure came in at EUR 58,910,
while in South Korea, net per capita financial assets
came in at only EUR 24,160 due to the high level of pri-
vate household debt. In the other countries included in
our analysis, net per capita financial assets were much
lower. In Malaysia, the figure was around EUR 8,380
and the high private household debt level also meant
that, in net terms, the gap separating the country from
China was much smaller, at just under EUR 400, than
in gross terms, where the difference amounted to EUR
5,500. At around EUR 7,990 per capita, average net fi-
nancial assets in China surpassed the regional average
for the very first time in 2014. The figures for Thailand,
India and Indonesia fell well short of the average: fol-
lowing deductions for liabilities, net per capita finan-
cial assets in Thailand amounted to around EUR 1,990,
with the figures for both India and Indonesia still stuck
below the EUR 1,000 mark, despite the significant
growth witnessed in recent years.
The per capita figures hide what are often
considerable differences in wealth distribution in the-
se countries. But even taking these inequalities into
account, the strong increase in gross financial assets
on the one hand, coupled with weaker credit growth
on the other, has increased the proportion of people
who were considered members of the wealth middle
class in 2014, i.e. the group of people with net finan-
cial assets of between EUR 6,100 and EUR 36,700: at
the end of 2014, one in five people, or 20.4%, fell into
this category. The net financial assets of 2.4 billion
people in the region, however, came in at less than
EUR 6,100, i.e. the proportion of the population with
low assets amounted to 76.7%, while 94 million or
only 2.9% of the population had net financial assets in
excess of EUR 36,700.
Japanese (still) have the highest financial assets per capita (minus debt)
Net financial assets of private households, per capita 2014 in EUR
Sources: National Central Banks and Statistical Offices, Thomson Reuters, UN Population Division, Allianz SE.
China IndonesiaAverageMalaysiaSingapore
73,547 73,328 72,524
58,910
24,157
8,379 7,992 7,687
1,986 921 707
South KoreaTaiwan ThailandJapan Israel India

108
Vorwort . Zusammenfassung . Entwicklung des globalen Geldvermögens . Verteilung des globalen Geldvermögens . Regionale Unterschiede . Literatur . Appendix
108
Australia and New Zealand
PopulationTotal· · · · · · · · · · · · · · · · · · · · · · · · · · · · · · · · · · · · · · · · · · · · · · · · · · · · · · · · · · · · · · · · · · · · · · · · · · · · 28.2 mShare of the global population · · · · · · · · · · · · · · · · · · · · · · · · · · · · · · · · · · · · · · · · · · · · · · · · · · · · · ·0.4%
GDPTotal· · · · · · · · · · · · · · · · · · · · · · · · · · · · · · · · · · · · · · · · · · · · · · · · · · · · · · · · · · · · · · · · · · · · · · ·EUR 1,235bnShare of global GDP · · · · · · · · · · · · · · · · · · · · · · · · · · · · · · · · · · · · · · · · · · · · · · · · · · · · · · · · · · · · · · · ·2.3%
Gross financial assets of private householdsTotal· · · · · · · · · · · · · · · · · · · · · · · · · · · · · · · · · · · · · · · · · · · · · · · · · · · · · · · · · · · · · · · · · · · · · · ·EUR 3,083bnAverage · · · · · · · · · · · · · · · · · · · · · · · · · · · · · · · · · · · · · · · · · · · · · · · · · · · · · · · · · EUR 109,400 per capitaShare of global financial assets · · · · · · · · · · · · · · · · · · · · · · · · · · · · · · · · · · · · · · · · · · · · · · · · · · · · · ·2.2%
Debt of private householdsTotal· · · · · · · · · · · · · · · · · · · · · · · · · · · · · · · · · · · · · · · · · · · · · · · · · · · · · · · · · · · · · · · · · · · · · · ·EUR 1,513bnAverage · · · · · · · · · · · · · · · · · · · · · · · · · · · · · · · · · · · · · · · · · · · · · · · · · · · · · · · · · · EUR 53,690 per capitaAs % of GDP· · · · · · · · · · · · · · · · · · · · · · · · · · · · · · · · · · · · · · · · · · · · · · · · · · · · · · · · · · · · · · · · · · · · · 122.5%

Regi
onal
diff
eren
ces:
Aust
ralia
and
New
Zea
land
110At the end of last year, nearly EUR 3.1 tril-
lion, or 2.3% of the world‘s financial assets, were in
the hands of private households in Australia and New
Zealand. Driven by the commodities boom, the as-
set base has more than trebled since the turn of the
millennium. During the same period, average per ca-
pita assets in the region, before deductions to reflect
liabilities, climbed from EUR 43,550 to EUR 109,400
(EUR 113,660 in Australia and EUR 87,320 in New
Zealand). Although Australians were hit hard by the
slump in commodities prices in 2008 and the losses
on the stock markets, the country was not plunged
into a recession and made a rapid recovery in the af-
termath of the crisis. Only one year later, Australia had
made up for the asset losses again.
In 2014, financial assets held in bank depo-
sits, securities, insurance policies and pensions grew
by 7.7% in total. At 8.2%, the rate of asset growth in
Australia was not only well ahead of that witnessed in
New Zealand (+4.7%), but also outstripped the ave-
rage for the industrialized nations (+5.4%). Insurance
policies and pensions are by far the most popular
form of investment among Australian households:
around 58% of the asset portfolio fell into this cate-
gory at the end of 2014, with superannuations pro-
ving to be particularly sought-after. Superannuations
are a combination of state and private, voluntary and
tax-incentivized pension provision. Two thirds of total
savings last year were destined for this form of invest-
ment, the volume of which grew by 8.8% year-on-
year as a result. Cash, demand and savings deposits
swelled by 8.7% in a continuation of the strong de-
velopment seen in recent years. Australians invested
only around 16% in securities, with the amount held
in this form of investment up by 7.9% in 2014.
Australia New Zealand
Net financial assets and liabilities, in EUR tn
Oceania: Gross financial assets now above 3-trillion-euro-mark
*CAGR = Compound Annual Growth Rate.Sources: Australian Bureau of Statistics, Reserve Bank of New Zealand, Allianz SE.
3.5
3.0
2.5
2.0
1.5
1.0
0.5
0.0
2000
2007
2008
2009
2010
2011
2012
2013
2014
CAGR* 2001 - 2014 Net financial assets: +7.4% p.a.Liabilities: +9.4% p.a.
Gross financial assets: +8.3% p.a.
Net financial assetsLiabilities
5816
23
1166
23
0.981.15 1.05
0.48
1.131.02
1.201.07
1.271.04
1.331.29
1.421.45
1.511.57
0.430.58
Asset classes as % of gross financial assets
Converse asset portfolio

Allia
nz G
loba
l Wea
lth R
epor
t 201
5
111The composition of the asset portfolio of
households in New Zealand is the other way round
entirely: whereas insurance policies and pensions
play only a minor role, accounting for a share of 11%,
assets held in securities made up two-thirds of the
portfolio12. The latter showed somewhat subdued
growth to the tune of 2.3% last year, whereas bank
deposits increased by 8.6% and insurance policies
and pensions by 12.3%.
Throwing debt discipline to the windThe outbreak of the financial crisis signaled a tur-
naround in the savings habits of Australian private
households. The average savings rate leapt up to
10.1% in 2009 after coming in at 6.7% the year before,
and remained relatively stable at this level, which had
not been seen since the mid-1980s, until 2013. The
background to this is that the savings rate started to
drop steadily in the mid-1970s before actually plun-
ging into the red in the early 2000s. This downward
trend was fueled by several factors, including easier
access to loans, stable economic development, rising
incomes and income expectations and a high pro-
pensity to consume.
As they started to set more money aside,
Australians also adopted a more restrained approach
to further borrowing. Whereas households were still
upping their debt burden by an average of 12.5% a
year in the period between 2001 and 2007, the cri-
sis put a halt to the borrowing process and this rate
of growth was slashed to an average of 6.7% p.a. in
the years between 2008 and 2014. This develop-
ment was helped along, not least, by the low interest
rate environment, which allowed many households
to pay their loans off earlier than agreed. After the
debt ratio, i.e. the ratio of debt to economic output,
reached an all-time high of just under 118% in 2007,
it slipped back by two percentage points in 2008; in
recent years, however, the ratio has been edging its
way up again. In 2014, debt growth started to accele-
rate again, coming in at 7.0% (compared with +5.2%
in 2012 und +6.2% in 2013) and, by the end of last
year, the ratio of liabilities to gross domestic product
had soared to almost 131%. At the same time, the
savings ratio has gradually dropped to an average of
9.3% for 2014. Per capita debt came in at the equiva-
lent of around EUR 59,860 – a record high and around
twice the average figure for the world‘s industrialized
nations. Australians seem to be turning their backs
on debt discipline again. Low interest rates and rising
asset prices, however, are still keeping any risk of the
household sector getting itself into financial difficulty
at bay. The proportion of non-performing loans ac-
tually dropped in the last six months of last year. Ne-
vertheless, macroeconomic shocks like rising interest
rates, a labor market slump or falling house prices
could soon pose a threat to the solvency of highly-
indebted households. As a result, this high debt level
is the Achilles‘ heel of the Australian economy and
there is no reason to throw debt discipline to the wind
prematurely.
12 In March 2015, New Zealand‘s cen-tral bank published revised statistics on the assets held by private households. Two of the major changes resulting from the revision include, first, a broader definition of the term ”assets” and, second, a narrower definition of the household sector. These adju-stments bring the country‘s household asset statistics into line with the inter-national national accounts system and result in much higher net financial assets than the sta-tistics for previous years. For further information, please refer to http://rbnz.govt.nz/statistics/household-balance-sheet-paper.pdf.
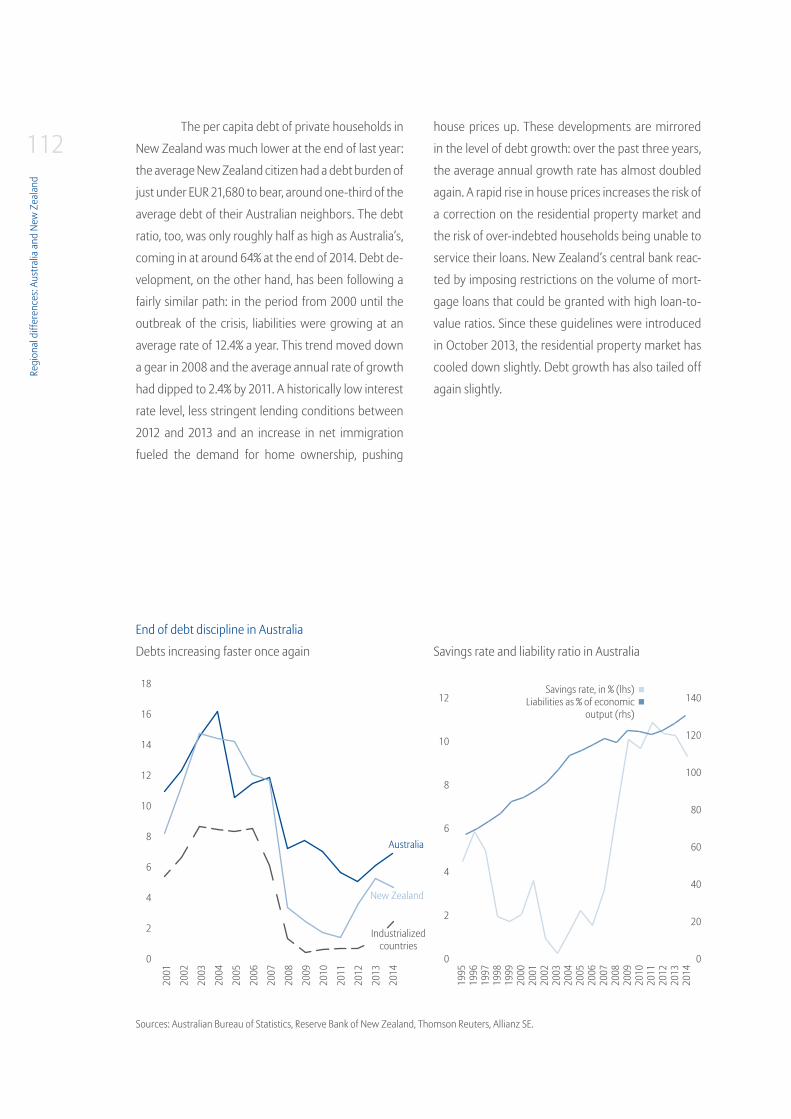
Regi
onal
diff
eren
ces:
Aust
ralia
and
New
Zea
land
112The per capita debt of private households in
New Zealand was much lower at the end of last year:
the average New Zealand citizen had a debt burden of
just under EUR 21,680 to bear, around one-third of the
average debt of their Australian neighbors. The debt
ratio, too, was only roughly half as high as Australia‘s,
coming in at around 64% at the end of 2014. Debt de-
velopment, on the other hand, has been following a
fairly similar path: in the period from 2000 until the
outbreak of the crisis, liabilities were growing at an
average rate of 12.4% a year. This trend moved down
a gear in 2008 and the average annual rate of growth
had dipped to 2.4% by 2011. A historically low interest
rate level, less stringent lending conditions between
2012 and 2013 and an increase in net immigration
fueled the demand for home ownership, pushing
house prices up. These developments are mirrored
in the level of debt growth: over the past three years,
the average annual growth rate has almost doubled
again. A rapid rise in house prices increases the risk of
a correction on the residential property market and
the risk of over-indebted households being unable to
service their loans. New Zealand‘s central bank reac-
ted by imposing restrictions on the volume of mort-
gage loans that could be granted with high loan-to-
value ratios. Since these guidelines were introduced
in October 2013, the residential property market has
cooled down slightly. Debt growth has also tailed off
again slightly.
End of debt discipline in Australia
Debts increasing faster once again Savings rate and liability ratio in Australia
Sources: Australian Bureau of Statistics, Reserve Bank of New Zealand, Thomson Reuters, Allianz SE.
12
10
8
6
4
2
0
140
120
100
80
60
40
20
0
18
16
14
12
10
8
6
4
2
0
1995
1996
1997
1998
1999
2000
2001
2002
2003
2004
2005
2006
2007
2008
2009
2010
2011
2012
2013
2014
2001
2002
2003
2004
2005
2006
2007
2008
2009
2010
2011
2012
2013
2014
Australia
New Zealand
Savings rate, in % (lhs)Liabilities as % of economic
output (rhs)
Industrialized countries

Allia
nz G
loba
l Wea
lth R
epor
t 201
5
113Differences in the ratio of assets to liabilitiesLooking at the region as a whole, almost 42% of the
population had high net financial assets in a global
comparison, i.e. an average of more than EUR 36,700
per capita, at the end of 2014. In North America, this
proportion came in at 41%, whereas ”only” just un-
der 36% of the population of western Europe falls
into this category. If we look only at the assets side
of the wealth balance sheet, then at the end of last
year, Australians had average per capita financial as-
sets of EUR 113,660, putting them a good 30% ahead
of their neighbors in New Zealand (EUR 87,320 per
capita). Following deductions for liabilities, however,
the latter are in a much better position: due to the
relatively high debt burden, Australian financial as-
sets fell to only EUR 53,800 per capita in net terms,
whereas in New Zealand, average per capita assets
came in at EUR 65,650 in net terms. This means that
Australian households are more indebted than their
counterparts in New Zealand in both absolute and
relative terms. For each euro borrowed in Australia,
there were assets worth EUR 1.90, while households
in New Zealand had as much as around EUR 4.00 in
assets for each liability of one euro.
In the global league of the highest net per
capita financial assets, New Zealand is in twelfth
place, after Denmark, and two places ahead of Aust-
ralia. Compared with 2000, however, the country has
slipped two places down the table, whereas Australia
has climbed from 19th to 14th place.
Different assets to debt ratio
Net financial assets and liabilities per capita, in EUR
Australia New Zealand
Sources: Australian Bureau of Statistics, Reserve Bank of New Zealand, UN Population Division, Allianz SE.
120,000
100,000
80,000
60,000
40,000
20,000
0
120,000
100,000
80,000
60,000
40,000
20,000
0
2000
2007
2008
2009
2010
2011
2012
2013
2014
2000
2007
2008
2009
2010
2011
2012
2013
2014
Net financial assets per capitaLiabilities per capita
53,7
99
32,4
45
51,9
79
49,5
47
52,0
15
54,0
01
58,2
87
60,4
96
63,3
59
65,6
46
49,7
14
44,3
37
34,3
36
37,2
27
36,0
69
29,0
94
43,7
19
23,4
91
59,8
57
8,97
9
18,5
13
18,9
49
19,2
33
19,3
92
19,4
88
20,0
28
20,8
99
21,6
78
56,6
23
53,9
79
52,0
05
49,8
67
47,3
25
44,6
75
42,4
14
20,4
80

Allia
nz G
loba
l Wea
lth R
epor
t 201
5
115
LiteratureAriyapruchaya, Kiatipong: ”Thailand’s Household Sector Balance Sheet Dynamics: Evidence from Microeco-nomic and Macroeconomic Data”, IFC Bulletin, No. 25, pp. 91-100, 2007.
Aron, Janine; Muellbauer, John and Prinsloo, Johan: ”Estimating the Balance Sheet of the Personal Sector in an Emerging Market Country. South Africa 1975 – 2003”, United Nations University, UN-Wider, Research Paper No. 2006/99, 2006.
Attanasio, Orazio and Székely, Miguel: ”Household Saving in Developing Countries – Inequality, Demographics and All That: How Different are Latin America and South East Asia?”, Inter-American Development Bank, Work-ing Paper No. 427, 2000.
Board of Governors of the Federal Reserve System: ”Changes in U.S. Family Finances from 2010 to 2013: Evi-dence from the Survey of Consumer Finances”, September 2014.
Board of Governors of the Federal Reserve System: ”Report on the Economic Well-Being of U.S. Households in 2014”, May 2015.
Bonnet, Odran et al: ”Does housing capital contribute to inequality? A comment on Thomas Piketty’s Capital in the 21st Century”, Sciences Po Economics Discussion Papers, Discussion paper 2014-07.
Davies, James B.; Sandstrom, Susanna; Shorrocks, Anthony and Wolff, Edward N.: ”The Level and Distribution of Global Household Wealth”, November 2009.
European Central Bank: ”Annual Report 2014”, 2015.
European Central Bank: ”Eurosystem Household Finance and Consumption Survey”, 2014.
Piketty, Thomas: ”Capital in the Twenty-First Century”, Harvard University Press, 2014.
Schmitt-Hebbel, Klaus; Webb, Steven B. and Corsetti, Giancarlo: ”Household Saving in Developing Countries: First Class-Cross Country Evidence”, The World Bank Economic Review, Vol. 6, No. 3, 1992.
Tiongson, Erwin R.; Sugawara, Naotaka; Sulla, Victor; Taylor, Ashley; Gueorguieva, Anna I.; Levin, Victoria and Subbarao, Kalanidhi: ”The Crisis hits Home: Stress-Testing Households in Europe and Central Asia”, The Inter-national Bank for Reconstruction and Development / The World Bank, 2010.
Torche, Florencia and Spilerman, Seymour: ”Household Wealth in Latin America”, United Nations University, UN-Wider, Research Paper No. 2006/114, October 2006.
United Nations, ECLAC: ”Social Panorama of Latin America 2014 • Briefing Paper”, 2014.

Appe
ndix
116
APPENDIX A: METHODOLOGICAL COMMENTS
General assumptions
The Allianz Global Wealth Report is based on data from 53 countries. This group of countries covers almost 91%
of global GDP and 69% of the global population. In 38 countries, we had access to statistics from national wealth
balance sheets. In the other countries, we were able to estimate the volume of total financial assets based on
information from household surveys, bank statistics, statistics on assets held in equities and bonds, and technical
reserves.
In many countries, it is still extremely difficult to find data on the financial assets of private households. Let‘s take
the Latin American countries as an example. For many countries, the only information that can be found relates
to the entire private sector or the economy as a whole, which is often of only limited use as far as the situation of
private households is concerned. In addition to Chile, Columbia has fairly good data that can be used to analyze
the financial structure of private household assets. In Argentina, for example, we were able to estimate financial
assets with the help of data on bank deposits and insurance reserves.
In order to rule out exchange rate distortions over time, the financial assets were converted into the national
currency based on the fixed exchange rate at the end of 2014.
Determination of wealth bands for global wealth classes
Lower wealth threshold: there is a close link between financial assets and the incomes of private households.
According to Davies et al. (2009), private individuals with below-average income tend to have no assets at all, or
only very few. It is only when individuals move into middle and higher income groups that they start to accumu-
late any assets to speak of.
We have applied this link to our analysis. Countries in the upper-middle income bracket (based on the World
Bank‘s country classification system) therefore form the group in which the average assets of private households
has reached a relevant volume for the first time. This value marks the lower threshold for the global wealth midd-
le class. How high should this value be?
In terms of income, households with incomes that correspond to between 75% and 150% of average net income
are generally considered to constitute the middle class. According to Davies et al., households with income cor-
responding to 75% of the average income have assets that correspond to 30% of the average assets. As far as the
upper threshold is concerned, 150% of average income corresponds to 180% of average assets. Consequently, we
have set the threshold values for the wealth middle class at 30% and 180% of average per capital assets. If we use
net financial assets to calculate the two thresholds, we arrive at an asset range of between EUR 6,100 and EUR
36,700 for the global wealth middle class in 2014 The gross thresholds lie at EUR 8,200 and EUR 49,500.
Individuals with higher per capita financial assets then belong to the global high wealth group, whereas those
with lower per capita financial assets belong to the ”low wealth” class.

Allia
nz G
loba
l Wea
lth R
epor
t 201
5
117
*2014 asset balance sheet **Extrapolation based on 2013 asset balance sheet***Approximated based on other statistics
These asset bands can, of course, also be used for the purposes of country classification. Countries in which
the average net per capita financial assets are less than EUR 6,100 can be referred to as ”low wealth countries”
(LWCs). ”Middle wealth countries” (MWCs) are all countries with average net per capita financial assets of bet-
ween EUR 6,100 and EUR 36,700; finally, all countries with even higher average net per capita financial assets are
described as ”high wealth countries” (HWCs).
Country classification based on net per capita financial assets:
HWC
Australia*
Austria*
Belgium*
Canada*
Denmark*
France*
Germany*
Ireland*
Israel**
Italy*
Japan*
Netherlands*
New Zealand*
Singapore*
Sweden*
Switzerland**
Taiwan**
United Kingdom*
USA*
MWC
Bulgaria**
Chile*
China***
Croatia**
Czech Republic*
Estonia*
Finland*
Greece*
Hungary*
Latvia*
Lithuania*
Malaysia**
Mexico***
Norway*
Poland*
Portugal*
Slovenia*
South Africa*
South Korea*
Spain*
LWC
Argentina***
Brazil***
Colombia**
Peru***
India***
Indonesia***
Thailand***
Romania**
Slovakia*
Kazakhstan***
Russia***
Serbia***
Turkey***
Ukraine***

Appe
ndix
118
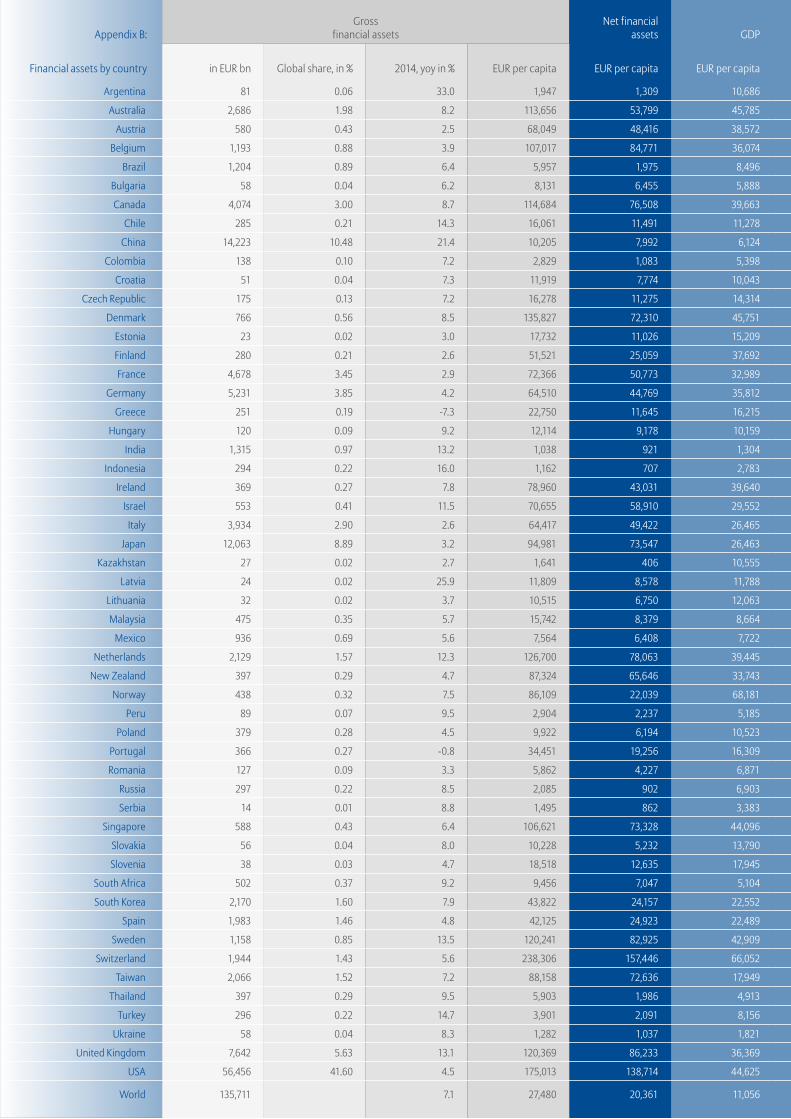
119
Allianz Global Wealth Report 2015
119
Appendix B:Gross
financial assetsNet financial
assets GDP
Financial assets by country in EUR bn Global share, in % 2014, yoy in % EUR per capita EUR per capita EUR per capita
Argentina 81 0.06 33.0 1,947 1,309 10,686
Australia 2,686 1.98 8.2 113,656 53,799 45,785
Austria 580 0.43 2.5 68,049 48,416 38,572
Belgium 1,193 0.88 3.9 107,017 84,771 36,074
Brazil 1,204 0.89 6.4 5,957 1,975 8,496
Bulgaria 58 0.04 6.2 8,131 6,455 5,888
Canada 4,074 3.00 8.7 114,684 76,508 39,663
Chile 285 0.21 14.3 16,061 11,491 11,278
China 14,223 10.48 21.4 10,205 7,992 6,124
Colombia 138 0.10 7.2 2,829 1,083 5,398
Croatia 51 0.04 7.3 11,919 7,774 10,043
Czech Republic 175 0.13 7.2 16,278 11,275 14,314
Denmark 766 0.56 8.5 135,827 72,310 45,751
Estonia 23 0.02 3.0 17,732 11,026 15,209
Finland 280 0.21 2.6 51,521 25,059 37,692
France 4,678 3.45 2.9 72,366 50,773 32,989
Germany 5,231 3.85 4.2 64,510 44,769 35,812
Greece 251 0.19 -7.3 22,750 11,645 16,215
Hungary 120 0.09 9.2 12,114 9,178 10,159
India 1,315 0.97 13.2 1,038 921 1,304
Indonesia 294 0.22 16.0 1,162 707 2,783
Ireland 369 0.27 7.8 78,960 43,031 39,640
Israel 553 0.41 11.5 70,655 58,910 29,552
Italy 3,934 2.90 2.6 64,417 49,422 26,465
Japan 12,063 8.89 3.2 94,981 73,547 26,463
Kazakhstan 27 0.02 2.7 1,641 406 10,555
Latvia 24 0.02 25.9 11,809 8,578 11,788
Lithuania 32 0.02 3.7 10,515 6,750 12,063
Malaysia 475 0.35 5.7 15,742 8,379 8,664
Mexico 936 0.69 5.6 7,564 6,408 7,722
Netherlands 2,129 1.57 12.3 126,700 78,063 39,445
New Zealand 397 0.29 4.7 87,324 65,646 33,743
Norway 438 0.32 7.5 86,109 22,039 68,181
Peru 89 0.07 9.5 2,904 2,237 5,185
Poland 379 0.28 4.5 9,922 6,194 10,523
Portugal 366 0.27 -0.8 34,451 19,256 16,309
Romania 127 0.09 3.3 5,862 4,227 6,871
Russia 297 0.22 8.5 2,085 902 6,903
Serbia 14 0.01 8.8 1,495 862 3,383
Singapore 588 0.43 6.4 106,621 73,328 44,096
Slovakia 56 0.04 8.0 10,228 5,232 13,790
Slovenia 38 0.03 4.7 18,518 12,635 17,945
South Africa 502 0.37 9.2 9,456 7,047 5,104
South Korea 2,170 1.60 7.9 43,822 24,157 22,552
Spain 1,983 1.46 4.8 42,125 24,923 22,489
Sweden 1,158 0.85 13.5 120,241 82,925 42,909
Switzerland 1,944 1.43 5.6 238,306 157,446 66,052
Taiwan 2,066 1.52 7.2 88,158 72,636 17,949
Thailand 397 0.29 9.5 5,903 1,986 4,913
Turkey 296 0.22 14.7 3,901 2,091 8,156
Ukraine 58 0.04 8.3 1,282 1,037 1,821
United Kingdom 7,642 5.63 13.1 120,369 86,233 36,369
USA 56,456 41.60 4.5 175,013 138,714 44,625
World 135,711 7.1 27,480 20,361 11,056

Appe
ndix
120

121
Allianz Global Wealth Report 2015
121
1 Switzerland 157,446 1 Switzerland 238,306
2 USA 138,714 2 USA 175,013
3 United Kingdom 86,233 3 Denmark 135,827
4 Belgium 84,771 4 Netherlands 126,700
5 Sweden 82,925 5 United Kingdom 120,369
6 Netherlands 78,063 6 Sweden 120,241
7 Canada 76,508 7 Canada 114,684
8 Japan 73,547 8 Australia 113,656
9 Singapore 73,328 9 Belgium 107,017
10 Taiwan 72,636 10 Singapore 106,621
11 Denmark 72,310 11 Japan 94,981
12 New Zealand 65,646 12 Taiwan 88,158
13 Israel 58,910 13 New Zealand 87,324
14 Australia 53,799 14 Norway 86,109
15 France 50,773 15 Ireland 78,960
16 Italy 49,422 16 France 72,366
17 Austria 48,416 17 Israel 70,655
18 Germany 44,769 18 Austria 68,049
19 Ireland 43,031 19 Germany 64,510
20 Finland 25,059 20 Italy 64,417
21 Spain 24,923 21 Finland 51,521
22 South Korea 24,157 22 South Korea 43,822
23 Norway 22,039 23 Spain 42,125
24 Portugal 19,256 24 Portugal 34,451
25 Slovenia 12,635 25 Greece 22,750
26 Greece 11,645 26 Slovenia 18,518
27 Chile 11,491 27 Estonia 17,732
28 Czech Republic 11,275 28 Czech Republic 16,278
29 Estonia 11,026 29 Chile 16,061
30 Hungary 9,178 30 Malaysia 15,742
31 Latvia 8,578 31 Hungary 12,114
32 Malaysia 8,379 32 Croatia 11,919
33 China 7,992 33 Latvia 11,809
34 Croatia 7,774 34 Lithuania 10,515
35 South Africa 7,047 35 Slovakia 10,228
36 Lithuania 6,750 36 China 10,205
37 Bulgaria 6,455 37 Poland 9,922
38 Mexico 6,408 38 South Africa 9,456
39 Poland 6,194 39 Bulgaria 8,131
40 Slovakia 5,232 40 Mexico 7,564
41 Romania 4,227 41 Brazil 5,957
42 Peru 2,237 42 Thailand 5,903
43 Turkey 2,091 43 Romania 5,862
44 Thailand 1,986 44 Turkey 3,901
45 Brazil 1,975 45 Peru 2,904
46 Argentina 1,309 46 Colombia 2,829
47 Colombia 1,083 47 Russia 2,085
48 Ukraine 1,037 48 Argentina 1,947
49 India 921 49 Kazakhstan 1,641
50 Russia 902 50 Serbia 1,495
51 Serbia 862 51 Ukraine 1,282
52 Indonesia 707 52 Indonesia 1,162
53 Kazakhstan 406 53 India 1,038
World 20,361 World 27,480
Appendix C: Global ranking
..by net per capita financial assets (in EUR) ...by gross per capita financial assets (in EUR)

Imprint
PublisherAllianz SEEconomic ResearchKöniginstraße 2880802 Münchenwww.allianz.com
Chief EconomistDr. Michael Heise
AuthorsKathrin BrandmeirDr. Michaela GrimmDr. Arne Holzhausen
EditorsHeike BährAlexander MaisnerDr. Lorenz Weimann
PhotosGetty Images
DesignSchmitt. GmbH, Hamburg
Closing date01. August 2015
Legal disclaimerThe information contained in this publication has
been carefully researched and checked by Allianz
SE or reliable third parties. However, Allianz Group
and any third party do not assume liability for the
accuracy, completeness and up-to-dateness of the
contents. The authors’ opinions are not necessarily
those of Allianz SE. Statements do not constitute any
offer or recommendation of certain investments, even
if individual issuers and securities are mentioned.
Information given in this issue is no substitute for
specific investment advice based on the situation of
the individual investor. For personalized investment
advice please contact Allianz SE.

Sum
mar
y
124