All research has now been summarized and made into a ...
33
1 Predicting the Future of the Dow Jones Industrial Average Using Solar Activity Revised and updated with new data July 10 th , 2014 Related Articles: Most Recent Dow Jones Cross Point Data published for Mid July 2014 Related Articles published by the Solar Institute Rough Data Research into a more accurate method using small caps to forecast market movements. View Data U.S. Markets and Solar Activity The Types of Energies Coming From the Sun and How To Interpret Them Solar and Lunar Influences that Increase ESP and Intuition Confirmed Relationship Between the Dow Jones Industrial Average and our Sun’s Solar Wind Speed U.S. Markets and Solar Influences The Dow Jones Industrial Average and Solar Activity All research has now been summarized and made into a book: Wormhole Theories, Sunspot Activity and Remote Viewing Stocks View Book Chapters Read the first 3 Chapters Free
Transcript of All research has now been summarized and made into a ...

1
Predicting the Future of the Dow Jones Industrial Average Using Solar Activity
Revised and updated with new data July 10th, 2014 Related Articles: Most Recent Dow Jones Cross Point Data published for Mid July 2014 Related Articles published by the Solar Institute Rough Data Research into a more accurate method using small caps to forecast market movements. View Data U.S. Markets and Solar Activity The Types of Energies Coming From the Sun and How To Interpret Them Solar and Lunar Influences that Increase ESP and Intuition Confirmed Relationship Between the Dow Jones Industrial Average and our Sun’s Solar Wind Speed U.S. Markets and Solar Influences
The Dow Jones Industrial Average and Solar Activity
All research has now been summarized and made into a book: Wormhole Theories, Sunspot Activity and Remote
Viewing Stocks View Book Chapters
Read the first 3 Chapters Free
2
It is a well known fact that the cycles of highs and lows of sunspots correspond with the highs and lows of the Dow Jones Industrial Average (view image) , however, did you know that there are also weekly solar activity cycles that have highs and
lows and that these highs are named "cross points" of which we will discuss in this article. Like being able to forecast the Dow Jones, based on the 11 year sunspot solar cycle, we can use these weekly and monthly cross points to get weekly or
fortnightly forecasting of when the Dow Jones will close higher or lower the following trading day. EZ3DBIZ has assigned condition green and blue periods as good periods when the Dow Jones Industrial Average will close higher on the following trading day. And condition Red and Orange periods as negative periods when the Dow Jones Will usually close lower the following day. Whenever these are forecast 24 to 48 hours in advance, if a cross point is about to occur, the information will “leap forward” a few hours in advance giving the position of the Dow Jones. The Dow Jones operates on a collective level and uses this collective information to forecast the future position. Because our research has shown that during condition red periods, the immune system is weakest, it proves that the possibility of the existence of a collective immune system. Could a virus have wiped out the dinosaurs? We can see this trend throughout history. If millions of people can get wiped out in influenza pandemics, which has happened in earth's previous past, which lasts for a great many months, than the opposite is also true. The condition green period, which is opposite a condition red period, are periods where the collective immune system is stronger or more in balance and less susceptible to influenza and similar pandemics, leading to years of better harmony and health. This means condition green periods could also be periods of collective intuition, where we are able to avoid mass illness because we intuitively avoid procedures that cause it to spread. Condition green periods are also optimal times to take more anti-aging herbs and foods and exercises that contribute to anti aging because the immune system can take more anti-aging substances. It is a well known fact in anti-aging research that taking too much of an anti-aging herb or routine can cause break down and imbalance of the immune system, much like extreme athletes suffer from a weak immune system, due to their extreme athletic lifestyle. Although further research is necessary, this model may also possibly be used to forecast future metal movements in the markets, sport related events, and the currency markets. Gold and Silver would be most interesting to study further using these cross point references. We already use it successfully to forecast terrorist events, such as the 911 attacks in New York City, which occurred during a condition orange period (just after the peak of a sunspot high period).
Geomagnetic Storms and the Stock Market In a study for the Federal Reserve Bank of Atlanta, Anna Krivelyova and Cesare Robotti found a connection between geomagnetic storms and stock market performance. Stocks tend to be negatively affected in the 6 days after a geomagnetic storm. Paper at: http://www.frbatlanta.org/filelegacydocs/wp0305b.pdf
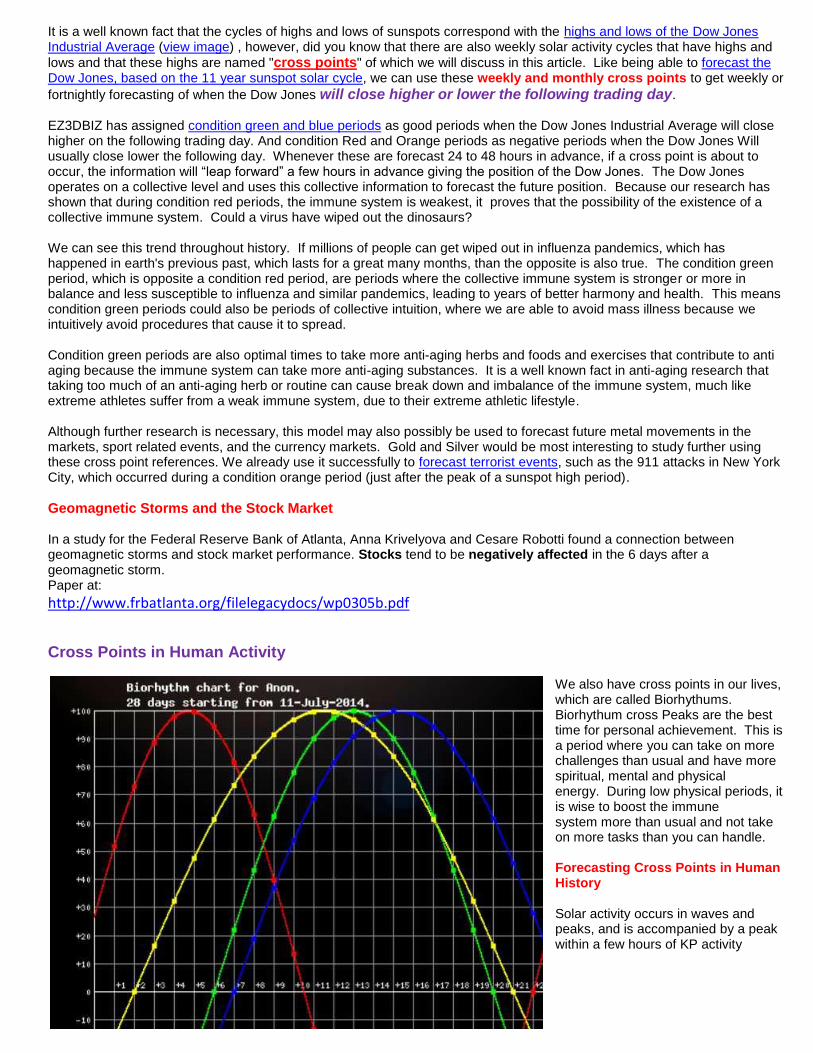
Cross Points in Human Activity
We also have cross points in our lives, which are called Biorhythums. Biorhythum cross Peaks are the best time for personal achievement. This is a period where you can take on more challenges than usual and have more spiritual, mental and physical energy. During low physical periods, it is wise to boost the immune system more than usual and not take on more tasks than you can handle. Forecasting Cross Points in Human History Solar activity occurs in waves and peaks, and is accompanied by a peak within a few hours of KP activity

3
(earth’s geomagnetic activity). These peaks are called Cross Points.
Cross points can be divided into monthly or yearly cycles. If a weekly cross point matches with a yearly cross point, the cross point energies on that day are significantly stronger. For example, 2013 was a condition orange year, so cross point day periods on that day, especially from July to October were especially strong. We can also use this rough model to get an idea of this energy. Summer Solstice - A Cross Point Peak or a period of a condition Blue. Winter Solstice - Condition Purple and Orange. March Equinox - Condition Red. September Equinox - Condition Green. What is most interesting is people born during September (a condition green period), outlive those born during other times of the year. In 2002 scientists at Germany's Max Planck Institute for Demographic Research announced that people born in the autumn live longer than those born in spring – and are less likely to become as ill in old age. Although further research is needed, a peak decline in KP levels, and a peak low in sunspot activity may also signal another cross point and further research is needed to reveal if there is a pattern at this period in solar and KP activity.
Learning To Read the Language Of The Sun It is now possible to read the language of the sun. Just look for the days that the cross points occur (which we shall show later in more detail throughout this article). A cross point occurs when there is a peak in KP activity and there is a peak in the sun's solar flux (also called the radio flux). Next look for events that occurred on these days. In the case of our research we are using the Dow Jones Industrial Average. During days of Condition Green Periods when there is a cross point, the Dow will close higher on these days. During days of Condition Red and Orange Periods, the Dow Jones Industrial Average will close lower on the upcoming cross point day.
The Condition Color Periods are based on Solar Wind Speeds, The rising or lowering of Sunspot Levels, either increasing
sunspots or declining sunspots for 3 days in a row (or the Sunspot Area, 10E-6 Hemis). Our In-Depth Page goes into the
technical aspects of this.
If the event that occurred on that day was negative, than you use the solar wind speed, KP levels and Sunspot Direction to plot future negative events, using these solar parameters as a model to work from. The same goes for positive periods and events. Just know in advance the solar wind speed, KP levels and Sunspot Direction to stay safe and have a good time during the proper periods. Space Weather Forecasting has now evolved enough to where they can predict solar wind speeds, sunspot number and direction and KP direction up to 4 days in advance with pretty good accuracy. Please note KP stands for Earth's Geomagnetic Energy and is displayed at 3 hour intervals on this page and hourly daily levels on this page. http://www.swpc.noaa.gov/rt_plots/kp_3d.html Additional tools: http://www.ez3dbiz.com/forecasting_tools.html
2014 Solar flux and KP Data Archive: http://www.swpc.noaa.gov/ftpdir/indices/old_indices/
Dow Jones Historical Prices: http://finance.yahoo.com/q/hp?s=^dji+historical+prices
The Golden Rule of Time Any date before an upcoming cross point (usually within a few days), the results or actions of the future, (in this case the dow jones) will be reflected a few days before hand. This is amplified on the Fridays before a weekend. 2nd Rule. Recent Condition Greens and Blues cause a dow to rise. Orange, Red and Purple cause it to fall. 3rd Rule. The upcoming condition color determines the result of the future action. If in the case of the markets, a condition red forecast a few days out with a cross point incoming, will result in a lower dow jones average.
4
By applying the language of the sun (condition colors) to circumstances or events, we can accurately predict a future outcome or event, by looking for the cross points of the sun that occur in the future.
Let’s examine the evidence in further detail to construct our forecasting model From performing preliminary research it appears that when solar activity reaches a “high” or “peak”, the Dow Jones Industrial Average behaves according to the condition color. As a simple illustration. If the Daily Health Forecast forecasted a strong condition green period, which is a period of peace and tranquility (available at www.ez3dbiz.com) and the sun’s solar activity reached a climax, than the Dow Jones Industrial Average would close higher the following trading day. If the forecast called for a condition red (a period of more fear), and there was a peak in Solar Flux Levels, than the Dow Jones Industrial Average would usually close lower. So during these peak solar periods a climatic energy release occurs, which helps set events in motion that affect the Dow Jones. Although more research needs to be done, I will list the parameters and tools used to come to this preliminary conclusion. This is a rough research layout/sketch mapping energies/condition colors from the sun combined with solar flux and KP energy to generate a picture of the Dow Jones Industrial Average 24 to 48 hours in advance. The main objective is by knowing the days the Dow Jones closes higher at the end of the day, you can buy stocks in the morning, and then put them on autosell to sell just before the end of the trading day. Dataset Tools Used: For the Year of 2013 The EZ3DBIZ.com Condition Color Archives: (last 3 years): http://www.ez3dbiz.com/solar_archive.html 2013 KP Data: http://www.swpc.noaa.gov/ftpdir/warehouse/2013/2013_DGD.txt Solar Flux Data for 2013: http://www.swpc.noaa.gov/ftpdir/warehouse/2013/2013_DSD.txt KP and Flux Data for 2013: http://www.swpc.noaa.gov/ftpdir/warehouse/2013/ Warehoused Solar Activity Data: http://www.swpc.noaa.gov/ftpdir/warehouse/ All findings are courtesy of www.NOAA.gov Before we dive into the figures, we have to understand what peak solar flux levels are. As previously mentioned, I name these “Turn Around Points” or “Cross Points” because they are periods where solar activity has reached a peak and is about to decline.
What are Turn Around Points? (also called cross points)
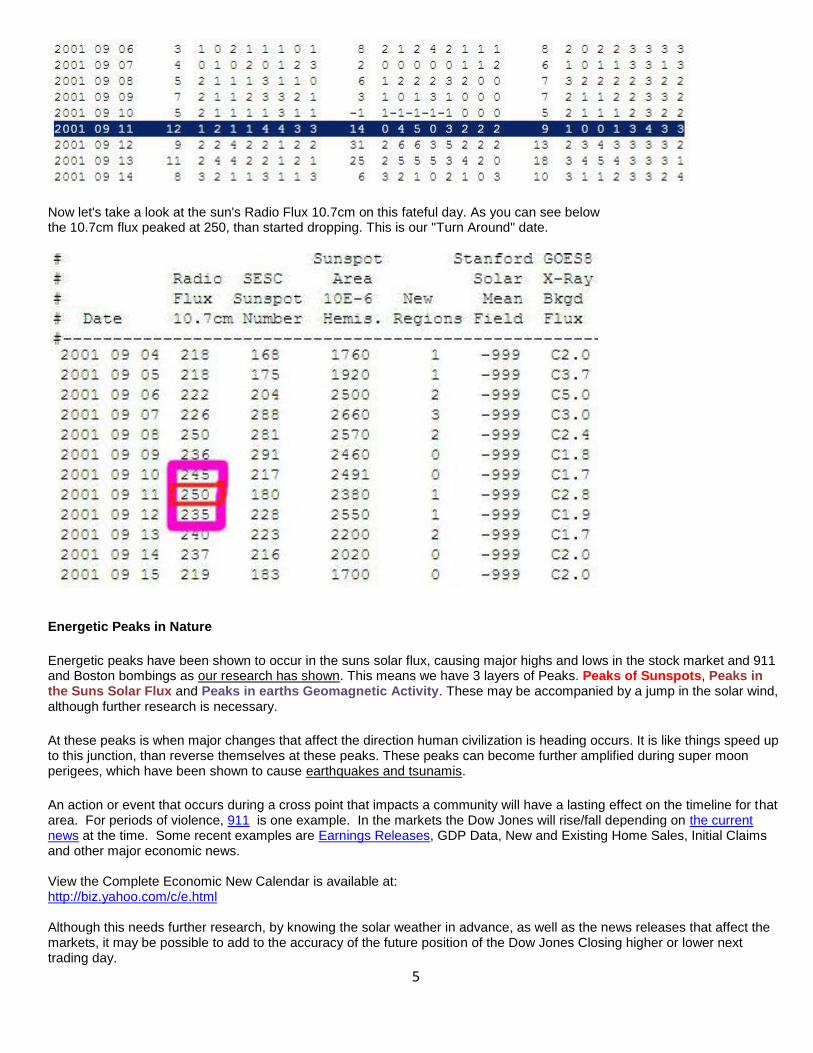
An excellent example of a Turn Around Point is the September 9-11 attacks which occurred in 2001. Let's take a closer look. Below are the KP Values (Also known as Earth’s Geomagnetic Activity) for this date. A more in-depth analysis can be found at: http://www.ez3dbiz.com/earth_behavior.html
We can also examine periods of earth's geomagnetic energy and match the peak along with the peak in the sun's solar flux. When we identify these in advance, we than look at the magnetic activity on the earth, as well as additional space data to forecast what the Dow Jones position will be within the next few hours.
5
Now let's take a look at the sun's Radio Flux 10.7cm on this fateful day. As you can see below the 10.7cm flux peaked at 250, than started dropping. This is our "Turn Around" date.
Energetic Peaks in Nature
Energetic peaks have been shown to occur in the suns solar flux, causing major highs and lows in the stock market and 911 and Boston bombings as our research has shown. This means we have 3 layers of Peaks. Peaks of Sunspots, Peaks in the Suns Solar Flux and Peaks in earths Geomagnetic Activity. These may be accompanied by a jump in the solar wind, although further research is necessary.
At these peaks is when major changes that affect the direction human civilization is heading occurs. It is like things speed up to this junction, than reverse themselves at these peaks. These peaks can become further amplified during super moon perigees, which have been shown to cause earthquakes and tsunamis.
An action or event that occurs during a cross point that impacts a community will have a lasting effect on the timeline for that area. For periods of violence, 911 is one example. In the markets the Dow Jones will rise/fall depending on the current news at the time. Some recent examples are Earnings Releases, GDP Data, New and Existing Home Sales, Initial Claims and other major economic news. View the Complete Economic New Calendar is available at: http://biz.yahoo.com/c/e.html Although this needs further research, by knowing the solar weather in advance, as well as the news releases that affect the markets, it may be possible to add to the accuracy of the future position of the Dow Jones Closing higher or lower next trading day.
6
Another cross point is during condition yellow periods. A condition yellow occurs when there is a sudden jump or increase in KP levels (earth's Geomagnetic energy) and a sudden jump in the solar wind speed of the Sun. Sometimes there is also an increase in the sun's solar flux. This makes condition yellow periods a "mini-cross point" period. This could be why during condition yellow periods, actions from the future are made manifest.
During condition yellow periods, the Deltrons exercise has shown potential for remarkable, rapid overnight healing by performing an exercise called the Deltrons exercise. Perhaps the best healing involves our intuition. Data:
2001 Sunspot Activity Archives: http://www.swpc.noaa.gov/ftpdir/indices/old_indices/2001_DSD.txt
Predicting Future Turn Around Points
To predict these future cross points we use the 45 AP Forecast courtesy of the U.S. Air force located at: http://www.swpc.noaa.gov/ftpdir/latest/45DF.txt
We can also use the NOAA Outlook table located at: http://www.swpc.noaa.gov/ftpdir/latest/27DO.txt
We can narrow down the future KP forecast, using the 3 day forecast located at: http://www.swpc.noaa.gov/ftpdir/latest/geomag_forecast.txt
However the Air Force Data is much more detailed.
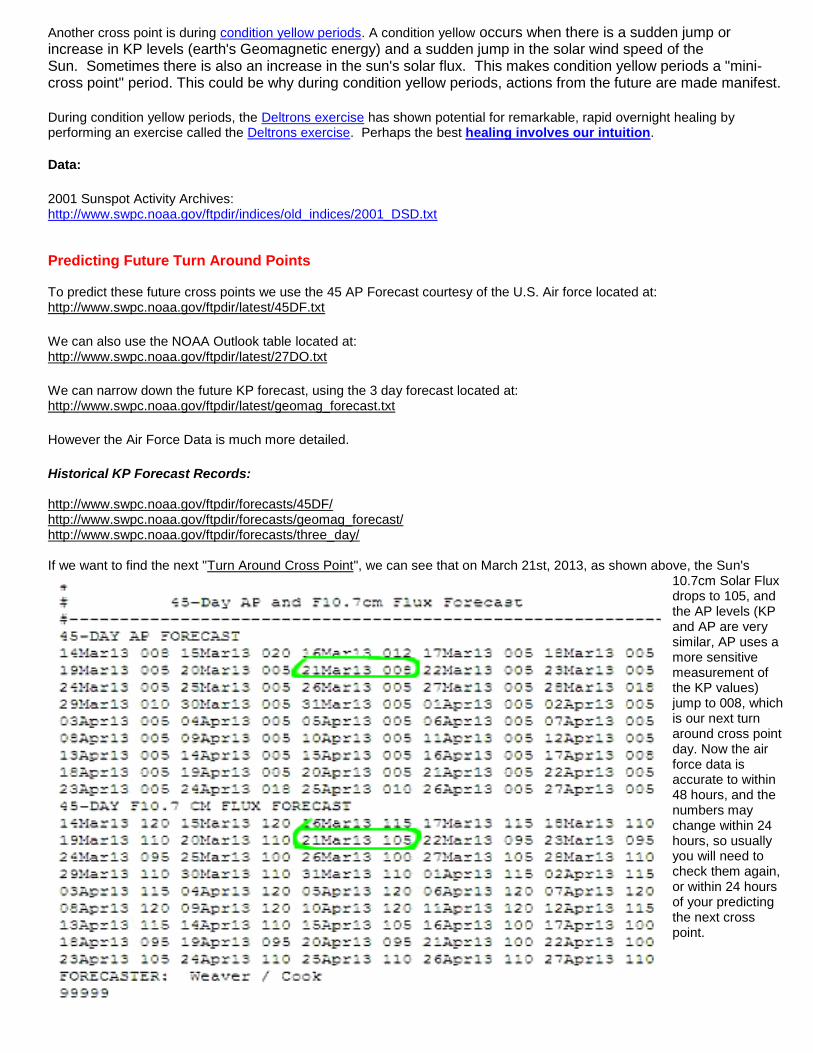
Historical KP Forecast Records: http://www.swpc.noaa.gov/ftpdir/forecasts/45DF/ http://www.swpc.noaa.gov/ftpdir/forecasts/geomag_forecast/ http://www.swpc.noaa.gov/ftpdir/forecasts/three_day/ If we want to find the next "Turn Around Cross Point", we can see that on March 21st, 2013, as shown above, the Sun's
10.7cm Solar Flux drops to 105, and the AP levels (KP and AP are very similar, AP uses a more sensitive measurement of the KP values) jump to 008, which is our next turn around cross point day. Now the air force data is accurate to within 48 hours, and the numbers may change within 24 hours, so usually you will need to check them again, or within 24 hours of your predicting the next cross point.
7
Now this "cross point" can even include the solar flux rising and the KP levels dropping. It is only when they both occur around the same time that we have our turn around cross point day. The interesting thing about studying this data is if a cross point occurs over a weekend, the Dow Jones will usually close higher on a Friday. Now we need to look at the magnetic activity levels that earth will be experiencing on this date. So we gather this data and assign it numbers.
Creating the Cross Point Equation representing the Future Timeline
By knowing the solar winds influence on the events or circumstance 24 hours before a cross point occurs, the future for that event becomes "solidified" or collapses into view more strongly during this period. It is like looking through a "Time Periscope" and peering 24 hours into the future. In the event of the Dow Jones Industrial Average, during condition green periods (when the solar wind recently enters the speed of 350), if a cross point occurs 24 hours before this "Green Zone", we know the Dow Jones Industrial Average is going to close lower the following day. Here is an equation to simplify the above text: X < + S = 0 With X representing the day of the Cross Point, and < representing the Time Periscope + equaling these 2 objects/events and S representing the Solar Wind Speed = representing equal with 0 representing the outcome or future event.
You can use tools to help you locate your own cross points at the following address: http://www.ez3dbiz.com/time_access.html
Additional Tools: http://www.ez3dbiz.com/toolbox.html
Our rough data for 2012 can be found at: http://www.ez3dbiz.com/analyse.html
2014 Solar flux and KP Data Archive: http://www.swpc.noaa.gov/ftpdir/indices/old_indices/
Dow Jones Historical Prices: http://finance.yahoo.com/q/hp?s=^dji+historical+prices
So that's it. Something very special happens during these Turn Around Cross Point dates. It is like a portal of some type opens up.
So let’s take a look at some preliminary data:
All data is from:
2014 Solar flux and KP Data Archive: http://www.swpc.noaa.gov/ftpdir/indices/old_indices/
Dow Jones Historical Prices: http://finance.yahoo.com/q/hp?s=^dji+historical+prices
The EZ3DBIZ.com Condition Color Archives: (last 3 years): http://www.ez3dbiz.com/solar_archive.html
Below data added on July 1st, 2014
8
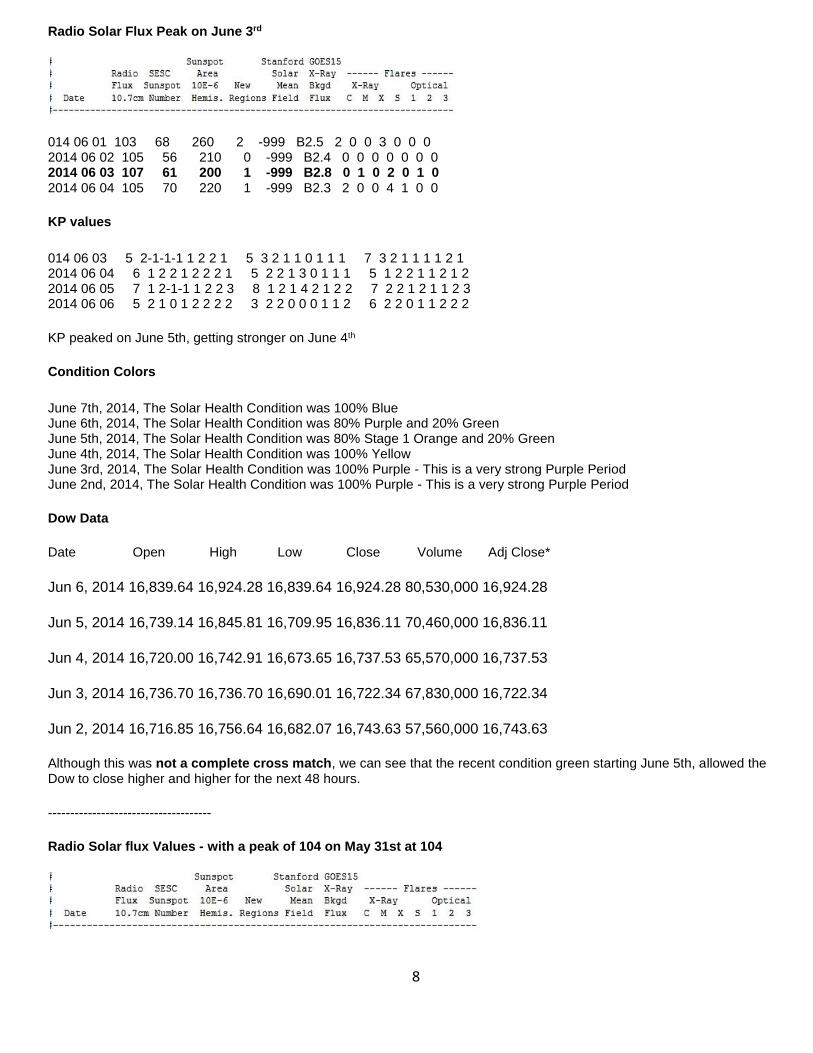
Radio Solar Flux Peak on June 3rd
014 06 01 103 68 260 2 -999 B2.5 2 0 0 3 0 0 0 2014 06 02 105 56 210 0 -999 B2.4 0 0 0 0 0 0 0 2014 06 03 107 61 200 1 -999 B2.8 0 1 0 2 0 1 0 2014 06 04 105 70 220 1 -999 B2.3 2 0 0 4 1 0 0
KP values
014 06 03 5 2-1-1-1 1 2 2 1 5 3 2 1 1 0 1 1 1 7 3 2 1 1 1 1 2 1 2014 06 04 6 1 2 2 1 2 2 2 1 5 2 2 1 3 0 1 1 1 5 1 2 2 1 1 2 1 2 2014 06 05 7 1 2-1-1 1 2 2 3 8 1 2 1 4 2 1 2 2 7 2 2 1 2 1 1 2 3 2014 06 06 5 2 1 0 1 2 2 2 2 3 2 2 0 0 0 1 1 2 6 2 2 0 1 1 2 2 2
KP peaked on June 5th, getting stronger on June 4th
Condition Colors
June 7th, 2014, The Solar Health Condition was 100% Blue June 6th, 2014, The Solar Health Condition was 80% Purple and 20% Green June 5th, 2014, The Solar Health Condition was 80% Stage 1 Orange and 20% Green June 4th, 2014, The Solar Health Condition was 100% Yellow June 3rd, 2014, The Solar Health Condition was 100% Purple - This is a very strong Purple Period June 2nd, 2014, The Solar Health Condition was 100% Purple - This is a very strong Purple Period
Dow Data
Date Open High Low Close Volume Adj Close*
Jun 6, 2014 16,839.64 16,924.28 16,839.64 16,924.28 80,530,000 16,924.28
Jun 5, 2014 16,739.14 16,845.81 16,709.95 16,836.11 70,460,000 16,836.11
Jun 4, 2014 16,720.00 16,742.91 16,673.65 16,737.53 65,570,000 16,737.53
Jun 3, 2014 16,736.70 16,736.70 16,690.01 16,722.34 67,830,000 16,722.34
Jun 2, 2014 16,716.85 16,756.64 16,682.07 16,743.63 57,560,000 16,743.63
Although this was not a complete cross match, we can see that the recent condition green starting June 5th, allowed the Dow to close higher and higher for the next 48 hours.
-------------------------------------
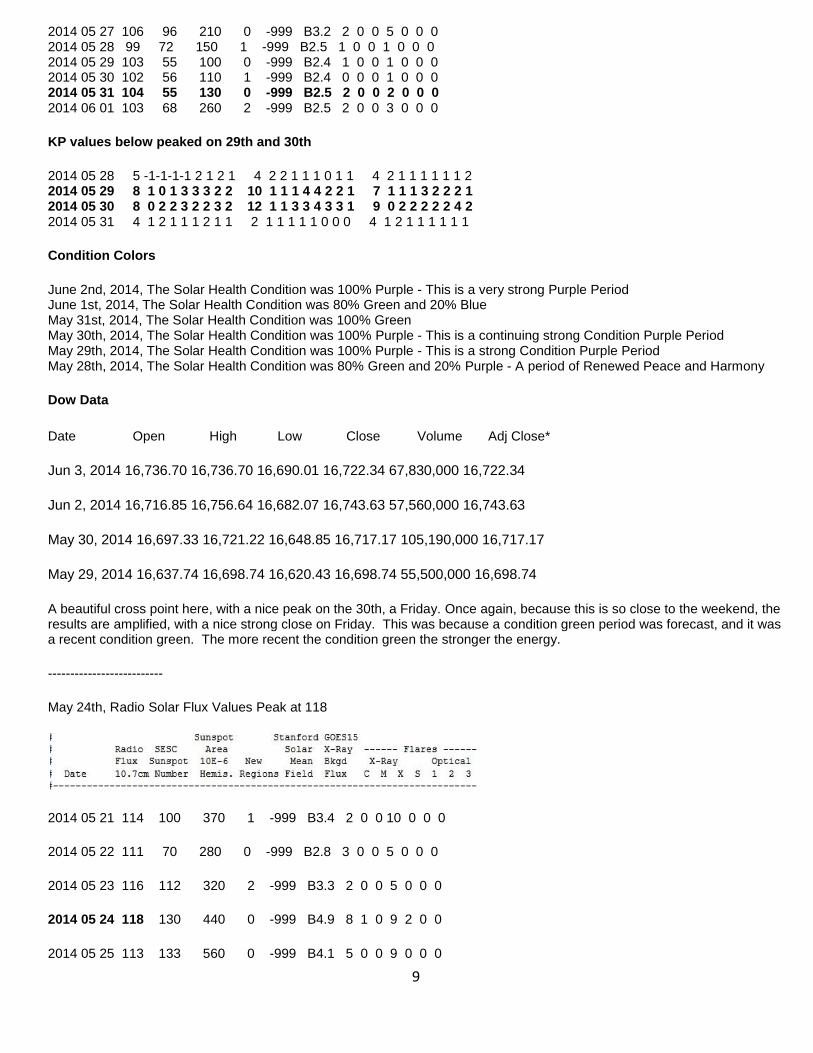
Radio Solar flux Values - with a peak of 104 on May 31st at 104
9
2014 05 27 106 96 210 0 -999 B3.2 2 0 0 5 0 0 0 2014 05 28 99 72 150 1 -999 B2.5 1 0 0 1 0 0 0 2014 05 29 103 55 100 0 -999 B2.4 1 0 0 1 0 0 0 2014 05 30 102 56 110 1 -999 B2.4 0 0 0 1 0 0 0 2014 05 31 104 55 130 0 -999 B2.5 2 0 0 2 0 0 0 2014 06 01 103 68 260 2 -999 B2.5 2 0 0 3 0 0 0
KP values below peaked on 29th and 30th
2014 05 28 5 -1-1-1-1 2 1 2 1 4 2 2 1 1 1 0 1 1 4 2 1 1 1 1 1 1 2 2014 05 29 8 1 0 1 3 3 3 2 2 10 1 1 1 4 4 2 2 1 7 1 1 1 3 2 2 2 1 2014 05 30 8 0 2 2 3 2 2 3 2 12 1 1 3 3 4 3 3 1 9 0 2 2 2 2 2 4 2 2014 05 31 4 1 2 1 1 1 2 1 1 2 1 1 1 1 1 0 0 0 4 1 2 1 1 1 1 1 1
Condition Colors
June 2nd, 2014, The Solar Health Condition was 100% Purple - This is a very strong Purple Period June 1st, 2014, The Solar Health Condition was 80% Green and 20% Blue May 31st, 2014, The Solar Health Condition was 100% Green May 30th, 2014, The Solar Health Condition was 100% Purple - This is a continuing strong Condition Purple Period May 29th, 2014, The Solar Health Condition was 100% Purple - This is a strong Condition Purple Period May 28th, 2014, The Solar Health Condition was 80% Green and 20% Purple - A period of Renewed Peace and Harmony
Dow Data
Date Open High Low Close Volume Adj Close*
Jun 3, 2014 16,736.70 16,736.70 16,690.01 16,722.34 67,830,000 16,722.34
Jun 2, 2014 16,716.85 16,756.64 16,682.07 16,743.63 57,560,000 16,743.63
May 30, 2014 16,697.33 16,721.22 16,648.85 16,717.17 105,190,000 16,717.17
May 29, 2014 16,637.74 16,698.74 16,620.43 16,698.74 55,500,000 16,698.74
A beautiful cross point here, with a nice peak on the 30th, a Friday. Once again, because this is so close to the weekend, the results are amplified, with a nice strong close on Friday. This was because a condition green period was forecast, and it was a recent condition green. The more recent the condition green the stronger the energy.
--------------------------
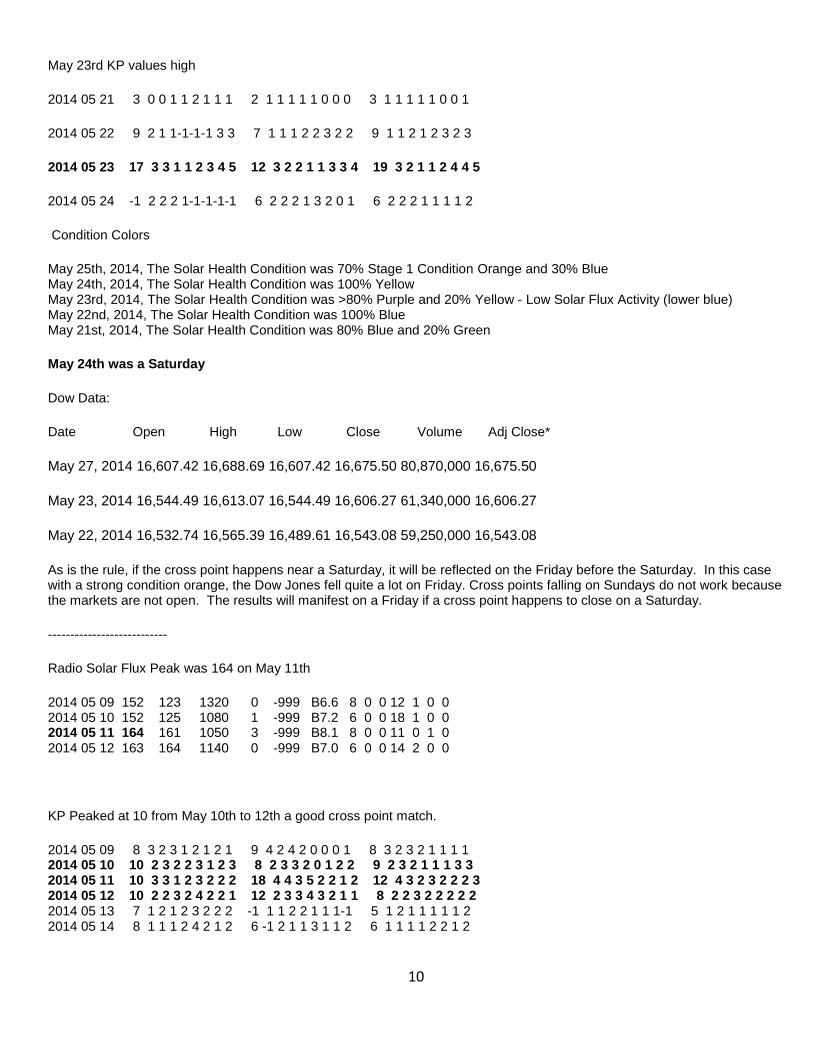
May 24th, Radio Solar Flux Values Peak at 118
2014 05 21 114 100 370 1 -999 B3.4 2 0 0 10 0 0 0
2014 05 22 111 70 280 0 -999 B2.8 3 0 0 5 0 0 0
2014 05 23 116 112 320 2 -999 B3.3 2 0 0 5 0 0 0
2014 05 24 118 130 440 0 -999 B4.9 8 1 0 9 2 0 0
2014 05 25 113 133 560 0 -999 B4.1 5 0 0 9 0 0 0
10
May 23rd KP values high
2014 05 21 3 0 0 1 1 2 1 1 1 2 1 1 1 1 1 0 0 0 3 1 1 1 1 1 0 0 1
2014 05 22 9 2 1 1-1-1-1 3 3 7 1 1 1 2 2 3 2 2 9 1 1 2 1 2 3 2 3
2014 05 23 17 3 3 1 1 2 3 4 5 12 3 2 2 1 1 3 3 4 19 3 2 1 1 2 4 4 5
2014 05 24 -1 2 2 2 1-1-1-1-1 6 2 2 2 1 3 2 0 1 6 2 2 2 1 1 1 1 2
Condition Colors
May 25th, 2014, The Solar Health Condition was 70% Stage 1 Condition Orange and 30% Blue May 24th, 2014, The Solar Health Condition was 100% Yellow May 23rd, 2014, The Solar Health Condition was >80% Purple and 20% Yellow - Low Solar Flux Activity (lower blue) May 22nd, 2014, The Solar Health Condition was 100% Blue May 21st, 2014, The Solar Health Condition was 80% Blue and 20% Green
May 24th was a Saturday
Dow Data:
Date Open High Low Close Volume Adj Close*
May 27, 2014 16,607.42 16,688.69 16,607.42 16,675.50 80,870,000 16,675.50
May 23, 2014 16,544.49 16,613.07 16,544.49 16,606.27 61,340,000 16,606.27
May 22, 2014 16,532.74 16,565.39 16,489.61 16,543.08 59,250,000 16,543.08
As is the rule, if the cross point happens near a Saturday, it will be reflected on the Friday before the Saturday. In this case with a strong condition orange, the Dow Jones fell quite a lot on Friday. Cross points falling on Sundays do not work because the markets are not open. The results will manifest on a Friday if a cross point happens to close on a Saturday.
---------------------------
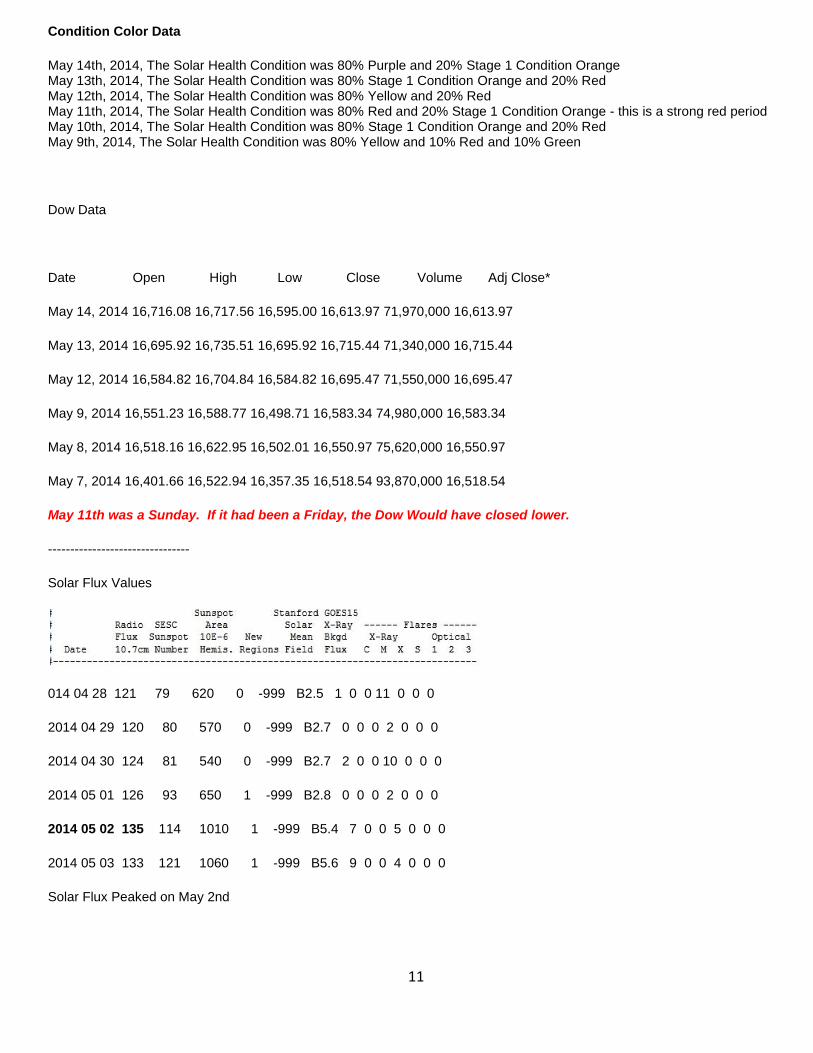
Radio Solar Flux Peak was 164 on May 11th
2014 05 09 152 123 1320 0 -999 B6.6 8 0 0 12 1 0 0 2014 05 10 152 125 1080 1 -999 B7.2 6 0 0 18 1 0 0 2014 05 11 164 161 1050 3 -999 B8.1 8 0 0 11 0 1 0 2014 05 12 163 164 1140 0 -999 B7.0 6 0 0 14 2 0 0
KP Peaked at 10 from May 10th to 12th a good cross point match.
2014 05 09 8 3 2 3 1 2 1 2 1 9 4 2 4 2 0 0 0 1 8 3 2 3 2 1 1 1 1 2014 05 10 10 2 3 2 2 3 1 2 3 8 2 3 3 2 0 1 2 2 9 2 3 2 1 1 1 3 3 2014 05 11 10 3 3 1 2 3 2 2 2 18 4 4 3 5 2 2 1 2 12 4 3 2 3 2 2 2 3 2014 05 12 10 2 2 3 2 4 2 2 1 12 2 3 3 4 3 2 1 1 8 2 2 3 2 2 2 2 2 2014 05 13 7 1 2 1 2 3 2 2 2 -1 1 1 2 2 1 1 1-1 5 1 2 1 1 1 1 1 2 2014 05 14 8 1 1 1 2 4 2 1 2 6 -1 2 1 1 3 1 1 2 6 1 1 1 1 2 2 1 2
11
Condition Color Data
May 14th, 2014, The Solar Health Condition was 80% Purple and 20% Stage 1 Condition Orange May 13th, 2014, The Solar Health Condition was 80% Stage 1 Condition Orange and 20% Red May 12th, 2014, The Solar Health Condition was 80% Yellow and 20% Red May 11th, 2014, The Solar Health Condition was 80% Red and 20% Stage 1 Condition Orange - this is a strong red period May 10th, 2014, The Solar Health Condition was 80% Stage 1 Condition Orange and 20% Red May 9th, 2014, The Solar Health Condition was 80% Yellow and 10% Red and 10% Green
Dow Data
Date Open High Low Close Volume Adj Close*
May 14, 2014 16,716.08 16,717.56 16,595.00 16,613.97 71,970,000 16,613.97
May 13, 2014 16,695.92 16,735.51 16,695.92 16,715.44 71,340,000 16,715.44
May 12, 2014 16,584.82 16,704.84 16,584.82 16,695.47 71,550,000 16,695.47
May 9, 2014 16,551.23 16,588.77 16,498.71 16,583.34 74,980,000 16,583.34
May 8, 2014 16,518.16 16,622.95 16,502.01 16,550.97 75,620,000 16,550.97
May 7, 2014 16,401.66 16,522.94 16,357.35 16,518.54 93,870,000 16,518.54
May 11th was a Sunday. If it had been a Friday, the Dow Would have closed lower.
--------------------------------
Solar Flux Values
014 04 28 121 79 620 0 -999 B2.5 1 0 0 11 0 0 0
2014 04 29 120 80 570 0 -999 B2.7 0 0 0 2 0 0 0
2014 04 30 124 81 540 0 -999 B2.7 2 0 0 10 0 0 0
2014 05 01 126 93 650 1 -999 B2.8 0 0 0 2 0 0 0
2014 05 02 135 114 1010 1 -999 B5.4 7 0 0 5 0 0 0
2014 05 03 133 121 1060 1 -999 B5.6 9 0 0 4 0 0 0
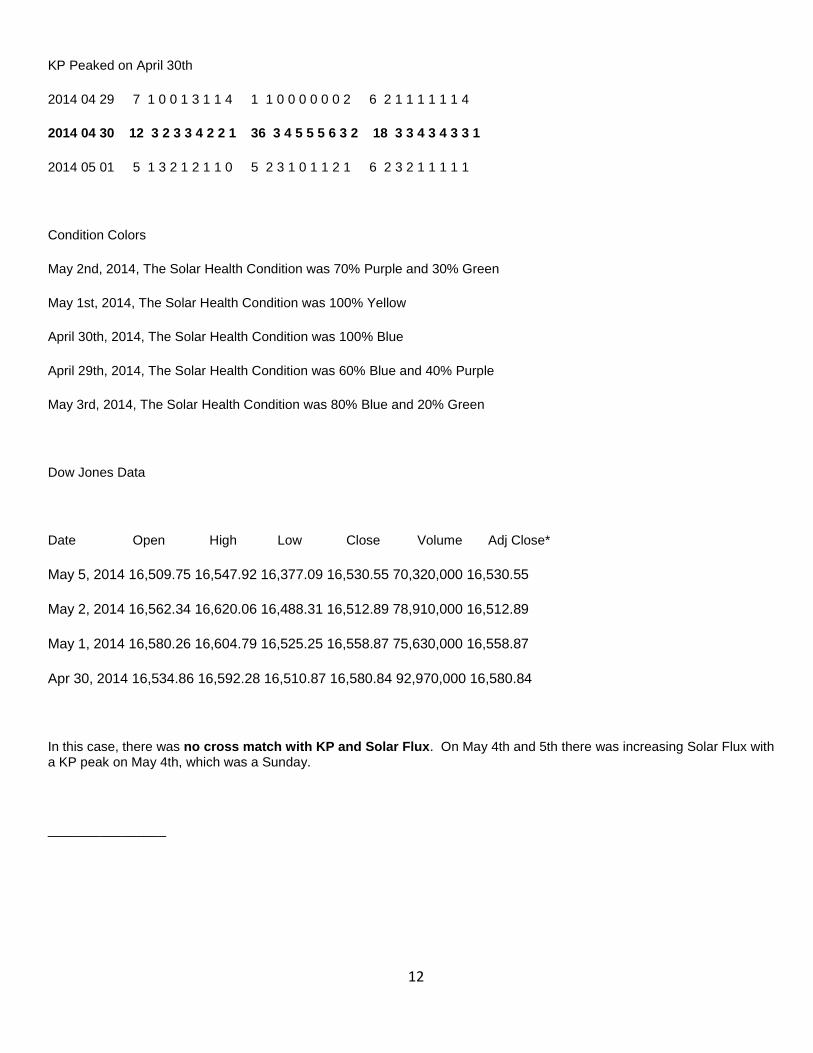
Solar Flux Peaked on May 2nd
12
KP Peaked on April 30th
2014 04 29 7 1 0 0 1 3 1 1 4 1 1 0 0 0 0 0 0 2 6 2 1 1 1 1 1 1 4
2014 04 30 12 3 2 3 3 4 2 2 1 36 3 4 5 5 5 6 3 2 18 3 3 4 3 4 3 3 1
2014 05 01 5 1 3 2 1 2 1 1 0 5 2 3 1 0 1 1 2 1 6 2 3 2 1 1 1 1 1
Condition Colors
May 2nd, 2014, The Solar Health Condition was 70% Purple and 30% Green
May 1st, 2014, The Solar Health Condition was 100% Yellow
April 30th, 2014, The Solar Health Condition was 100% Blue
April 29th, 2014, The Solar Health Condition was 60% Blue and 40% Purple
May 3rd, 2014, The Solar Health Condition was 80% Blue and 20% Green
Dow Jones Data
Date Open High Low Close Volume Adj Close*
May 5, 2014 16,509.75 16,547.92 16,377.09 16,530.55 70,320,000 16,530.55
May 2, 2014 16,562.34 16,620.06 16,488.31 16,512.89 78,910,000 16,512.89
May 1, 2014 16,580.26 16,604.79 16,525.25 16,558.87 75,630,000 16,558.87
Apr 30, 2014 16,534.86 16,592.28 16,510.87 16,580.84 92,970,000 16,580.84
In this case, there was no cross match with KP and Solar Flux. On May 4th and 5th there was increasing Solar Flux with a KP peak on May 4th, which was a Sunday.
________________

13
----------------------------------------------------------------------------------------------------------------------------- --
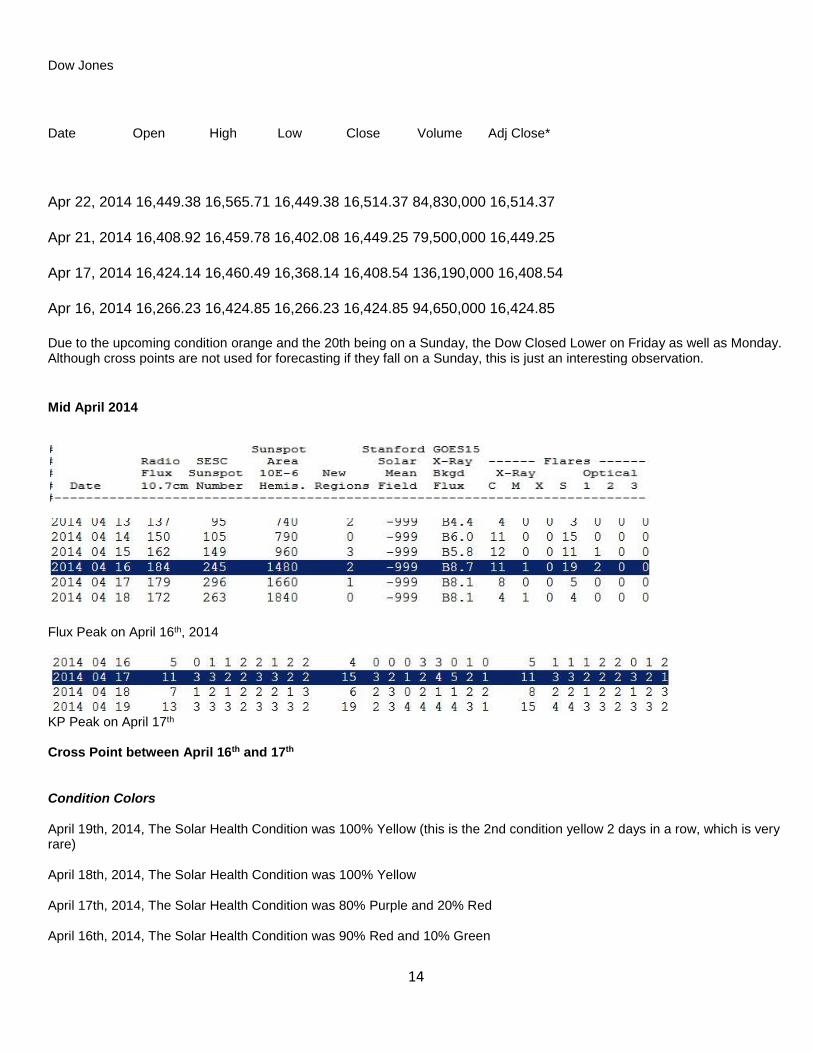
Late April 2014
Solar Flux values on 20th are 163
2014 04 18 172 263 1840 0 -999 B8.1 4 1 0 4 0 0 0
2014 04 19 169 259 1750 2 -999 B8.1 12 0 0 4 0 0 0
2014 04 20 163 192 1080 0 -999 B8.5 12 0 0 5 1 0 0
2014 04 21 159 168 1060 0 -999 B7.9 9 0 0 9 0 0 0
2014 04 22 145 136 760 0 -999 B2.8 9 0 0 6 1 0 0
2014 04 23 136 105 810 0 -999 B7.8 7 0 0 2 0 0 0
KP Peak on April 20th
2014 04 19 13 3 3 3 2 3 3 3 2 19 2 3 4 4 4 4 3 1 15 4 4 3 3 2 3 3 2
2014 04 20 20 3 2 1 4 5 3 3 4 18 3 2 1 3 4 5 3 3 22 3 2 1 3 5 4 4 4
2014 04 21 18 4 4 3 4 3 3 2 2 30 4 5 3 5 5 5 1 1 18 4 4 3 4 3 4 2 2
2014 04 22 4 1 2 2 1 1 1 0 1 2 1 1 1 1 0 1 0 0 5 1 2 1 2 1 1 0 1
Condition Colors
April 22nd and 23rd, 2014, The Solar Health Condition was 80% Blue and 20% Stage 1 Condition Orange April 20th to 21st, 2014, The Solar Health Condition was 80% Stage 1 Condition Orange and 20% Purple April 19th, 2014, The Solar Health Condition was 100% Yellow (this is the 2nd condition yellow 2 days in a row, which is very rare)
14
Dow Jones
Date Open High Low Close Volume Adj Close*
Apr 22, 2014 16,449.38 16,565.71 16,449.38 16,514.37 84,830,000 16,514.37
Apr 21, 2014 16,408.92 16,459.78 16,402.08 16,449.25 79,500,000 16,449.25
Apr 17, 2014 16,424.14 16,460.49 16,368.14 16,408.54 136,190,000 16,408.54
Apr 16, 2014 16,266.23 16,424.85 16,266.23 16,424.85 94,650,000 16,424.85
Due to the upcoming condition orange and the 20th being on a Sunday, the Dow Closed Lower on Friday as well as Monday. Although cross points are not used for forecasting if they fall on a Sunday, this is just an interesting observation.
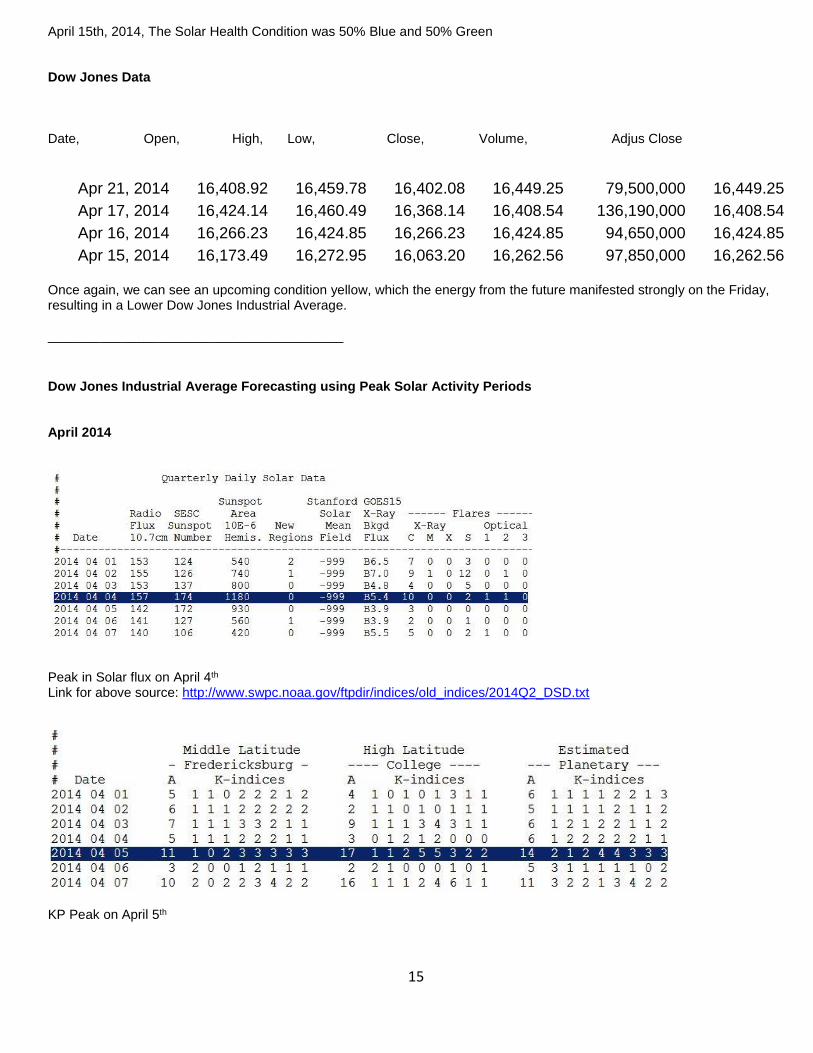
Mid April 2014
Flux Peak on April 16th, 2014
KP Peak on April 17th Cross Point between April 16th and 17th Condition Colors April 19th, 2014, The Solar Health Condition was 100% Yellow (this is the 2nd condition yellow 2 days in a row, which is very rare) April 18th, 2014, The Solar Health Condition was 100% Yellow April 17th, 2014, The Solar Health Condition was 80% Purple and 20% Red April 16th, 2014, The Solar Health Condition was 90% Red and 10% Green
15
April 15th, 2014, The Solar Health Condition was 50% Blue and 50% Green Dow Jones Data Date, Open, High, Low, Close, Volume, Adjus Close
Apr 21, 2014 16,408.92 16,459.78 16,402.08 16,449.25 79,500,000 16,449.25
Apr 17, 2014 16,424.14 16,460.49 16,368.14 16,408.54 136,190,000 16,408.54
Apr 16, 2014 16,266.23 16,424.85 16,266.23 16,424.85 94,650,000 16,424.85
Apr 15, 2014 16,173.49 16,272.95 16,063.20 16,262.56 97,850,000 16,262.56 Once again, we can see an upcoming condition yellow, which the energy from the future manifested strongly on the Friday, resulting in a Lower Dow Jones Industrial Average. ________________________________________
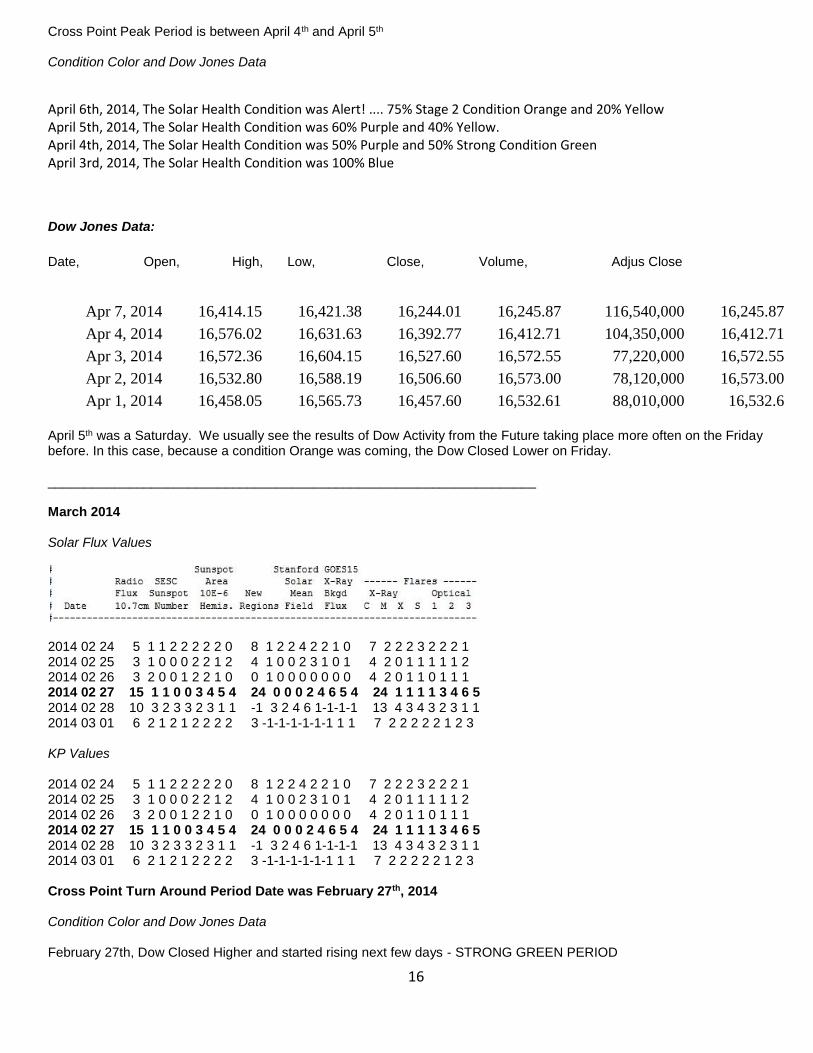
Dow Jones Industrial Average Forecasting using Peak Solar Activity Periods
April 2014
Peak in Solar flux on April 4th Link for above source: http://www.swpc.noaa.gov/ftpdir/indices/old_indices/2014Q2_DSD.txt
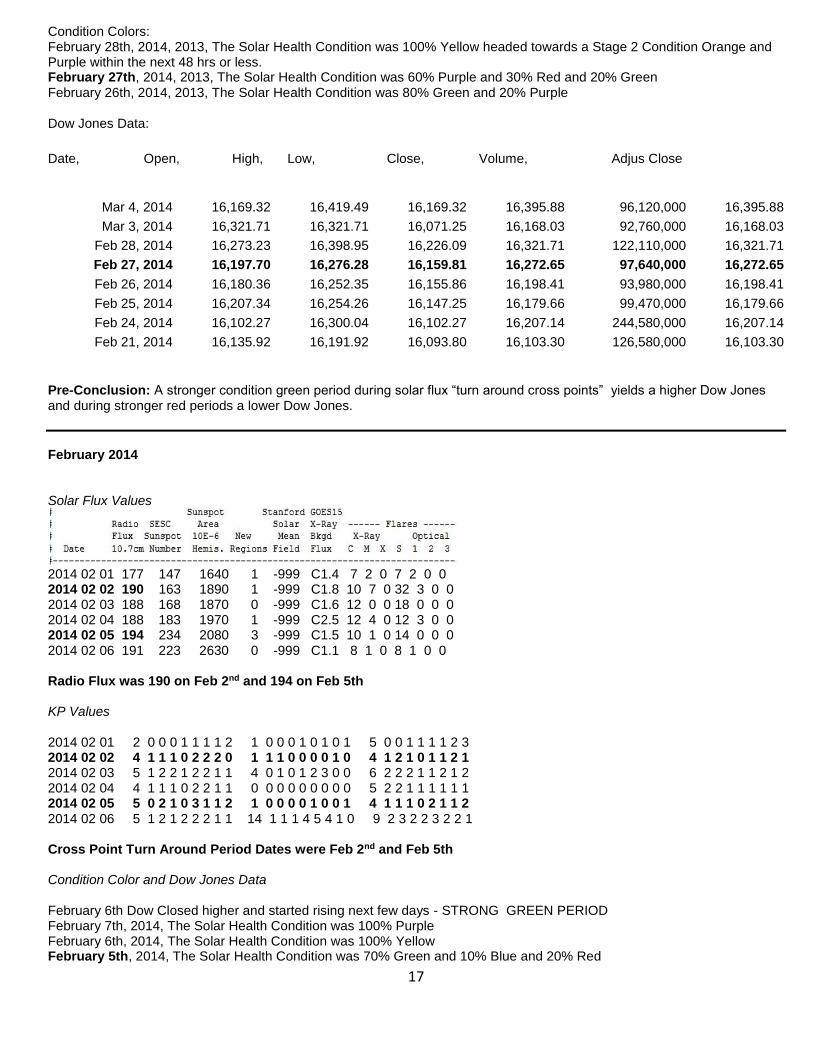
KP Peak on April 5th
16
Cross Point Peak Period is between April 4th and April 5th Condition Color and Dow Jones Data
April 6th, 2014, The Solar Health Condition was Alert! .... 75% Stage 2 Condition Orange and 20% Yellow April 5th, 2014, The Solar Health Condition was 60% Purple and 40% Yellow. April 4th, 2014, The Solar Health Condition was 50% Purple and 50% Strong Condition Green April 3rd, 2014, The Solar Health Condition was 100% Blue
Dow Jones Data:
Date, Open, High, Low, Close, Volume, Adjus Close
Apr 7, 2014 16,414.15 16,421.38 16,244.01 16,245.87 116,540,000 16,245.87
Apr 4, 2014 16,576.02 16,631.63 16,392.77 16,412.71 104,350,000 16,412.71
Apr 3, 2014 16,572.36 16,604.15 16,527.60 16,572.55 77,220,000 16,572.55
Apr 2, 2014 16,532.80 16,588.19 16,506.60 16,573.00 78,120,000 16,573.00
Apr 1, 2014 16,458.05 16,565.73 16,457.60 16,532.61 88,010,000 16,532.6
April 5th was a Saturday. We usually see the results of Dow Activity from the Future taking place more often on the Friday before. In this case, because a condition Orange was coming, the Dow Closed Lower on Friday. __________________________________________________________________ March 2014 Solar Flux Values
2014 02 24 5 1 1 2 2 2 2 2 0 8 1 2 2 4 2 2 1 0 7 2 2 2 3 2 2 2 1 2014 02 25 3 1 0 0 0 2 2 1 2 4 1 0 0 2 3 1 0 1 4 2 0 1 1 1 1 1 2 2014 02 26 3 2 0 0 1 2 2 1 0 0 1 0 0 0 0 0 0 0 4 2 0 1 1 0 1 1 1 2014 02 27 15 1 1 0 0 3 4 5 4 24 0 0 0 2 4 6 5 4 24 1 1 1 1 3 4 6 5 2014 02 28 10 3 2 3 3 2 3 1 1 -1 3 2 4 6 1-1-1-1 13 4 3 4 3 2 3 1 1 2014 03 01 6 2 1 2 1 2 2 2 2 3 -1-1-1-1-1-1 1 1 7 2 2 2 2 2 1 2 3 KP Values 2014 02 24 5 1 1 2 2 2 2 2 0 8 1 2 2 4 2 2 1 0 7 2 2 2 3 2 2 2 1 2014 02 25 3 1 0 0 0 2 2 1 2 4 1 0 0 2 3 1 0 1 4 2 0 1 1 1 1 1 2 2014 02 26 3 2 0 0 1 2 2 1 0 0 1 0 0 0 0 0 0 0 4 2 0 1 1 0 1 1 1 2014 02 27 15 1 1 0 0 3 4 5 4 24 0 0 0 2 4 6 5 4 24 1 1 1 1 3 4 6 5 2014 02 28 10 3 2 3 3 2 3 1 1 -1 3 2 4 6 1-1-1-1 13 4 3 4 3 2 3 1 1 2014 03 01 6 2 1 2 1 2 2 2 2 3 -1-1-1-1-1-1 1 1 7 2 2 2 2 2 1 2 3 Cross Point Turn Around Period Date was February 27th, 2014 Condition Color and Dow Jones Data February 27th, Dow Closed Higher and started rising next few days - STRONG GREEN PERIOD
17
Condition Colors: February 28th, 2014, 2013, The Solar Health Condition was 100% Yellow headed towards a Stage 2 Condition Orange and Purple within the next 48 hrs or less. February 27th, 2014, 2013, The Solar Health Condition was 60% Purple and 30% Red and 20% Green February 26th, 2014, 2013, The Solar Health Condition was 80% Green and 20% Purple Dow Jones Data:
Date, Open, High, Low, Close, Volume, Adjus Close
Mar 4, 2014 16,169.32 16,419.49 16,169.32 16,395.88 96,120,000 16,395.88
Mar 3, 2014 16,321.71 16,321.71 16,071.25 16,168.03 92,760,000 16,168.03
Feb 28, 2014 16,273.23 16,398.95 16,226.09 16,321.71 122,110,000 16,321.71
Feb 27, 2014 16,197.70 16,276.28 16,159.81 16,272.65 97,640,000 16,272.65
Feb 26, 2014 16,180.36 16,252.35 16,155.86 16,198.41 93,980,000 16,198.41
Feb 25, 2014 16,207.34 16,254.26 16,147.25 16,179.66 99,470,000 16,179.66
Feb 24, 2014 16,102.27 16,300.04 16,102.27 16,207.14 244,580,000 16,207.14
Feb 21, 2014 16,135.92 16,191.92 16,093.80 16,103.30 126,580,000 16,103.30
Pre-Conclusion: A stronger condition green period during solar flux “turn around cross points” yields a higher Dow Jones and during stronger red periods a lower Dow Jones.
February 2014 Solar Flux Values
2014 02 01 177 147 1640 1 -999 C1.4 7 2 0 7 2 0 0 2014 02 02 190 163 1890 1 -999 C1.8 10 7 0 32 3 0 0 2014 02 03 188 168 1870 0 -999 C1.6 12 0 0 18 0 0 0 2014 02 04 188 183 1970 1 -999 C2.5 12 4 0 12 3 0 0 2014 02 05 194 234 2080 3 -999 C1.5 10 1 0 14 0 0 0 2014 02 06 191 223 2630 0 -999 C1.1 8 1 0 8 1 0 0 Radio Flux was 190 on Feb 2nd and 194 on Feb 5th KP Values 2014 02 01 2 0 0 0 1 1 1 1 2 1 0 0 0 1 0 1 0 1 5 0 0 1 1 1 1 2 3 2014 02 02 4 1 1 1 0 2 2 2 0 1 1 1 0 0 0 0 1 0 4 1 2 1 0 1 1 2 1 2014 02 03 5 1 2 2 1 2 2 1 1 4 0 1 0 1 2 3 0 0 6 2 2 2 1 1 2 1 2 2014 02 04 4 1 1 1 0 2 2 1 1 0 0 0 0 0 0 0 0 0 5 2 2 1 1 1 1 1 1 2014 02 05 5 0 2 1 0 3 1 1 2 1 0 0 0 0 1 0 0 1 4 1 1 1 0 2 1 1 2 2014 02 06 5 1 2 1 2 2 2 1 1 14 1 1 1 4 5 4 1 0 9 2 3 2 2 3 2 2 1 Cross Point Turn Around Period Dates were Feb 2nd and Feb 5th Condition Color and Dow Jones Data February 6th Dow Closed higher and started rising next few days - STRONG GREEN PERIOD February 7th, 2014, The Solar Health Condition was 100% Purple February 6th, 2014, The Solar Health Condition was 100% Yellow February 5th, 2014, The Solar Health Condition was 70% Green and 10% Blue and 20% Red
18
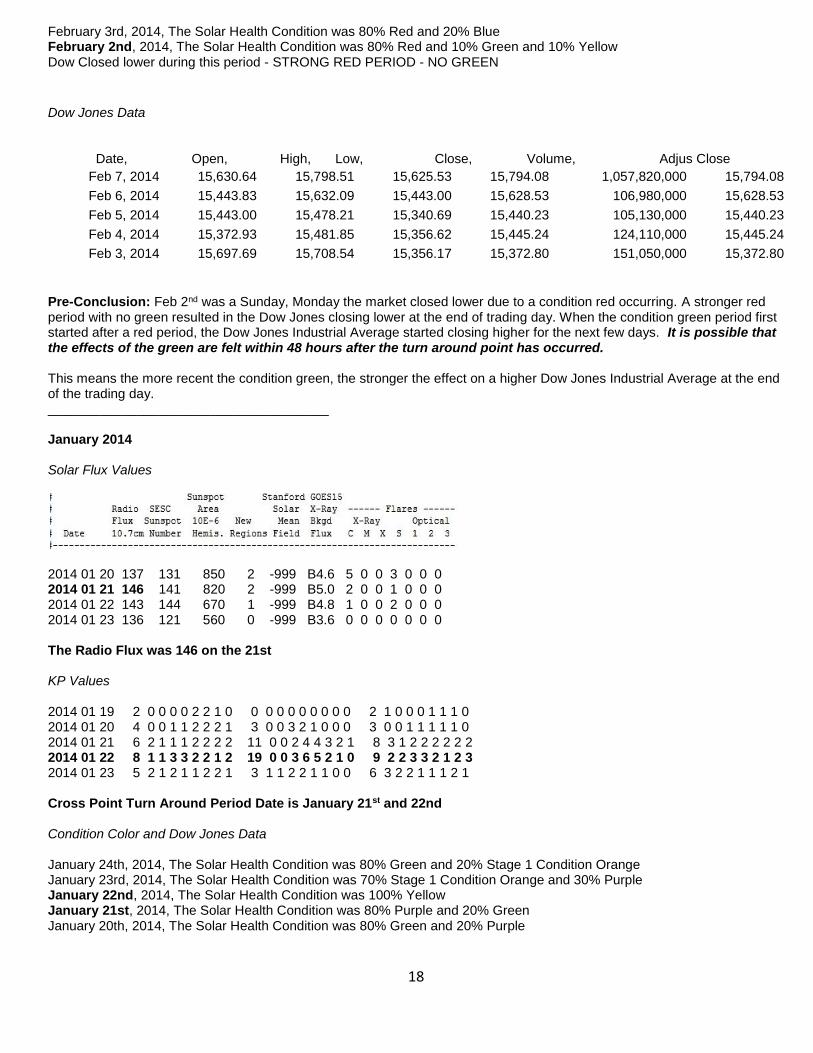
February 3rd, 2014, The Solar Health Condition was 80% Red and 20% Blue February 2nd, 2014, The Solar Health Condition was 80% Red and 10% Green and 10% Yellow Dow Closed lower during this period - STRONG RED PERIOD - NO GREEN
Dow Jones Data
Date, Open, High, Low, Close, Volume, Adjus Close
Feb 7, 2014 15,630.64 15,798.51 15,625.53 15,794.08 1,057,820,000 15,794.08
Feb 6, 2014 15,443.83 15,632.09 15,443.00 15,628.53 106,980,000 15,628.53
Feb 5, 2014 15,443.00 15,478.21 15,340.69 15,440.23 105,130,000 15,440.23
Feb 4, 2014 15,372.93 15,481.85 15,356.62 15,445.24 124,110,000 15,445.24
Feb 3, 2014 15,697.69 15,708.54 15,356.17 15,372.80 151,050,000 15,372.80
Pre-Conclusion: Feb 2nd was a Sunday, Monday the market closed lower due to a condition red occurring. A stronger red period with no green resulted in the Dow Jones closing lower at the end of trading day. When the condition green period first started after a red period, the Dow Jones Industrial Average started closing higher for the next few days. It is possible that the effects of the green are felt within 48 hours after the turn around point has occurred. This means the more recent the condition green, the stronger the effect on a higher Dow Jones Industrial Average at the end of the trading day. ______________________________________ January 2014 Solar Flux Values
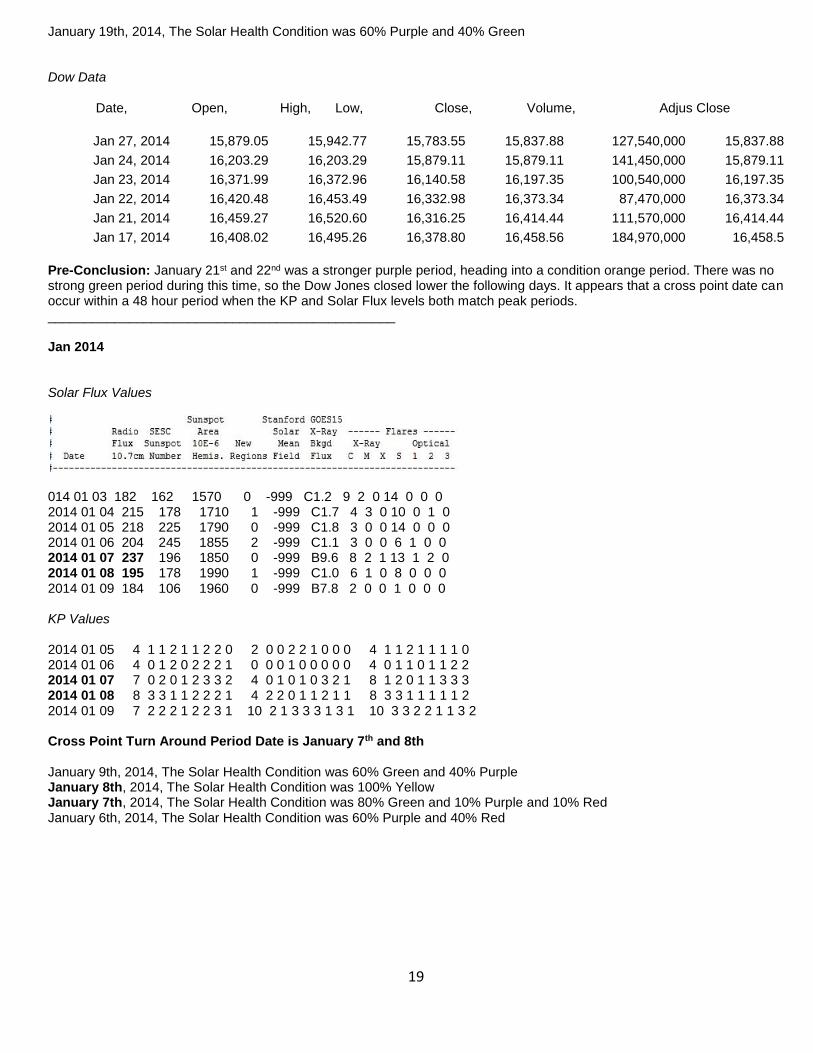
2014 01 20 137 131 850 2 -999 B4.6 5 0 0 3 0 0 0 2014 01 21 146 141 820 2 -999 B5.0 2 0 0 1 0 0 0 2014 01 22 143 144 670 1 -999 B4.8 1 0 0 2 0 0 0 2014 01 23 136 121 560 0 -999 B3.6 0 0 0 0 0 0 0 The Radio Flux was 146 on the 21st KP Values 2014 01 19 2 0 0 0 0 2 2 1 0 0 0 0 0 0 0 0 0 0 2 1 0 0 0 1 1 1 0 2014 01 20 4 0 0 1 1 2 2 2 1 3 0 0 3 2 1 0 0 0 3 0 0 1 1 1 1 1 0 2014 01 21 6 2 1 1 1 2 2 2 2 11 0 0 2 4 4 3 2 1 8 3 1 2 2 2 2 2 2 2014 01 22 8 1 1 3 3 2 2 1 2 19 0 0 3 6 5 2 1 0 9 2 2 3 3 2 1 2 3 2014 01 23 5 2 1 2 1 1 2 2 1 3 1 1 2 2 1 1 0 0 6 3 2 2 1 1 1 2 1 Cross Point Turn Around Period Date is January 21st and 22nd Condition Color and Dow Jones Data January 24th, 2014, The Solar Health Condition was 80% Green and 20% Stage 1 Condition Orange January 23rd, 2014, The Solar Health Condition was 70% Stage 1 Condition Orange and 30% Purple January 22nd, 2014, The Solar Health Condition was 100% Yellow January 21st, 2014, The Solar Health Condition was 80% Purple and 20% Green January 20th, 2014, The Solar Health Condition was 80% Green and 20% Purple
19
January 19th, 2014, The Solar Health Condition was 60% Purple and 40% Green Dow Data
Date, Open, High, Low, Close, Volume, Adjus Close
Jan 27, 2014 15,879.05 15,942.77 15,783.55 15,837.88 127,540,000 15,837.88
Jan 24, 2014 16,203.29 16,203.29 15,879.11 15,879.11 141,450,000 15,879.11
Jan 23, 2014 16,371.99 16,372.96 16,140.58 16,197.35 100,540,000 16,197.35
Jan 22, 2014 16,420.48 16,453.49 16,332.98 16,373.34 87,470,000 16,373.34
Jan 21, 2014 16,459.27 16,520.60 16,316.25 16,414.44 111,570,000 16,414.44
Jan 17, 2014 16,408.02 16,495.26 16,378.80 16,458.56 184,970,000 16,458.5
Pre-Conclusion: January 21st and 22nd was a stronger purple period, heading into a condition orange period. There was no strong green period during this time, so the Dow Jones closed lower the following days. It appears that a cross point date can occur within a 48 hour period when the KP and Solar Flux levels both match peak periods. _______________________________________________ Jan 2014 Solar Flux Values
014 01 03 182 162 1570 0 -999 C1.2 9 2 0 14 0 0 0 2014 01 04 215 178 1710 1 -999 C1.7 4 3 0 10 0 1 0 2014 01 05 218 225 1790 0 -999 C1.8 3 0 0 14 0 0 0 2014 01 06 204 245 1855 2 -999 C1.1 3 0 0 6 1 0 0 2014 01 07 237 196 1850 0 -999 B9.6 8 2 1 13 1 2 0 2014 01 08 195 178 1990 1 -999 C1.0 6 1 0 8 0 0 0 2014 01 09 184 106 1960 0 -999 B7.8 2 0 0 1 0 0 0 KP Values 2014 01 05 4 1 1 2 1 1 2 2 0 2 0 0 2 2 1 0 0 0 4 1 1 2 1 1 1 1 0 2014 01 06 4 0 1 2 0 2 2 2 1 0 0 0 1 0 0 0 0 0 4 0 1 1 0 1 1 2 2 2014 01 07 7 0 2 0 1 2 3 3 2 4 0 1 0 1 0 3 2 1 8 1 2 0 1 1 3 3 3 2014 01 08 8 3 3 1 1 2 2 2 1 4 2 2 0 1 1 2 1 1 8 3 3 1 1 1 1 1 2 2014 01 09 7 2 2 2 1 2 2 3 1 10 2 1 3 3 3 1 3 1 10 3 3 2 2 1 1 3 2 Cross Point Turn Around Period Date is January 7th and 8th January 9th, 2014, The Solar Health Condition was 60% Green and 40% Purple January 8th, 2014, The Solar Health Condition was 100% Yellow January 7th, 2014, The Solar Health Condition was 80% Green and 10% Purple and 10% Red January 6th, 2014, The Solar Health Condition was 60% Purple and 40% Red
20
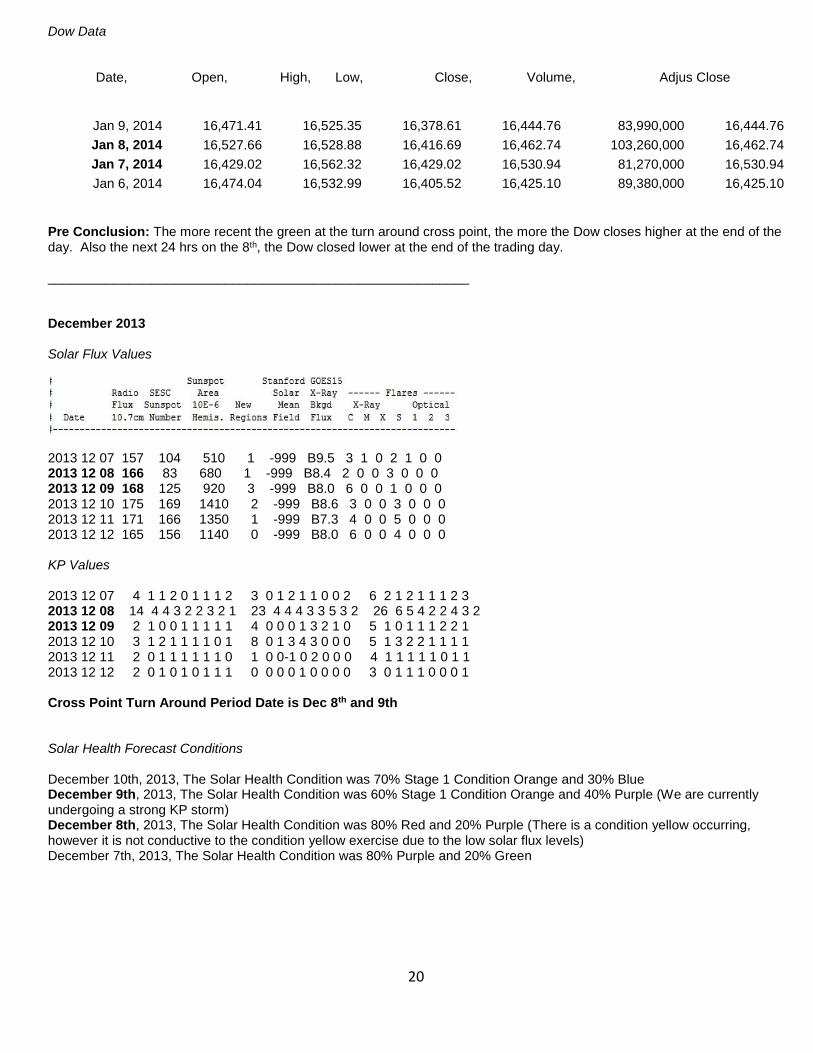
Dow Data
Date, Open, High, Low, Close, Volume, Adjus Close
Jan 9, 2014 16,471.41 16,525.35 16,378.61 16,444.76 83,990,000 16,444.76
Jan 8, 2014 16,527.66 16,528.88 16,416.69 16,462.74 103,260,000 16,462.74
Jan 7, 2014 16,429.02 16,562.32 16,429.02 16,530.94 81,270,000 16,530.94
Jan 6, 2014 16,474.04 16,532.99 16,405.52 16,425.10 89,380,000 16,425.10
Pre Conclusion: The more recent the green at the turn around cross point, the more the Dow closes higher at the end of the day. Also the next 24 hrs on the 8th, the Dow closed lower at the end of the trading day. _________________________________________________________ December 2013 Solar Flux Values
2013 12 07 157 104 510 1 -999 B9.5 3 1 0 2 1 0 0 2013 12 08 166 83 680 1 -999 B8.4 2 0 0 3 0 0 0 2013 12 09 168 125 920 3 -999 B8.0 6 0 0 1 0 0 0 2013 12 10 175 169 1410 2 -999 B8.6 3 0 0 3 0 0 0 2013 12 11 171 166 1350 1 -999 B7.3 4 0 0 5 0 0 0 2013 12 12 165 156 1140 0 -999 B8.0 6 0 0 4 0 0 0 KP Values
2013 12 07 4 1 1 2 0 1 1 1 2 3 0 1 2 1 1 0 0 2 6 2 1 2 1 1 1 2 3 2013 12 08 14 4 4 3 2 2 3 2 1 23 4 4 4 3 3 5 3 2 26 6 5 4 2 2 4 3 2 2013 12 09 2 1 0 0 1 1 1 1 1 4 0 0 0 1 3 2 1 0 5 1 0 1 1 1 2 2 1 2013 12 10 3 1 2 1 1 1 1 0 1 8 0 1 3 4 3 0 0 0 5 1 3 2 2 1 1 1 1 2013 12 11 2 0 1 1 1 1 1 1 0 1 0 0-1 0 2 0 0 0 4 1 1 1 1 1 0 1 1 2013 12 12 2 0 1 0 1 0 1 1 1 0 0 0 0 1 0 0 0 0 3 0 1 1 1 0 0 0 1 Cross Point Turn Around Period Date is Dec 8th and 9th Solar Health Forecast Conditions December 10th, 2013, The Solar Health Condition was 70% Stage 1 Condition Orange and 30% Blue December 9th, 2013, The Solar Health Condition was 60% Stage 1 Condition Orange and 40% Purple (We are currently undergoing a strong KP storm) December 8th, 2013, The Solar Health Condition was 80% Red and 20% Purple (There is a condition yellow occurring, however it is not conductive to the condition yellow exercise due to the low solar flux levels) December 7th, 2013, The Solar Health Condition was 80% Purple and 20% Green
21
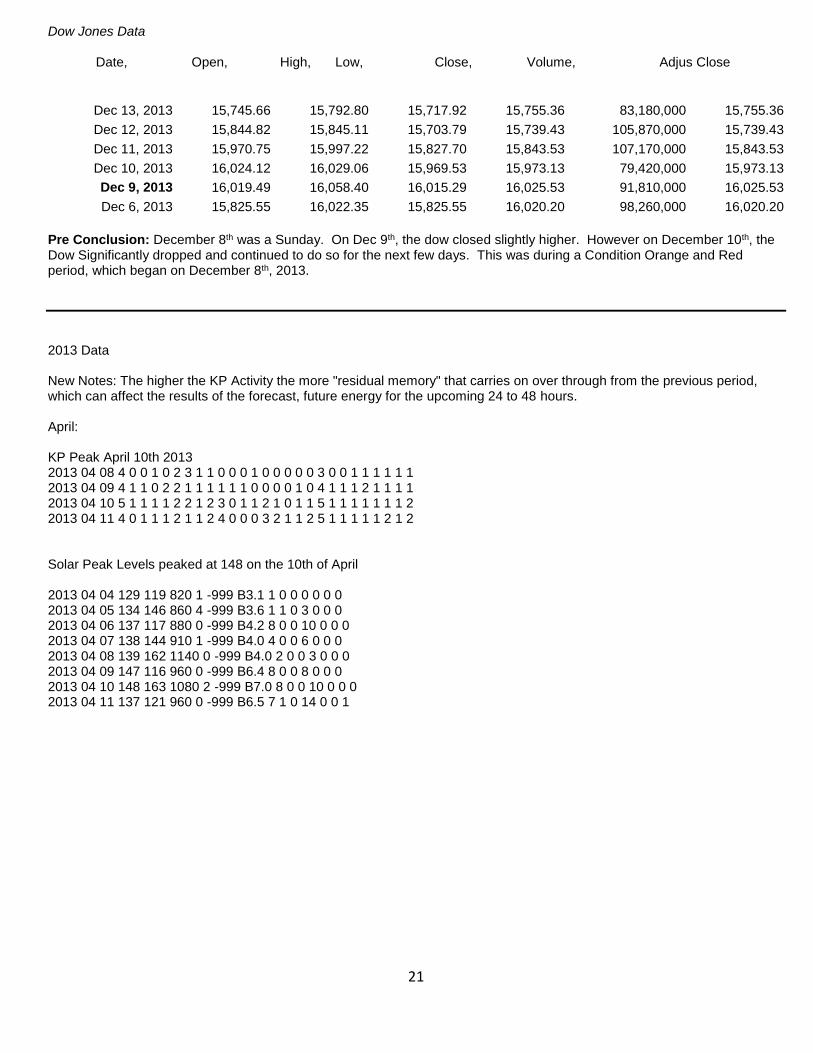
Dow Jones Data
Date, Open, High, Low, Close, Volume, Adjus Close
Dec 13, 2013 15,745.66 15,792.80 15,717.92 15,755.36 83,180,000 15,755.36
Dec 12, 2013 15,844.82 15,845.11 15,703.79 15,739.43 105,870,000 15,739.43
Dec 11, 2013 15,970.75 15,997.22 15,827.70 15,843.53 107,170,000 15,843.53
Dec 10, 2013 16,024.12 16,029.06 15,969.53 15,973.13 79,420,000 15,973.13
Dec 9, 2013 16,019.49 16,058.40 16,015.29 16,025.53 91,810,000 16,025.53
Dec 6, 2013 15,825.55 16,022.35 15,825.55 16,020.20 98,260,000 16,020.20
Pre Conclusion: December 8th was a Sunday. On Dec 9th, the dow closed slightly higher. However on December 10th, the Dow Significantly dropped and continued to do so for the next few days. This was during a Condition Orange and Red period, which began on December 8th, 2013.
2013 Data New Notes: The higher the KP Activity the more "residual memory" that carries on over through from the previous period, which can affect the results of the forecast, future energy for the upcoming 24 to 48 hours. April: KP Peak April 10th 2013 2013 04 08 4 0 0 1 0 2 3 1 1 0 0 0 1 0 0 0 0 0 3 0 0 1 1 1 1 1 1 2013 04 09 4 1 1 0 2 2 1 1 1 1 1 1 0 0 0 0 1 0 4 1 1 1 2 1 1 1 1 2013 04 10 5 1 1 1 1 2 2 1 2 3 0 1 1 2 1 0 1 1 5 1 1 1 1 1 1 1 2 2013 04 11 4 0 1 1 1 2 1 1 2 4 0 0 0 3 2 1 1 2 5 1 1 1 1 1 2 1 2 Solar Peak Levels peaked at 148 on the 10th of April 2013 04 04 129 119 820 1 -999 B3.1 1 0 0 0 0 0 0 2013 04 05 134 146 860 4 -999 B3.6 1 1 0 3 0 0 0 2013 04 06 137 117 880 0 -999 B4.2 8 0 0 10 0 0 0 2013 04 07 138 144 910 1 -999 B4.0 4 0 0 6 0 0 0 2013 04 08 139 162 1140 0 -999 B4.0 2 0 0 3 0 0 0 2013 04 09 147 116 960 0 -999 B6.4 8 0 0 8 0 0 0 2013 04 10 148 163 1080 2 -999 B7.0 8 0 0 10 0 0 0 2013 04 11 137 121 960 0 -999 B6.5 7 1 0 14 0 0 1
22
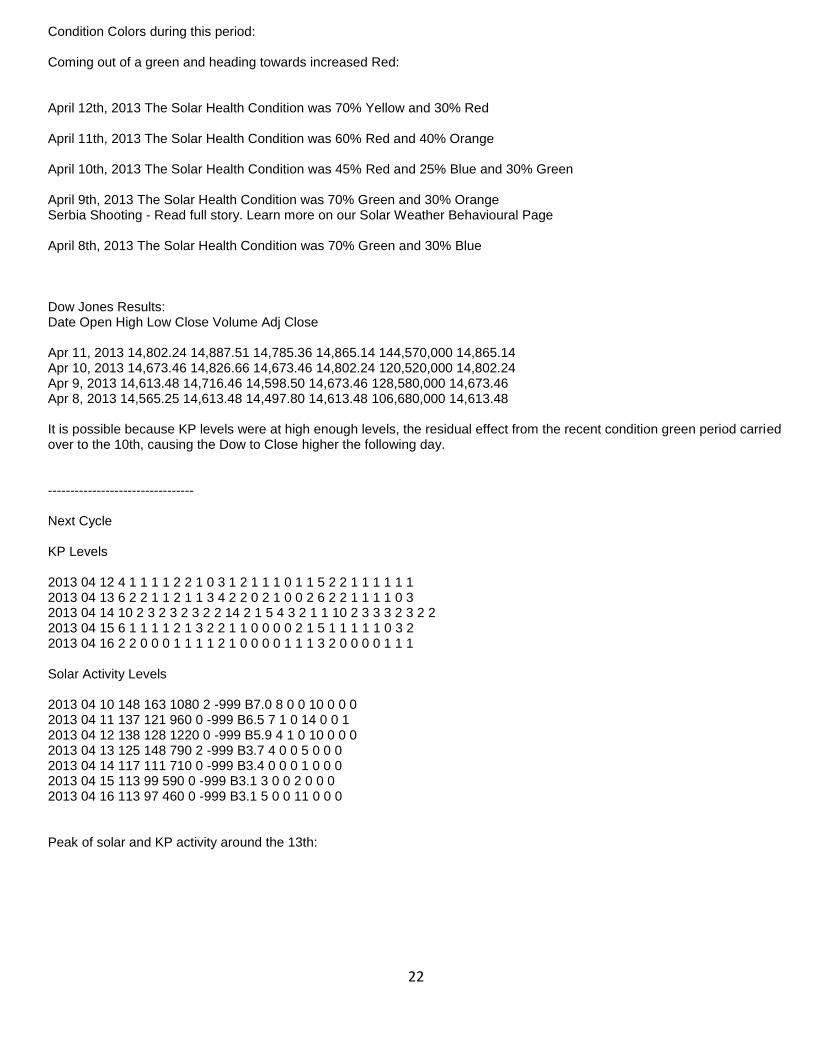
Condition Colors during this period: Coming out of a green and heading towards increased Red: April 12th, 2013 The Solar Health Condition was 70% Yellow and 30% Red April 11th, 2013 The Solar Health Condition was 60% Red and 40% Orange April 10th, 2013 The Solar Health Condition was 45% Red and 25% Blue and 30% Green April 9th, 2013 The Solar Health Condition was 70% Green and 30% Orange Serbia Shooting - Read full story. Learn more on our Solar Weather Behavioural Page April 8th, 2013 The Solar Health Condition was 70% Green and 30% Blue Dow Jones Results: Date Open High Low Close Volume Adj Close Apr 11, 2013 14,802.24 14,887.51 14,785.36 14,865.14 144,570,000 14,865.14 Apr 10, 2013 14,673.46 14,826.66 14,673.46 14,802.24 120,520,000 14,802.24 Apr 9, 2013 14,613.48 14,716.46 14,598.50 14,673.46 128,580,000 14,673.46 Apr 8, 2013 14,565.25 14,613.48 14,497.80 14,613.48 106,680,000 14,613.48 It is possible because KP levels were at high enough levels, the residual effect from the recent condition green period carried over to the 10th, causing the Dow to Close higher the following day. --------------------------------- Next Cycle KP Levels 2013 04 12 4 1 1 1 1 2 2 1 0 3 1 2 1 1 1 0 1 1 5 2 2 1 1 1 1 1 1 2013 04 13 6 2 2 1 1 2 1 1 3 4 2 2 0 2 1 0 0 2 6 2 2 1 1 1 1 0 3 2013 04 14 10 2 3 2 3 2 3 2 2 14 2 1 5 4 3 2 1 1 10 2 3 3 3 2 3 2 2 2013 04 15 6 1 1 1 1 2 1 3 2 2 1 1 0 0 0 0 2 1 5 1 1 1 1 1 0 3 2 2013 04 16 2 2 0 0 0 1 1 1 1 2 1 0 0 0 0 1 1 1 3 2 0 0 0 0 1 1 1 Solar Activity Levels 2013 04 10 148 163 1080 2 -999 B7.0 8 0 0 10 0 0 0 2013 04 11 137 121 960 0 -999 B6.5 7 1 0 14 0 0 1 2013 04 12 138 128 1220 0 -999 B5.9 4 1 0 10 0 0 0 2013 04 13 125 148 790 2 -999 B3.7 4 0 0 5 0 0 0 2013 04 14 117 111 710 0 -999 B3.4 0 0 0 1 0 0 0 2013 04 15 113 99 590 0 -999 B3.1 3 0 0 2 0 0 0 2013 04 16 113 97 460 0 -999 B3.1 5 0 0 11 0 0 0 Peak of solar and KP activity around the 13th:
23
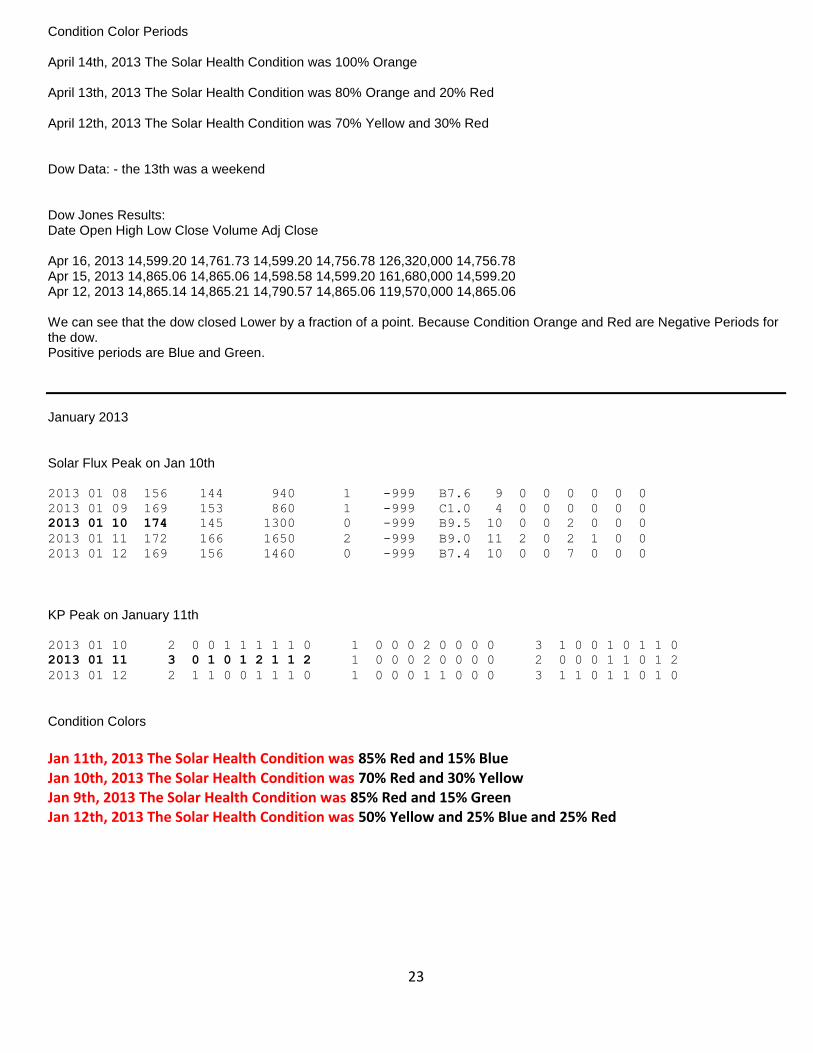
Condition Color Periods April 14th, 2013 The Solar Health Condition was 100% Orange April 13th, 2013 The Solar Health Condition was 80% Orange and 20% Red April 12th, 2013 The Solar Health Condition was 70% Yellow and 30% Red Dow Data: - the 13th was a weekend Dow Jones Results: Date Open High Low Close Volume Adj Close Apr 16, 2013 14,599.20 14,761.73 14,599.20 14,756.78 126,320,000 14,756.78 Apr 15, 2013 14,865.06 14,865.06 14,598.58 14,599.20 161,680,000 14,599.20 Apr 12, 2013 14,865.14 14,865.21 14,790.57 14,865.06 119,570,000 14,865.06 We can see that the dow closed Lower by a fraction of a point. Because Condition Orange and Red are Negative Periods for the dow. Positive periods are Blue and Green.
January 2013 Solar Flux Peak on Jan 10th 2013 01 08 156 144 940 1 -999 B7.6 9 0 0 0 0 0 0
2013 01 09 169 153 860 1 -999 C1.0 4 0 0 0 0 0 0
2013 01 10 174 145 1300 0 -999 B9.5 10 0 0 2 0 0 0
2013 01 11 172 166 1650 2 -999 B9.0 11 2 0 2 1 0 0
2013 01 12 169 156 1460 0 -999 B7.4 10 0 0 7 0 0 0
KP Peak on January 11th 2013 01 10 2 0 0 1 1 1 1 1 0 1 0 0 0 2 0 0 0 0 3 1 0 0 1 0 1 1 0
2013 01 11 3 0 1 0 1 2 1 1 2 1 0 0 0 2 0 0 0 0 2 0 0 0 1 1 0 1 2
2013 01 12 2 1 1 0 0 1 1 1 0 1 0 0 0 1 1 0 0 0 3 1 1 0 1 1 0 1 0
Condition Colors
Jan 11th, 2013 The Solar Health Condition was 85% Red and 15% Blue Jan 10th, 2013 The Solar Health Condition was 70% Red and 30% Yellow Jan 9th, 2013 The Solar Health Condition was 85% Red and 15% Green Jan 12th, 2013 The Solar Health Condition was 50% Yellow and 25% Blue and 25% Red
24
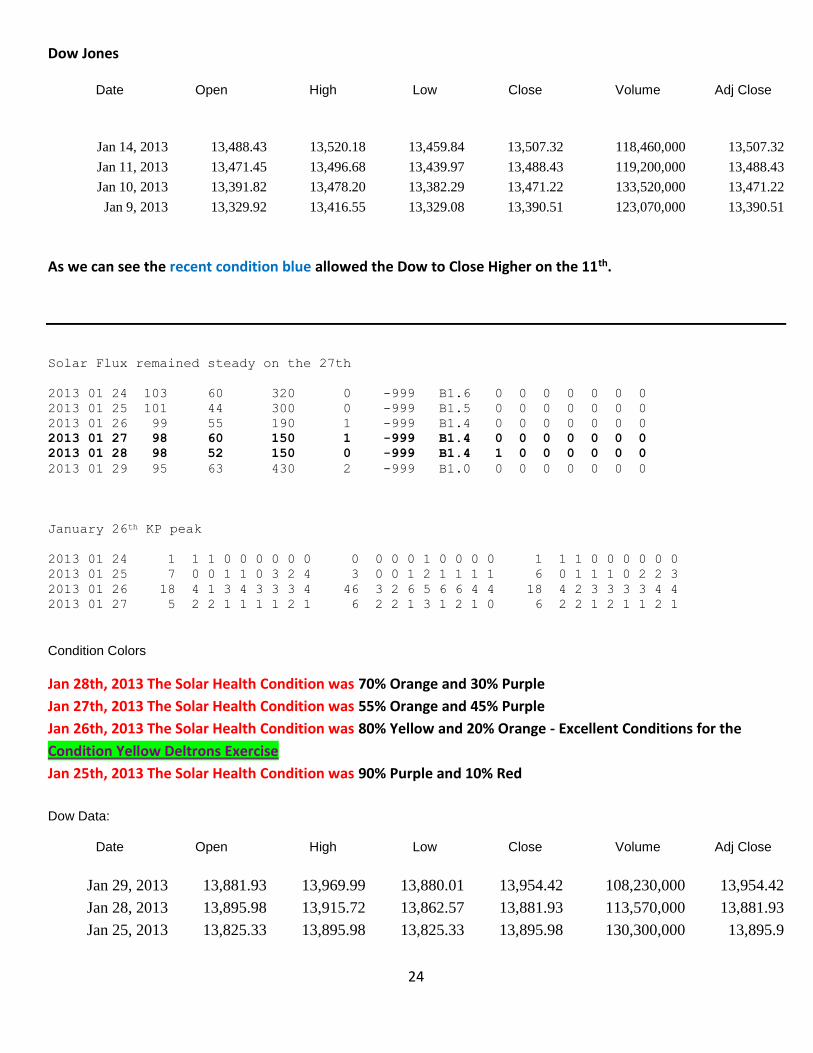
Dow Jones
Date Open High Low Close Volume Adj Close
Jan 14, 2013 13,488.43 13,520.18 13,459.84 13,507.32 118,460,000 13,507.32
Jan 11, 2013 13,471.45 13,496.68 13,439.97 13,488.43 119,200,000 13,488.43
Jan 10, 2013 13,391.82 13,478.20 13,382.29 13,471.22 133,520,000 13,471.22
Jan 9, 2013 13,329.92 13,416.55 13,329.08 13,390.51 123,070,000 13,390.51
As we can see the recent condition blue allowed the Dow to Close Higher on the 11th.
Solar Flux remained steady on the 27th
2013 01 24 103 60 320 0 -999 B1.6 0 0 0 0 0 0 0
2013 01 25 101 44 300 0 -999 B1.5 0 0 0 0 0 0 0
2013 01 26 99 55 190 1 -999 B1.4 0 0 0 0 0 0 0
2013 01 27 98 60 150 1 -999 B1.4 0 0 0 0 0 0 0
2013 01 28 98 52 150 0 -999 B1.4 1 0 0 0 0 0 0
2013 01 29 95 63 430 2 -999 B1.0 0 0 0 0 0 0 0
January 26th KP peak
2013 01 24 1 1 1 0 0 0 0 0 0 0 0 0 0 1 0 0 0 0 1 1 1 0 0 0 0 0 0
2013 01 25 7 0 0 1 1 0 3 2 4 3 0 0 1 2 1 1 1 1 6 0 1 1 1 0 2 2 3
2013 01 26 18 4 1 3 4 3 3 3 4 46 3 2 6 5 6 6 4 4 18 4 2 3 3 3 3 4 4
2013 01 27 5 2 2 1 1 1 1 2 1 6 2 2 1 3 1 2 1 0 6 2 2 1 2 1 1 2 1
Condition Colors
Jan 28th, 2013 The Solar Health Condition was 70% Orange and 30% Purple
Jan 27th, 2013 The Solar Health Condition was 55% Orange and 45% Purple
Jan 26th, 2013 The Solar Health Condition was 80% Yellow and 20% Orange - Excellent Conditions for the
Condition Yellow Deltrons Exercise
Jan 25th, 2013 The Solar Health Condition was 90% Purple and 10% Red
Dow Data:
Date Open High Low Close Volume Adj Close
Jan 29, 2013 13,881.93 13,969.99 13,880.01 13,954.42 108,230,000 13,954.42
Jan 28, 2013 13,895.98 13,915.72 13,862.57 13,881.93 113,570,000 13,881.93
Jan 25, 2013 13,825.33 13,895.98 13,825.33 13,895.98 130,300,000 13,895.9
25
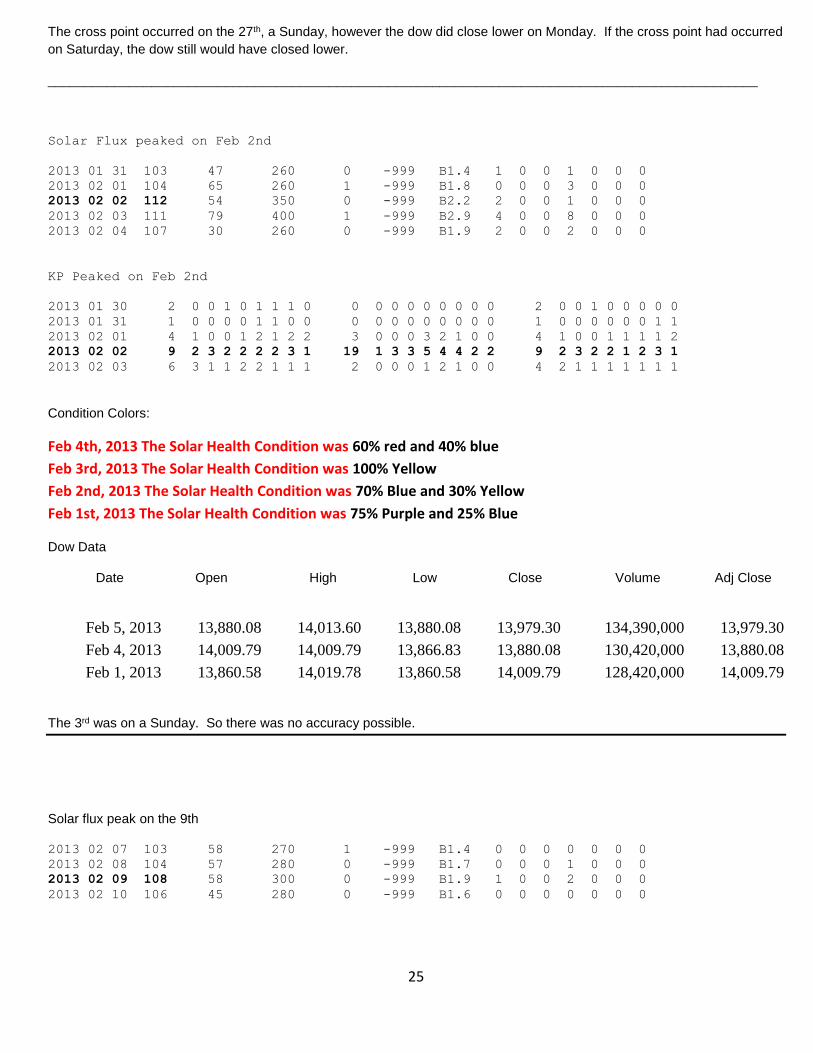
The cross point occurred on the 27th, a Sunday, however the dow did close lower on Monday. If the cross point had occurred
on Saturday, the dow still would have closed lower.
________________________________________________________________________________________________
Solar Flux peaked on Feb 2nd
2013 01 31 103 47 260 0 -999 B1.4 1 0 0 1 0 0 0
2013 02 01 104 65 260 1 -999 B1.8 0 0 0 3 0 0 0
2013 02 02 112 54 350 0 -999 B2.2 2 0 0 1 0 0 0
2013 02 03 111 79 400 1 -999 B2.9 4 0 0 8 0 0 0
2013 02 04 107 30 260 0 -999 B1.9 2 0 0 2 0 0 0
KP Peaked on Feb 2nd
2013 01 30 2 0 0 1 0 1 1 1 0 0 0 0 0 0 0 0 0 0 2 0 0 1 0 0 0 0 0
2013 01 31 1 0 0 0 0 1 1 0 0 0 0 0 0 0 0 0 0 0 1 0 0 0 0 0 0 1 1
2013 02 01 4 1 0 0 1 2 1 2 2 3 0 0 0 3 2 1 0 0 4 1 0 0 1 1 1 1 2
2013 02 02 9 2 3 2 2 2 2 3 1 19 1 3 3 5 4 4 2 2 9 2 3 2 2 1 2 3 1
2013 02 03 6 3 1 1 2 2 1 1 1 2 0 0 0 1 2 1 0 0 4 2 1 1 1 1 1 1 1
Condition Colors:
Feb 4th, 2013 The Solar Health Condition was 60% red and 40% blue
Feb 3rd, 2013 The Solar Health Condition was 100% Yellow
Feb 2nd, 2013 The Solar Health Condition was 70% Blue and 30% Yellow
Feb 1st, 2013 The Solar Health Condition was 75% Purple and 25% Blue
Dow Data
Date Open High Low Close Volume Adj Close
Feb 5, 2013 13,880.08 14,013.60 13,880.08 13,979.30 134,390,000 13,979.30
Feb 4, 2013 14,009.79 14,009.79 13,866.83 13,880.08 130,420,000 13,880.08
Feb 1, 2013 13,860.58 14,019.78 13,860.58 14,009.79 128,420,000 14,009.79
The 3rd was on a Sunday. So there was no accuracy possible.
Solar flux peak on the 9th
2013 02 07 103 58 270 1 -999 B1.4 0 0 0 0 0 0 0
2013 02 08 104 57 280 0 -999 B1.7 0 0 0 1 0 0 0
2013 02 09 108 58 300 0 -999 B1.9 1 0 0 2 0 0 0
2013 02 10 106 45 280 0 -999 B1.6 0 0 0 0 0 0 0
26
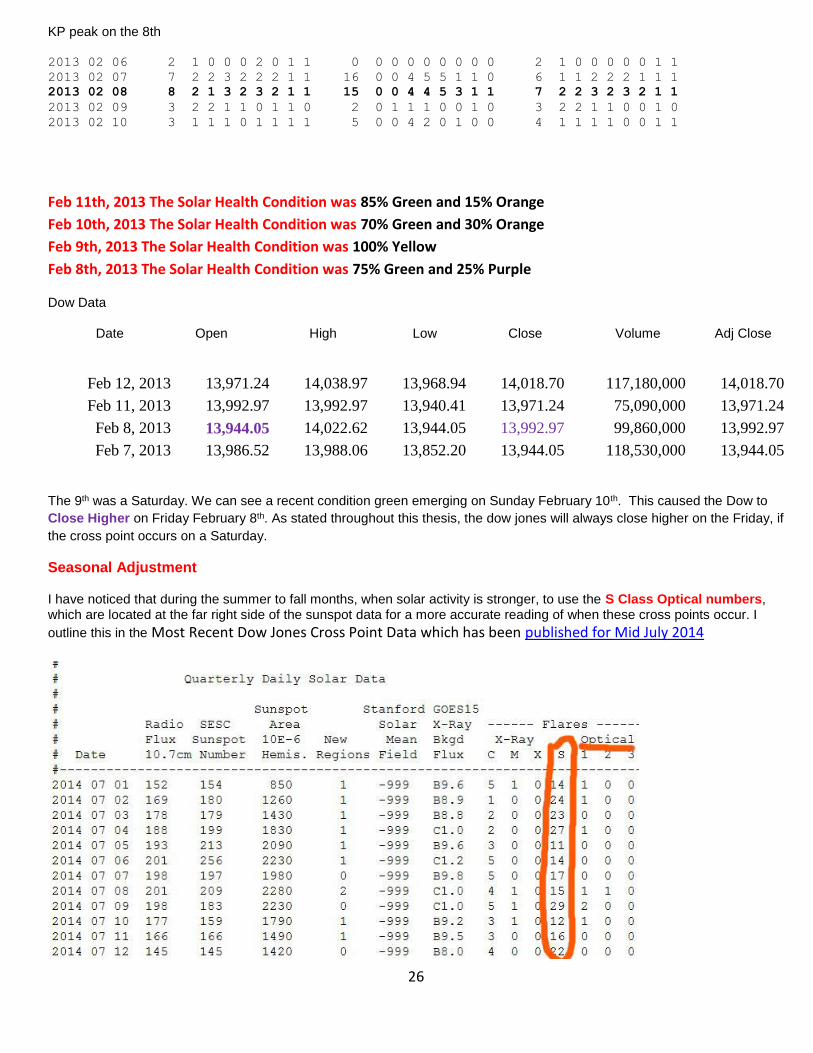
KP peak on the 8th
2013 02 06 2 1 0 0 0 2 0 1 1 0 0 0 0 0 0 0 0 0 2 1 0 0 0 0 0 1 1
2013 02 07 7 2 2 3 2 2 2 1 1 16 0 0 4 5 5 1 1 0 6 1 1 2 2 2 1 1 1
2013 02 08 8 2 1 3 2 3 2 1 1 15 0 0 4 4 5 3 1 1 7 2 2 3 2 3 2 1 1
2013 02 09 3 2 2 1 1 0 1 1 0 2 0 1 1 1 0 0 1 0 3 2 2 1 1 0 0 1 0
2013 02 10 3 1 1 1 0 1 1 1 1 5 0 0 4 2 0 1 0 0 4 1 1 1 1 0 0 1 1
Feb 11th, 2013 The Solar Health Condition was 85% Green and 15% Orange
Feb 10th, 2013 The Solar Health Condition was 70% Green and 30% Orange
Feb 9th, 2013 The Solar Health Condition was 100% Yellow
Feb 8th, 2013 The Solar Health Condition was 75% Green and 25% Purple
Dow Data
Date Open High Low Close Volume Adj Close
Feb 12, 2013 13,971.24 14,038.97 13,968.94 14,018.70 117,180,000 14,018.70
Feb 11, 2013 13,992.97 13,992.97 13,940.41 13,971.24 75,090,000 13,971.24
Feb 8, 2013 13,944.05 14,022.62 13,944.05 13,992.97 99,860,000 13,992.97
Feb 7, 2013 13,986.52 13,988.06 13,852.20 13,944.05 118,530,000 13,944.05
The 9th was a Saturday. We can see a recent condition green emerging on Sunday February 10th. This caused the Dow to
Close Higher on Friday February 8th. As stated throughout this thesis, the dow jones will always close higher on the Friday, if
the cross point occurs on a Saturday.
Seasonal Adjustment
I have noticed that during the summer to fall months, when solar activity is stronger, to use the S Class Optical numbers, which are located at the far right side of the sunspot data for a more accurate reading of when these cross points occur. I
outline this in the Most Recent Dow Jones Cross Point Data which has been published for Mid July 2014

27
.____________________________________________________________________________________________
Most Recent Dow Jones Cross Point Data published for Mid July 2014
28
Solar Eclipses And Its Effects on The Dow Jones Industrial Average Solar Eclipses are a Conjunction period of the Sun and Moon. Steve Puetz discovered that almost all of the largest stock market crashes in history have occurred around the time of a lunar eclipse. Edward R. Dewey, president of the Foundation for the Study of Cycles, discovered that the markets are affected by Postions of Merciry, Mars and Jupiter. Quote from Futuresmag.com "The DJIA makes a significant low as Saturn/Uranus approach the first exact conjunction (same zodiac sign and degree). The DJIA makes a new all-time high during the Saturn/Uranus opposition (180 degrees apart, in opposite signs of the zodiac). This high is not surpassed for several years. The DJIA ultimately surpasses the high made during the Saturn/Uranus opposition as the planets lead up to or are in the waning square (270 degrees apart by zodiac sign), which then leads to a significant bear market that begins the cycle over again at the next conjunction."
The 2Mev "Wave"
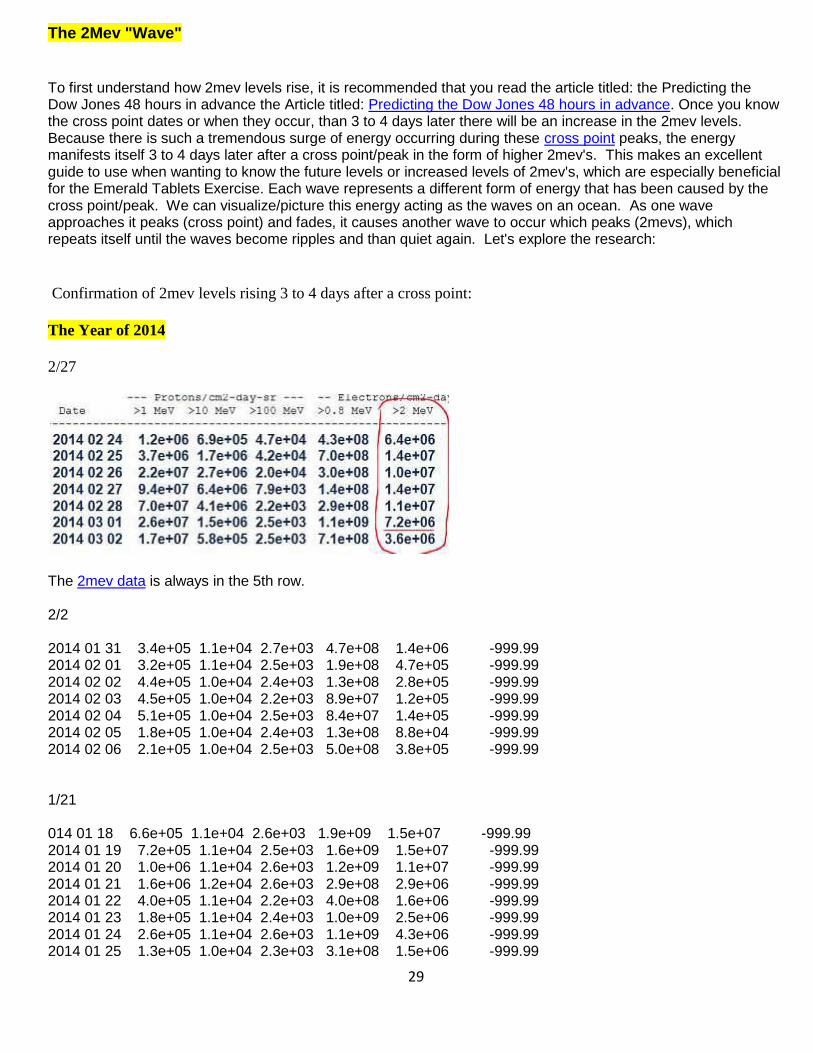
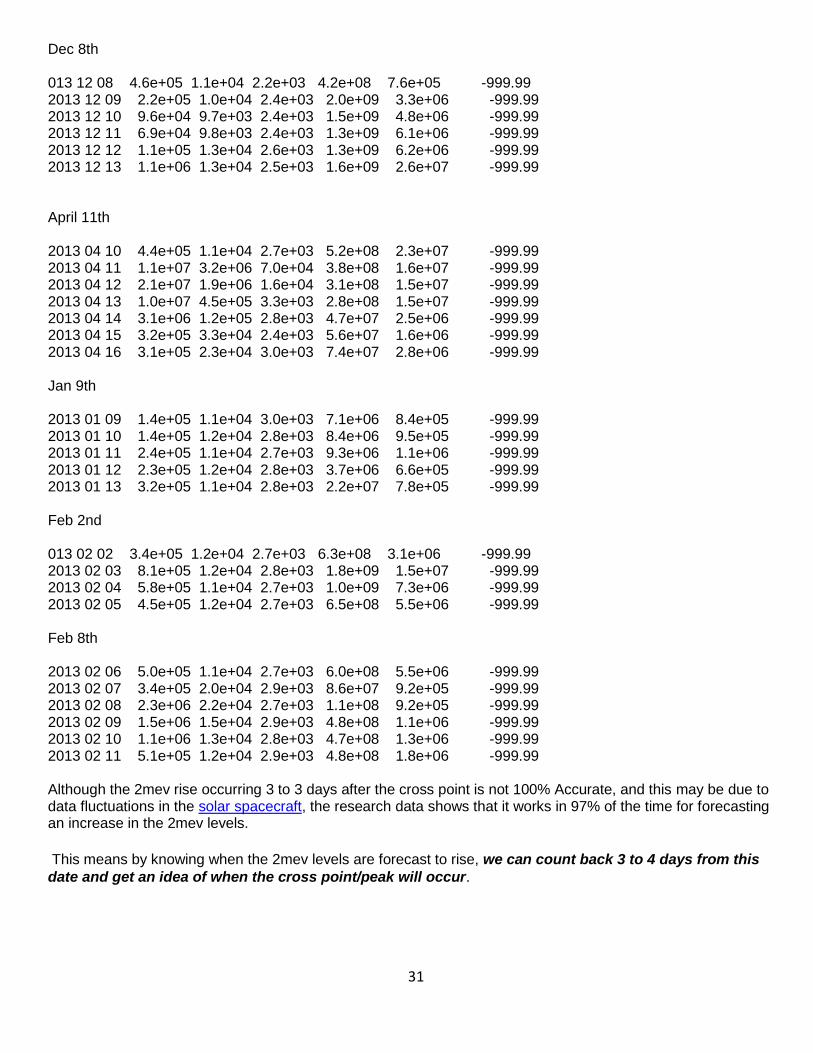
Because there is such a tremendous surge of energy occurring during these cross point peaks, the energy manifests itself 3 to 4 days later after a cross point/peak in the form of higher 2mev's. This makes an excellent guide to use when wanting to know the future levels or increased levels of 2mev's, which are especially beneficial for the Emerald Tablets Exercise. Each wave represents a different form of energy that has been caused by the cross point/peak. We can visualize/picture this energy acting as the waves on an ocean. As one wave approaches it peaks (cross point) and fades, it causes another wave to occur which peaks (2mevs), which repeats itself until the waves become ripples and then quiet again. Using the dates of the Cross points shown earlier in this article, let’s take a look at the 2mev levels 3 to 4 days after the cross point. Although the 2mev rise occurring 3 to 3 days after the cross point is not 100% Accurate, and this may be due to data fluctuations in the solar spacecraft, the research data shows that it works in 97% of the time for forecasting an increase in the 2mev levels.
Data Used:
Latest 2014 2mev levels courtesy of NOAA http://www.swpc.noaa.gov/ftpdir/latest/DPD.txt
2014 2mev data since January 2014 (Click on 2014Q1_DPD.txt at bottom of page) http://www.swpc.noaa.gov/ftpdir/indices/old_indices/2014Q1_DPD.txt
2013 Archive of 2013 2mev Data http://www.swpc.noaa.gov/ftpdir/indices/old_indices/2013_DPD.txt
29
The 2Mev "Wave"
To first understand how 2mev levels rise, it is recommended that you read the article titled: the Predicting the Dow Jones 48 hours in advance the Article titled: Predicting the Dow Jones 48 hours in advance. Once you know the cross point dates or when they occur, than 3 to 4 days later there will be an increase in the 2mev levels. Because there is such a tremendous surge of energy occurring during these cross point peaks, the energy manifests itself 3 to 4 days later after a cross point/peak in the form of higher 2mev's. This makes an excellent guide to use when wanting to know the future levels or increased levels of 2mev's, which are especially beneficial for the Emerald Tablets Exercise. Each wave represents a different form of energy that has been caused by the cross point/peak. We can visualize/picture this energy acting as the waves on an ocean. As one wave approaches it peaks (cross point) and fades, it causes another wave to occur which peaks (2mevs), which repeats itself until the waves become ripples and than quiet again. Let's explore the research:
Confirmation of 2mev levels rising 3 to 4 days after a cross point:
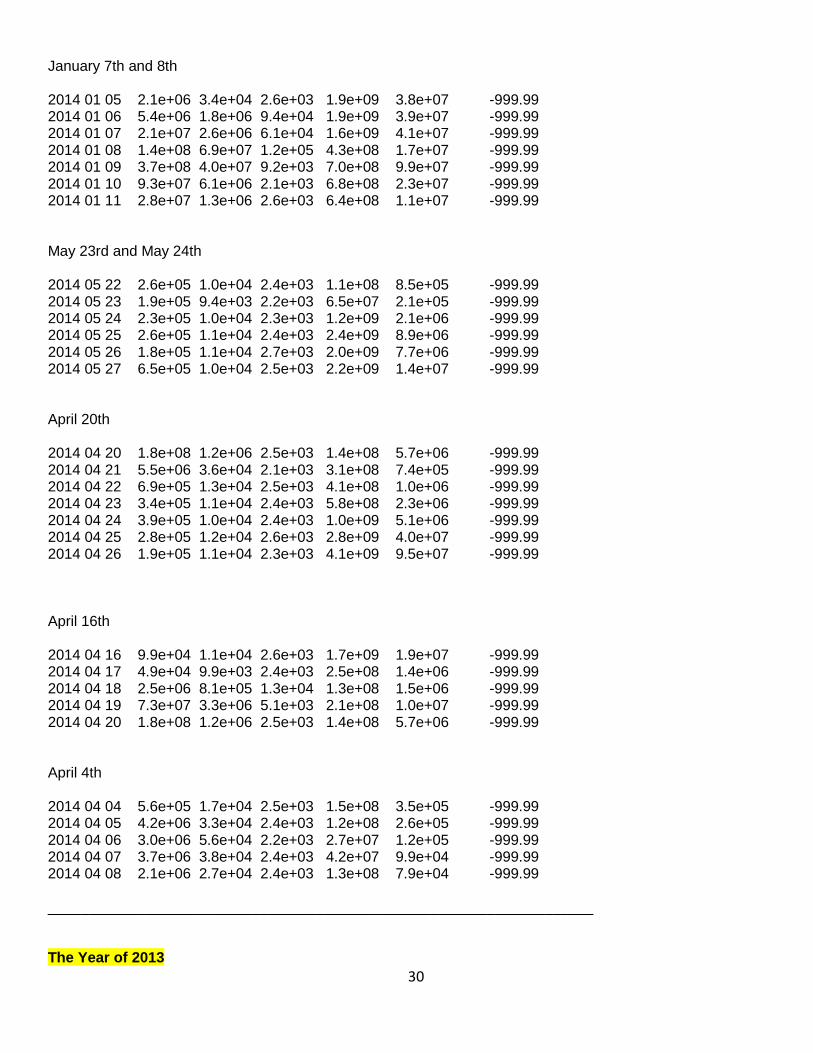
The Year of 2014
2/27
The 2mev data is always in the 5th row. 2/2 2014 01 31 3.4e+05 1.1e+04 2.7e+03 4.7e+08 1.4e+06 -999.99 2014 02 01 3.2e+05 1.1e+04 2.5e+03 1.9e+08 4.7e+05 -999.99 2014 02 02 4.4e+05 1.0e+04 2.4e+03 1.3e+08 2.8e+05 -999.99 2014 02 03 4.5e+05 1.0e+04 2.2e+03 8.9e+07 1.2e+05 -999.99 2014 02 04 5.1e+05 1.0e+04 2.5e+03 8.4e+07 1.4e+05 -999.99 2014 02 05 1.8e+05 1.0e+04 2.4e+03 1.3e+08 8.8e+04 -999.99 2014 02 06 2.1e+05 1.0e+04 2.5e+03 5.0e+08 3.8e+05 -999.99 1/21 014 01 18 6.6e+05 1.1e+04 2.6e+03 1.9e+09 1.5e+07 -999.99 2014 01 19 7.2e+05 1.1e+04 2.5e+03 1.6e+09 1.5e+07 -999.99 2014 01 20 1.0e+06 1.1e+04 2.6e+03 1.2e+09 1.1e+07 -999.99 2014 01 21 1.6e+06 1.2e+04 2.6e+03 2.9e+08 2.9e+06 -999.99 2014 01 22 4.0e+05 1.1e+04 2.2e+03 4.0e+08 1.6e+06 -999.99 2014 01 23 1.8e+05 1.1e+04 2.4e+03 1.0e+09 2.5e+06 -999.99 2014 01 24 2.6e+05 1.1e+04 2.6e+03 1.1e+09 4.3e+06 -999.99 2014 01 25 1.3e+05 1.0e+04 2.3e+03 3.1e+08 1.5e+06 -999.99
30
January 7th and 8th 2014 01 05 2.1e+06 3.4e+04 2.6e+03 1.9e+09 3.8e+07 -999.99 2014 01 06 5.4e+06 1.8e+06 9.4e+04 1.9e+09 3.9e+07 -999.99 2014 01 07 2.1e+07 2.6e+06 6.1e+04 1.6e+09 4.1e+07 -999.99 2014 01 08 1.4e+08 6.9e+07 1.2e+05 4.3e+08 1.7e+07 -999.99 2014 01 09 3.7e+08 4.0e+07 9.2e+03 7.0e+08 9.9e+07 -999.99 2014 01 10 9.3e+07 6.1e+06 2.1e+03 6.8e+08 2.3e+07 -999.99 2014 01 11 2.8e+07 1.3e+06 2.6e+03 6.4e+08 1.1e+07 -999.99 May 23rd and May 24th 2014 05 22 2.6e+05 1.0e+04 2.4e+03 1.1e+08 8.5e+05 -999.99 2014 05 23 1.9e+05 9.4e+03 2.2e+03 6.5e+07 2.1e+05 -999.99 2014 05 24 2.3e+05 1.0e+04 2.3e+03 1.2e+09 2.1e+06 -999.99 2014 05 25 2.6e+05 1.1e+04 2.4e+03 2.4e+09 8.9e+06 -999.99 2014 05 26 1.8e+05 1.1e+04 2.7e+03 2.0e+09 7.7e+06 -999.99 2014 05 27 6.5e+05 1.0e+04 2.5e+03 2.2e+09 1.4e+07 -999.99 April 20th 2014 04 20 1.8e+08 1.2e+06 2.5e+03 1.4e+08 5.7e+06 -999.99 2014 04 21 5.5e+06 3.6e+04 2.1e+03 3.1e+08 7.4e+05 -999.99 2014 04 22 6.9e+05 1.3e+04 2.5e+03 4.1e+08 1.0e+06 -999.99 2014 04 23 3.4e+05 1.1e+04 2.4e+03 5.8e+08 2.3e+06 -999.99 2014 04 24 3.9e+05 1.0e+04 2.4e+03 1.0e+09 5.1e+06 -999.99 2014 04 25 2.8e+05 1.2e+04 2.6e+03 2.8e+09 4.0e+07 -999.99 2014 04 26 1.9e+05 1.1e+04 2.3e+03 4.1e+09 9.5e+07 -999.99 April 16th 2014 04 16 9.9e+04 1.1e+04 2.6e+03 1.7e+09 1.9e+07 -999.99 2014 04 17 4.9e+04 9.9e+03 2.4e+03 2.5e+08 1.4e+06 -999.99 2014 04 18 2.5e+06 8.1e+05 1.3e+04 1.3e+08 1.5e+06 -999.99 2014 04 19 7.3e+07 3.3e+06 5.1e+03 2.1e+08 1.0e+07 -999.99 2014 04 20 1.8e+08 1.2e+06 2.5e+03 1.4e+08 5.7e+06 -999.99 April 4th 2014 04 04 5.6e+05 1.7e+04 2.5e+03 1.5e+08 3.5e+05 -999.99 2014 04 05 4.2e+06 3.3e+04 2.4e+03 1.2e+08 2.6e+05 -999.99 2014 04 06 3.0e+06 5.6e+04 2.2e+03 2.7e+07 1.2e+05 -999.99 2014 04 07 3.7e+06 3.8e+04 2.4e+03 4.2e+07 9.9e+04 -999.99 2014 04 08 2.1e+06 2.7e+04 2.4e+03 1.3e+08 7.9e+04 -999.99 ___________________________________________________________________ The Year of 2013
31
Dec 8th 013 12 08 4.6e+05 1.1e+04 2.2e+03 4.2e+08 7.6e+05 -999.99 2013 12 09 2.2e+05 1.0e+04 2.4e+03 2.0e+09 3.3e+06 -999.99 2013 12 10 9.6e+04 9.7e+03 2.4e+03 1.5e+09 4.8e+06 -999.99 2013 12 11 6.9e+04 9.8e+03 2.4e+03 1.3e+09 6.1e+06 -999.99 2013 12 12 1.1e+05 1.3e+04 2.6e+03 1.3e+09 6.2e+06 -999.99 2013 12 13 1.1e+06 1.3e+04 2.5e+03 1.6e+09 2.6e+07 -999.99 April 11th 2013 04 10 4.4e+05 1.1e+04 2.7e+03 5.2e+08 2.3e+07 -999.99 2013 04 11 1.1e+07 3.2e+06 7.0e+04 3.8e+08 1.6e+07 -999.99 2013 04 12 2.1e+07 1.9e+06 1.6e+04 3.1e+08 1.5e+07 -999.99 2013 04 13 1.0e+07 4.5e+05 3.3e+03 2.8e+08 1.5e+07 -999.99 2013 04 14 3.1e+06 1.2e+05 2.8e+03 4.7e+07 2.5e+06 -999.99 2013 04 15 3.2e+05 3.3e+04 2.4e+03 5.6e+07 1.6e+06 -999.99 2013 04 16 3.1e+05 2.3e+04 3.0e+03 7.4e+07 2.8e+06 -999.99 Jan 9th 2013 01 09 1.4e+05 1.1e+04 3.0e+03 7.1e+06 8.4e+05 -999.99 2013 01 10 1.4e+05 1.2e+04 2.8e+03 8.4e+06 9.5e+05 -999.99 2013 01 11 2.4e+05 1.1e+04 2.7e+03 9.3e+06 1.1e+06 -999.99 2013 01 12 2.3e+05 1.2e+04 2.8e+03 3.7e+06 6.6e+05 -999.99 2013 01 13 3.2e+05 1.1e+04 2.8e+03 2.2e+07 7.8e+05 -999.99 Feb 2nd 013 02 02 3.4e+05 1.2e+04 2.7e+03 6.3e+08 3.1e+06 -999.99 2013 02 03 8.1e+05 1.2e+04 2.8e+03 1.8e+09 1.5e+07 -999.99 2013 02 04 5.8e+05 1.1e+04 2.7e+03 1.0e+09 7.3e+06 -999.99 2013 02 05 4.5e+05 1.2e+04 2.7e+03 6.5e+08 5.5e+06 -999.99 Feb 8th 2013 02 06 5.0e+05 1.1e+04 2.7e+03 6.0e+08 5.5e+06 -999.99 2013 02 07 3.4e+05 2.0e+04 2.9e+03 8.6e+07 9.2e+05 -999.99 2013 02 08 2.3e+06 2.2e+04 2.7e+03 1.1e+08 9.2e+05 -999.99 2013 02 09 1.5e+06 1.5e+04 2.9e+03 4.8e+08 1.1e+06 -999.99 2013 02 10 1.1e+06 1.3e+04 2.8e+03 4.7e+08 1.3e+06 -999.99 2013 02 11 5.1e+05 1.2e+04 2.9e+03 4.8e+08 1.8e+06 -999.99 Although the 2mev rise occurring 3 to 3 days after the cross point is not 100% Accurate, and this may be due to data fluctuations in the solar spacecraft, the research data shows that it works in 97% of the time for forecasting an increase in the 2mev levels.
This means by knowing when the 2mev levels are forecast to rise, we can count back 3 to 4 days from this
date and get an idea of when the cross point/peak will occur.
32
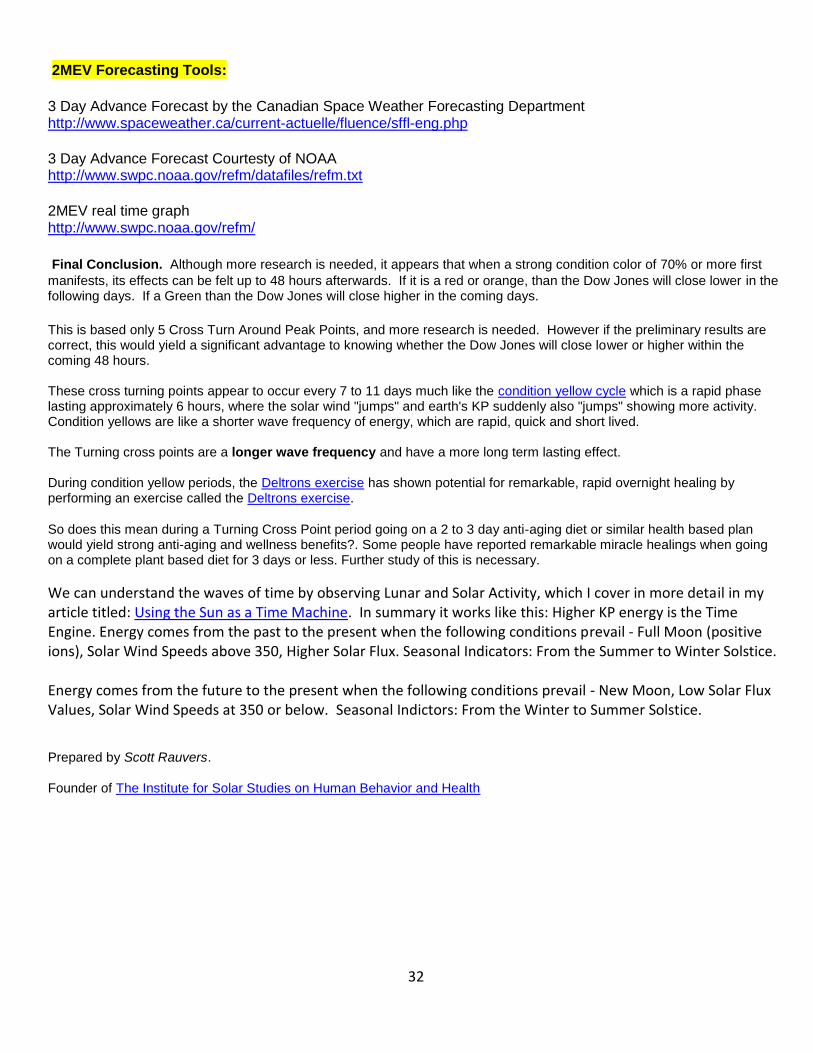
2MEV Forecasting Tools:
3 Day Advance Forecast by the Canadian Space Weather Forecasting Department http://www.spaceweather.ca/current-actuelle/fluence/sffl-eng.php
3 Day Advance Forecast Courtesty of NOAA http://www.swpc.noaa.gov/refm/datafiles/refm.txt
2MEV real time graph http://www.swpc.noaa.gov/refm/
Final Conclusion. Although more research is needed, it appears that when a strong condition color of 70% or more first
manifests, its effects can be felt up to 48 hours afterwards. If it is a red or orange, than the Dow Jones will close lower in the following days. If a Green than the Dow Jones will close higher in the coming days.
This is based only 5 Cross Turn Around Peak Points, and more research is needed. However if the preliminary results are correct, this would yield a significant advantage to knowing whether the Dow Jones will close lower or higher within the coming 48 hours. These cross turning points appear to occur every 7 to 11 days much like the condition yellow cycle which is a rapid phase lasting approximately 6 hours, where the solar wind "jumps" and earth's KP suddenly also "jumps" showing more activity. Condition yellows are like a shorter wave frequency of energy, which are rapid, quick and short lived. The Turning cross points are a longer wave frequency and have a more long term lasting effect. During condition yellow periods, the Deltrons exercise has shown potential for remarkable, rapid overnight healing by performing an exercise called the Deltrons exercise.
So does this mean during a Turning Cross Point period going on a 2 to 3 day anti-aging diet or similar health based plan would yield strong anti-aging and wellness benefits?. Some people have reported remarkable miracle healings when going on a complete plant based diet for 3 days or less. Further study of this is necessary.
We can understand the waves of time by observing Lunar and Solar Activity, which I cover in more detail in my article titled: Using the Sun as a Time Machine. In summary it works like this: Higher KP energy is the Time Engine. Energy comes from the past to the present when the following conditions prevail - Full Moon (positive ions), Solar Wind Speeds above 350, Higher Solar Flux. Seasonal Indicators: From the Summer to Winter Solstice. Energy comes from the future to the present when the following conditions prevail - New Moon, Low Solar Flux Values, Solar Wind Speeds at 350 or below. Seasonal Indictors: From the Winter to Summer Solstice. Prepared by Scott Rauvers. Founder of The Institute for Solar Studies on Human Behavior and Health

33
All research has now been summarized and made into a book: Wormhole Theories, Sunspot Activity and Remote
Viewing Stocks View Book Chapters
Read the first 3 Chapters Free