Algorithmic Trading Session 6 Trade Signal Generation IV...
20
Algorithmic Trading Session 6 Trade Signal Generation IV Momentum Strategies Oliver Steinki, CFA, FRM
Transcript of Algorithmic Trading Session 6 Trade Signal Generation IV...
Algorithmic Trading
Session 6
Trade Signal Generation IV
Momentum Strategies
Oliver Steinki, CFA, FRM
Outline
Introduction
What is Momentum?
Tests to Discover Momentum
Interday Momentum Strategies
Intraday Momentum Strategies
Summary and Questions
Sources
2Contact Details: [email protected] or +41 76 228 2794
3
IntroductionWhere Do We Stand in the Algo Prop Trading Framework?
DECIDE WHEN AND
HOW TO TRADE
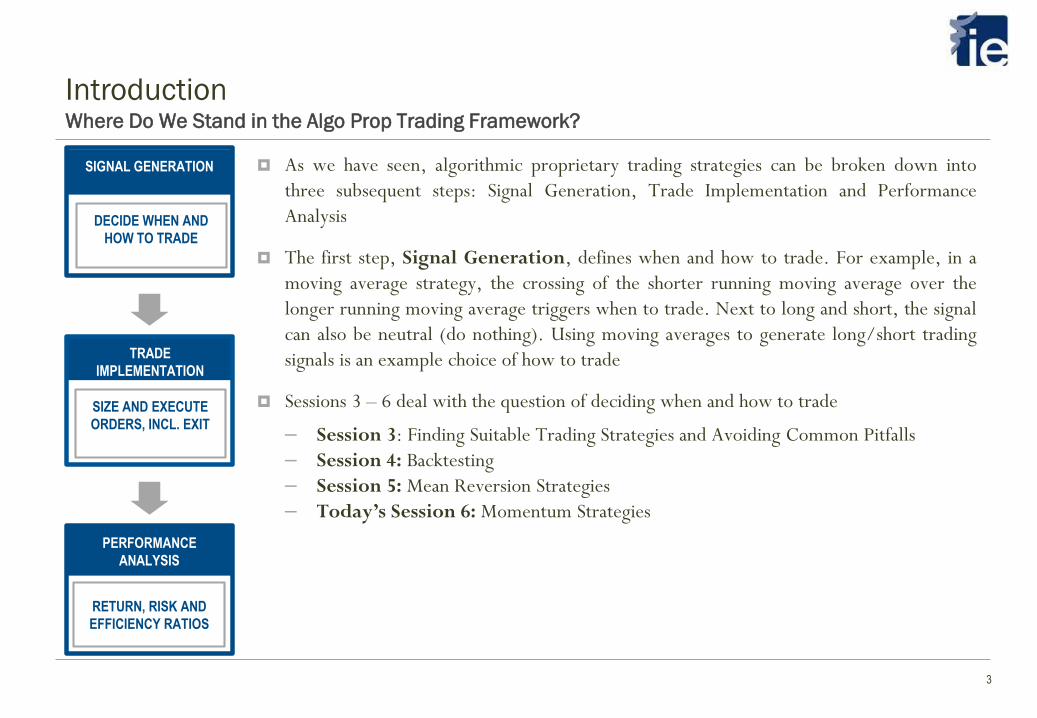
SIGNAL GENERATION As we have seen, algorithmic proprietary trading strategies can be broken down into
three subsequent steps: Signal Generation, Trade Implementation and Performance
Analysis
The first step, Signal Generation, defines when and how to trade. For example, in a
moving average strategy, the crossing of the shorter running moving average over the
longer running moving average triggers when to trade. Next to long and short, the signal
can also be neutral (do nothing). Using moving averages to generate long/short trading
signals is an example choice of how to trade
Sessions 3 – 6 deal with the question of deciding when and how to trade
– Session 3: Finding Suitable Trading Strategies and Avoiding Common Pitfalls
– Session 4: Backtesting
– Session 5: Mean Reversion Strategies
– Today’s Session 6: Momentum Strategies
PERFORMANCE
ANALYSIS
RETURN, RISK AND
EFFICIENCY RATIOS
TRADE
IMPLEMENTATION
SIZE AND EXECUTE
ORDERS, INCL. EXIT
4
Trading strategies can be profitable only if securities prices are either mean-reverting or trending.
Otherwise, they are random walking, and trading will be futile. If you believe that prices are mean reverting and
that they are currently low relative to some reference price, you should buy now and plan to sell higher later.
However, if you believe the prices are trending and that they are currently low, you should (short) sell now and plan
to buy at an even lower price later.The opposite is true if you believe prices are high
Academic research has indicated that stock prices are on average very close to random walking. However,
this does not mean that under certain special conditions, they cannot exhibit some degree of mean reversion or
trending behaviour. Furthermore, at any given time, stock prices can be both mean reverting and trending
depending on the time horizon you are interested in. Constructing a trading strategy is essentially a matter of
determining if the prices under certain conditions and for a certain time horizon will be mean reverting or
trending, and what the initial reference price should be at any given time
IntroductionMean Reversion vs. Momentum
5
MomentumWhat is Momentum?
We will separate between interday and intraday momentum strategies
There are four main causes of momentum:
For futures, the persistence of roll returns, especially of their signs
The slow diffusion, analysis and acceptance of new information
The forced sales or purchases of assets of various fund types
Market manipulation by high frequency traders
Academics sometimes classify momentum in asset prices into two types: time series momentum and cross-
sectional momentum. Time series momentum is very simple and intuitive: past returns of a price series are
positively correlated with future returns. Cross-sectional momentum refers to the relative performance of a price
series in relation to other price series: a price series with returns that outperformed other price series will likely
keep doing so in the future and vice versa
6
Momentum TestsHow Can We Discover Momentum?
Time series momentum of a price series means that past returns are positively correlated with future returns. It
follows that we can just calculate the correlation coefficient of the returns together with its p-value
One feature of computing the correlation coefficient is that we have to pick a specific time lag for the returns.
Sometimes, the most positive correlations are between returns of different lags. For example, 1-day returns might
show negative correlations, while the correlation between past 20-day return with the future 40-day return might
be very positive. We should find the optimal pair of past and future periods that gives the highest positive
correlation and use that as our look-back and holding period for our momentum strategy
Alternatively, we can also test for the correlations between the signs of past and future returns. This is appropriate
when all we want to know is that an up move will be followed by another up move, and we don’t care whether the
magnitudes of the moves are similar
If we are interested instead in finding out whether there is long-term trending behaviour in the time series without
regard to specific time frames, we can calculate the Hurst exponent together with the Variance Ratio test to rule
out the null hypothesis of a random walk
7
Momentum TestsAugmented Dickey Fuller Test
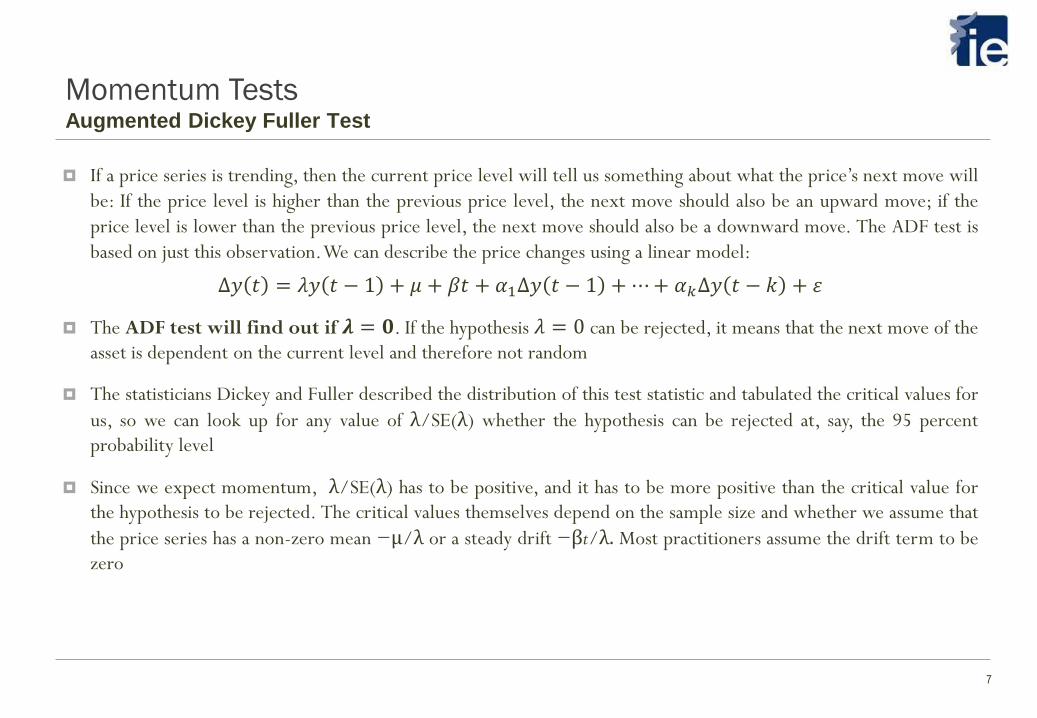
If a price series is trending, then the current price level will tell us something about what the price’s next move will
be: If the price level is higher than the previous price level, the next move should also be an upward move; if the
price level is lower than the previous price level, the next move should also be a downward move. The ADF test is
based on just this observation.We can describe the price changes using a linear model:
∆𝑦 𝑡 = 𝜆𝑦 𝑡 − 1 + 𝜇 + 𝛽𝑡 + 𝛼1Δ𝑦 𝑡 − 1 + ⋯+ 𝛼𝑘Δ𝑦 𝑡 − 𝑘 + 𝜀
The ADF test will find out if 𝝀 = 𝟎. If the hypothesis 𝜆 = 0 can be rejected, it means that the next move of the
asset is dependent on the current level and therefore not random
The statisticians Dickey and Fuller described the distribution of this test statistic and tabulated the critical values for
us, so we can look up for any value of λ/SE(λ) whether the hypothesis can be rejected at, say, the 95 percent
probability level
Since we expect momentum, λ/SE(λ) has to be positive, and it has to be more positive than the critical value for
the hypothesis to be rejected. The critical values themselves depend on the sample size and whether we assume that
the price series has a non-zero mean −μ/λ or a steady drift −βt/λ. Most practitioners assume the drift term to be
zero

8
Momentum TestsHurst Exponent
Intuitively speaking, a trending price series means that the prices diffuse from its initial value faster than a geometric
random walk would. Mathematically, we can determine the nature of the price series by measuring this speed of
diffusion.The speed of diffusion can be characterized by the variance
𝑉𝑎𝑟 𝜏 = 𝑧 𝑡 + 𝜏 − 𝑧(𝑡) 2
where z is the log prices (z = log(y)), 𝜏 is an arbitrary time lag, and … an average over all 𝑡. For a geometric
random walk, we know that
𝑧 𝑡 + 𝜏 − 𝑧(𝑡) 2 ~ 𝜏
The ∼ means that this relationship turns into an equality with some proportionality constant for large 𝜏, but it
may deviate from a straight line for small 𝜏. But if the (log) price series is mean reverting or trending (i.e., has
positive correlations between sequential price moves), the last equation won’t hold. Instead, we can write:
𝑧 𝑡 + 𝜏 − 𝑧(𝑡) 2 ~ 𝜏2𝐻
This is the definition of the Hurst exponent H. For a price series exhibiting geometric random walk, H = 0.5. But
for a mean-reverting series, H < 0.5, and for a trending series, H > 0.5. As H decreases toward zero, the price
series is more mean reverting, and as H increases toward 1, the price series is increasingly trending; thus, H serves
also as an indicator for the degree of mean reversion or trendiness
9
Momentum TestsVariance Ratio Test
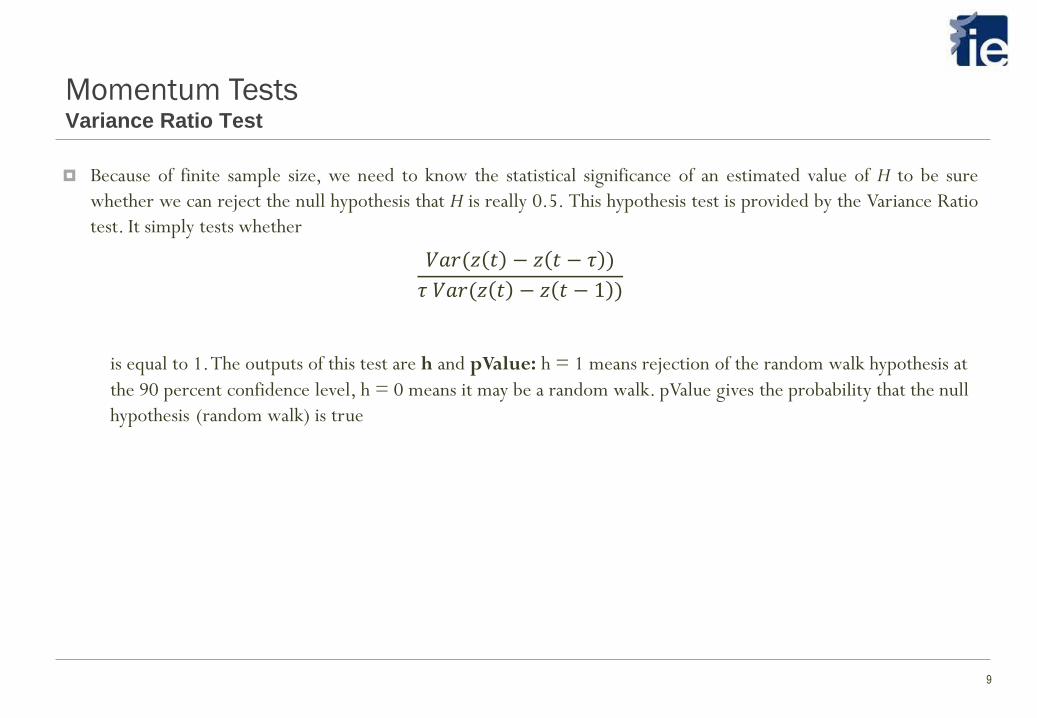
Because of finite sample size, we need to know the statistical significance of an estimated value of H to be sure
whether we can reject the null hypothesis that H is really 0.5. This hypothesis test is provided by the Variance Ratio
test. It simply tests whether
𝑉𝑎𝑟(𝑧 𝑡 − 𝑧 𝑡 − 𝜏 )
𝜏 𝑉𝑎𝑟(𝑧 𝑡 − 𝑧 𝑡 − 1 )
is equal to 1. The outputs of this test are h and pValue: h = 1 means rejection of the random walk hypothesis at
the 90 percent confidence level, h = 0 means it may be a random walk. pValue gives the probability that the null
hypothesis (random walk) is true

10
Interday Momentum StrategiesTime Series Strategies
For a certain future, if we find that the correlation coefficient between a past return of a certain look-back and a
future return of a certain holding period is high, and the p-value is small, we can proceed to see if a profitable
momentum strategy can be found using this set of optimal time periods
Why do many futures returns exhibit serial correlations? And why do these serial correlations occur only at a fairly
long time scale?The explanation often lies in the roll return component of the total return of futures
Example 6.1 (fileTU_mom) results in the following return profile btw. June 1, 2004 and May 11, 2012:
Ann. Return: 1.7%
Sharpe: 1
Max DD: 2.5%
0 100 200 300 400 500 600 700 800 900-0.01
0
0.01
0.02
0.03
0.04
0.05

11
Interday Momentum StrategiesExtracting Roll Returns
A Futures’ total return is composed of spot return + roll return
If the roll return is negative (contango future curve), buy the underlying asset and short the futures
If the roll return is positive (backwardation future curve), short the underlying asset and buy the futures
This will work as long as the sign of the roll return does not change quickly
However, the logistics of buying and especially shorting the underlying asset is not simple, unless an exchange-
traded fund (ETF) exists that holds the asset

12
Interday Momentum StrategiesNews Sentiment as a Fundamental Factor
With the advent of machine-readable, or “elementized,” newsfeeds, it is now possible to programmatically capture
all the news items on a company, not just those that fit neatly into one of the narrow categories such as earnings
announcements or merger and acquisition activities
Natural language processing algorithms are now advanced enough to analyse the textual information contained in
these news items, and assign a “sentiment score” to each news article that is indicative of its price impact on a stock
The success of these strategies also demonstrates very neatly that the slow diffusion of news is one cause of
momentum
13
Interday Momentum StrategiesMutual Funds Asset Fire Sale and Forced Purchases
Mutual funds experiencing large redemptions are likely to reduce or eliminate their existing stock positions. This is
no surprise since mutual funds are typically close to fully invested, with very little cash reserves
Also, funds experiencing large capital inflows tend to increase their existing positions rather than using the
additional capital to invest in other assets, perhaps because new investment ideas do not come by easily
Assets disproportionately held by poorly performing mutual funds facing redemptions therefore experience
negative returns. Furthermore, this asset “fire sale” by poorly performing mutual funds is contagious
Hence, momentum in both directions for the commonly held assets can be exploited
14
Interday Momentum StrategiesSummary
Futures exhibit time series momentum mainly because of the persistence of the sign of roll returns
If you are able to find an instrument (e.g., an ETF or another future) that cointegrates or correlates with the spot
price or return of a commodity, you can extract the roll return of the commodity future by shorting that
instrument during backwardation, or buying that instrument during contango
Profitable strategies on news sentiment momentum show that the slow diffusion of news is one cause for stock
price momentum
The contagion of forced asset sales and purchases among mutual funds contributes to stock price momentum

15
Intraday Momentum StrategiesOpening Gap Strategy
Gap measures the difference in opening price relative to last closing price. For example a stock closing on Friday at
USD 100 and reopening on Monday at USD 95 has an opening gap of -5 USD
What’s special about the overnight or weekend gap that sometimes triggers momentum? The extended period
without any trading means that the opening price is often quite different from the closing price
Hence stop orders set at different prices may get triggered all at once at the open. The execution of these stop
orders often leads to momentum because a cascading effect may trigger stop orders placed further away from the
open price as well
Also, the gap could result from significant events that occurred overnight

16
Intraday Momentum StrategiesNews Driven Momentum Strategy
As momentum is driven by the relatively slow diffusion of news, one can benefit from the first few days, hours, or
even seconds after a newsworthy event. For example, ECB press conferences are aired with 15sec. delay and only
subscribers of special services can see it live to profit from any significant announcements
Earnings announcements are another example of news driven intraday momentum. It is surprising that it still
persists, although the duration of the drift has shortened
Earnings guidance, analyst ratings and recommendation changes on a stock specific level as well as macroeconomic
indicators such as housing and unemployment numbers, consumer confidence or purchasing manager indices are
other examples of momentum creating news
17
Intraday Momentum StrategiesIndex Composition and Leveraged ETFs
Rebalancings of major indices results in intraday momentum due to ETF trading activity to mirror these changes in
index composition. For example, if a stock joins the MSCI World index, all ETFs as well as funds benchmarked to
this index have to buy this stock. This momentum usually last only for a few hours on the announcement as well as
the implementation date as there are now quite some players trying to anticipate and frontrun index composition
changes
The sponsors (issuers) of leveraged ETFs experience a similar issue which can create momentum. Let’s assume
there is a three times leveraged ETF mirroring a basket of stocks. If a constituent stocks goes up, the ETF sponsor
has to buy it to hold the leverage ratio constant

18
Intraday Momentum StrategiesSummary
“Breakout” momentum strategies involve a price exceeding a trading range. The opening gap strategy is a breakout
strategy that works for some futures and currencies. Breakout momentum may be caused by the triggering of stop
orders
Many kinds of corporate and macroeconomic news induce short-term price momentum
Index composition changes induce momentum in stocks that are added to or deleted from the index
Rebalancing of leveraged ETFs near the market close causes momentum in the underlying index in the same
direction as the market return from the previous close

Summary and Questions
19Contact Details: [email protected] or +41 76 228 2794
Time-series momentum refers to the positive correlation of a price series’ past and future returns
Cross-sectional momentum refers to the positive correlation of a price series’ past and future relative returns, in
relation to that of other price series in a portfolio
Lagged correlation of prices or returns, the ADF test, the Hurst exponent and Variance Ratio test can be used to
test for momentum
Different strategies apply to inter and intraday techniques. More and more sophisticated traders result in a reduced
time to exploit the momentum created by significant news, e.g. the speed of news diffusion is increasing
Questions?

Sources
20
Quantitative Trading: How to Build Your Own Algorithmic Trading Business by Ernest Chan
Algorithmic Trading: Winning Strategies and Their Rationale by Ernest Chan
The Mathematics of Money Management: Risk Analysis Techniques for Traders by Ralph Vince
Contact Details: [email protected] or +41 76 228 2794