ALASKA’S ECONOMIC REPORT _ECON_Q2.pdf · Q1 Q1Q1 Q2 Q2 Q1 Q2 Q3 Q4 0.7 Alaska Air Cargo...
22
ALASKA’S ECONOMIC REPORT SECOND QUARTER, 2017
Transcript of ALASKA’S ECONOMIC REPORT _ECON_Q2.pdf · Q1 Q1Q1 Q2 Q2 Q1 Q2 Q3 Q4 0.7 Alaska Air Cargo...
ALASKA’S ECONOMIC REPORTSECOND QUARTER, 2017

2
The State of Alaska Department of Commerce, Community, and Economic Development’s Division of Economic Development (DED) compiles this quarterly report to assist in the assessment of Alaska’s economic health and business climate.
Legacy economic trends like energy prices and overall cost of living are examined alongside emerging rural and urban trends, allowing for a comprehensive assessment of Alaska’s regional economic landscape. The data used in this report is statistical information from state, federal, and private sector resources, combined with anecdotal information collected from regional economic development and community organizations throughout the state. The combination of this data allows for a unique, realistic look at the economic drivers of Alaska’s economy from a statewide and regional perspective.
KEY FINDINGSCommodity Prices: Oil prices moved slightly downward this quarter, while natural gas and coal prices remained relatively flat. Zinc prices dipped down this quarter after a yearlong price rally peak in February 2017. Silver prices dropped in the second quarter, while gold and copper prices remained relatively flat. Salmon prices edged upward through April 2017; data for the second quarter is not yet available.
Consumer Prices: According to a quarterly community price comparison that DED compiles, average prices for four consumer goods (bread, milk, eggs, and gas) in the ten communities surveyed decreased slightly between the first and second quarters of 2017. The statewide monthly average for the community price comparison fell from $15.03 in March 2017 to $14.81 in June 2017.
Employment: Alaska had the highest unemployment rate in the country in June, with a rate of 6.8 percent. The state unemployment rate has remained relatively stable in the last five years, hovering between 6.5 percent and 7 percent. Meanwhile, the national unemployment rate continued to fall and reached 4.4 percent in the second quarter.
Freight and Cargo Transportation: Maritime cargo and railroad freight volumes continued to decline in the second quarter of 2017, while air cargo throughput at the Anchorage and Fairbanks airports saw a large increase. Compared to all other quarters of available air cargo data, the two airports recorded their second highest volume of cargo this quarter.
INTRODUCTION

3
EXPORT AND IMPORT VALUESWhen comparing the first and second quarters over the past five years, exports in 2017 are slightly higher than in the same period in 2016, but much lower than previous years. International exports from Alaska consist mostly of raw materials. The largest categories of exports by value are fish and fish products, zinc and other metal ores, and crude oil.
Alaska International Exports of Goods (Yearly, Second Quarter Only, Millions of Dollars)
Source: U.S. Census Bureau
$1,800
$1,600
$1,400
$1,200
$1,000
$800
$600
$400
$200
$0
2013 Q1-Q2 2014 Q1-Q2 2015 Q1-Q2 2016 Q1-Q2 2017 Q1-Q2
$1,249.90
$126.40
$1,212.37
$201.95
$1,398.80
$212.90
$1,467.80
$147.40
$1,472.36
$195.03
Manufactured commodities make up 87 percent of imports to the state. Refined fuels drive international imports to Alaska, and in the second quarter of the year made up almost 40 percent of all imports. Other large categories of imports are machinery and industrial equipment.
Alaska Imports of Goods (Yearly, Second Quarter Only, Millions of Dollars)
$1,600
$1,400
$1,200
$1,000
$800
$600
$400
$200
$0
$152.70
$500.40
$231.20
$545.40
$142.80
$1,269.90
$235
$829.40
$105.83
$715.16
Non-Manufactured Commodities
Manufactured Commodities
Non-Manufactured Commodities
Manufactured Commodities
Source: U.S. Census Bureau
2013 Q1-Q2 2014 Q1-Q2 2015 Q1-Q2 2016 Q1-Q2 2017 Q1-Q2
4
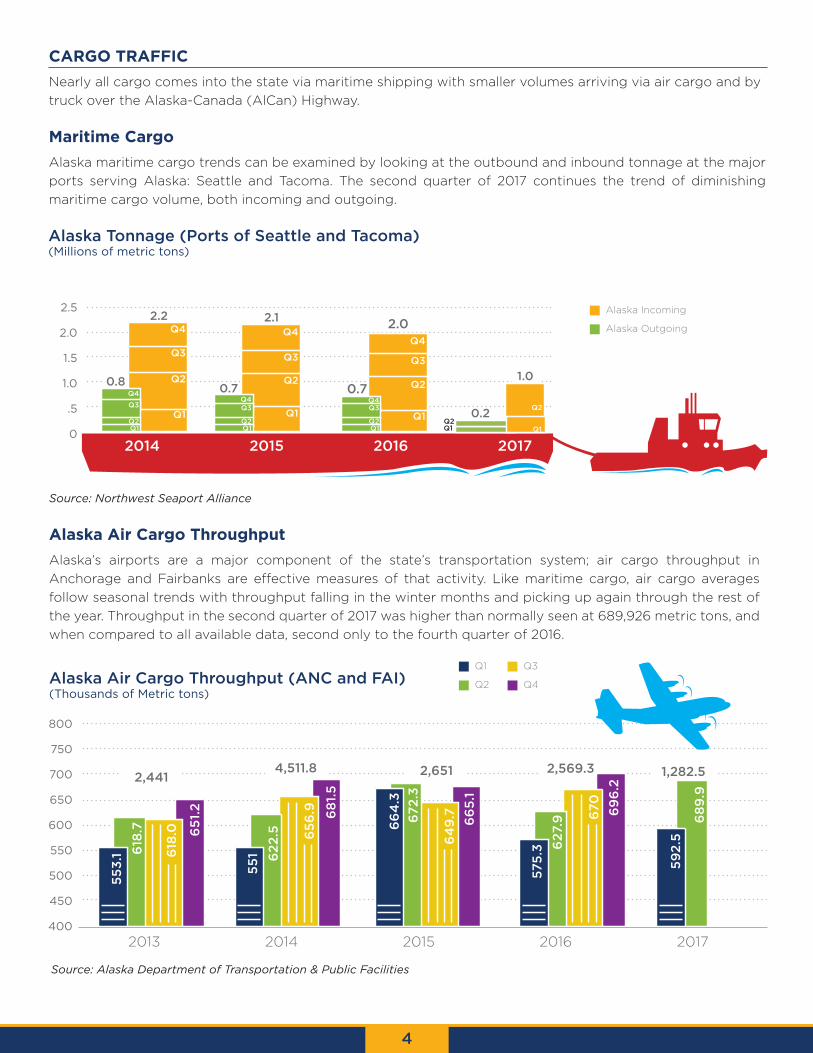
CARGO TRAFFICNearly all cargo comes into the state via maritime shipping with smaller volumes arriving via air cargo and by truck over the Alaska-Canada (AlCan) Highway.
Maritime Cargo Alaska maritime cargo trends can be examined by looking at the outbound and inbound tonnage at the major ports serving Alaska: Seattle and Tacoma. The second quarter of 2017 continues the trend of diminishing maritime cargo volume, both incoming and outgoing.
Alaska Tonnage (Ports of Seattle and Tacoma)(Millions of metric tons)
Alaska Incoming
Alaska Outgoing
Q1
Q2
Q3
Q4
Source: Northwest Seaport Alliance
2014 2015 2016 2017
2.5
2.0
1.5
1.0
.5
0
2.02.12.2
0.2
0.71.00.8
Q1Q1Q1
Q2Q2
Q3Q3
Q4Q4
Q3Q4
Q3Q3Q4
Q4
Q2Q2Q2Q1Q1 Q1Q1
Q2
Q2Q1
Q2
Q3
Q4
0.7
Alaska Air Cargo Throughput Alaska’s airports are a major component of the state’s transportation system; air cargo throughput in Anchorage and Fairbanks are effective measures of that activity. Like maritime cargo, air cargo averages follow seasonal trends with throughput falling in the winter months and picking up again through the rest of the year. Throughput in the second quarter of 2017 was higher than normally seen at 689,926 metric tons, and when compared to all available data, second only to the fourth quarter of 2016.
Alaska Air Cargo Throughput (ANC and FAI)(Thousands of Metric tons)
Source: Alaska Department of Transportation & Public Facilities
2013 2014 2015 2016 2017
2,569.3 1,282.52,441
651
.2
618
.0
618
.755
3.1
4,511.8
681
.5
656
.9
622
.555
1
2,651
800
750
700
650
600
550
500
450
400
66
5.1
64
9.767
2.3
66
4.3
69
6.2
670
627
.957
5.3
592.
5
689
.9

5
Alaska Railroad Passenger Volume(Thousands of passengers)
ALASKA RAILROAD STATISTICS
The Alaska Railroad’s passenger numbers show a distinct seasonal variation. The majority of railroad passengers travel during the summer visitor season that spans quarters two and three. With 165,624 passengers, the 2017 second quarter passenger volume was slightly higher than the same quarter in 2016.
350
300
250
200
150
100
50
0
2013 2014 2015 2016 2017
489,682 468,661
Q1
Q2
Q3
Q4 Q1
Q2
Q3
Q4 Q1
Q2
Q3
Q4 Q1 Q1
Q2 Q2
Q3
Q4
475,034 462,687
Source: Alaska Railroad Corporation
172,567
The Alaska Railroad’s freight tonnage also shows significant seasonal fluctuations, with the bulk of freight being transported in the summer months. Freight volume has declined over the past decade, particularly due to declines in refined petroleum and coal exports. This led to a net loss in 2016 for the Alaska Railroad Corporation, its first annual loss since 1999.
Source: Alaska Railroad Corporation
2.5
2
1.5
1
.5
0
Alaska Railroad Freight Tonnage(Millions of tons)
2013 2014 2015 2016 2017
Q1
Q2
Q3
Q4Q1
Q2Q3
Q4Q1
Q2Q3
Q4Q1 Q1
Q2Q2
Q3
Q4
5,090,433 4,934,464 4,284,626 3,705,035 1,530,796
6
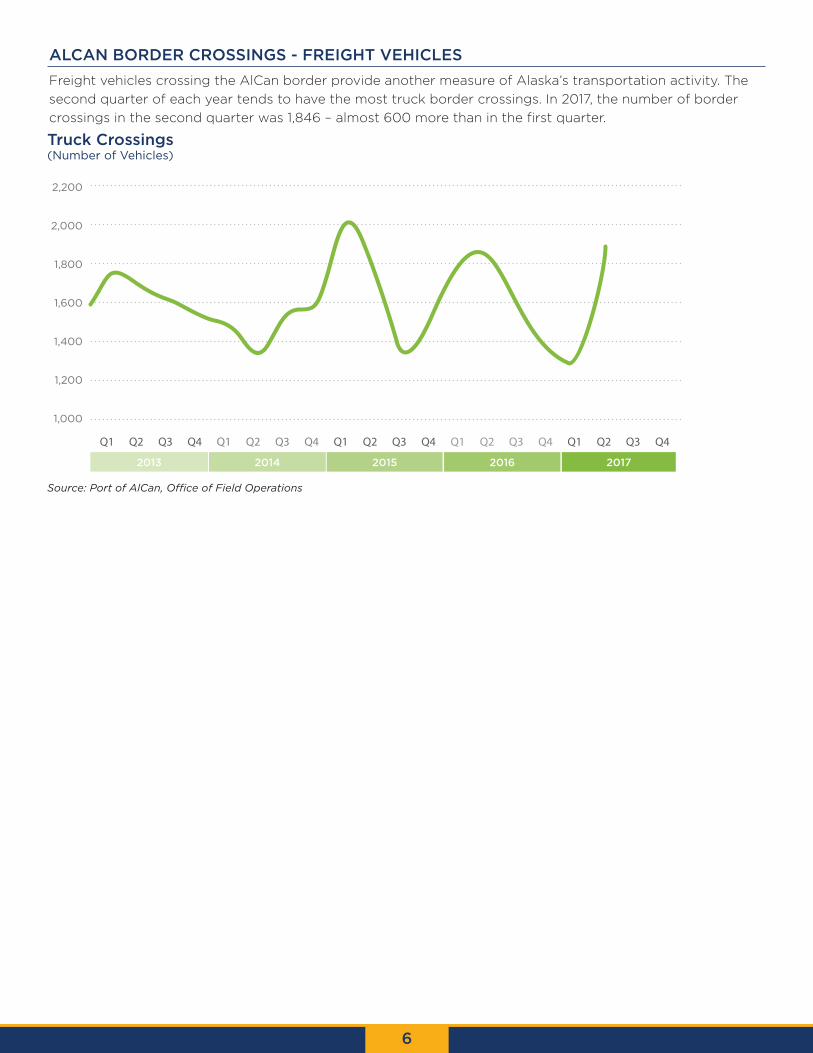
ALCAN BORDER CROSSINGS - FREIGHT VEHICLESFreight vehicles crossing the AlCan border provide another measure of Alaska’s transportation activity. The second quarter of each year tends to have the most truck border crossings. In 2017, the number of border crossings in the second quarter was 1,846 – almost 600 more than in the first quarter.
2,200
2,000
1,800
1,600
1,400
1,200
1,000
Q1 Q2 Q3 Q4 Q1 Q2 Q3 Q4 Q1 Q2 Q3 Q4 Q1 Q2 Q3 Q4 Q1 Q2 Q3 Q4
2013 2014 2015 2016 2017
Source: Port of AlCan, Office of Field Operations
Truck Crossings(Number of Vehicles)

7
Oil Price
In May the Organization of the Petroleum Exporting Countries (OPEC) extended oil production cuts through March 2018 after last year’s agreement failed to eliminate global oversupply and attain a sustained price recovery. The supply cuts being extended amount to nearly 1.8 million barrels a day. Following the announcement, oil prices fell sharply on concerns of a supply glut.
According to the U.S. Energy Information Administration (EIA) July 2017 Short-Term Energy Outlook (STEO), after three consecutive years of inventory increases, global liquid fuels inventories will decline by about 0.1 million barrels/day (b/d) in 2017. EIA forecasts U.S. crude oil production to average 9.3 million b/d in 2017 and 9.9 million b/d in 2018. If achieved, the forecasted 2018 production would be the highest on record, surpassing the previous record of 9.6 million b/d set in 1970. The July EIA STEO expects crude oil production in Alaska to be unchanged in both 2017 and 2018 at almost 0.5 million b/d.
According to the July STEO, the monthly average spot price of Brent crude oil decreased by $4/b in June to $46/b, marking the first month of 2017 in which Brent crude oil spot prices averaged below $50/b. The STEO forecasts the Brent crude spot price to average $50/b during the second half of 2017 and the first half of 2018. The STEO predicts West Texas Intermediate (WTI) crude oil prices will average $2/b lower than Brent prices in 2017 and 2018.
COMMODITY PRICES
Sources: U.S. Energy Information Administration and State of Alaska Department of Revenue Tax Division
$80
$60
$40
$20 DEC FEB APRIL JUNE AUG OCT DEC FEB APRIL JUNE AUG OCT DEC FEB APRIL JUNE
‘14 20172015 2016
OilC R U D E
Monthly Average(Price per barrel)
WTI
ANS
Brent

8
Natural Gas Price
According to the July STEO, Henry Hub natural gas spot prices have been relatively flat in 2017, averaging $3.04/million British thermal units (MMBtu) during the first half of the year - the same as the 2016 fourth quar-ter average price. Henry Hub spot prices averaged $2.98/MMBtu in June. The STEO forecasts closer-to-normal winter temperatures this winter following last year’s warm winter, which contributes to growth in residential and commercial consumption. In addition, export growth is forecast to increase in the second half of 2017 and in 2018. Both factors could contribute to modest upward price pressure. The STEO forecasts Henry Hub natural gas spot prices will average $3.10/MMBtu in 2017 and $3.40/MMBtu in 2018.
The STEO predicts dry natural gas production will rise through 2017 and 2018 in response to forecast price increases and large increases in liquefied natural gas (LNG) exports. Overall, EIA expects dry natural gas pro-duction in the U.S. will rise 1.0 (Bcf/d) in 2017, an annual increase of 1.4 percent.
The July STEO projects that the U.S. will become a net exporter of natural gas on average in 2017, with net ex-ports expected to average 0.4 Bcf/d. As LNG exports increases, 2018 net exports are forecast to be 1.3 Bcf/d.
Metals
Zinc prices dipped down slightly from its year-long rally peak in February, averaging $2,571.54 per ton in June 2017. The drop in zinc prices may be linked to China’s slowdown in infrastructure spending, reducing galvanized steel demand, which requires zinc. Silver prices dropped in the second quarter, and gold and copper prices remained relatively flat.
Sources: U.S. Energy Information Administration and World Bank
GasN AT U R A L
Monthly Average(Price per MMBtu)
$20
$15
$10
$5
$0DEC FEB APR JUN AUG OCT DEC FEB APR JUN AUG OCT DEC FEB APRIL JUNE
‘14 2015 2016 2017
Henry Hub SpotJapan LNG Import
CuC O P P E R
Monthly Average (Price per lb)
$3.30
$2.80
$2.30
$1.80DEC FEB APR JUN AUG OCT DEC FEB APR JUN AUG OCT DEC FEB APRIL JUNE
‘14 2015 2016 2017
Source: London Metal Exchange

9
Source: Investing.com
Coal Price
The July STEO estimates that coal production declined by 169 million short tons (MMst) (19 percent) in 2016 to 728 MMst, the lowest level of coal production since 1978. In 2017, growth in coal-fired electricity generation and exports is expected to lead to an increase of 57 MMst (8 percent) in total U.S. coal production. Coal pric-es remained relatively flat in the second quarter, although EIA predicts they will rise slightly in 2017 and 2018 due to increasing coal consumption by the electric power sector (forecast increase of 1 percent), due to rising natural gas prices.
Source: U.S. Energy Information Administration
Source: London Metal Exchange
ZnZ I N C
Monthly Average(Price per ton)
$2,900
$2,400
$1,900
$1,400DEC FEB APR JUN AUG OCT DEC FEB APR JUN AUG OCT DEC FEB APR JUNE
‘14 2015 2016 2017
AgS I LV E R
Monthly Average(Price per oz.)
$24
$22
$20
$18
$16
$14
$12DEC FEB APR JUN AUG OCT DEC FEB APR JUN AUG OCT DEC FEB APR JUNE
‘14 2015 2016 2017
Source: Investing.com
AuG O L D
Monthly Average(Price per oz.)
$1,400
$1,300
$1,200
$1,100
$1,000
DEC FEB APR JUN AUG OCT DEC FEB APR JUN AUG OCT DEC FEB APR JUNE
‘14 2015 2016 2017
CoalMonthly Average
(Price Per Short Ton)
DEC FEB APR JUN AUG OCT DEC FEB APR JUN AUG OCT DEC FEB APR JUNE
‘14 2015 2016 2017
$45
$40
$35
$30

10
Alaska Salmon PricesSalmon prices rose in the beginning of 2017, as was predicted at the end of last year. Wholesale prices have trended upwards and currency rate movements have generally been favorable for Alaska producers.
Source: Alaska Department of Revenue, Tax Division
Alaska Salmon PricesHeaded, gutted, and frozen. Average wholesale price per pound
2011 2012 2013 2014 2015 2016 2017
Chinook Sockeye Coho Pink
$6
$5
$4
$3
$2
$1
$0
Source: Alaska Department of Fish and Game; *Annual data available for January - October only*
Alaska Salmon ValueStatewide Total Exvessel Value - Millions of dollars(Annually through October only)
$800
$700
$600
$500
$400
$300
$200
$100
$02011 2012 2013 2014 2015 2016
Chinook Sockeye Coho Pink Chum
$659.7
$574.1
$691.1
$576.6
$414.2 $406.4
(Jan-April Only)

11
According to the U.S. Department of Commerce Bureau of Economic Analysis (BEA), real gross domestic product (GDP) increased in every state and the District of Columbia in the fourth quarter of 2016 (the most recent data available). Real GDP by state growth ranged from 3.4 percent in Texas to 0.1 percent in Kansas. In 2016 annual data, Alaska ranked 46th in state GDP, declining by 5 percent from 2015 to 2016, despite an increase in 2016 third to fourth quarter state GDP by 0.5 percent. According to BEA, mining was the largest contributor to the decline from 2015 to 2016.
$65
$60
$55
$50
$45
$40
Alaska GDP: 10-year Trend*(Billions of dollars)
‘07 ‘08 ‘09 ‘10 ‘11 ‘12 ‘13 ‘14 ‘15 ‘16
Nominal GDP
Real GDP (2009 Dollars)
Source: U.S. Bureau of Economic Analysis*First quarter 2017 data not yet available.
GROSS DOMESTIC PRODUCT
Source: U.S. Bureau of Economic Analysis
Delaware $70,387Idaho $67,275Maine $59,275Rhode Island $57,433North Dakota $52,089Alaska $50,713South Dakota $48,139Montana $45,994Wyoming $37,858Vermont $31,092
(Millions of dollars)
BOTTOM 10STATES
California $2,602,672 Texas $1,616,801 New York $1,487,998 Florida $926,817 Illinois $791,608 Pennsylvania $724,936 Ohio $625,715 New Jersey $581,122 Georgia $525,360 North Carolina $517,904
(Millions of dollars)
TOP 10STATES
STATE GDP - 2016 ANNUAL DATA

12
REGIONAL ECONOMIC HIGHLIGHTS FOR SECOND QUARTER, 2017
Anchorage:The partners of PacRim Coal made an internal decision to suspend efforts to pursue permits on the Chuitna Coal Project, about 45 miles southwest of Anchorage. PacRim Coal stated that the owners decided to shelve the project after an investment fell through.
Liberty Ventures Group, a subsidiary of Colorado-based media conglomerate Liberty Interactive Crop, acquired Alaska’s largest telecommunications company, GCI. The purchase price was $1.12 billion.
The Ted Stevens International Airport is exploring plans for a hotel on airport property, and has interest from four developers. The project could cost $40 to $60 million based on applications already received; the airport is reviewing those applications and expects to put the project up for a bid sometime in 2017, with the goal of beginning construction in 2018.
A Cook Inlet natural gas producer, Aurora Gas, LLC, declared Chapter 11 bankruptcy, blaming a drop in oil prices and delayed payments of state tax credits for its insolvency. The company has 19 wells, all located onshore on the west side of Cook Inlet near Tyonek and Shirleyville, and a contract to sell 1 million cubic feet of natural gas daily to the Tesoro refinery in Nikiski.
In May, Anchorage-based realty firm Keller Williams Realty-Alaska Group acquired Madden Real Estate of Fairbanks to create the largest firm in the state.
The Alaska Board of Agriculture and Conservation voted unanimously in May to sell the state-owned Mt. McKinley Meat and Sausage Plant in Palmer to Greg Giannulis, transferring the property to private ownership. Plant operations will remain largely the same, including keeping most existing staff on board.
Hilcorp Alaska, LLC was the only bidder in the state and federal Cook Inlet oil and gas lease sales on June 21, spending $3.95 million on 20 tracts on state land and in state and federal waters. According to the federal Bureau of Ocean Energy Management, the Inlet sale was the first federal offshore lease sale in Alaska since 2008.
Bering Strait:Graphite One Resources, Inc. announced May 17 that it had received a report from AIDEA that assessed potential locations for a facility to refine graphite from its Graphite Creek deposit in western Alaska into advanced materials such as coated spherical graphite used in lithium-ion batteries. In its report, AIDEA identified Homer, Kenai, Port Mackenzie, and Seward as potential Alaska sites for the refinery.
AT&T began providing a 4G cellular network in May, after years of preparation. With existing infrastructure, a 4G network was established in Nome without building a separate AT&T tower.
Copper Valley:In May, the Alaska Oil and Gas Conservation Commission (AOGCC) levied a $380,000 penalty against Tolsona Oil and Gas Exploration, owned by Ahtna, Inc. for safety violations at a gas well drilled near Glennallen. The company said it took “immediate action” to comply with AOGCC’s order.
Fairbanks:Fairbanks hosted the Arctic Council Ministerial meeting May 11, welcoming delegates from all eight Arctic nations, including U.S. Secretary of State Rex Tillerson. The U.S. handed the two-year rotating chairmanship to Finland. The chairmanship of the Arctic Economic Council was also handed to Finland. The Arctic Economic Council is a business forum established to facilitate Arctic business-to-business activities and provide a business perspective to the work of the more policy-focused Arctic Council.

13
Gulf of Alaska
Beaufort Sea
Canada
• Barrow
• Fairbanks
• Kodiak
• Wasilla• Anchorage
• Kenai • Cordova
• Juneau
Ketchikan •
• Dillingham
• Bethel• Glennallen
• Nome
• Kotzebue
Bering Sea
• AdakUnalaska •
The Interior Alaska Building Association launched a new “Alaska Built” brand, after receiving a grant from the National Association of Home Builders. The new brand will signify quality Alaska products and contractors. The group’s goal is for reliable homes to be built across Alaska, where there is no state building code.
In April, the Fairbanks North Star Borough Assembly voted to approve funding for a study to address community impacts of the Air Force’s deployment of F-35 fighter jets at Eielson Air Force Base. The borough is interested in learning more about impacts of the deployment on housing, education, transportation, planning and zoning, public utilities, infrastructure, public safety, emergency services, among other things. The Air Force is beginning new construction at Eielson in anticipation of the arrival of the first F-35s in 2020.
Kenai Peninsula:Chugach Electric Association decided to cancel a proposed hydroelectric dam project on the Snow River, four weeks after federal regulators gave the Association a three-year permit to investigate feasibility. Public meetings about the plan drew hundreds, many of whom vocally opposed the dam for its possible impacts to river health, fish habitat, scenery, and recreation.
Kenai-based company PRL Logistics is making plans to lease a LMH-1 hybrid airship from its United Kingdom-based operator. The airship is currently under construction in California and will be ready for use in 2019. PRL Logistics believes the airship could make remote areas of Alaska more accessible to smaller companies for cargo delivery.
In November 2016, ConocoPhillips announced that it was putting its LNG plant in Nikiski up for sale; in April 2017, the company announced that it received bids for the purchase of the plant. However, in July the company announced it has not yet found a buyer and will save expenses by putting the plant into long-term shutdown mode this fall while it continues to try to sell the plant.

14
Mat-Su and Denali Boroughs:The first marijuana retail store in downtown Talkeetna opened in May in a historic log cabin that housed the guide service of Denali climbing pioneer Ray Genet. The store has generated local controversy, with some arguing that a marijuana store on Main Street conflicts with Talkeetna’s family-friendly storefronts, historic atmosphere, and cruise ship visitors.
Prince William Sound:On May 2, Valdez voters overwhelmingly rejected a ban on commercial marijuana. Proposition One would have banned all marijuana businesses within the city. Valdez’s only marijuana shop, Herbal Outfitters, was the first to open in Alaska, in October 2016.
Southeast:Ketchikan’s first marijuana retail store, the Stoney Moose, opened its doors on April 10.
The Governor signed a bill passed by the Alaska Legislature to increase the land grant to the Petersburg borough by 14,666 acres. The Petersburg borough plans to sell some of the land and develop some of it for rock pits or other uses. The state Department of Natural Resources values the total land grant at more than $78 milliom.
Flights between Ketchikan and Prince Rupert, British Columbia are now available for the first time since the 1990s. Misty Fjords Air & Outfitting began three scheduled round-trip flights per week on May 1.
The Northern Southeast Regional Aquaculture Association (NSRAA), a nonprofit regional fish hatchery based in Sitka, has purchased the Gunnuk Creek hatchery in Kake that closed in 2014 under a mountain of debt. The State of Alaska Division of Economic Development (DED) held title to the hatchery after foreclosure on loans to the prior owner, Kake Non-Profit Fisheries Corporation. NSRAA plans to invest $2.5 million into the hatchery to restart the hatchery program and modernize the facility.
Delta Airlines began daily summer flights between Juneau and Seattle in May, being the only other air carrier to do so besides Alaska Airlines. Alaska Airlines remains the only year-round air service provider.
In June, the Juneau Borough Assembly approved an ordinance allowing Eaglecrest Ski Area to serve alcohol. Eaglecrest’s profitability is tied to the amount of snow the ski area gets in a given year, so its profits can be very unpredictable. Eaglecrest management hopes that alcohol sales can help increase and stabilize revenue.
Southwest:On April 5, Bethel leaders dedicated the $300 million Paul John Calricaraq Project. The Yukon-Kuskokwim Health Corporation (YKHC) hospital will be remade inside and out by the time the work is done in 2021. A three-story outpatient clinic will be added to the complex, plus 54 units of employee housing. The project is being developed through the U.S. Indian Health Service’s joint venture construction program.
On April 12, the State of Alaska Department of Natural Resources approved a land-use permit the Pebble Partnership applied for in October 2016, with conditions requiring extensive cleanup and monitoring, as well as requiring the allocation of $2 million to ensure disturbed land is eventually restored. This compromise as a result of over 2,000 public comments submitted on Pebble’s application to continue basic maintenance, restoration, and upkeep.
PenAir ceased its freight service to Unalaska from Anchorage on June 1, affecting the island’s food delivery and fishing industry. Unalaska Mayor Frank Kelty said that PenAir officials told him freight service has not been profitable and they are selling both cargo planes that service the route. PenAir will continue freight deliveries for Cold Bay, Dillingham, King Salmon, McGrath, Sand Point, St. George, and St. Paul.

15
Quaterra Resources, Inc., a British Columbia mining company, announced in April that it will be exploring the Groundhog copper mining prospect 200 miles southwest of Anchorage near Nondalton. Quaterra will pay $1 million for the first year of exploration, and at least $500,000 a year for the following four years.
On June 5, the Bristol Bay Assembly passed an ordinance that will allow fisherman who install a refrigerated seawater system in 2017 or 2018 to receive a one-time $1,500 fish tax credit. The borough is trying to incentivize fisherman to deliver a higher value product, which in turn will provide increased revenue to the borough through its three percent fish tax.
Northwest Arctic Borough:On April 25, a new payment in lieu of taxes (PILT) agreement was approved between the Northwest Arctic Borough and Teck Alaska, operator of the Red Dog Mine. The agreement includes a 10-year PILT and has a total estimated value of $20-$60 million during that time. The new PILT agreement is retroactive, dating back to January 1, 2016.
In May, the Northwest Arctic Borough announced it had secured funds to begin construction of the Cape Blossom Road. The two-lane, all-season road would stretch from Kotzebue to Cape Blossom and cost an estimated $30 million. The Borough sees this road as a first step to a regional port. Construction of the road will start this winter when an ice road can be made to extract gravel.
Seattle-based E&E Foods, which runs both land-based and vessel operations in Bristol Bay, Southeast, and the Kenai Peninsula, announced that it plans to bring its floating processor to Kotzebue in August to process chum salmon. Previously, buyers had to purchase chums and fly the fresh product via air carrier. The floating processor will be accompanied by a freighter and a tender to shuttle the fish, giving the operation a processing capacity of 20,000 pounds of fish per day. E&E Foods will continue to buy fresh product in Kotzebue onshore, under the Pacific Star Seafoods name.
The seasonally adjusted unemployment rate was 6.7 percent in the second quarter of 2017. The Alaska unemployment rate and national unemployment rate continue to diverge – the national rate of 4.4 percent in the second quarter was the lowest national rate in over a decade. On average, 342,261 Alaskans were employed each month in the second quarter of 2017, out of a total average labor force of 366,855.
TOTAL WORKFORCE AND UNEMPLOYMENT RATE
Source: Alaska Department of Labor and U.S. Bureau of Labor Statistics
Alaska and U.S. Unemployment(Unemployment rates - Seasonally adjusted)
United States Alaska
12%
10%
8%
6%
4%
2%
0‘08 ‘09 ‘10 ‘11 ‘12 ‘13 ‘14 ‘15 ‘16 ‘17
(Q1-Q2)
16
COST OF LIVING IN ALASKAA cost of living index measures the relative cost of living over time across geographical regions by taking into account differences in the price of goods and services needed to maintain a basic standard of living; such as the cost of food, housing, energy, and basic goods.
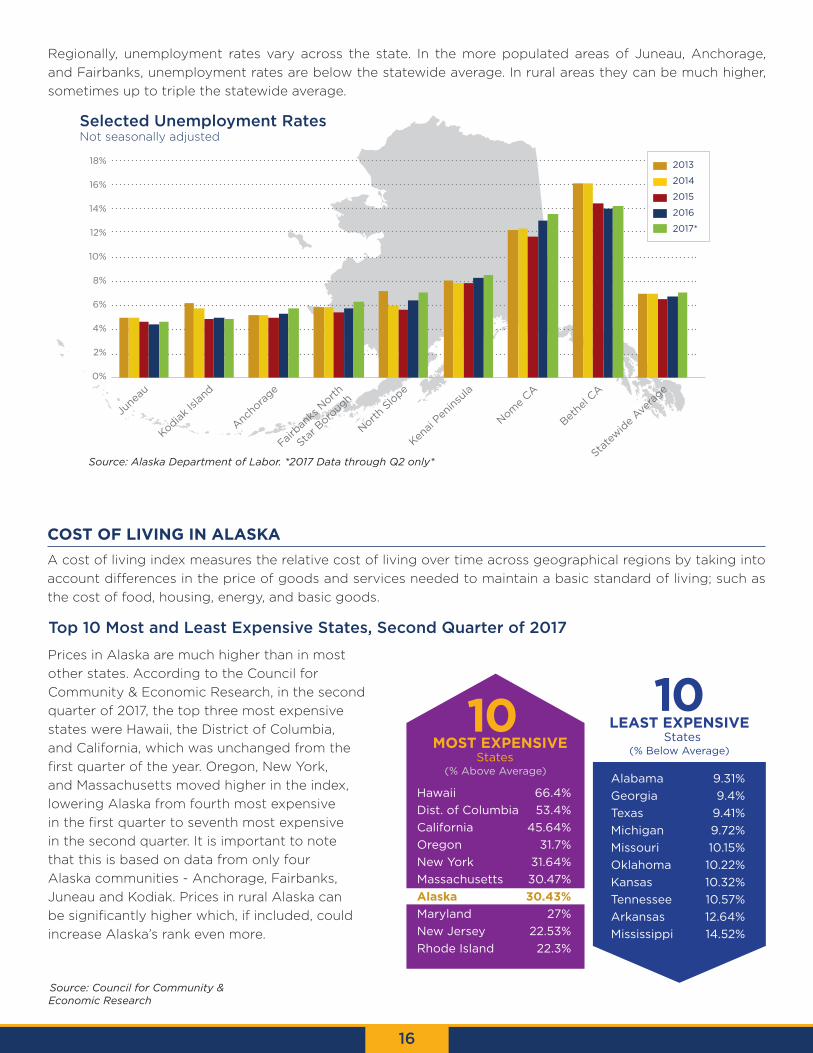
Regionally, unemployment rates vary across the state. In the more populated areas of Juneau, Anchorage, and Fairbanks, unemployment rates are below the statewide average. In rural areas they can be much higher, sometimes up to triple the statewide average.
Selected Unemployment RatesNot seasonally adjusted
Source: Alaska Department of Labor. *2017 Data through Q2 only*
18%
16%
14%
12%
10%
8%
6%
4%
2%
0%
Junea
u
North S
lope
Kodiak Is
land
Kenai
Peninsu
la
Fairban
ks N
orth
Star B
orough
Bethel
CA
State
wide A
vera
ge
Anchora
ge
Nome C
A
2013
2014
2015
2016
2017*
Source: Council for Community & Economic Research
Prices in Alaska are much higher than in most other states. According to the Council for Community & Economic Research, in the second quarter of 2017, the top three most expensive states were Hawaii, the District of Columbia, and California, which was unchanged from the first quarter of the year. Oregon, New York, and Massachusetts moved higher in the index, lowering Alaska from fourth most expensive in the first quarter to seventh most expensive in the second quarter. It is important to note that this is based on data from only four Alaska communities - Anchorage, Fairbanks, Juneau and Kodiak. Prices in rural Alaska can be significantly higher which, if included, could increase Alaska’s rank even more.
Hawaii 66.4%Dist. of Columbia 53.4%California 45.64%Oregon 31.7%New York 31.64%Massachusetts 30.47%Alaska 30.43%Maryland 27%New Jersey 22.53%Rhode Island 22.3%
10States
(% Above Average)
MOST EXPENSIVE
Alabama 9.31%Georgia 9.4%Texas 9.41%Michigan 9.72%Missouri 10.15%Oklahoma 10.22%Kansas 10.32%Tennessee 10.57%Arkansas 12.64%Mississippi 14.52%
(% Below Average)
10States
LEAST EXPENSIVE
Top 10 Most and Least Expensive States, Second Quarter of 2017
17
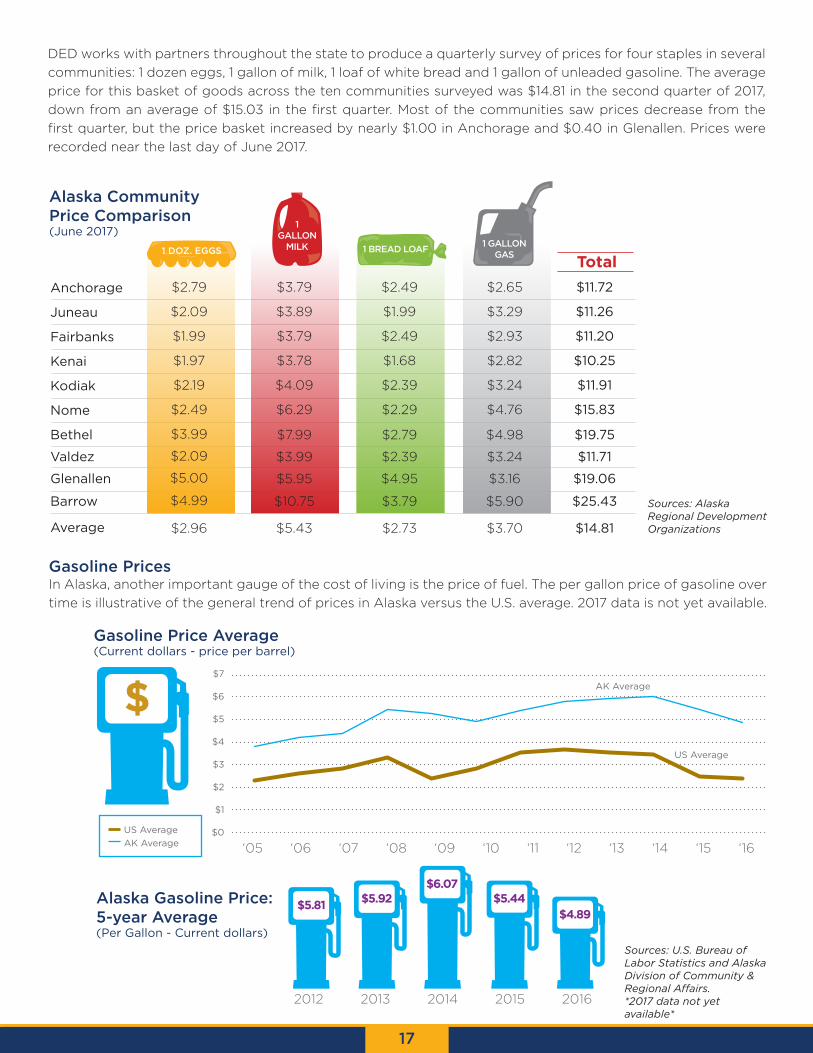
Anchorage $2.79 $3.79 $2.49 $2.65 $11.72
Juneau $2.09 $3.89 $1.99 $3.29 $11.26
Fairbanks $1.99 $3.79 $2.49 $2.93 $11.20
Kenai $1.97 $3.78 $1.68 $2.82 $10.25
Kodiak $2.19 $4.09 $2.39 $3.24 $11.91
Nome $2.49 $6.29 $2.29 $4.76 $15.83
Bethel
Valdez
Glenallen
$3.99
$2.09
$5.00
$7.99
$3.99
$5.95
$2.79
$2.39
$4.95
$4.98
$3.24
$3.16
$19.75
$11.71
$19.06
Barrow $4.99 $10.75 $3.79 $5.90 $25.43
Average $2.96 $5.43 $2.73 $3.70 $14.81
1 DOZ. EGGS
1GALLON
MILK 1 BREAD LOAF 1 GALLONGAS Total
Alaska Community Price Comparison(June 2017)
Sources: Alaska Regional Development Organizations
In Alaska, another important gauge of the cost of living is the price of fuel. The per gallon price of gasoline over time is illustrative of the general trend of prices in Alaska versus the U.S. average. 2017 data is not yet available.
Gasoline Prices
Gasoline Price Average(Current dollars - price per barrel)
Sources: U.S. Bureau of Labor Statistics and Alaska Division of Community & Regional Affairs. *2017 data not yet available*
Alaska Gasoline Price: 5-year Average(Per Gallon - Current dollars)
2012 2013 2014 2015 2016
$5.81 $5.92$6.07
$4.89$5.44
$7
$6
$5
$4
$3
$2
$1
$0
‘05 ‘06 ‘07 ‘08 ‘09 ‘10 ‘11 ‘12 ‘13 ‘14 ‘15 ‘16 US AverageAK Average
AK Average
US Average
$
DED works with partners throughout the state to produce a quarterly survey of prices for four staples in several communities: 1 dozen eggs, 1 gallon of milk, 1 loaf of white bread and 1 gallon of unleaded gasoline. The average price for this basket of goods across the ten communities surveyed was $14.81 in the second quarter of 2017, down from an average of $15.03 in the first quarter. Most of the communities saw prices decrease from the first quarter, but the price basket increased by nearly $1.00 in Anchorage and $0.40 in Glenallen. Prices were recorded near the last day of June 2017.

18
Source: Alaska Division of Community and Regional Affairs
Alaska Gasoline Price by Region (Current dollars - price per gallon)
$8
$7
$6
$5
$4
$3
$2
$1
$0Jan Jul Jan Jul Jan Jul Jan Jul Jan Jul Jan Jul Jan
20122011 2013 2014 2015 2016 2017
Gulf Coast
Interior
Northern
Northwest
Southeast
Southwest
Western
Average
Source: Alaska Division of Community and
Regional Affairs
Average Alaskan Heating Fuel Cost (Current price per-gallon)
$8
$7
$6
$5
$4
$3
$2
$1
$0Jan Jul Jan Jul Jan Jul Jan Jul Jan Jul Jan Jul Jan
20122011 2013 2014 2015 2016 2017
Gulf Coast
Interior
Northern
Northwest
Southeast
Southwest
Western
Average
EnergyDCRA’s January 2017 survey (the most recent available), showed Alaska communities in the Western Region had the highest average heating fuel retail price at $5.17 per gallon, while the Northern Region reported the lowest average retail price at $1.74 per gallon. Note: the North Slope Borough subsidizes residential heating fuel costs in five of its seven communities, reducing their average prices substantially. Excluding the Northern Region, the Southeast Alaska Region tends to experience the lowest heating fuel prices.
The Alaska Division of Community and Regional Affairs (DCRA) conducts a biannual survey of energy (heating fuel and gasoline) prices around the state. The latest survey, published in January 2017, compares gasoline prices for seven regions around Alaska. Southeast Alaska has the lowest gasoline price at $3.45 per gallon, while the Northern Region had the highest price at $5.60 per gallon.

19
The cost of living in Alaska communities can be compared to show how expensive it is to live and work in Alaska communities versus communities outside of the state. The Council for Community and Economic Research publishes a quarterly and annual Cost of Living Index (COLI) which provides a measure to compare cost of living differences among urban areas nationwide (communities in all 50 U.S. states, the District of Columbia, and Puerto Rico). The COLI provides a useful way to compare the cost of living differences between urban and rural areas weighted by different categories of consumer expenditures for upper middle class households.
In the 2017 second quarter report, among the 253 U.S. cities participating, McAllen, Texas continued its streak with the lowest average index of 76.0 percent (national average for all areas surveyed is 100 percent), and Manhattan, New York continued to have the highest average COLI at 235.0 percent.
Alaska communities participating in the COLI are Anchorage, Fairbanks, Juneau and Kodiak, which were all in the top 20 most expensive communities in the country in the second quarter of 2017. Anchorage came in at 125.8 percent (ranked 22/253), Kodiak’s index was 130.4 percent (ranked 20/253), Juneau at 131.8 percent (ranked 18/253), and Fairbanks had the highest cost of living of Alaska communities surveyed at 133.7 percent (ranked 17/253). Fairbanks had the highest utility costs in the nation, at 223.9 percent of the national average.
Source: Council for Community & Economic Research
Grocery Items (13.61% of total)
Housing (27.59% of total)
Utilities (10.06% of total)
Transportation (9.59% of total)
Health Care (4.00% of total)
Misc. Goods & Services (35.15% of total)
Composite Index 100%
National Average is 100%
2017 Second Quarter Cost of Living Index(National average = 100% | weight in index)
Anchorage Fairbanks Juneau Kodiak Manhattan, NY McAllen, TX
500%
400%
300%
200%
100%
0%

20
ALASKA CONFIDENCE INDEX The Alaska Confidence Index (ACI) is a measure of Alaska households’ confidence in the health of the state and local economies, their personal financial situation, and their expectations for the future. ACI is expressed using a value of 0 to 100. Values above 50 represent relative confidence in the economy, while values below 50 indicate lack of confidence. ACI is comprised of six individual components: current assessment of, and future expectations for, the state economy confidence, local economy confidence, and personal financial confidence.
The composite index rose slightly in the second quarter of 2017, driven by moderate increases in Alaskans’ confidence levels in their local economies. The composite index now stands at 51, showing slight confidence in the economy. This increase comes after a sharp drop in local economy confidence in the first quarter of the year. Alaskans’ confidence in their current personal financial situations remains strong. Comparing quarter to quarter, there has been little variation in this measure over the years.
Source: Northern Economics
Alaska Confidence Index(Confidence rating on scale of 0-100)
Source: Northern Economics
Alaska Confidence Index Composite70
60
50
40
30
20
10
0 2014 2015 2016 2017
Q1
Q2
Q3
Q4
2014 2015 2016 2017 (Q1 & Q2)
70
65
60
55
50
45
40
35
30
25
20
0
Personal - Current Finances
Local - Current Economy
Personal - Future Finances
State - Current Economy
Local - Future Economy
State - Future Economy

21
(This page intentionally left blank)
A L A S K A ’ S E C O N O M I C R E P O R T
S E C O N D Q U A R T E R , 2 0 1 7