Alarm Clock
375
LTE Radio Access, Rel. RL40, Operating Documentation, Issue 02 LTE iOMS Alarms DN70397367 Issue 01 Approval Date 2013-01-21 Confidential Nokia Siemens Networks is continually striving to reduce the adverse environmental effects of its products and services. We would like to encourage you as our customers and users to join us in working towards a cleaner, safer environment. Please recycle product packaging and follow the recommendations for power use and proper disposal of our products and their compo- nents. If you should have questions regarding our Environmental Policy or any of the environmental services we offer, please contact us at Nokia Siemens Networks for any additional information.
-
Upload
conyel-cabalatungan -
Category
Documents
-
view
269 -
download
1
description
ioms alarm lte
Transcript of Alarm Clock

LTE Radio Access, Rel. RL40, Operating Documentation, Issue 02
LTE iOMS Alarms
DN70397367
Issue 01Approval Date 2013-01-21
Confidential
Nokia Siemens Networks is continually striving to reduce the adverse environmental effects of its products and services. We would like to encourage you as our customers and users to join us in working towards a cleaner, safer environment. Please recycle product packaging and follow the recommendations for power use and proper disposal of our products and their compo-nents.
If you should have questions regarding our Environmental Policy or any of the environmental services we offer, please contact us at Nokia Siemens Networks for any additional information.
2 DN70397367
LTE iOMS Alarms
Id:0900d80580995994Confidential
The information in this document is subject to change without notice and describes only the product defined in the introduction of this documentation. This documentation is intended for the use of Nokia Siemens Networks customers only for the purposes of the agreement under which the document is submitted, and no part of it may be used, reproduced, modified or transmitted in any form or means without the prior written permission of Nokia Siemens Networks. The documentation has been prepared to be used by professional and properly trained personnel, and the customer assumes full responsibility when using it. Nokia Siemens Networks welcomes customer comments as part of the process of continuous development and improvement of the documentation.
The information or statements given in this documentation concerning the suitability, capacity, or performance of the mentioned hardware or software products are given "as is" and all liability arising in connection with such hardware or software products shall be defined conclusively and finally in a separate agreement between Nokia Siemens Networks and the customer. However, Nokia Siemens Networks has made all reasonable efforts to ensure that the instructions contained in the document are adequate and free of material errors and omissions. Nokia Siemens Networks will, if deemed necessary by Nokia Siemens Networks, explain issues which may not be covered by the document.
Nokia Siemens Networks will correct errors in this documentation as soon as possible. IN NO EVENT WILL Nokia Siemens Networks BE LIABLE FOR ERRORS IN THIS DOCUMENTA-TION OR FOR ANY DAMAGES, INCLUDING BUT NOT LIMITED TO SPECIAL, DIRECT, INDI-RECT, INCIDENTAL OR CONSEQUENTIAL OR ANY LOSSES, SUCH AS BUT NOT LIMITED TO LOSS OF PROFIT, REVENUE, BUSINESS INTERRUPTION, BUSINESS OPPORTUNITY OR DATA,THAT MAY ARISE FROM THE USE OF THIS DOCUMENT OR THE INFORMATION IN IT.
This documentation and the product it describes are considered protected by copyrights and other intellectual property rights according to the applicable laws.
The wave logo is a trademark of Nokia Siemens Networks Oy. Nokia is a registered trademark of Nokia Corporation. Siemens is a registered trademark of Siemens AG.
Other product names mentioned in this document may be trademarks of their respective owners, and they are mentioned for identification purposes only.
Copyright © Nokia Siemens Networks 2013. All rights reserved
f Important Notice on Product SafetyThis product may present safety risks due to laser, electricity, heat, and other sources of danger.
Only trained and qualified personnel may install, operate, maintain or otherwise handle this product and only after having carefully read the safety information applicable to this product.
The safety information is provided in the Safety Information section in the “Legal, Safety and Environmental Information” part of this document or documentation set.
The same text in German:
f Wichtiger Hinweis zur Produktsicherheit Von diesem Produkt können Gefahren durch Laser, Elektrizität, Hitzeentwicklung oder andere Gefahrenquellen ausgehen.
Installation, Betrieb, Wartung und sonstige Handhabung des Produktes darf nur durch geschultes und qualifiziertes Personal unter Beachtung der anwendbaren Sicherheits-anforderungen erfolgen.
Die Sicherheitsanforderungen finden Sie unter „Sicherheitshinweise“ im Teil „Legal, Safety and Environmental Information“ dieses Dokuments oder dieses Dokumentations-satzes.
DN70397367 3
LTE iOMS Alarms
Id:0900d80580995994Confidential
Table of contentsThis document has 375 pages.
Summary of changes . . . . . . . . . . . . . . . . . . . . . . . . . . . . . . . . . . . . . . . 12
1 70001 CONFIGURATION OF SNMP MEDIATOR IS OUT OF ORDER 13
2 70002 INVALID SNMP TRAP COMMUNITY STRING . . . . . . . . . . . . . 15
3 70003 NO REPLY TO SNMP REQUEST . . . . . . . . . . . . . . . . . . . . . . . 17
4 70004 UNKNOWN SNMP TRAP. . . . . . . . . . . . . . . . . . . . . . . . . . . . . . 19
5 70005 INCORRECT ALARM DATA. . . . . . . . . . . . . . . . . . . . . . . . . . . . 22
6 70006 ACTIVE ALARM OVERFLOW . . . . . . . . . . . . . . . . . . . . . . . . . . 24
7 70007 AUTHENTICATION FAILURE IN ETHERNET DEVICE. . . . . . . 26
8 70008 SWITCH RESTARTED. . . . . . . . . . . . . . . . . . . . . . . . . . . . . . . . 28
9 70009 SWITCH LINK DOWN . . . . . . . . . . . . . . . . . . . . . . . . . . . . . . . . 30
10 70011 NODE NOT RESPONDING . . . . . . . . . . . . . . . . . . . . . . . . . . . . 32
11 70012 SERVICE LEVEL DEGRADED BELOW THRESHOLD . . . . . . . 35
12 70013 IN-MEMORY DATABASE PARTITION GETTING FULL . . . . . . 37
13 70025 POSSIBLE SECURITY THREAT IN NETWORK ELEMENT . . . 39
14 70030 DISK DATABASE IS GETTING FULL . . . . . . . . . . . . . . . . . . . . 40
15 70064 SYSTEM BACKUP FAILED . . . . . . . . . . . . . . . . . . . . . . . . . . . . 42
16 70074 MAXIMUM THRESHOLD HAS BEEN CROSSED . . . . . . . . . . . 43
17 70094 PLUG-IN UNIT FAILURE . . . . . . . . . . . . . . . . . . . . . . . . . . . . . . 44
18 70095 PLUG-IN UNIT TEMPERATURE OUT OF LIMIT . . . . . . . . . . . . 45
19 70096 PLUG-IN UNIT VOLTAGE OUT OF LIMIT . . . . . . . . . . . . . . . . . 46
20 70097 FAN SPEED OUT OF LIMIT. . . . . . . . . . . . . . . . . . . . . . . . . . . . 47
21 70098 EXCESSIVE NUMBER OF IPMI EVENTS . . . . . . . . . . . . . . . . . 48
22 70099 FIBRE CHANNEL CONTROLLER ERROR . . . . . . . . . . . . . . . . 49
23 70100 FIBRE CHANNEL FRAME TRANSMISSION (CRC) ERROR . . 50
24 70101 FIBRE CHANNEL DEVICE ERROR. . . . . . . . . . . . . . . . . . . . . . 52
25 70102 FIBRE CHANNEL LINK ERROR . . . . . . . . . . . . . . . . . . . . . . . . 53
26 70103 FIBRE CHANNEL TOTAL LOSS OF SYNC. . . . . . . . . . . . . . . . 55
27 70104 IPMI INTERNAL FAILURE . . . . . . . . . . . . . . . . . . . . . . . . . . . . . 56
28 70107 SS7 / SIGTRAN PROTOCOL STACK CONFIGURATION FAILURE58
29 70110 CONFIGURATION OF NWI3 ADAPTER IS OUT OF ORDER. . 60
4 DN70397367
LTE iOMS Alarms
Id:0900d80580995994Confidential
30 70111 FAILED TO CREATE NETACT CONNECTION . . . . . . . . . . . . . 63
31 70112 CAPACITY USAGE WARNING LIMIT IS REACHED . . . . . . . . . 65
32 70115 LICENCE EXPIRATION WARNING LIMIT IS REACHED . . . . . . 67
33 70136 SWITCH AND SERVICE UNIT: IPMI SYSTEM EVENT LOG FULL69
34 70156 DISK DATABASE WATCHDOG START-UP FAILED . . . . . . . . . 70
35 70157 CPU USAGE OVER LIMIT . . . . . . . . . . . . . . . . . . . . . . . . . . . . . 72
36 70158 FILE SYSTEM USAGE OVER LIMIT. . . . . . . . . . . . . . . . . . . . . . 73
37 70159 MANAGED OBJECT FAILED . . . . . . . . . . . . . . . . . . . . . . . . . . . 75
38 70160 MEMORY USAGE OVER LIMIT . . . . . . . . . . . . . . . . . . . . . . . . . 80
39 70161 OPERATING SYSTEM MONITORING FAILURE . . . . . . . . . . . . 81
40 70162 RAID ARRAY HAS BEEN DEGRADED . . . . . . . . . . . . . . . . . . . 82
41 70163 ETHERNET INTERFACE USAGE OVER LIMIT . . . . . . . . . . . . . 83
42 70164 ETHERNET LINK FAILURE . . . . . . . . . . . . . . . . . . . . . . . . . . . . 84
43 70166 MANAGED OBJECT LOCKED . . . . . . . . . . . . . . . . . . . . . . . . . . 85
44 70168 CLUSTER STARTED (RESTARTED) . . . . . . . . . . . . . . . . . . . . . 86
45 70169 COMPACTING IN-MEMORY DATABASE FAILED. . . . . . . . . . . 87
46 70170 IN-MEMORY DATABASE WATCHDOG START-UP FAILED. . . 90
47 70171 RECREATING STANDBY IN-MEMORY DATABASE FAILED . . 91
48 70172 TAKING CHECKPOINT OF IN-MEMORY DATABASE FAILED . 93
49 70173 BACKEND DATABASE REQUIRED BY CORBA NAMING SER-VICE IS UNAVAILABLE . . . . . . . . . . . . . . . . . . . . . . . . . . . . . . . . . . . . . 95
50 70174 SWITCH AND SERVICE UNIT: QUEUE ENGINE MEMORY FULL98
51 70175 SWITCH AND SERVICE UNIT: FABRIC BROADCAST STORM 99
52 70178 SWITCH AND SERVICE UNIT: RSTP NEW ROOT . . . . . . . . . 101
53 70179 SWITCH AND SERVICE UNIT: QUEUE ENGINE RESTART. . 104
54 70180 SWITCH AND SERVICE UNIT: (RSTP) TOPOLOGY CHANGE . .106
55 70186 CLUSTER OPERATION INITIATED BY OPERATOR. . . . . . . . 107
56 70187 MANUAL NODE ISOLATION VERIFICATION NEEDED . . . . . 109
57 70188 MANAGED OBJECT SHUTDOWN BY OPERATOR . . . . . . . . 112
58 70189 MANAGED OBJECT UNLOCKED BY OPERATOR . . . . . . . . . 113
59 70194 RECOVERY GROUP SWITCHOVER . . . . . . . . . . . . . . . . . . . . 114
60 70197 MINIMUM THRESHOLD HAS BEEN CROSSED . . . . . . . . . . . 116

DN70397367 5
LTE iOMS Alarms
Id:0900d80580995994Confidential
61 70204 UNEXPECTED PERSISTENT STATUS DATA VALUES FOR IN-MEMORY DATABASE. . . . . . . . . . . . . . . . . . . . . . . . . . . . . . . . . . . . . 117
62 70205 REPLICATION FAILING FOR IN-MEMORY DATABASE . . . . 119
63 70236 LDAP DATABASE CORRUPTED. . . . . . . . . . . . . . . . . . . . . . . 121
64 70237 CORRUPTED LDAP DATABASE RECOVERED. . . . . . . . . . . 125
65 70239 FRONTPANEL LINK FAULTY . . . . . . . . . . . . . . . . . . . . . . . . . 127
66 70240 BACKPLANE LINK FAULTY. . . . . . . . . . . . . . . . . . . . . . . . . . . 129
67 70241 SWITCH FAULTY. . . . . . . . . . . . . . . . . . . . . . . . . . . . . . . . . . . 130
68 70242 ALARM LOG FILE INACCESSIBLE . . . . . . . . . . . . . . . . . . . . . 131
69 70243 ALARM PROCESSOR CONFIGURATION IS OUT OF ORDER . . 133
70 70244 CORRUPTED ALARM DATA . . . . . . . . . . . . . . . . . . . . . . . . . . 135
71 70245 ILLEGAL INTERNAL USAGE OF EXTERNAL ALARM NOTIFICA-TION FORMAT . . . . . . . . . . . . . . . . . . . . . . . . . . . . . . . . . . . . . . . . . . 136
72 70246 ALARM SYSTEM HEARTBEAT . . . . . . . . . . . . . . . . . . . . . . . 138
73 70247 ALARM SYSTEM HEARTBEATING SWITCHED OFF . . . . . . 140
74 70249 CRITICAL CLUSTER SERVICES WITHOUT STANDBY . . . . 142
75 70250 NO OPERATIONAL RECOVERY UNIT FOR SERVICE INSTANCE145
76 70251 UNRECOMMENDED CONFIGURATION FORCED BY OPERA-TOR . . . . . . . . . . . . . . . . . . . . . . . . . . . . . . . . . . . . . . . . . . . . . . . . . . . 147
77 70254 DRBD HARDWARE FAILURE . . . . . . . . . . . . . . . . . . . . . . . . . 154
78 70255 DRBD SYNCHRONISATION FAILURE . . . . . . . . . . . . . . . . . . 156
79 70256 RESOURCE ALLOCATION OR DE-ALLOCATION FAILURE . 159
80 70257 TAKING SCHEDULED CHECKPOINT OF IN-MEMORY DATA-BASE FAILED . . . . . . . . . . . . . . . . . . . . . . . . . . . . . . . . . . . . . . . . . . . 161
81 70258 BLADECENTER BLOWER SPEED OUT OF LIMIT. . . . . . . . . 163
82 70259 BLADECENTER INCOMPATIBLE HARDWARE CONFIGURA-TION . . . . . . . . . . . . . . . . . . . . . . . . . . . . . . . . . . . . . . . . . . . . . . . . . . 164
83 70260 BLADECENTER PLUG-IN UNIT FAILURE . . . . . . . . . . . . . . . 165
84 70261 BLADECENTER PLUG-IN UNIT TEMPERATURE OUT OF LIMIT166
85 70262 BLADECENTER PLUG-IN UNIT VOLTAGE OUT OF LIMIT . . 167
86 70263 BLADECENTER POWER SUPPLY FAILURE . . . . . . . . . . . . . 168
87 70264 EXTERNAL STORAGE SYSTEM FAILURE . . . . . . . . . . . . . . 169
88 70265 RECOVERY ACTIONS BANNED FOR MANAGED OBJECT . 170

6 DN70397367
LTE iOMS Alarms
Id:0900d80580995994Confidential
89 70267 EXTERNAL USER ACCOUNT VALIDATION FAILED . . . . . . . 172
90 70268 EXTERNAL LDAP FAILURE . . . . . . . . . . . . . . . . . . . . . . . . . . . 175
91 70269 INVALID ACTIVE SESSIONS . . . . . . . . . . . . . . . . . . . . . . . . . . 178
92 70270 BLADECENTER MANAGEMENT MODULE REDUNDANCY LOST181
93 70271 APPLICATION CONFIGURATION IS OUT OF ORDER . . . . . . 182
94 70272 FIBRE CHANNEL LINK FAILURE . . . . . . . . . . . . . . . . . . . . . . . 184
95 70273 REQUIRED SERVICE UNAVAILABLE . . . . . . . . . . . . . . . . . . . 185
96 70274 SWITCH CONFIGURATION LOAD FAILED . . . . . . . . . . . . . . . 186
97 70275 SWITCH CPU TEMPERATURE EXCEEDED . . . . . . . . . . . . . . 187
98 70276 SWITCH CPU UTILIZATION EXCEEDED . . . . . . . . . . . . . . . . 188
99 70277 SWITCH IMAGE CHECK FAILED . . . . . . . . . . . . . . . . . . . . . . . 189
100 70278 SWITCH MEMORY UTILIZATION EXCEEDED . . . . . . . . . . . . 190
101 70279 SWITCH PORT ERROR . . . . . . . . . . . . . . . . . . . . . . . . . . . . . . 191
102 70280 UNKNOWN SPECIFIC PROBLEM . . . . . . . . . . . . . . . . . . . . . . 193
103 70281 CABINET DOOR OPEN . . . . . . . . . . . . . . . . . . . . . . . . . . . . . . 196
104 70282 POWER DISTRIBUTION UNIT FAILURE . . . . . . . . . . . . . . . . . 197
105 70283 FIELD-REPLACEABLE UNIT UNAVAILABLE. . . . . . . . . . . . . . 199
106 70285 BUS ERROR . . . . . . . . . . . . . . . . . . . . . . . . . . . . . . . . . . . . . . . 200
107 70286 CPU MALFUNCTION . . . . . . . . . . . . . . . . . . . . . . . . . . . . . . . . 201
108 70287 CURRENT OUT OF LIMIT. . . . . . . . . . . . . . . . . . . . . . . . . . . . . 202
109 70288 EVENT LOGGING DISABLED . . . . . . . . . . . . . . . . . . . . . . . . . 203
110 70291 BOOTING FAILURE . . . . . . . . . . . . . . . . . . . . . . . . . . . . . . . . . 204
111 70294 SYSTEM FIRMWARE ERROR . . . . . . . . . . . . . . . . . . . . . . . . . 205
112 70295 POWER UNIT FAILURE . . . . . . . . . . . . . . . . . . . . . . . . . . . . . . 206
113 70296 PLATFORM SECURITY VIOLATION . . . . . . . . . . . . . . . . . . . . 207
114 70297 HIGH TEMPERATURE . . . . . . . . . . . . . . . . . . . . . . . . . . . . . . . 208
115 70299 MEMORY ERROR. . . . . . . . . . . . . . . . . . . . . . . . . . . . . . . . . . . 209
116 70301 BATTERY FAILURE . . . . . . . . . . . . . . . . . . . . . . . . . . . . . . . . . 210
117 70302 FAN SPEED TOO LOW. . . . . . . . . . . . . . . . . . . . . . . . . . . . . . . 211
118 70303 CLUSTER MANAGEMENT NODE DISK OUT OF SYNC . . . . . 212
119 70304 SHELF MANAGER UNAVAILABLE. . . . . . . . . . . . . . . . . . . . . . 214
120 70305 FIELD-REPLACEABLE UNIT TYPE MISMATCH . . . . . . . . . . . 216
121 70307 VOLTAGE OUT OF LIMIT . . . . . . . . . . . . . . . . . . . . . . . . . . . . . 217
DN70397367 7
LTE iOMS Alarms
Id:0900d80580995994Confidential
122 70309 ERROR IN MESSAGE TRANSFER PART 3 . . . . . . . . . . . . . . 218
123 70310 LICENSE MANAGER FAILED TO OBTAIN TARGET ID . . . . . 220
124 70311 LICENSE FILE REJECTED . . . . . . . . . . . . . . . . . . . . . . . . . . . 222
125 70312 SIGNALING GATEWAY/ SIGTRAN LDAP OPERATION ERROR. 223
126 70313 SIGNALING GATEWAY/SIGTRAN CONFIGURATION ERROR . . 225
127 70314 SIGNALING GATEWAY/SIGTRAN SNM SLM COMMUNICATION ERROR . . . . . . . . . . . . . . . . . . . . . . . . . . . . . . . . . . . . . . . . . . . . . . . . 234
128 70315 SIGNALING GATEWAY/SIGTRAN INTERNAL ERROR . . . . . 236
129 70316 LOCAL OR REMOTE APPLICATION SERVER [PROCESS] DOWN . . . . . . . . . . . . . . . . . . . . . . . . . . . . . . . . . . . . . . . . . . . . . . . . . 238
130 70317 SIGNALING GATEWAY SS7 NIF CONFIGURATION ERROR 242
131 70320 SCCP SIGNALING POINT INACCESSIBLE . . . . . . . . . . . . . . 243
132 70321 SIGNALING MESSAGE DROPPED. . . . . . . . . . . . . . . . . . . . . 244
133 70322 SCCP USER OUT OF SERVICE . . . . . . . . . . . . . . . . . . . . . . . 246
134 70323 SIGNALING POINT CONGESTED. . . . . . . . . . . . . . . . . . . . . . 247
135 70324 MESSAGE TRANSFER PART 3 POINT CODE CONGESTED 248
136 70325 INVALID MESSAGE RECEIVED BY MESSAGE TRANSFER PART 3. . . . . . . . . . . . . . . . . . . . . . . . . . . . . . . . . . . . . . . . . . . . . . . . . . . . . . 249
137 70326 SIGNALING SYSTEM 7 CONNECTION ERROR . . . . . . . . . . 252
138 70327 MESSAGE TRANSFER PART 3 POINTCODE INACCESSIBLE. . 254
139 70328 SWITCH CONFIGURATION OUT OF SYNC. . . . . . . . . . . . . . 256
140 70329 DIGITAL SIGNAL PROCESSOR FAILURE . . . . . . . . . . . . . . . 257
141 70330 DATABASE SYNCHRONIZATION FAILURE. . . . . . . . . . . . . . 259
142 70331 MAX CONNECTIONS TO DATABASE REACHED . . . . . . . . . 262
143 70332 UNABLE TO WRITE TO DISK . . . . . . . . . . . . . . . . . . . . . . . . . 265
144 70333 SIGNALING GATEWAY IUA NIF ERROR . . . . . . . . . . . . . . . . 268
145 70334 IUA ASSOCIATION / APPLICATION SERVER STATE CHANGE. 271
146 70335 ALARM TYPE PARAMETER HAS BEEN MODIFIED . . . . . . . 273
147 70336 ALARM RULE HAS BEEN MODIFIED . . . . . . . . . . . . . . . . . . . 274
148 70337 JUNIPER SWITCH OVER TEMPERATURE . . . . . . . . . . . . . . 275
149 70338 JUNIPER SWITCH FAN FAILURE. . . . . . . . . . . . . . . . . . . . . . 276
150 70339 JUNIPER SWITCH FIELD REPLACEABLE UNIT FAILURE . . 277
8 DN70397367
LTE iOMS Alarms
Id:0900d80580995994Confidential
151 70340 JUNIPER SWITCH POWER SUPPLY FAILURE . . . . . . . . . . . 278
152 70341 JUNIPER NEW MASTER IN VIRTUAL ROUTER REDUNDANCY PROTOCOL MODE . . . . . . . . . . . . . . . . . . . . . . . . . . . . . . . . . . . . . . . 279
153 70342 BLADECENTER: CHASSIS/SYSTEM MANAGEMENT FAILURE .280
154 70343 BLADECENTER: COOLING DEVICE FAILURE . . . . . . . . . . . . 281
155 70344 BLADECENTER: STORAGE MODULE FAILURE . . . . . . . . . . 282
156 70345 BLADECENTER: BLADE FAILURE . . . . . . . . . . . . . . . . . . . . . 283
157 70346 BLADECENTER: I/O MODULE FAILURE . . . . . . . . . . . . . . . . . 284
158 70347 DIGITAL SIGNAL PROCESSOR CORE FAILURE THRESHOLD EXCEEDED . . . . . . . . . . . . . . . . . . . . . . . . . . . . . . . . . . . . . . . . . . . . . 285
159 70348 BIDIRECTIONAL FORWARDING DETECTION SESSION DOWN287
160 70349 SIGNALING DYNAMIC CONFIGURATION FAILURE . . . . . . . 288
161 70350 DETECTED CLUSTER INTERNAL MESSAGING WITH UN-KNOWN ORIGIN . . . . . . . . . . . . . . . . . . . . . . . . . . . . . . . . . . . . . . . . . 291
162 70351 LICENSE STATE OFF FOR ACTIVE FEATURE . . . . . . . . . . . 292
163 70352 USER SPECIFIED CONFIGURATION FAILED DURING POST-CONFIG . . . . . . . . . . . . . . . . . . . . . . . . . . . . . . . . . . . . . . . . . . . . . . . . 294
164 70357 RUIM CERTIFICATE CANNOT BE MADE . . . . . . . . . . . . . . . . 296
165 70358 SSL CONNECTION CANNOT BE MADE BY RUIM . . . . . . . . . 298
166 70369 ALARM OVERFLOW CACHE FILE INACCESSIBLE . . . . . . . . 301
167 70374 FALLBACK OCCURED . . . . . . . . . . . . . . . . . . . . . . . . . . . . . . . 303
168 71000 PM FTP CONNECTION FAILED . . . . . . . . . . . . . . . . . . . . . . . . 305
169 71001 MEASUREMENT DATA NOT TRANSFERRED . . . . . . . . . . . . 306
170 71002 MEASUREMENT DATA ERROR . . . . . . . . . . . . . . . . . . . . . . . 307
171 71003 OMS MEASUREMENT DATA PROCESSING OVERLOAD . . . 308
172 71005 THRESHOLD MONITORING LIMIT EXCEEDED . . . . . . . . . . . 309
173 71006 WCEL THRESHOLD MONITORING LIMIT EXCEEDED . . . . . 311
174 71007 MEASUREMENT THRESHOLD MONITORING LIMIT EXCEEDED312
175 71008 ORACLE CLUSTER ALERT . . . . . . . . . . . . . . . . . . . . . . . . . . . 314
176 71009 ORACLE CLUSTER ASM GROUP IS GETTING FULL . . . . . . 316
177 71010 ORACLE CLUSTER COMPONENT IS FAULTY. . . . . . . . . . . . 317
178 71052 OMS FILE TRANSFER CONNECTION COULD NOT BE OPENED318

DN70397367 9
LTE iOMS Alarms
Id:0900d80580995994Confidential
179 71054 O&M MEDIATION FAILURE. . . . . . . . . . . . . . . . . . . . . . . . . . . 319
180 71057 NWI3 NOTIFICATION MISSING . . . . . . . . . . . . . . . . . . . . . . . 320
181 71058 NE O&M CONNECTION FAILURE . . . . . . . . . . . . . . . . . . . . . 321
182 71059 INCORRECT CONFIGURATION DATA IN LDAP . . . . . . . . . . 322
183 71060 EXTERNAL ETHERNET SWITCH CONNECTION FAILURE . 324
184 71061 INVALID IP CONFIGURATION . . . . . . . . . . . . . . . . . . . . . . . . 325
185 71062 IN-MEMORY DATABASE IS ERRONEOUSLY CONFIGURED 327
186 71063 IN-MEMORY DATABASE IS FAULTY . . . . . . . . . . . . . . . . . . . 328
187 71064 IN-MEMORY DATABASE SERVER IS FAULTY . . . . . . . . . . . 330
188 71065 IN-MEMORY DATABASE SWITCHED TO LESS RELIABLE REP-LICATION PROTOCO . . . . . . . . . . . . . . . . . . . . . . . . . . . . . . . . . . . . . 331
189 71066 UNEXPECTED CONNECTIONS TO IN-MEMORY DATABASE HAVING STANDBY ROLE . . . . . . . . . . . . . . . . . . . . . . . . . . . . . . . . . 333
190 71067 IN-MEMORY DATABASE DISK PARTITION PROBLEM DETECT-ED . . . . . . . . . . . . . . . . . . . . . . . . . . . . . . . . . . . . . . . . . . . . . . . . . . . . 335
191 71068 BLADESYSTEM FUSE OPEN . . . . . . . . . . . . . . . . . . . . . . . . . 336
192 71069 BLADESYSTEM CHASSIS POWER PROBLEM . . . . . . . . . . . 337
193 71070 BLADESYSTEM FAN FAILURE. . . . . . . . . . . . . . . . . . . . . . . . 338
194 71071 BLADESYSTEM INTERCONNECT FAILURE . . . . . . . . . . . . . 339
195 71072 BLADESYSTEM LINE VOLTAGE PROBLEM . . . . . . . . . . . . . 340
196 71073 BLADESYSTEM ONBOARD ADMINISTRATOR REDUNDANCY LOST . . . . . . . . . . . . . . . . . . . . . . . . . . . . . . . . . . . . . . . . . . . . . . . . . . 341
197 71074 BLADESYSTEM POWER CHASSIS NOT LOAD BALANCED 342
198 71075 BLADESYSTEM POWER ON FAILED. . . . . . . . . . . . . . . . . . . 343
199 71076 BLADESYSTEM POWER SHED AUTO SHUTDOWN. . . . . . . 344
200 71077 BLADESYSTEM POWER SUBSYSTEM NOT REDUNDANT . 345
201 71078 BLADESYSTEM POWER SUBSYSTEM OVERLOAD CONDITION346
202 71079 BLADESYSTEM POWER SUPPLY FAILURE . . . . . . . . . . . . . 347
203 71080 BLADESYSTEM REMOTE INSIGHT BATTERY FAILED . . . . 348
204 71081 BLADESYSTEM REMOTE INSIGHT ERROR . . . . . . . . . . . . . 349
205 71082 BLADESYSTEM REMOTE INSIGHT POWER OUTAGE. . . . . 350
206 71083 BLADESYSTEM TEMPERATURE OUT OF LIMIT . . . . . . . . . 351
207 71084 BLADESYSTEM UNKNOWN POWER CONSUMPTION. . . . . 352
208 71086 MAJOR SW UPGRADE DATA IMPORT FAILURE . . . . . . . . . 353

10 DN70397367
LTE iOMS Alarms
Id:0900d80580995994Confidential
209 71087 NTP TIME SYNCHRONISATION LEADING TO LDAP REPLICA-TION FAILURE . . . . . . . . . . . . . . . . . . . . . . . . . . . . . . . . . . . . . . . . . . . 354
210 71089 FAILING SIMPLE EXECUTIVE CORES THRESHOLD EXCEEDED356
211 71090 SIMPLE EXECUTIVE CORE FAILURE. . . . . . . . . . . . . . . . . . . 358
212 71094 FIBRE CHANNEL SWITCH STATUS CHANGE . . . . . . . . . . . . 360
213 71095 FIBRE CHANNEL SWITCH PORT STATUS CHANGE . . . . . . 362
214 71101 OMS ALARM UPLOAD FROM NE FAILED . . . . . . . . . . . . . . . 364
215 71102 ALARM FROM NE CORRUPTED . . . . . . . . . . . . . . . . . . . . . . . 365
216 71103 ID CONFLICT IN BTS O&M CONNECTION . . . . . . . . . . . . . . . 366
217 71104 NE CONNECTION REJECTED. . . . . . . . . . . . . . . . . . . . . . . . . 367
218 71105 BTS O&M TOTAL CONNECTION LIMIT EXCEEDED . . . . . . . 368
219 71107 INSECURE O&M CONNECTION . . . . . . . . . . . . . . . . . . . . . . . 369
220 71108 TRACE CONNECTION TO NE IS LOST. . . . . . . . . . . . . . . . . . 370
221 71110 STAGING AREA IN INCONSISTENT STATE . . . . . . . . . . . . . . 371
222 71111 SW SET ACTIVATION FAILED . . . . . . . . . . . . . . . . . . . . . . . . . 372
223 71112 SW SET POSTACTIVATION SCRIPT EXECUTION ERROR. . 373
224 71124 CMP CERT RETRIEVAL FAILURE . . . . . . . . . . . . . . . . . . . . . . 374
225 71125 CERTIFICATE EXPIRING . . . . . . . . . . . . . . . . . . . . . . . . . . . . . 375

DN70397367 11
LTE iOMS Alarms
Id:0900d80580995994Confidential
List of tablesTable 1 Valid and default attribute values of the NWI3 adapter configuration file .
60

12 DN70397367
LTE iOMS Alarms
Id:0900d80580995eacConfidential
Summary of changes
Summary of changesThis is the first issue of the document for RL40.

DN70397367 13
LTE iOMS Alarms 70001 CONFIGURATION OF SNMP MEDIATOR ISOUT OF ORDER
Id:0900d80580953935Confidential
1 70001 CONFIGURATION OF SNMP MEDIATOR IS OUT OF ORDERProbable cause: Corrupt data
Event type: Processing error
Default severity: Minor
MeaningConfiguration of the SNMP mediator contains values that are unacceptable.
The invalid part of configuration is ignored. This causes partial loss of functionality. The SNMP traps may be lost.
Identifying additional information fieldsConfiguration entry
• The name and value of the attribute that is out of order under the fssnmpMediatorName=1, fsFragmentId=SNMP, fsClusterId=ClusterRoot branch.
Additional information fields-
InstructionsUse the parameter management application to correct the configuration branch that is out of order. The Application Additional Information field displays the attribute or entry name that has an unacceptable value. For example, the following entry causes the alarm 70001, if xxx is not a hostname that can be resolved:
fssnmpNEId=xxx,fssnmpAttributeType=NEattrs,fssnmpMediatorName=1,fsFragmentId=SNMP,fsClusterId=ClusterRoot
Testing instructions section below provides instructions for creating the invalid entry.
ClearingThe alarm is cleared after the SNMP mediator configuration is restored and restarted. If the configuration is still out of order after that, the alarm is raised again.
Testing instructions
1. Open parameter management application and use it in the extended mode (select Browse > Mode > Extended Mode).
2. Add an invalid hostname to SNMP mediator’s configuration in the Configuration Directory:a) Expand the entry tree below fsFragmentID=SNMP: In the parameter manage-
ment application main window, click the arrow next to the SNMP fragment in the entry tree (fsFragmentID=SNMP).
b) Click the arrow next to fssnmpMediatorName=1 to further expand the entry tree.

14 DN70397367
LTE iOMS Alarms
Id:0900d80580953935Confidential
70001 CONFIGURATION OF SNMP MEDIATOR IS OUT OF ORDER
c) Select fssnmpAttributeType=NEattrs and click the arrow next to it to display the managed NEs.
d) Select Entry > New Child or right-click fssnmpAttributeType=NEattrs and select New Child.
e) In the Add new entry dialog box, enter any value for attribute fssnmpMOID and value xxx for fssnmpNEId.
f) Click OK and select Forced Activation in the Select Operation window.3. Restart /SNMPMediator.
Alarm 70001 with IAAI=”fssnmpNEId=xxx” is raised.

DN70397367 15
LTE iOMS Alarms 70002 INVALID SNMP TRAP COMMUNITY STRING
Id:0900d805809539b9Confidential
2 70002 INVALID SNMP TRAP COMMUNITY STRINGProbable cause: Corrupt data
Event type: Processing error
Default severity: Warning
MeaningThe SNMP Mediator has received an SNMP trap that contains an invalid trap community string, that is, the community string in the trap does not match the community string in SNMP Mediator's configuration. The community strings are passwords that are used to authenticate the senders of SNMP traps.
Identifying additional information fields-
Additional information fields
1. IP address of the SNMP agent that sent the trap2. The received trap community string3. Version of the used SNMP, possible values are:
• SNMPv1 • SNMPv2c
4. Object identifier of the received trap
Instructions
1. Check the IP address of the SNMP agent that sent the trap. The IP address is dis-played in the Identifying additional information fields field #1 of the alarm
2. Check the community string that was received in the trap. The community string is displayed in the Application Additional Information field #1 of the alarm.
3. Use the parameter management tool to check the community string that the SNMP Mediator expects. Attribute fssnmpCommunityString of the following entry defines the community string:fssnmpTrapSource=<agent ip / hostname>,fssnmpAttributeType=Commstrings,fssnmpMediatorName=1,fsFragmentId=SNMP,fsClusterId=ClusterRoot
4. Modify the community string in the LDAP directory to match the community string received in the trap, or configure the SNMP agent to use the community string that the SNMP Mediator expects. Note that if no community string has been specified for an IP address in the LDAP, the SNMP Mediator accepts all community strings from that address.
ClearingClear the alarm with the alarm management application after correcting the fault as pre-sented in Instructions.
16 DN70397367
LTE iOMS Alarms
Id:0900d805809539b9Confidential
70002 INVALID SNMP TRAP COMMUNITY STRING
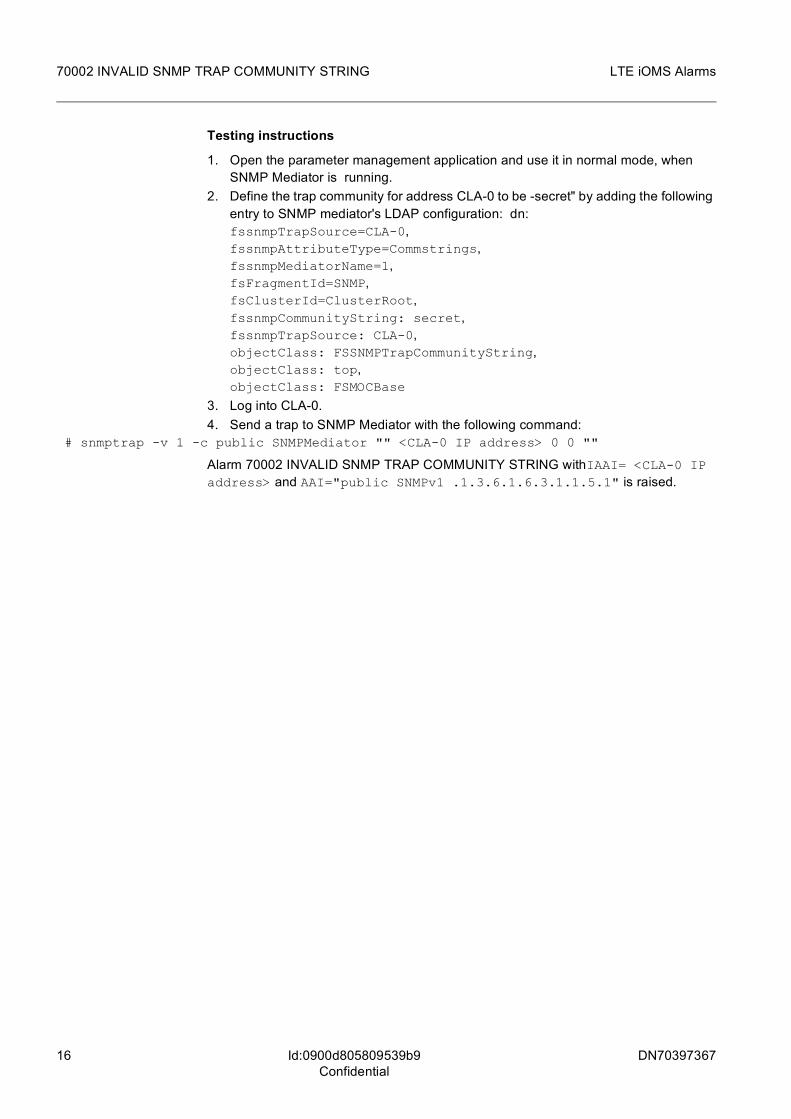
Testing instructions
1. Open the parameter management application and use it in normal mode, when SNMP Mediator is running.
2. Define the trap community for address CLA-0 to be -secret" by adding the following entry to SNMP mediator's LDAP configuration: dn:fssnmpTrapSource=CLA-0,fssnmpAttributeType=Commstrings,fssnmpMediatorName=1,fsFragmentId=SNMP,fsClusterId=ClusterRoot,fssnmpCommunityString: secret,fssnmpTrapSource: CLA-0,objectClass: FSSNMPTrapCommunityString,objectClass: top,objectClass: FSMOCBase
3. Log into CLA-0.4. Send a trap to SNMP Mediator with the following command:
# snmptrap -v 1 -c public SNMPMediator "" <CLA-0 IP address> 0 0 ""
Alarm 70002 INVALID SNMP TRAP COMMUNITY STRING withIAAI= <CLA-0 IP address> and AAI="public SNMPv1 .1.3.6.1.6.3.1.1.5.1" is raised.

DN70397367 17
LTE iOMS Alarms 70003 NO REPLY TO SNMP REQUEST
Id:0900d80580953a22Confidential
3 70003 NO REPLY TO SNMP REQUESTProbable cause: Corrupt data
Event type: Processing error
Default severity: Warning
MeaningSNMP Mediator has sent an SNMP request to an SNMP agent but it has not received a response.
• Example 1. A filter condition has been added for the authenticationFailure1.3.6.1.6.3.1.1.5.5 trap. Thus the following entry can be viewed by the parameter management tool:fssnmpV2TrapId=.1.3.6.1.6.3.1.1.5.5 fssnmpAttributeType=V2trapsfssnmpMediatorName=1,fsFragmentId=SNMP,fsClusterId=ClusterRoot The filter condition is defined by the attribute fssnmpFilterCondition. fssnmpFilterCondition may have, for example, the value (.1.3.6.1.2.1.1.1.0=*Linux*). See RFC 2254 for more information about the filter syntax.
Example 2. The SNMP Mediator receives the authenticationFailure trap that does not contain the value of variable .1.3.6.1.2.1.1.1.0. 3. The SNMP Mediator queries the value of .1.3.6.1.2.1.1.1.0 from the SNMP agent, but does not receive a response.
The SNMP is not able to handle the trap correctly, because it is not able to query or modify variables in the SNMP agent.
Additional information fieldsIP address of the SNMP agent that does not answer
Instructions
1. Check the IP address of the SNMP agent that sent the trap. The IP address is dis-played in the Application Additional Information field #1 of the alarm.
2. The net-snmp command line tools (snmpget, snmpset and so on) provided by the operating system may be used to verify the functionality of the SNMP agent.
3. To check the attributes defined for the SNMP agent, use the parameter manage-ment tool. The attributes are located under the following entry:fssnmpNEId=<agent IP / hostname>,fssnmpAttributeType=NEattrs,fssnmpMediatorName=1,fsFragmentId=SNMP,fsClusterId=ClusterRoot
4. Verify that the optional attribute fssnmpUDPPort has the value that the SNMP agent is listening to. The default value is 161.
5. Verify that the optional attribute fssnmpProtocolVersion is the same that the SNMP agent supports. The default value is V2c.
6. Verify that the optional attributes fssnmpReadCommString and fssnmpWriteCommString are the ones that the SNMP agent expects.

18 DN70397367
LTE iOMS Alarms
Id:0900d80580953a22Confidential
70003 NO REPLY TO SNMP REQUEST
ClearingClear the alarm with the alarm management application after correcting the fault.
Testing instructions
1. Open the parameter management tool and use it in normal mode, when SNMP Mediator is running.
2. Add entry "fssnmpV2Trapld=.1.3.6.1.6.3.1.1.5.1" under branch "fssnmpAttribute-Type=V2traps,fssnmpMediatorName=1,fsFragmentld=SNMP,fsClusterld=Cluster-Root"
3. Add attribute fssnmpFilterCondition to the entry created in step 2 and give it the value (.1.3.6.1.2.1.1.5.0=anystring) (The grammar for the filter condition is specified in http:/www.ietf.org/rfc/rfc2254.txt?number=2254)
4. Verify that there is no SNMP agent process such as snmpd running on CLA-0.#netstat -alp | grep snmptcp 0 0 *:smux *:*LISTEN 11017/snmpdudp 0 0 *:snmp *:*11017/snmpd# kill 11017root@CLA-0(GUI):~# netstat -alp | grep snmp
#5. Send a trap to SNMP Mediator with the following command (use the IP address of
CLA-0 as agent IP):# snmptrap -v 1 -c public SNMPMediator "" 192.168.128.1 0 0 ""
Alarm 70003 NO REPLY TO SNMP REQUEST is raised with AAI=192.168.128.1, because
• SNMP Mediator receives trap ".1.3.6.1.6.3.1.1.5.1", which does not contain the variable ".1.3.6.1.2.1.1.5.0" that is part of the filter condition.
• SNMP Mediator tries to get the value of ".1.3.6.1.2.1.1.5.0" from an SNMP agent running in address 192.168.128.1.
• SNMP Mediator does not get a response from 192.168.128.1, because no SNMP agent is running in the address.

DN70397367 19
LTE iOMS Alarms 70004 UNKNOWN SNMP TRAP
Id:0900d80580953a30Confidential
4 70004 UNKNOWN SNMP TRAPProbable cause: Corrupt data
Event type: Processing error
Default severity: Minor
MeaningThe SNMP Mediator has received an SNMP trap that it is unaware of. The trap is unknown to the SNMP Mediator, if :
1. The IP address of the SNMP agent that sends the trap is missing from the SNMP Mediator's configurationor
2. The OID (object identifier) of the trap is unknown to the SNMP Mediator.
In either case it may have the following effects:
1. Unknown traps may contain information that could be useful.2. Unnecessary traps waste network capacity.
Identifying additional information fields-
Additional information fields1. IP address of the SNMP agent that sent the trap
2. Version of the used SNMP, possible values:
• SNMPv1
• SNMPv2c
3. Object identifier of the received trap
Instructions
1. Check that the IP address of the SNMP agent is stored in the SNMP Mediator's con-figuration by using the following SCLI command:show config fsClusterId=ClusterRoot fsFragmentId=SNMP fssnmpMediatorName=1fssnmpAttributeType=NEattrsFollowing output is displayed showing the IP host details for NEId of the known SNMP-Agent:fssnmpNEId=<agent IP or hostname>,fssnmpAttributeType=NEattrs, fssnmpMediatorName=1,fsFragmentId=SNMP,fsClusterId=ClusterRoot
2. To check if alarm 70004 is raised or not, send a sample trap from the CLI of the cluster that contains an IP address of the SNMP agent whichis not listed in the above fragment.# snmptrap -v 2c -c public <Dedicated IP of SNMPMediator>:162 "".1.3.6.1.6.3.1.1.5.1 SNMP-COMMUNITY-MIB::snmpTrapAddress.0 = 127.0.0.1
3. Verify that alarm 70004 is raised using the following SCLI command:show alarm active filter-by specific-problem 70243
4. After verifying the alarm clear it using the following SCLI command:
20 DN70397367
LTE iOMS Alarms
Id:0900d80580953a30Confidential
70004 UNKNOWN SNMP TRAP
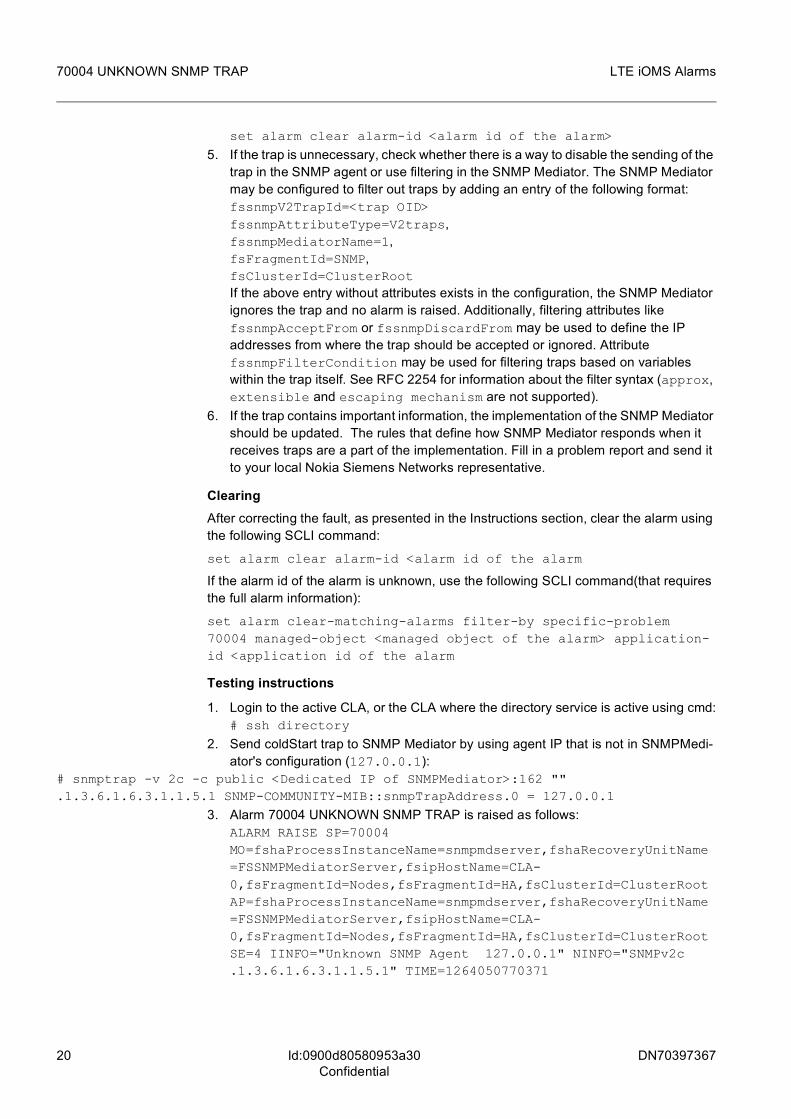
set alarm clear alarm-id <alarm id of the alarm>
5. If the trap is unnecessary, check whether there is a way to disable the sending of the trap in the SNMP agent or use filtering in the SNMP Mediator. The SNMP Mediator may be configured to filter out traps by adding an entry of the following format:fssnmpV2TrapId=<trap OID>fssnmpAttributeType=V2traps,fssnmpMediatorName=1,fsFragmentId=SNMP,fsClusterId=ClusterRootIf the above entry without attributes exists in the configuration, the SNMP Mediator ignores the trap and no alarm is raised. Additionally, filtering attributes like fssnmpAcceptFrom or fssnmpDiscardFrom may be used to define the IP addresses from where the trap should be accepted or ignored. Attribute fssnmpFilterCondition may be used for filtering traps based on variables within the trap itself. See RFC 2254 for information about the filter syntax (approx, extensible and escaping mechanism are not supported).
6. If the trap contains important information, the implementation of the SNMP Mediator should be updated. The rules that define how SNMP Mediator responds when it receives traps are a part of the implementation. Fill in a problem report and send it to your local Nokia Siemens Networks representative.
ClearingAfter correcting the fault, as presented in the Instructions section, clear the alarm using the following SCLI command:
set alarm clear alarm-id <alarm id of the alarm
If the alarm id of the alarm is unknown, use the following SCLI command(that requires the full alarm information):
set alarm clear-matching-alarms filter-by specific-problem 70004 managed-object <managed object of the alarm> application-id <application id of the alarm
Testing instructions
1. Login to the active CLA, or the CLA where the directory service is active using cmd:# ssh directory
2. Send coldStart trap to SNMP Mediator by using agent IP that is not in SNMPMedi-ator's configuration (127.0.0.1):
# snmptrap -v 2c -c public <Dedicated IP of SNMPMediator>:162 "" .1.3.6.1.6.3.1.1.5.1 SNMP-COMMUNITY-MIB::snmpTrapAddress.0 = 127.0.0.1
3. Alarm 70004 UNKNOWN SNMP TRAP is raised as follows:ALARM RAISE SP=70004 MO=fshaProcessInstanceName=snmpmdserver,fshaRecoveryUnitName=FSSNMPMediatorServer,fsipHostName=CLA-0,fsFragmentId=Nodes,fsFragmentId=HA,fsClusterId=ClusterRoot AP=fshaProcessInstanceName=snmpmdserver,fshaRecoveryUnitName=FSSNMPMediatorServer,fsipHostName=CLA-0,fsFragmentId=Nodes,fsFragmentId=HA,fsClusterId=ClusterRoot SE=4 IINFO="Unknown SNMP Agent 127.0.0.1" NINFO="SNMPv2c .1.3.6.1.6.3.1.1.5.1" TIME=1264050770371
DN70397367 21
LTE iOMS Alarms 70004 UNKNOWN SNMP TRAP
Id:0900d80580953a30Confidential
4. Verify that an alarm for the situation has been raised using the following SCLI command:show alarm active filter-by specific-problem 70004
5. Once the alarm is verified it needs to be cleared manually by usingthe following SCLI command:set alarm clear alarm-id <alarm id of the alarm found in step 4>

22 DN70397367
LTE iOMS Alarms
Id:0900d80580953a0cConfidential
70005 INCORRECT ALARM DATA
5 70005 INCORRECT ALARM DATAProbable cause: Invalid parameter
Event type: Processing error
Default severity: Major
MeaningThe alarm system has been requested to raise or clear an alarm with incorrect alarm data. One or more arguments provided with the request might have an invalid value or meaning:
• null • empty • too long • out of specified range • contain non-printable characters • have an incorrect format
An incorrect format in this case means, for example, that a character value was entered where a numeric value was expected. A special case of an incorrect format is if the quotes (") surrounding the value of an info field are missing from an alarm notification record in the syslog.
The alarm which is requested to be raised or cleared with an incorrect data is not pro-cessed further but the information is put as an additional info in this alarm. If the alarm number is unknown, then the actual fault for which the alarm has been raised is also left unknown.
Identifying additional information fields
1. Erroneous dataIdentifies the alarm data that was incorrect or that was completely missing. Only the name of the first field containing invalid data is mentioned here. Possible values are as follows: • aFamily: Alarm Family given in the data is not reasonable. • SP: Specific Problem given in the data is not known by the alarm system (in the
case when the options of supporting dynamic alarm types or raising the alarm 70280 instead of 70005 one for unknown specific problem are switched off in Alarm System configuration).
• MOId: Managed Object Id given in the data is not reasonable • MONEId: Network Element (where faulty Managed Object locates to) Id given in
the data is not reasonable. • applId: Application Id (of alarm application) given in the data is not reasonable • appNEId: Network Element (where alarm application locates to) Id given in the
data is not reasonable. • IAAI: Identifying Application Additional Info given in the data is not reasonable. • alarmTime: Alarm time given in the data is presented in a too long format, or is
in non-numerical format. • utcShift: Fix is provided and the shift between utc time and local time is correct. • PS: Perceived Severity given in the data is not reasonable • AAI: Additional Info given in the data is not reasonable.

DN70397367 23
LTE iOMS Alarms 70005 INCORRECT ALARM DATA
Id:0900d80580953a0cConfidential
• notificationId: Notification Id given in the data is not reasonable. • FC: Flow control given in the data is not reasonable. • ET: Event type given in the data is not reasonable. • EET: Extended event type given in the data is not reasonable. • OT: Object type given in the data is not reasonable. • length: The combined length of the string type fields (Managed Object Id, Appli-
cation Id, Application Additional Info, Identifying Application Additional Info) given in the data exceeds the maximum allowed value.
g In this case, both Application Id and Managed Object Id in the given data are con-sidered as invalid, as only the combined length is verified.
2. Original specific problem Specific problem (the alarm number) of the invalid alarm can also contain the original invalid value if this was the invalid field.
3. Original faulty Managed Object IdDistinguished name of the managed object that was given as the Managed Object Id in the invalid alarm. If the MOId itself was the incorrect data, then the value fsManagedObjectId=invalid,fsClusterId=ClusterRoot is displayed in this field.
4. Original Identifying Application Additional Info
Additional information fields1. Original Application Additional Info
InstructionsFill in a problem report and send it to your local Nokia Siemens Networks representative.
ClearingClear the alarm with the alarm management application after correcting the fault as pre-sented in Instructions, in other words, after sending the report to your local Nokia Siemens Networks representative.
Testing instructionsUse, for example, the alarm system command line interface (CLI) command flexalarm to send a request to raise or clear an alarm with a negative Specific Problem (with the exception of the value -5945 that has a special meaning).
For example:
$> flexalarm -raise -mo=<myMO> -ap=<myAP> -sp=-70002
where <myMO> and <myAP> have the correct format.
Since the -70002 Specific Problem is negative, alarm 70005 is raised.

24 DN70397367
LTE iOMS Alarms
Id:0900d80580953a33Confidential
70006 ACTIVE ALARM OVERFLOW
6 70006 ACTIVE ALARM OVERFLOWProbable cause: Resource at or nearing capacity
Event type: Quality of service
Default severity: Critical
MeaningThe maximum limit for the amount of active alarms has been reached in AlarmSystem database.
While the node has the maximum amount of active alarms, alarms originated from con-troller are rejected, alarms originated from OMS are cached in file. Clearing of the alarms is anyhow possible.
Additional information fields
1. The maximum number of alarms configured for this node, integer value.2. Managed Object Id
Distinguished name of the managed object that is the cause of the alarm. From the first alarm rejected due to overflow.
3. Specific Problem (alarm number) Further qualifies ProbableCause. From the first alarm rejected due to overflow.
4. Perceived Severity The severity of the alarm, from the first alarm rejected due to overflow. Possible values are: 0 Default2 Critical3 Major4 Minor5 Warning
5. Application Id Distinguished name of the application that is raising the alarm. From the first alarm rejected due to overflow.
InstructionsCheck active alarms on the overflowing node with alarm management application and correct them according to their instructions. If this is not possible or does not cause this alarm to be removed, fill in a Problem Report and send it to your local Nokia Siemens Networks representative.
ClearingThe system clears the alarm automatically when the fault has been corrected.
Testing instructions
1. Set a low maximum number (20) of active alarms in the Configuration Directory. The parameter to be set are as follows:fsParameterId=fsActiveAlarmsCapacity, fsAlarmProcessorConfigurationId=Default, fsAlarmProcessorId=AlarmProcessor1, fsFragmentId=AlarmProcessors, fsFragmentId=AlarmMgmt, fsClusterId=ClusterRoot.These parameters should have positive values (enter a positive value if it is needed).

DN70397367 25
LTE iOMS Alarms 70006 ACTIVE ALARM OVERFLOW
Id:0900d80580953a33Confidential
2. Restart the alarm processor by executing the following command: fshascli -r /Alarm-System
3. Raise the corresponding number of different alarms (the configured maximum limit - 2).
4. Raise another single alarm. Using the alarm management application, note that alarm 70006 has been raised with severity minor.
5. Raise another single alarm.6. Raise another single alarm. Using the alarm management application, note that
alarm 70006 severity has been changed to critical. From this point AlarmSystem starts rejecting controller originated alarms and caching OMS originated alarms in dedicated file.
7. Send couple of OMS and controller originated alarms.8. Manually cancel at least 5 of active alarms using alarm management application.9. Using the alarm management application, note that alarm 70006 has been cleared
and previously generated and cached OMS alarms are now present in active alarms list.
26 DN70397367
LTE iOMS Alarms
Id:0900d80580953a44Confidential
70007 AUTHENTICATION FAILURE IN ETHERNET DEVICE
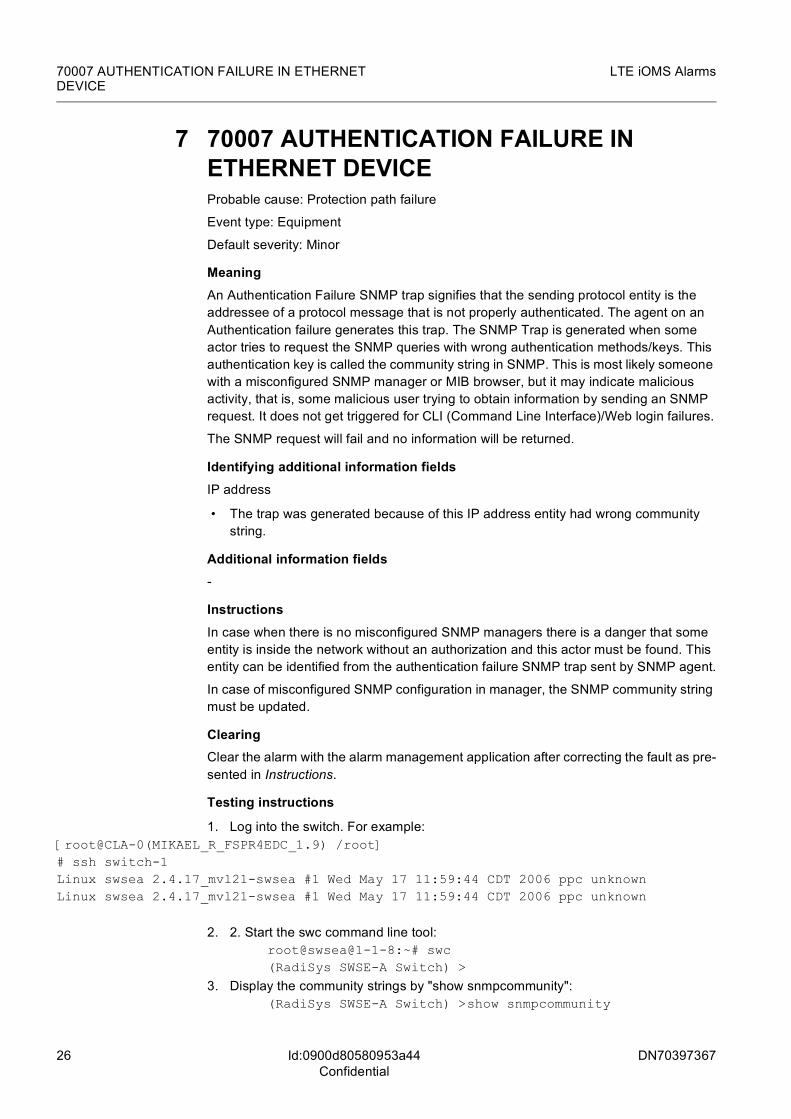
7 70007 AUTHENTICATION FAILURE IN ETHERNET DEVICEProbable cause: Protection path failure
Event type: Equipment
Default severity: Minor
MeaningAn Authentication Failure SNMP trap signifies that the sending protocol entity is the addressee of a protocol message that is not properly authenticated. The agent on an Authentication failure generates this trap. The SNMP Trap is generated when some actor tries to request the SNMP queries with wrong authentication methods/keys. This authentication key is called the community string in SNMP. This is most likely someone with a misconfigured SNMP manager or MIB browser, but it may indicate malicious activity, that is, some malicious user trying to obtain information by sending an SNMP request. It does not get triggered for CLI (Command Line Interface)/Web login failures.
The SNMP request will fail and no information will be returned.
Identifying additional information fieldsIP address
• The trap was generated because of this IP address entity had wrong community string.
Additional information fields-
InstructionsIn case when there is no misconfigured SNMP managers there is a danger that some entity is inside the network without an authorization and this actor must be found. This entity can be identified from the authentication failure SNMP trap sent by SNMP agent.
In case of misconfigured SNMP configuration in manager, the SNMP community string must be updated.
ClearingClear the alarm with the alarm management application after correcting the fault as pre-sented in Instructions.
Testing instructions
1. Log into the switch. For example: [root@CLA-0(MIKAEL_R_FSPR4EDC_1.9) /root]# ssh switch-1Linux swsea 2.4.17_mvl21-swsea #1 Wed May 17 11:59:44 CDT 2006 ppc unknownLinux swsea 2.4.17_mvl21-swsea #1 Wed May 17 11:59:44 CDT 2006 ppc unknown
2. 2. Start the swc command line tool:root@swsea@1-1-8:~# swc(RadiSys SWSE-A Switch) >
3. Display the community strings by "show snmpcommunity":(RadiSys SWSE-A Switch) >show snmpcommunity

DN70397367 27
LTE iOMS Alarms 70007 AUTHENTICATION FAILURE IN ETHERNETDEVICE
Id:0900d80580953a44Confidential
4. Exit the switch:(RadiSys SWSE-A Switch) >quitThe system has unsaved changes.Would you like to save them now? (y/n) nroot@swsea@1-1-8:~# exitlogoutConnection to switch-1 closed.
5. Perform an SNMP Get request with a valid community string:# snmpget -c tstcomm -v 2c switch-1 system.sysDescr.0SNMPv2-MIB::sysDescr.0 = STRING: RadiSys SWSE-A Switch
6. Perform an SNMP Get request with an invalid community string:# snmpget -c invalid -v 2c switch-1 system.sysDescr.0SNMPv2-MIB::sysDescr.0 = STRING: RadiSys SWSE-A SwitchAlarm 70007 will be raised after step 6 due to the invalid community string.
SNMP Com-munity Name
Client IP Address
Client IP Mask
Access Mode Status
tstcomm 192.168.128.1
0.0.0.0 Read Only Enable
com 192.168.128.1
0.0.0.0 Read Only Enable
28 DN70397367
LTE iOMS Alarms
Id:0900d80580953946Confidential
70008 SWITCH RESTARTED
8 70008 SWITCH RESTARTEDProbable cause: Equipment malfunction
Event type: Equipment
Default severity: Minor
MeaningThe alarm is triggered by a coldStart Simple Network Management Protocol (SNMP) trap sent by an Ethernet switch. The trap indicates that the sending switch is reinitialising itself and that its configuration may have been altered.
Identifying additional information fields1. IP address of the switch
Additional information fields2. Hardware platform.
• Contains the string value identifying the hardware platform, as given in the environ-ment variable $HW_PLATFORM in the running cluster.
InstructionsThe alarm can be safely ignored if restarting of the switch was intentional, for example, as a part of a system reboot. In case of a random, spontaneous restart it can be very difficult to determine the cause of the abnormal behavior.
Rule out possible operation errors such as accidental issuing of a restart command or physical removal and reinsertion of the switch. Note that depending on your hardware, there may be other functions - like fibre channel (FC) switches - integrated in the same blade with the Ethernet switch. In these cases, operations done with the FC switch may, as a side effect, cause restarting of the Ethernet switch.
Try to rule out possible power feed problems. For example:
1. If the chassis has a management unit - such as Advanced Management Module in IBM BladeCenter environments or Onboard Administrator in HP BladeSystem envi-ronments - log in to the active management unit and check the logs and power status of the chassis.
2. Watch for other alarms indicating a failing power stage.3. Watch for alarms indicating that other units are restarting in the same chassis at the
same time.4. Rule out the possibility of someone accidentally turning the power off of the whole
chassis.5. Rule out the possibility of a power cut in the general power supply.
Connect to the restarted switch and try to find any indication of problems. For example:
1. Check the switch log and look for log entries indicating hardware or software prob-lems: for example, buffer overflows, need to restart queue engine or bad sensor readings.
2. Check the switch statistics and look for signs of, for example, abnormally high error counter readings or buffering delays. These can be an indication of failing hardware.
3. Check also for abnormally high load figures: problems and/or poorly configured network (for example loops) can cause major switching problems. Make sure that you are using a correct/recommended switch software version. If there is a version

DN70397367 29
LTE iOMS Alarms 70008 SWITCH RESTARTED
Id:0900d80580953946Confidential
recommended by the platform, use it. If the cause of the spontaneous restart cannot be found, and the switch seems to be operating correctly, ignore the alarm. However, if the problem persists and/or reappears, replace the switch blade.
ClearingClear the alarm with an alarm management application after correcting the fault as pre-sented in Instructions.
Testing instructionsThe alarm can be triggered by restarting an Ethernet switch. Note that this is disruptive when executed in live environment. In addition, the test can cause 70009 SWITCH LINK DOWN alarms.
1. Select a switch to be restarted.2. Open a console connection to the switch and shut it down. Note that any unsaved
changes to the switch configuration will be lost.3. Pull the switch blade out of its slot and wait 30 seconds to make sure that the switch
memory banks are cleared.4. Push the switch blade back in.5. The switch will boot automatically and the system will raise the alarm.6. Clear the alarm.
Alternatively, if the chassis has a management unit that can be used to control the power state of chassis switches, you can use the active management unit for restarting the switch.

30 DN70397367
LTE iOMS Alarms
Id:0900d805809539c0Confidential
70009 SWITCH LINK DOWN
9 70009 SWITCH LINK DOWNProbable cause: Link failure
Event type: Equipment
Default severity: Major
MeaningA linkDown simple network management protocol (SNMP) trap triggers this alarm. It is an indication that an Ethernet switch port changes from up state to down state.
Once a port (or link) is in down state, it can't transport any traffic. This is not necessarily an error condition, but this can follow from a maintenance operation such as replacing a cable between two switches, or closing a switch port via management interface. A link may also go to down state if, for example, the host computer or switch at the other end of the link is shut down, restarted, or removed.
However, a spontaneous state change may indicate a serious failure, even though the system will typically tolerate these failures to some extent because of redundant net-working infrastructure. Note that a linkDown SNMP trap is paired with a linkUp SNMP trap that will trigger a cancelling of the alarm. For example, when replacing a computer node, one would first see the raising of this alarm when the replaced unit is shut down and the automatic cancelling of this alarm when the new blade is taken into use.
Identifying additional information fields1. Identifies which port has changed the state to down in Ethernet device.
• This value can be identified from interfaces.ifTable.ifEntry.ifIndex in the SNMP trap.
Additional information fields2. IP address of the switch.
• IP address of the Ethernet switch that has sent the SNMP trap.
3. Textual description of the interface.
• This value can be identified from interfaces.ifTable.ifEntry.ifDescr in the SNMP trap. Depending on the switch type, this field may not be present.
4. Type of the interface.
• This value can be identified from interfaces.ifTable.ifEntry.ifType in the SNMP trap. Depending on the switch type, this field may not be present.
5. String Value of interface state.
• Possible values are down or administratively down. Depending on the switch type, this field may not be present.
6. Hardware platform.
• Contains the string value identifying the hardware platform, as given in the environ-ment variable $HW_PLATFORM in the running cluster.
InstructionsAs explained above, this alarm does not typically indicate an error condition but relates to other maintenance actions or state changes in the system. However, if there is no clear reason for this alarm and especially if the alarm system does not cancel the alarm

DN70397367 31
LTE iOMS Alarms 70009 SWITCH LINK DOWN
Id:0900d805809539c0Confidential
automatically within reasonable time (depending on the state of the system) certain cor-rective actions should be performed.
Start by trying to detect whether the link should be up or not. Note that "link" refers to either hardwired Ethernet connections in the backplane/midplane or Ethernet cables between switches and other devices. During normal operation, all links between active switches and other devices should be up.
Try to rule out the possibility that a device at the other end of the link is down because of a power feed failure, for example.
In addition, check the administrative statuses of both ends of the link.
In a switch, this can be done using the management interface of the switch. Identify the link from the management interface. Check from the system logs and from the current configuration of the switch if, for example, a configuration change or an incorrect config-uration has forced the link to a down state. Refer to the documentation provided by the switch manufacturer, if necessary.
In a host computer, check the network connectivity. In Linux based systems you can use a command “ethtool <INTERFACE>” to get information from a physical layer of the interface connected to a switch. Give a command man ethtool to get help and usage information.
If both devices are up and running and their administrative states indicate that they should be able to connect, the next probable cause of a link being down is a loose cable. Check for a bad connectivity, especially if "link" refers to a cable. Even in a case of a backplane/midplane link, check that all relevant blades are firmly and correctly placed in their slots. If connectivity seems to be OK, try rebooting the connected devices.
If this does not help, and the system does not cancel the alarm, try to replace the com-ponents:
1. First replace the cable. Note that even in a case of a backplane/midplane link it is possible that the signal wires are broken. However, this is highly unlikely and back-plane failure and backplane replacement should be considered only as the last resort.
2. Next, if the other device is a CPU blade, replace that. Visually inspect the condition of both backplane connectors and the blade connectors: a twisted or broken con-nector pin can easily cause symptoms such as lost connectivity.
3. As the last option (excluding replacing the chassis backplane as explained above), replace the switch.
ClearingThe system clears the alarm automatically when the fault has been corrected.
Testing instructions
1. Select a CPU unit (for example, server blade) that can be shut down.2. Shut the unit down and pull it away from its slot.3. Observe the alarm.4. Push the unit back to its slot. 5. Observe cancelling of the alarm.

32 DN70397367
LTE iOMS Alarms
Id:0900d80580953a21Confidential
70011 NODE NOT RESPONDING
10 70011 NODE NOT RESPONDINGProbable cause: Equipment malfunction
Event type: Equipment
Default severity: Major
MeaningA physical computing node has not restarted despite of restart attempts. The node may be broken, is unable to restart, or is stuck.
Any important services/functions that are provided with an active-standby recovery group may have been taken over by other operational nodes. Services may be down if standby nodes are also down.
Identifying additional information fields-
Additional information fieldsAny further information if available.
InstructionsPerform the following steps to verify the state of the node:
1. Log into the cluster as root user. 2. Use the hwcli command to verify the state of the node. For example, the state of
the node /CLA-1 can be checked as follows:$ hwcli CLA-0
CLA-1: available (FlexiSvr CPI1 000157:0108 01.02)
3. Previous hwcli output shows that the CLA-0 node is physically available. The high availability services (HAS) of the system attempts, after about 30 minutes, to restart a failed node by issuing a power-off, power-on and restart sequence. If you do not want to wait for this, you can perform the power-off, power-on and restart sequence manually.For example:
$ hwcli --power off CLA-0ATTAMPTING TO POWER OFF NODECLA-0ARE YOU SURE YOU WANT TO PROCEED? yesPowering off CLA-0: OK$ hwcli --power on CLA-0Powering on CLA-0: OK$ hwcli --reset CLA-0ATTAMPTING TO RESET NODECLA-0ARE YOU SURE YOU WANT TO PROCEED? yesResetting CLA-0: OK
4. If the node does not start within a few minutes or the hwcli does not show that the node is available, check if the CPU board has any error lights on. If it does, you can try to restore the node into service by removing and re-inserting the node.

DN70397367 33
LTE iOMS Alarms 70011 NODE NOT RESPONDING
Id:0900d80580953a21Confidential
5. Contact your Nokia Siemens Networks representative even if these operations bring the node up, because it is possible that the computing node needs to be replaced or it may, for example, need a BIOS upgrade.
ClearingThe system clears the alarm automatically when the fault has been corrected.
Testing instructions
1. Power-off an operational unlocked node using hwcli. You can check the state of the node using fshascli. For example,
$ fshascli --state /AS-1/AS-1administrative(UNLOCKED) <== Unlockedoperational(ENABLED) <== Operationalusage(IDLE)procedural()availability()unknown(FALSE)alarm()$ hwcli --power off AS-1ATTEMPTING TO POWER OFF NODE AS-1ARE YOU SURE YOU WANT TO PROCEED? yes Powering off TA-A: OK
2. Wait for the node to change its state to DISABLED. By default, the alarm is raised about 10 minutes after the node has been declared faulty because attempts to restart it have failed. A faulty node has OFFLINE and FAILED in the availability status. For example,
$ fshascli --state /AS-1/AS-1administrative(UNLOCKED) <== Unlockedoperational(DISABLED) <== Not operationalusage(IDLE)procedural(INITIALIZING)availability(OFFLINE) <== Not yet failedunknown(FALSE)alarm(MAJOR,OUTSTANDING)$ sleep 11m$ fshascli --state /AS-1/AS-1administrative(UNLOCKED) <== Unlockedoperational(DISABLED) <== Not operationalusage(IDLE)procedural(NOTINITIALIZED)availability(OFFLINE,FAILED) <== FAILED!unknown(FALSE)alarm()
The alarm raising is also visible in the syslog as a message that begins as follows: ALARM RAISE SP=70011 . . .
34 DN70397367
LTE iOMS Alarms
Id:0900d80580953a21Confidential
70011 NODE NOT RESPONDING
3. The alarm is automatically cancelled when the node has successfully restarted. Issue a power-on for the node using hwcli and wait for the node restart to com-plete. For example,
$ hwcli --power on AS-1Powering on AS-1: OK$ sleep 3m$ fshascli --state /AS-1/AS-1administrative(UNLOCKED) <== Unlockedoperational(ENABLED) <== Operationalusage(IDLE)procedural()availability() unknown(FALSE)alarm()
The alarm cancellation is also visible in the syslog as a message that begins as follows:
ALARM CANCEL SP=70011 . . .

DN70397367 35
LTE iOMS Alarms 70012 SERVICE LEVEL DEGRADED BELOWTHRESHOLD
Id:0900d805809538d2Confidential
11 70012 SERVICE LEVEL DEGRADED BELOW THRESHOLDProbable cause: Equipment malfunction
Event type: Equipment
Default severity: Minor
MeaningThe number of active recovery units within the load sharing group has dropped below the predefined threshold. This can happen because of
1. management actions (number of recovery units or nodes have been locked)2. a series of node failures, or3. continuous failure to restart the recovery unit(s) within the load sharing group.
The alarm is informative by nature and it indicates that the load sharing group cannot maintain the acceptable service level.
Identifying additional information fields1. Recovery group, full name of the recovery group, /ISupervisionServer
Additional information fields2. System
InstructionsThe alarm does not require any particular corrective actions if it is preceded by either deliberate management action(s) or node failures. In the latter case separate alarms indicating the node failures would have been raised.
If, however, the reason is that the recovery units have failed and system is not able to restart the software, the problem is in the applications forming the load sharing group. Basically, there could be several reasons why an application cannot be restarted and therefore it is difficult to give exact or detailed instructions on how to deal with the situ-ation.
The first thing to be checked is the availability statuses of the failed recovery units. If RU's availability status has value failed, system has already attempted to restart it with no success. Note, that it is possible to try to restart the recovery unit also manually with e.g. HUI -r command.
If also manual restarting fails, the log writings should be detected: a typical cause for failing restart might be missing fragment, incorrect fragment content or even lack of some critical resources, e.g. the amount of available physical memory.
ClearingDo not clear the alarm. The system clears the alarm automatically when the number of operational RUs goes above the defined threshold.
Testing instructionsThis alarm can only be tested using a load sharing recovery group deployed on the network element (TestAppI shown below is for exposition only). A load sharing recovery group failure can be simulated by locking its recovery units.
1. Log into the cluster.

36 DN70397367
LTE iOMS Alarms
Id:0900d805809538d2Confidential
70012 SERVICE LEVEL DEGRADED BELOW THRESHOLD
2. In LDAP, change the fshaThreshold attribute under the entry fshaRecoveryGroupName=TestApplfsFragmentld=RecoveryGroupsfsFragmentld=HAfsClusterld=ClusterRootChange the value of the fshaThreshold attribute to a number less than or equal to the total number of recovery units in the recovery group.
3. Restart the cluster using:fshascli -rn /
4. Lock a few RU(s) using fshascli so that the number of serving RUs is less than the threshold. For example:
fshascli -In /AS-0/TestApplServer
The alarm is visible in the syslog as a message that begins as follow: ALARM RAISE SP=70012 ...ClearingAlarm system clears the alarm automatically if the recovery group gets locked or enough number of recovery units has UNLOCKED administrative state, ENABLED operational state, an empty procedural status, and "ACTIVE" role. The state of the managed object can be checked using fshascli. For example:
5. $ fshascli -s /AS-0/TestApplServer6. Note that after the testing you should unlock all the locked recovery units to restore
the initial situation. For example:fshascli -u /AS-0/TestApplServerfshascli -s /AS-0/TestApplServer
The alarm cancellation is also visible in the syslog as a message that begins as follow:ALARM CANCEL SP=70012 ...
DN70397367 37
LTE iOMS Alarms 70013 IN-MEMORY DATABASE PARTITION GET-TING FULL
Id:0900d805809538d0Confidential
12 70013 IN-MEMORY DATABASE PARTITION GETTING FULLProbable cause: Threshold crossed
Event type: Quality of service
Default severity: Major
MeaningThe datastore´s fill ratio has exceeded the user defined threshold. If the memory space is completely filled up before any corrective action has been done, applications using main memory database management system will notice the degradation in the level of service provided by the database management system. In the worst case, updates and inserts will be aborted and if the database management system´s internal work area (referred as temporary memory partition) is exhausted, also the queries to the datastore will fail.
The alarm implies that the datastore has grown too large to fit in the memory space that has been allocated for it. If the space is completely filled up, the service level of the main memory database management system will be degraded during the time when the fault is effective.
Identifying additional information fields1. The name of the database for which the alarm was raised
2. Is it question of temporary or permanent partition allocated for the database? Possible values:
• Temporary • Permanent
Additional information fields3. The used main memory database management system version
4. The size of the partition (in MB)
5. Current use of the partition (in MB)
6. The space requested to be allocated from the partition (in B)
7. The cause of the alarm. Possible values:
• User defined limit crossed • Partition full
InstructionsContact immediately your local Nokia Siemens Networks representative and provide them with the information from the fields of this alarm notification.
ClearingClear the alarm with the alarm management application after correcting the fault as pre-sented in Instructions.
Testing instructions
1. Insert data to the database until fill ratio threshold value is exceeded and the alarm is raised. For example, create and run an sql script that inserts rows into a table:

38 DN70397367
LTE iOMS Alarms
Id:0900d805809538d0Confidential
70013 IN-MEMORY DATABASE PARTITION GET-TING FULL
ttIsql -connStr "dsn=<DB_Name>" -f <file.sql>
2. You can set the fill ratio threshold value in sys.odbc.ini file with attribute PermWarn-Threshold. If the value is not given, the default value is 90%.
3. Check the TimesTen daemon process environment to locate the sys.odbc.ini file:strings /proc/<timestend pid>/environ |grep SYSODBCINIClearing:To clear the alarm, delete data from the database until fill ratio goes below the threshold value again and the alarm is cleared. The system clears the alarm auto-matically when the fault has been corrected.

DN70397367 39
LTE iOMS Alarms 70025 POSSIBLE SECURITY THREAT IN NETWORKELEMENT
Id:0900d8058095390cConfidential
13 70025 POSSIBLE SECURITY THREAT IN NETWORK ELEMENTProbable cause: Threshold crossed
Event type: Quality of Service
Default severity: Warning
MeaningThere is reason to suspect that someone is trying to intrude a network element. This condition emerges if there are too many wrong login attempts.
Someone may be trying to intrude a network element.
Identifying additional information fields-
Additional information fields-
InstructionsSecurity log data must be checked. Investigate specially login entries made just before alarm was raised.
ClearingClear the alarm with the alarm management application after correcting the fault.
Testing instructionsPrerequisites for the testing: Make an internal test account (i.e., to reside in the network element's LDAP server by using either the parameter management application or the fsuseradd CLI command) and set its password.
1. Log into a node with ssh and with a valid user account and password so that a session is successfully started.
2. Log out from the node.3. Log in with the same user account but with a wrong password the predefined
number of times (for the number, please see the file /etc/pam.d/ssh its row"/opt/Nokia_BP/lib/security/$ISA/PamAlarm.so file=/var/log/faillog alarmThreshold=<number> validfor=internal" in which the threshold is defined with the parameter alarmThreshold=<threshold_for_number_of_failed_logins>").The default value for the needed subsequent failed logins is 20. Make sure that there are no successful logins for the user between the failed ones.An alarm should be raised after the predefined number of failed logins has been reached.Check the alarm list with the alarm management application.Tip: You can also use Element Manager instead of ssh for the test.

40 DN70397367
LTE iOMS Alarms
Id:0900d80580953a5cConfidential
70030 DISK DATABASE IS GETTING FULL
14 70030 DISK DATABASE IS GETTING FULLProbable cause: Storage capacity problem
Event type: Processing error
Default severity: Major
MeaningThe disk storage area reserved for disk database is filling up.
The disk database is still fully operational. If the database fills up completely, its services cannot be used anymore.
Identifying additional information fields-
Additional information fields
1. Max size: the maximum size of database in KB2. Fill ratio: the fill ratio of the database
InstructionsThe actions to be done in order to avoid a completely full database are database-spe-cific, so contact your local Nokia Siemens Networks representative immediately and provide them with the information you obtained from the alarm notification's fields.
ClearingThe system clears the alarm automatically when the fault has been corrected.
Testing instructionsYou can test the alarm either by filling the database until the allocated space exceeds the fill ratio alarm limit, or by decreasing the fill ratio alarm limit under the current fill ratio of the database. You can also combine these two approaches.
• In the first approach, you simply create a dummy table to the database and insert rows to it until the fill ratio exceeds the fill ratio alarm limit (see attribute fsdbFillRatioAlarmLimit in the DB fragment in LDAP - Lightweight Directory Access Protocol).
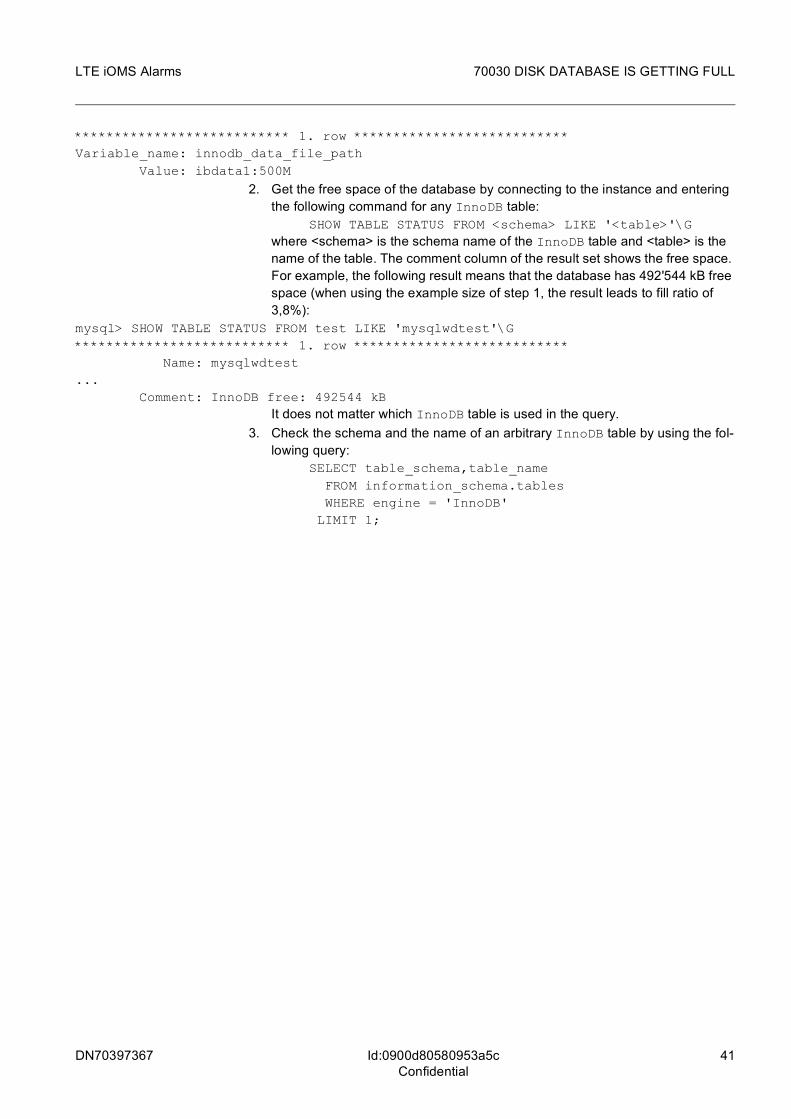
• In the second approach, you must use a parameter management tool to change the fsdbFillRatioAlarmLimit attribute of the DB fragment to a smaller value than the current fill ratio of the database. After this, you must restart the recovery group of the database (fshascli -r /<RG>). The current fill ratio of the database can be estimated as follows:1. Get the maximum size of the database either by checking the
innodb_data_file_path attribute from the MySQL instance configuration file (/var/mnt/local/MySQL_<DBName>/my.cnf) or by connecting to the instance and entering the following command:SHOW GLOBAL VARIABLES LIKE 'innodb_data_file_path'\GThe maximum size is the sum of the maximum size of each InnoDB data file listed in the value. For example, the following result means that the maximum size is 500 MB (512'000 KB):
DN70397367 41
LTE iOMS Alarms 70030 DISK DATABASE IS GETTING FULL
Id:0900d80580953a5cConfidential
*************************** 1. row ***************************Variable_name: innodb_data_file_path Value: ibdata1:500M
2. Get the free space of the database by connecting to the instance and entering the following command for any InnoDB table:
SHOW TABLE STATUS FROM <schema> LIKE '<table>'\Gwhere <schema> is the schema name of the InnoDB table and <table> is the name of the table. The comment column of the result set shows the free space. For example, the following result means that the database has 492'544 kB free space (when using the example size of step 1, the result leads to fill ratio of 3,8%):
mysql> SHOW TABLE STATUS FROM test LIKE 'mysqlwdtest'\G*************************** 1. row *************************** Name: mysqlwdtest... Comment: InnoDB free: 492544 kB
It does not matter which InnoDB table is used in the query. 3. Check the schema and the name of an arbitrary InnoDB table by using the fol-
lowing query:SELECT table_schema,table_name FROM information_schema.tables WHERE engine = 'InnoDB' LIMIT 1;
42 DN70397367
LTE iOMS Alarms
Id:0900d8058095390dConfidential
70064 SYSTEM BACKUP FAILED
15 70064 SYSTEM BACKUP FAILEDProbable cause: Application Subsystem Failure
Event type: Processing error
Default severity: Minor
MeaningThe execution of a system backup was interrupted because of a system failure.
System backup contains three parts: Database backup, LDAP directory backup, and file system backup. This is caused by a failure in either the database backup, LDAP direc-tory backup, or file system backup.
The system backup was not executed successfully and there is no up-to-date system backup available.
Identifying additional information fieldsPath to backup log file
Additional information fields2. The system backup phase where the error situation occurred. Possible values: File-SystemBackup, DataBaseBackup or LDAPDirBackup.
InstructionsYou can find more specified information about the fault in the syslog.
To check the syslog, enter:
# tail var/log/syslog
Make sure you have the required (root) privilege, to execute system backup.
To check that there is enough disk space available for system backup, enter:
# df- h
If necessary, free disk space by transferring previous backup copies to an external server, and by deleting backup files and other unnecessary files.
Check that the directory structure is correct.
Try to execute system backup again. If that does not help, contact your local Nokia Siemens Networks representative.
ClearingAfter correcting the fault as presented in the Instructions section, clear the alarm with the Alarm Browser.

DN70397367 43
LTE iOMS Alarms 70074 MAXIMUM THRESHOLD HAS BEENCROSSED
Id:0900d805809539a9Confidential
16 70074 MAXIMUM THRESHOLD HAS BEEN CROSSED Probable cause: Threshold Crossed
Event type: Quality of service
Default severity: Warning
MeaningA maximum threshold crossing, based on the threshold rule defined for the measure-ment result, has been detected. The seriousness of this alarm depends on the measure-ment(s) that reached the defined threshold value.
The precise effect of this alarm cannot be determined since the nature of the alarm depends on the measurement(s) involved in the measurement result.
Identifying additional information fields-
Additional information fields1. The name of the performance indicator (PI) that crossed the threshold boundary
InstructionsThe user has configured the threshold rules so that the events the user is interested in will be notified. As a result, any detailed instructions cannot be given.
Use the performance management application to get detailed information on the mea-surement(s) that caused this alarm.
ClearingThe system clears the alarm automatically when the measurement result goes down and is continuously held at the maximum threshold clearing level or below.
Testing instructionsDo not test this alarm. Testing this alarm would generate a huge flow of ethernet packets, which is not recommended in a live system.

44 DN70397367
LTE iOMS Alarms
Id:0900d805809539e1Confidential
70094 PLUG-IN UNIT FAILURE
17 70094 PLUG-IN UNIT FAILUREProbable cause: Equipment malfunction
Event type: Equipment
Default severity: Major
MeaningA fatal failure in the plug-in unit hardware has been detected.
There is a severe fault in the plug-in unit hardware. This may cause, for example, the plug-in unit to be automatically shutdown by the hardware management to prevent physical damage to it.
Identifying additional information fields1. Failure code: 1 to 7. The code corresponds to:
• 1) IERR (Internal Error) • 2) Thermal trip • 3) BIST (Built-in Self Test) failure • 4) POST (Power On Self Tests) hang • 5) Processor start-up failure • 6) Uncorrectable memory error • 7) HDD (Hard Disk Drive) fault.
Additional information fields2. eventData1: 0 to 255, internal event data
3. eventData2: 0 to 255, internal event data
4. eventData3: 0 to 255, internal event data
5. cabinet
6. chassis
7. slot
InstructionsReplace the plug-in unit.
g Replacing an operational disk drive may cause loss of data.
Refer to the hardware maintenance documentation for detailed replacing instructions.
Details of the faulty plug-in unit are found in the Additional information fields of the alarm (cabinet, chassis and slot).
ClearingClear the alarm with alarm management application after correcting the fault as pre-sented in Instructions.
Testing instructionsThis alarm is difficult to test, because the error condition cannot be simulated without risking permanent damage to the system.

DN70397367 45
LTE iOMS Alarms 70095 PLUG-IN UNIT TEMPERATURE OUT OF LIMIT
Id:0900d8058095396fConfidential
18 70095 PLUG-IN UNIT TEMPERATURE OUT OF LIMIT Probable cause: Equipment malfunction
Event type: Equipment
Default severity: Major
MeaningThe reading of a single Intelligent Platform Management Interface (IPMI) temperature sensor is out of limits.
A constant alarm indicates a severe temperature related problem. In the worst case, the plug-in unit may behave unexpectedly.
Identifying additional information fields1. Sensor number: 0 to 255
2. Severity: 0 to 255
Additional information fields3. Sensor name: max 25 chars / none
4. Reading: 0 to 255 (Celsius degrees)
5. Limit: 0 to 255 (Celsius degrees)
6. Cabinet
7. Chassis
8. Slot
Instructions
1. Verify unobstructed air flow through the cabinet and through the chassis. 2. If it is a question of a persistent major or critical alarm, replace the faulty plug-in unit.
Refer to the hardware maintenance documentation for detailed replacing instruc-tions.
3. If there are numerous alarms of this kind from several plug-in units, verify the air con-ditioning and temperature in the network element (NE) equipment room.The details of the faulty plug-in unit are found in the Additional information fields of the alarm (cabinet, chassis and slot).
ClearingThe system clears the alarm automatically when the fault has been corrected.
Testing instructionsDo no test this alarm, because the hardware fault is not reproducible without a risk to cause a permanent damage to the system.

46 DN70397367
LTE iOMS Alarms
Id:0900d8058095397fConfidential
70096 PLUG-IN UNIT VOLTAGE OUT OF LIMIT
19 70096 PLUG-IN UNIT VOLTAGE OUT OF LIMIT Probable cause: Power supply failure
Event type: Equipment
Default severity: Major
MeaningThe reading of a single Intelligent Platform Management Interface (IPMI) voltage sensor is out of limits.
If the alarm is set off constantly, there is a severe hardware problem and the plug-in unit may behave unexpectedly.
Identifying additional information fields1. Sensor number: 0 to 255
2. Severity: 0 to 255
Additional information fields3. Sensor name: max 25 charachters / none
4. Reading: 0 to 255 (volt)
5. Limit: 0 to 255 (volt)
6. Cabinet
7. Chassis
8. Slot
Instructions
1. Verify the network element (NE) power supply by checking any alarms from the power entry modules of the chassis.
2. Verify that the power failure is limited to a single plug-in unit.3. If the alarm is not automatically cancelled within 20 minutes or there are other indi-
cations of plug-in unit power failures, replace the plug-in unit.Refer to the hardware maintenance documentation for detailed replacing instruc-tions.
The details of the faulty plug-in unit are found in the Additional information fields of the alarm (cabinet, chassis and slot).
ClearingThe system clears the alarm automatically when the fault has been corrected.
Testing instructionsDo no test this alarm, because the hardware fault is not reproducible without a risk to cause a permanent damage to the system.

DN70397367 47
LTE iOMS Alarms 70097 FAN SPEED OUT OF LIMIT
Id:0900d80580953a0dConfidential
20 70097 FAN SPEED OUT OF LIMITProbable cause: Equipment malfunction
Event type: Equipment
Default severity: Major
MeaningThe reading of a single IPMI (Intelligent Platform Management Interface) fan sensor is out of limits. The rotation speed of a fan group is either low or abnormally high.
High speed may indicate a temperature-related problem which might eventually cause the hardware management to shut down the plug-in units automatically to prevent them from suffering physical damage.
Identifying additional information fields1. Sensor number: 0 to 255
2. Severity: 0 to 255
Additional information fields3. Sensor name: max 25 chars / none
4. Reading: 0 to 255 (percentage of expected fan speed)
5. Limit: 0 to 255 (percentage of expected fan speed)
Instructions
1. Check the air conditioning and temperature in the network element (NE) equipment room.
2. Verify unobstructed airflow through the cabinet and through the chassis. 3. Pull out the fan unit and check it for any obstructing items.
fIf the fan unit is out of operation for more than 30 seconds, hardware may become faulty. Make sure that the fan unit is not out of operation for more than 30 seconds.
4. If any obvious reason for the low or high rotation speed cannot be found, replace the fan unit.Refer to the hardware maintenance documentation for detailed replacing instruc-tions.
ClearingThe system clears the alarm automatically when the fault has been corrected.
Testing instructionsDo no test this alarm, because the hardware fault is not reproducible without a risk to cause a permanent damage to the system.
48 DN70397367
LTE iOMS Alarms
Id:0900d805809539a7Confidential
70098 EXCESSIVE NUMBER OF IPMI EVENTS
21 70098 EXCESSIVE NUMBER OF IPMI EVENTSProbable cause: Equipment malfunction
Event type: Equipment
Default severity: Warning
MeaningThe limit of the number of events from a single chassis in a specified time window has been exceeded. The event adapter discards events until the number of the events in the time window falls below the limit.
When the alarm is active, the Intelligent Platform Management Interface (IPMI) event adapter discards all events. After the alarm has been cancelled, the alarm database may not correspond to the actual alarm state. Note that some IPMI events may have been lost due to the incident.
Identifying additional information fields-
Additional information fields1. Limit: limit for number of events from one chassis during time window
2. Time window: the length of time window in seconds
3. Failure code: internal event data
InstructionsIf the alarm is not cleared automatically, contact your local Nokia Siemens Networks rep-resentative.
ClearingThe system clears the alarm automatically when the fault has been corrected.
Testing instructionsDo not test this alarm, because testing it will result in reduced quality of service.

DN70397367 49
LTE iOMS Alarms 70099 FIBRE CHANNEL CONTROLLER ERROR
Id:0900d80580953a10Confidential
22 70099 FIBRE CHANNEL CONTROLLER ERRORProbable cause: Equipment Malfunction
Event type: Equipment
Default severity: 3 Major
MeaningFibre channel (FC) controller errors exceed the threshold value. The fibre channel con-troller has been reset due to a severe communication deadlock.
If the problem is persistent it may affect the storage access reliability and performance.
Identifying additional information fields1. Adapter number
Additional information fields2. Error counter
InstructionsConsecutive alarms indicate FC-related hardware or firmware problems.
If the hardware is FlexiServer Blade Hardware, then follow these instructions:
1. If the alarm source is a single CPI (CPU Intel Type), check/replace it.2. Otherwise check/replace the Switch and Service Unit (SWSE).
See the corresponding adapter number in the information field 1. Adapter 0 is the SWSE in slot 8 and adapter 1 is the SWSE in slot 7.
3. Also check/replace the hard disk fibre channel (HDF) used.
If the hardware is IBM Blade Center, then follow these instructions:
1. Check that all fibre channel cables at the back of the chassis are properly connected to their corresponding fibre channel switch modules.
2. If all cables are connected and the problem persists, try replacing the fibre channel SFP transceiver and the fibre channel cable.
3. If the problem still persists, replace the affected fibre channel switch module in the chassis.
Refer to the hardware maintenance documentation for detailed replacement instruc-tions.
If the faulty component cannot be identified and the situation is not resolved, contact your local Nokia Siemens Networks representative.
ClearingClear the alarm with the alarm management application after correcting the fault as detailed in the Instructions.
Testing InstructionsThis alarm is difficult to test, because the hardware problem cannot be simulated.

50 DN70397367
LTE iOMS Alarms
Id:0900d80580953905Confidential
70100 FIBRE CHANNEL FRAME TRANSMISSION (CRC) ERROR
23 70100 FIBRE CHANNEL FRAME TRANSMIS-SION (CRC) ERRORProbable cause: Equipment malfunction
Event type: Equipment
Default severity: 5 Warning
MeaningThe threshold value of the fibre channel (FC) cyclic redundancy check (CRC) error counter has been exceeded. The system has detected an excessive number of cor-rupted FC frames within a server node. Resetting nodes commonly causes some frames to be incomplete, resulting in CRC errors. Note that in addition to equipment failure this alarm can result from an abruptly terminated frame transmission caused by a lower level FC operation (for example, a loop initialisation).
This alarm indicates that an excessive number of CRC errors has been detected. If the problem is persistent it may affect storage access reliability and performance.
Identifying additional information fields1. Adapter number
Additional information fields2. Error counter
InstructionsThis is an informative alarm which does not require any direct actions.
However, consecutive alarms might indicate FC-related hardware or firmware problems, especially if other FC related alarms are raised as well.
If the hardware is FlexiServer Blade Hardware, then follow these instructions:
1. If the alarm source is a single CPI (CPU Intel Type), check it and replace it if neces-sary.
2. Otherwise, check the Switch and Service Unit (SWSE) and replace it if necessary. See the corresponding adapter number in additional information field 1. Adapter 0 is the SWSE in slot 8 and adapter 1 is the SWSE in slot 7.
3. Also check/replace the hard disk fibre channel (HDF) used.
If the hardware is IBM Blade Center, then follow these instructions:
1. Check that all fibre channel cables at the back of the chassis are properly connected to their corresponding fibre channel switch modules.
2. If all cables are connected and the problem persists, try replacing the fibre channel SFP transceiver and the fibre channel cable.
3. If the problem still persists, replace the affected fibre channel switch module in the chassis.
Refer to the hardware maintenance documentation for detailed replacement instruc-tions.
If the faulty component cannot be identified and the situation is not resolved, contact your local Nokia Siemens Networks representative.
DN70397367 51
LTE iOMS Alarms 70100 FIBRE CHANNEL FRAME TRANSMISSION(CRC) ERROR
Id:0900d80580953905Confidential
ClearingThe system clears the alarm automatically when the fault has been corrected.
Testing InstructionsThis alarm is difficult to test, because the hardware problem cannot be simulated.

52 DN70397367
LTE iOMS Alarms
Id:0900d805809538f8Confidential
70101 FIBRE CHANNEL DEVICE ERROR
24 70101 FIBRE CHANNEL DEVICE ERRORProbable cause: Equipment malfunction
Event type: Equipment
Default severity: 3 Major
MeaningFibre channel (FC) device errors have exceeded the threshold value. The FC driver has detected unexpected behaviour such as direct memory access (DMA) underflow, device queue overflow, unknown command completion status, or unknown packet completion bits.
If the problem is persistent, it may affect storage access reliability and performance.
Identifying additional information fields1. Adapter number
Additional information fields2. Error counter
InstructionsConsecutive alarms indicate FC related hardware or firmware problems.
If the hardware is FlexiServer Blade Hardware, then follow these instructions:
1. If the alarm source is a single CPI (CPU Intel Type), check/replace it.2. Otherwise, check/replace Switch and Service Unit (SWSE). See the corresponding
adapter number in information field 1. Adapter 0 is the SWSE in slot 8 and adapter 1 is the SWSE in slot 7.
3. Also check/replace the hard disk fibre channel (HDF) used.
If the hardware is IBM Blade Center, then follow these instructions:
1. Check that all fibre channel cables at the back of the chassis are properly connected to their corresponding fibre channel switch modules.
2. If all cables are connected and the problem persists, try replacing the fibre channel SFP transceiver and the fibre channel cable.
3. If the problem still persists, replace the affected fibre channel switch module in the chassis.
Refer to the hardware maintenance documentation for detailed replacement instruc-tions.
If the faulty component cannot be identified and the situation is not resolved, contact your local Nokia Siemens Networks representative.
ClearingClear the alarm with the alarm management application after correcting the fault as detailed in the Instructions.
Testing InstructionsThis alarm is difficult to test, because the hardware problem cannot be simulated.

DN70397367 53
LTE iOMS Alarms 70102 FIBRE CHANNEL LINK ERROR
Id:0900d80580953908Confidential
25 70102 FIBRE CHANNEL LINK ERRORProbable cause: Equipment malfunction
Event type: Equipment
Default severity: 5 Warning
MeaningThe fibre channel (FC) link errors have exceeded the threshold value. The link errors result from basic signal-related problems, such as loss of signal, loss of synchronisation, and link timeout errors.
The recovery at link level disturbs the normal frame flow. If the problem is persistent, it may affect storage access reliability and performance.
Identifying additional information fields1. Adapter number
Additional information fields2. Error counter
InstructionsThis is an informative alarm and does not require direct actions.
However, consecutive alarms might indicate FC-related hardware or firmware problems, especially if other FC-related alarms are raised as well.
If the hardware is FlexiServer Blade Hardware, then follow these instructions:
1. If the alarm source is a single CPI (CPU Intel Type), check it and replace it if neces-sary.
2. Otherwise, check the Switch and Service Unit (SWSE) and replace it if necessary.See the corresponding adapter number in additional information field 1. Adapter 0 is the SWSE in slot 8 and adapter 1 is the SWSE in slot 7.
3. Check the hard disk fibre channel (HDF) and replace it if necessary.
If the hardware is IBM Blade Center, then follow these instructions:
1. Check that all fibre channel cables at the back of the chassis are properly connected to their corresponding fibre channel switch modules.
2. If all cables are connected and the problem persists, try replacing the fibre channel SFP transceiver and the fibre channel cable.
3. If the problem still persists, replace the affected fibre channel switch module in the chassis.
Refer to the hardware maintenance documentation for detailed replacement instruc-tions.
If the faulty component cannot be identified and the situation is not resolved, contact your local Nokia Siemens Networks representative.
Note that this alarm will appear if a node which has direct disk access has been bypassed in the FC loop - for example, with the swc tool of the SWSE. Follow the instruc-tions below to check whether some nodes in a loop have been bypassed:
1. Connect to the switch from /Directory:ssh switch-0
2. Check the status of the ports with the swc tool. For example:

54 DN70397367
LTE iOMS Alarms
Id:0900d80580953908Confidential
70102 FIBRE CHANNEL LINK ERROR
~# swc(RadiSys SWSE Switch) >show fibre port all
FC Admin PortPort Mode Status------- ------- ------- 1 Enable Up Inserted 2 Enable Up Inserted 3 Enable Up Inserted 4 Enable Up Inserted 5 Enable Up Inserted 6 Enable Up Inserted 9 Enable Up Inserted10 Disable Down Generic Bypass11 Enable Up Inserted12 Enable Up Inserted13 Enable Up Inserted14 Enable Up Inserted1f (Front Panel) Enable Down Manual Bypass2f (Front Panel) Enable Down Manual Bypass3f (Front Panel) Enable Down Manual Bypass4f (Front Panel) Enable Down Manual BypassHub Interconnect Enable Up Inserted
3. Exit the swc tool:(RadiSys SWSE Switch) >quit
4. Execute steps 1-3 for all switches in the network element (NE).
This alarm is automatically cleared when the bypassed node is added back into the loop.
ClearingThe system clears the alarm automatically when the fault has been corrected.
Testing instructionsThis alarm is difficult to test, because the error condition cannot be manually created.
DN70397367 55
LTE iOMS Alarms 70103 FIBRE CHANNEL TOTAL LOSS OF SYNC
Id:0900d80580953921Confidential
26 70103 FIBRE CHANNEL TOTAL LOSS OF SYNCProbable cause: Equipment malfunction
Event type: Equipment
Default severity: 5 Warning
MeaningThe fibre channel (FC) total loss of sync has exceeded the threshold value. The syn-chronisation of the input signal has failed at either bit or word level.
If the problem is persistent it may affect storage access reliability and performance.
Identifying additional information fields1. Adapter number
Additional information fields2. Error counter
InstructionsThis is an informative alarm and does not require any direct actions.
However, consecutive alarms might indicate FC-related hardware or firmware problems, especially if other FC-related alarms are raised as well.
If the hardware is FlexiServer Blade Hardware, then follow these instructions:
1. If the alarm source is a single CPI (CPU Intel Type), check it and replace it if neces-sary.
2. Otherwise, check the Switch and Service Unit (SWSE) and replace it if necessary.See the corresponding adapter number in the additional information field 1. Adapter 0 is the SWSE in slot 8 and adapter 1 is the SWSE in slot 7.
3. Check the hard disk fibre channel (HDF) and replace it if necessary.
If the hardware is IBM Blade Center, then follow these instructions:
1. Check that all fibre channel cables at the back of the chassis are properly connected to their corresponding fibre channel switch modules.
2. If all cables are connected and the problem persists, try replacing the fibre channel SFP transceiver and the fibre channel cable.
3. If the problem still persists, replace the affected fibre channel switch module in the chassis.
Refer to the hardware maintenance documentation for detailed replacement instruc-tions.
If the faulty component cannot be identified and the situation is not resolved, contact your local Nokia Siemens Networks representative.
ClearingThe system clears the alarm automatically when the fault has been corrected.
Testing instructionsThis alarm is difficult to test, because the hardware problem cannot be simulated.

56 DN70397367
LTE iOMS Alarms
Id:0900d805809539e2Confidential
70104 IPMI INTERNAL FAILURE
27 70104 IPMI INTERNAL FAILUREProbable cause: Equipment malfunction
Event type: Equipment
Default severity: Major
MeaningIPMI (Intelligent Platform Management Interface) internal failure has occurred.
The service level of the IPMI may have degraded. As a result, the hardware manage-ment monitoring and controlling functions may fail for the faulty plug-in unit in question.
Identifying additional information fields1. Failure code: 1 to 4. The code corresponds to:
• 1) Link failureHardware management segment controller (HWMSC) has lost communication with a blade on a single Intelligent Platform Management Bus (IPMB).
• 2) Communication lossHWMSC has lost total communication with a blade.
• 3) General IPMB failureIPMB was hung but the location of the failure is unknown.
• 4) Node IPMB failureIPMB was hung because of this node.
t The reason for the failure can also be seen on the liquid crystal display (LCD) of the chassis.
Additional information fields2. EventData1: byte, 0 to 255, internal event data
3. EventData2: byte, 0 to 255, internal event data
4. EventData3: byte, 0 to 255, internal event data
5. Cabinet
6. Chassis
7. Slot
Instructions
1. If the alarm is not cancelled automatically, replace the faulty plug-in unit if it can be identified.Refer to the hardware maintenance documentation for detailed replacing instruc-tions.
2. If the faulty plug-in unit cannot be identified, contact your local Nokia Siemens Networks representative.
The details of the faulty plug-in unit are found in the application additional info fields 5 to 7 of the alarm (cabinet, chassis and slot).
ClearingThe system clears the alarm automatically when the fault has been corrected.

DN70397367 57
LTE iOMS Alarms 70104 IPMI INTERNAL FAILURE
Id:0900d805809539e2Confidential
Testing instructionsThis alarm is difficult to test, because the error condition cannot be simulated.

58 DN70397367
LTE iOMS Alarms
Id:0900d80580953a1fConfidential
70107 SS7 / SIGTRAN PROTOCOL STACK CONFIG-URATION FAILURE
28 70107 SS7 / SIGTRAN PROTOCOL STACK CONFIGURATION FAILUREProbable cause: Software error
Event type: Processing error
Default severity: Critical
MeaningA protocol:
• MTP3-user adaptation layer (M3UA) • signalling connection control part (SCCP) • transaction capabilities application part (TCAP)
in the SS7/ SIGTRAN stack cannot be started properly due to an initialization or config-uration problem.
As a result, the SS7/SIGTRAN service is not available, neither SCCP nor TCAP traffic can be sent or received.
Identifying additional information fields-
Additional information fields1. Error: Possible values:
• AAI_ISS_INIT_NOK • AAI_SCCP_INIT_NOK • AAI_GTT_INIT_NOK • AAI_TCAP_INIT_NOK • AAI_M3UA_SCU_NOK • AAI_SCCP_SCU_NOK • AAI_TCAP_CONFIG_TRID_NOK
InstructionsSee the possible error in the Additional Information fields and proceed according to the respective procedure.
AAI_ISS_INIT_NOK: Initialization of SS7/SIGTRAN stack has failed.
• AAI_SCCP_INIT_NOKSCCP initialization has failed. For further information, see the error logs in the syslog and the contents of /var/log/ss7nmfamily.log or /var/log/ss7lmfamily.log in the node in which the alarm was raised.1. Check the value of SS7 standard in the SS7/SIGTRAN load balancing service
data in the (lightweight directory access protocol) LDAP tree.2. Check that the value of the MinSCCPReferenceNbr is lower than the value of
the MaxSCCPReferenceNbr in the configuration data of the process which raised the alarm in the LDAP.
DN70397367 59
LTE iOMS Alarms 70107 SS7 / SIGTRAN PROTOCOL STACK CONFIG-URATION FAILURE
Id:0900d80580953a1fConfidential
• AAI_GTT_INIT_NOKInitialization of GlobalTitleTranslation library has failed. For further information, see the error logs in the syslog and the contents of /var/log/ss7nmfamily.log or /var/log/ss7lmfamily.log in the node in which the alarm was raised.1. Check the SS7 configuration in the LDAP.
• AAI_TCAP_INIT_NOKTCAP initialization has failed. For further information, see the error logs in the syslog and the contents of /var/log/ss7lmfamily.log in the node in which the alarm was raised. 1. Check the value of SS7 standard in the SS7/SIGTRAN load balancing service
data in the LDAP. • AAI_M3UA_SCU_NOK
M3UA configuration has failed. For further information, see the error logs in the syslog and the contents of /var/log/ss7nmfamily.log or /var/log/ss7lmfamily.log in the node in which the alarm was raised.1. Check the SS7 configuration in the LDAP.
• AAI_SCCP_SCU_NOKSCCP configuration has failed. For further information, see the error logs in the syslog and the contents of /var/log/ss7nmfamily.log or /var/log/ss7lmfamily.log in the node in which the alarm was raised.1. Check the SS7 configuration in the LDAP.
• AAI_TCAP_CONFIG_TRID_NOKTCAP configuration has failed. For further information, see the error logs in the syslog and the contents of /var/log/ss7nmfamily.log or /var/log/ss7lmfamily.log in the node in which the alarm was raised.1. Check that the value of the MinTransactionId is lower than the value of the Max-
TransactionId in the configuration data of the process which raised the alarm in the LDAP.
If the configuration data is correct but the alarm occurs, contact your Nokia Siemens Networks representative and provide them with the information gathered by the follow-ing steps:
1. Set tracing of all protocols in the SS7/Debug fragment on (attribute value 1).2. Lock the SS7/Sigtran recovery groups (RGs).3. Unlock the SS7/Sigtran RGs.4. Check if the following files exist in the node in which the alarm was raised
/var/log/ss7nmlog.log /var/log/PMhand.log/var/log/ss7lmlog.log /var/log/ss7nmfamily.log/var/log/ss7lmfamily.log
5. If the files can be found, copy them and attach them to the problem report. Include in the report also the syslog information from the time the RGs were started.
ClearingClear the alarm with alarm management application, after correcting the fault as pre-sented in Instructions.

60 DN70397367
LTE iOMS Alarms
Id:0900d80580953947Confidential
70110 CONFIGURATION OF NWI3 ADAPTER IS OUT OF ORDER
29 70110 CONFIGURATION OF NWI3 ADAPTER IS OUT OF ORDERProbable cause: Configuration or customizing error
Event type: Processing error
Default severity: Minor
MeaningThe configuration file of NWI3 adapter contains invalid attribute values. Depending on the release, the configuration is stored only in files or files and LDAP (Lightweight Direc-tory Access Protocol).
The system ignores the invalid parameters and uses the default values or the closest acceptable value. For example, the value 2000 is greater than the highest acceptable value (1440) for heartbeatPeriod (see the table in the Instructions) and causes this alarm. In this case, 1440 would be used as the heartbeatPeriod.
Identifying additional information fieldsAttribute name: name of the attribute that has an invalid value
Additional information fieldsFile path: the path of the file that includes invalid attribute values; or LDAP branch: the LDAP branch that includes invalid attribute values
Instructions
1. Correct the invalid attribute value. The attribute name is displayed in the Identifying additional information field. The name of the configuration file is displayed in the Additional information field. The attributes that can cause this alarm are mainly stored in file /var/opt/Nokia/SS_Nwi3Adapter/config/nwi3mdcorba.ini or LDAP branch fsFragmentId=mediator, fsFragmentId=NWI3, fsClusterId=ClusterRoot. The valid as well as default values of these attributes are presented in the table below. The attribute names in LDAP are prefixed with fsnwi3.
Name Type Default
(fsnwi3)takeIntoUseNext boolean: (0=false,1=true) in nwi3mdcorba.ini and (false,true) in LDAP
0
(fsnwi3)registrationServiceIOR string, a valid IOR to NetAct’s registration service
empty string
(fsnwi3)heartbeatPeriod short: [0..1440] minutes, granularity:1 minute
15
(fsnwi3)reRegistrationPeriod short: [15..1440] minutes, granularity:1 minute
60
(fsnwi3)registrationRetryBasePeriod short: [5..240] minutes, gran-ularity:1 minute
15
Table 1 Valid and default attribute values of the NWI3 adapter configuration file

DN70397367 61
LTE iOMS Alarms 70110 CONFIGURATION OF NWI3 ADAPTER IS OUTOF ORDER
Id:0900d80580953947Confidential
2. This alarm can also be caused by the parameter mediatorSessionManagerIOR located in file /var/opt/Nokia/www/SessionManager_V1.ior.Restart the NWI3 adapter to generate mediatorSessionManagerIOR into SessionManager_V1.ior. In normal conditions, the restart generates the param-eter with valid value.
3. If the problem is the results from the parameter systemID in file /var/opt/Nokia/www/systemid.txt, the probable cause is that the file systemid.txt is missing. The value in systemID should be the same as in the file /etc/cluster-id. Copy /etc/cluster-id to /var/opt/Nokia/www/systemid.txt and restart the NWI3 adapter.
ClearingClear the alarm with alarm management application after correcting the fault as pre-sented in Instructions.
Testing instructions
1. If file /var/opt/Nokia/SS_Nwi3Adapter/config/nwi3mdcorba.ini exists, set the following content to it (no value for registrationServiceIOR and takeIntoUseNext=1):
[DN:N3CF-1]objectClassVersion=1N3CFId=1objectClass=N3CFconfigurationActive=0takeIntoUseNext=1registrationServiceIOR=registrationServiceUsername=NemuadminregistrationServicePassword=nemuuserheartbeatPeriod=15reRegistrationPeriod=60registrationRetryBasePeriod=15retryRandom=5rePublicationPeriod=3getPublicationServiceRetryPeriod=15userLabel=
2. If branch fsFragmentId=mediator, fsFragmentId=NWI3, fsClusterId=ClusterRoot exists in the LDAP, use parameter management application for creating a new child to the branch. Enter the following attributes in the Add New Entry dialog:
(fsnwi3)retryRandom short: [5..240] minutes, gran-ularity:1 minute
5
(fsnwi3)rePublicationPeriod short [1..60] minutes, granu-larity:1 minute
3
(fsnwi3)getPublicationServiceRetry-Period
short [1..60] minutes, granu-larity:1 minute
15
Name Type Default
Table 1 Valid and default attribute values of the NWI3 adapter configuration file

62 DN70397367
LTE iOMS Alarms
Id:0900d80580953947Confidential
70110 CONFIGURATION OF NWI3 ADAPTER IS OUT OF ORDER
• fsnwi3N3CFId=1 • takeIntoUseNext=1
3. Restart NWI3Adapter.
If file nwi3mdcorba.ini was modified in step 1, alarm 70110 with IAAI= registration-ServiceIOR and AAI=/var/opt/Nokia/SS_Nwi3Adapter/config/nwi3mdcorba.ini is raised. If LDAP was modified in step 1, alarm 70110 with IAAI= fsnwi3registrationServiceIOR and AAI= fsnwi3N3CFId=1,fsFragmentId=mediator,fsFragmentId=NWI3,fsClus-terId=ClusterRoot is raised.

DN70397367 63
LTE iOMS Alarms 70111 FAILED TO CREATE NETACT CONNECTION
Id:0900d80580953954Confidential
30 70111 FAILED TO CREATE NETACT CON-NECTIONProbable cause: Connection establishment error
Event type: Communications
Default severity: Major
MeaningThe NWI3 adapter failed to register to Nokia NetActTM.
NetAct cannot subscribe to notifications or be used for managing the network element (NE) via NWI3.
Additional information fieldsDepending on the release
1. N3CFId: the naming attribute of the active N3CF instance in file /var/opt/Nokia/SS_Nwi3Adapter/config/nwi3mdcorba.ini; or Distin-guished name of the active N3CF instance in LDAP.
Instructions
1. If file /var/opt/Nokia/SS_Nwi3Adapter/config/nwi3mdcorba.ini exists:a) Make sure that the NetAct Registration Service IOR (parameter registrationSer-
viceIOR) is filled in the file and check the correctness of the IOR. The command printIOR can be used for viewing the IP address and port included in the IOR.
b) Verify that there is a valid username (parameter registrationServiceUsername) and password (registrationServicePassword) to the registration service of NetAct in file /var/opt/Nokia/SS_Nwi3Adapter/config/nwi3mdcorba.ini.
c) Check the value of the takeIntoUseNext parameter in the nwi3mdcorba.ini file. The value of the parameter in an active section should be 1, and the value of the configurationActive parameter should also be 1. The system sets the value of the configurationActive parameter automatically to 1 when a parameter set is taken into use.
2. If file /var/opt/Nokia/SS_Nwi3Adapter/config/nwi3mdcorba.ini does not exist and NWI3 adapter's configuration is stored under branch fsFragmen-tId=mediator, fsFragmentId=NWI3, fsClusterId=ClusterRoot in the LDAP:a) Verify that there is an LDAP entry fsnwi3N3CFId=<id>>,fsFragmentId=media-
tor, fsFragmentId=NWI3 with attribute fsnwi3takeIntoUseNext=true, which defines the active attribute set.
b) Make sure that the NetAct Registration Service IOR (attribute fsnwi3registrationServiceIOR) has been specified for the active set and check the correctness of the IOR. Command printIOR can be used for viewing the IP address and port included in the IOR.
c) If attributes fsnwi3NEAccountUsername and fsnwi3NEAccountPassword exist under branch fsFragmentId=security, fsFragmentId=NWI3, they are used for NetAct registration. Verify that they are valid.
d) If attributes fsnwi3NEAccountUsername and fsnwi3NEAccountPassword do not exist under branch fsFragmentId=security, fsFragmentId=NWI3, the initial

64 DN70397367
LTE iOMS Alarms
Id:0900d80580953954Confidential
70111 FAILED TO CREATE NETACT CONNECTION
username (attribute fsnwi3initialRegistrationUsername) and password (fsnwi3initialRegistrationPassword) defined in the active set are used for NetAct registration. Verify that they are valid.
3. Verify that NetAct is up and running and check the connection between the NE and NetAct. Ping NetAct from the node where the NWI3 adapter is running: ping -I <node's external IP address> <NetAct's IP (see step 1)>.
4. Check that the NetAct hostname is configured in the external domain name system (DNS) in use.
ClearingThe alarm system clears the alarm automatically after the fault has been corrected.
Testing instructions
1. If file /var/opt/Nokia/SS_Nwi3Adapter/config/nwi3mdcorba.ini exists:a) Set the following content to it (a valid registrationServiceIOR of a non-existent
NetAct object) and takeIntoUseNext=1):[DN:N3CF-1]objectClassVersion=1N3CFId=1objectClass=N3CFconfigurationActive=0takeIntoUseNext=1registrationServiceIOR=IOR:000000000000002449444c3a4e5749332f526567697374726174696f6e536572766963655f56313a312e3000000000010000000000000064000102000000000e3137322e32312e3232302e3631009c3f0000002400504d43000000040000000a2f4e65744163745253002020000000084e65744163745253000000025649530300000005000507017d00000000000000000000080000000056495300registrationServiceUsername=NemuadminregistrationServicePassword=nemuuserheartbeatPeriod=15reRegistrationPe-riod=60registrationRetryBasePeriod=15retryRandom=5rePublicationPeriod=3getPublicationServiceRetryPeriod=15userLabel=
b) Verify that NetAct's registration service is not running in the IP address and port defined by registrationServiceIOR.
c) Restart NWI3Adapter.Alarm 70111 with AAI=1 is raised.
2. If branch fsFragmentId=mediator, fsFragmentId=NWI3, fsClusterId=ClusterRoot exists in the LDAP:a) Use parameter management tool for creating a new child to the branch. Enter
the following attributes in the Add New Entry dialog: • fsnwi3N3CFId=1 • takeIntoUseNext=1
• fsnwi3registrationServiceIOR= IOR:000000000000002449444c3a4e5749332f526567697374 726174696f6e536572766963655f56313a312e300000000001 0000000000000064000102000000000e3137322e32312e3232 302e3631009c3f0000002400504d43000000040000000a2f4e 65744163745253002020000000084e65744163745253000000 025649530300000005000507017d000000000000000000000 80000000056495300
b) Restart NWI3Adapter.Alarm 70111 with AAI="fsnwi3N3CFId=1,fsFragmentId=mediator,fsFragmen-tId=NWI3,fsClusterId=ClusterRoot" is raised.

DN70397367 65
LTE iOMS Alarms 70112 CAPACITY USAGE WARNING LIMIT ISREACHED
Id:0900d80580953a09Confidential
31 70112 CAPACITY USAGE WARNING LIMIT IS REACHEDProbable cause: Threshold Crossed
Event type: Quality of Service
Default severity: Warning
MeaningThis is an informative alarm which indicates that a capacity usage level of a licenced feature has reached one of its predefined warning limits: the capacity usage warning limit or the full capacity limit.
For each warning limit there is a corresponding alarm severity. The alarm severity increases as the warning limit becomes closer to the full capacity limit.
If a warning limit with value less than 100% is reached, this alarm has no effect. If the full capacity limit (100%) is reached, the application implementing the licenced feature may stop operating.
Identifying additional information fields1. Feature code
Additional information fields2. Warning limit
InstructionsIf the feature requires additional capacity, install a new licence.
1. If it is necessary to increase the capacity, a new licence has to be installed. To install a licence execute the following command:lmcli importLicence <LicenceFilename> where <LicenceFilename> is a fully qualified filename of the licence file to be installed.
2. In case of a false alarm, fill in the problem report and send it to your local Nokia Siemens Networks representative.
ClearingThe alarm is cleared automatically, if a new licence with additional capacity has been installed or the capacity usage has been decreased.
Otherwise, manual clearing is required; clear the alarm with alarm management appli-cation after correcting the fault as presented in Instructions.
Testing instructions
1. Install a capacity licence for a licenced feature by executing the following command:lmcli importLicence <LicenceFilename>
where <LicenceFilename> is a fully qualified filename of the licence file to be installed.
2. Set capacity warning limits for the feature by executing the following command:lmcli setCapacityFeatureWarningLimits <FeatureCode> [-w <warning> -s <severity> ]...

66 DN70397367
LTE iOMS Alarms
Id:0900d80580953a09Confidential
70112 CAPACITY USAGE WARNING LIMIT IS REACHED
where <FeatureCode> is a feature code of the feature to be tested, <warning> is a warning limit to be tested (in percentage) <severity> is a severity of an alarm that will be raised when capacity usage reached <warning> limit. All arguments are mandatory.
3. Start application (that implements the feature) and increase the load on the applica-tion so that the capacity usage will reach or exceed one of its warning limits (set during the previous step). When capacity usage crosses the limit, alarm 70112 will be raised.
4. To clear the alarm, decrease the load on the application so that capacity usage will decrease below the warning limit.

DN70397367 67
LTE iOMS Alarms 70115 LICENCE EXPIRATION WARNING LIMIT ISREACHED
Id:0900d805809539f8Confidential
32 70115 LICENCE EXPIRATION WARNING LIMIT IS REACHEDProbable cause: Threshold crossed
Event type: Quality of service
Default severity: Warning
MeaningThis is an informative alarm which indicates that the licence expiration warning limit has been reached or the licence has expired. The warning limit indicates the number of days the licence is valid until it expires.
For each warning limit, there is a corresponding alarm severity. The alarm severity increases as teh warning limit becomes closer to the license expiry day (zero value).
If the licence has expired and it was the only licence for the feature in question, the appli-cation implementing the licenced feature will stop operating.
Identifying additional information fields1. Licence file name
Additional information fields2. Number of days to expire (0, if licence expired)
InstructionsCheck if a new licence is required, and install the new licence if needed. Fill in a problem report and send it to your local Nokia Siemens Networks representative.
1. To check the status of a licence, execute the following command: lmcli getLicenceInfo <LicenceName>where <LicenceName> is the name of the licence to be checked.
2. To install a new licence, execute following command: lmcli importLicence <LicenceFilename> where <LicenceFilename>is a fully qualified filename of the licence file to be installed.
ClearingClear the alarm manually with an alarm management application.
Testing instructions
1. Install a time limited licence (that contains endTime attribute) by executing the fol-lowing command:lmcli importLicence <LicenceFilename> where <LicenceFilename> is a fully qualified filename of the licence file to be installed.
2. Lock the recovery group /ClusterNTP.3. In the nodes where the Licence Manager (/CLM recovery group) is running, change
the system time so that new time will be at least 30 minutes before the expiry day (endTime).
4. When the License warning limit is reached or the license expires, alarm 70115 will be raised..

68 DN70397367
LTE iOMS Alarms
Id:0900d805809539f8Confidential
70115 LICENCE EXPIRATION WARNING LIMIT IS REACHED
5. Unlock the recovery group /ClusterNTP.
Note: changing the time might affect other applications.
DN70397367 69
LTE iOMS Alarms 70136 SWITCH AND SERVICE UNIT: IPMI SYSTEMEVENT LOG FULL
Id:0900d805809539fdConfidential
33 70136 SWITCH AND SERVICE UNIT: IPMI SYSTEM EVENT LOG FULL Probable cause: Reduced logging capability
Event type: Quality of Service
Default severity: Warning
MeaningThe Intelligent Platform Management Interface (IPMI) System Event Log (SEL) is peri-odically read to /var/log/system.log@<ip address of Switch and Service Unit (SWSE)> file and then cleared by the IPMI event log daemon program, seld. If this alarm appears, the seld program has failed to clear the log.
Any subsequent IPMI event will still be propagated out by the SWSE but they will not be logged in the SEL.
Identifying additional information fields1. IP address of the switch
Additional information fields-
Instructions
1. Check if the seld program is running by executing the following command in the node where the /Directory recovery group is runningps ax | grep -i seld
2. If the seld is running but the log has become full, contact your Nokia Siemens Networks representative.
3. If the seld is not running you can try to restart it manually./opt/Nokia_BP/bin/seld daemonize
4. If the restart of seld was not successful, read and clear the logs on the switch iden-tified in the alarm. With the -l option you can save the IPMI SEL to a file.event -p <IP address of the switch> -d -l log.txt
5. Contact your Nokia Siemens Networks representative to find out the root cause for the SEL clearing failure.
ClearingClear the alarm with alarm management application after correcting the fault as pre-sented in Instructions.
Testing instructionsDo not test this alarm, because testing it in a live system will reduce the quality of service.
70 DN70397367
LTE iOMS Alarms
Id:0900d805809538f5Confidential
70156 DISK DATABASE WATCHDOG START-UP FAILED
34 70156 DISK DATABASE WATCHDOG START-UP FAILEDProbable cause: Configuration or Customizing Error
Event type: Processing error
Default severity: Critical
MeaningStart-up of the disk database watchdog has failed due to a configuration error, or other reasons.
Because the disk database and its watchdog belong to the same Recovery Unit (RU), the disk database watchdog start-up failure means that the database is not available.
Identifying additional information fields-
Additional information fields
1. Reason. Possible values: • Disk database watchdog failed to read the parameters from the parameter man-
agement system. • Invalid or missing parameter value.
2. List of invalid or missing parameters if the reason for the alarm is 2.
InstructionsCheck the Application Additional Information field for a reason for the configuration error:
• Reason 1: Disk database watchdog failed to read the parameters from parameter management system.
• Reason 2: Invalid or missing parameter value.
Continue according to the following procedure:
1. Check that the following parameters exist in parameter management system for each database entry in the database fragment with the DN (Distinguished Name) "fsFragmentId=DB, fsClusterId=ClusterRoot":
fsdbRedundancyModelfsdbDataSourceNamefsdbFillRatioAlarmLimitfsdbFillRatioCheckFreq
2. Use the parameter management system to get the values of those parameters for the database in question. To find those parameters, use the value of the Managed Object field in alarm management application, for example:
fsdbName=DB_Alarm,fsFragmentId=DB,fsClusterId=ClusterRoot
3. Send the found values and/or parameters that do not exist (parameters for which the fields are empty) to your local Nokia Siemens Networks representative.
ClearingThe system clears the alarm automatically when the fault has been corrected.

DN70397367 71
LTE iOMS Alarms 70156 DISK DATABASE WATCHDOG START-UPFAILED
Id:0900d805809538f5Confidential
Testing instructions
1. Use the parameter management system to change the fsdbFillRatioAlarmLimit or fsdbFillRatioCheckFreq attribute of the database to a non-numeric value
2. Restart the recovery group of the database.
72 DN70397367
LTE iOMS Alarms
Id:0900d80580953930Confidential
70157 CPU USAGE OVER LIMIT
35 70157 CPU USAGE OVER LIMITProbable cause: Threshold crossed
Event type: Quality of service
Default severity: Major
MeaningA processor is being used at a very high throughput level because the execution of some processes is taking a lot of CPU time.
There is a risk that the node is unable to fulfill the tasks allocated to it. This depends on to what extent the processes taking the most of the CPU time are blocking other pro-cesses from getting runtime on the CPU, and whether there is a temporary or a perma-nent increase on the throughput.
If the processor is constantly used at a very high throughput level, the system might appear very slow. For example, the execution of commands takes an unusually long time to finish.
Identifying additional information fields1. CPU index (optional).
Additional information fields-
Instructions
1. RuntopLinux command on the node that reports the alarm. The command gives a repetitive update of processor activity in real time. It gives a listing of the most CPU-intensive tasks of the system.
2. If the problem persists, contact your local Nokia Siemens Networks representative and provide the information gathered in the previous step.
ClearingThe alarm is cleared automatically by the operating system's fault detector once the CPU usage is on a low enough level. The raising / clearing thresholds are different to prevent unnecessary trashing.
Testing instructionsDo not test this alarm, because testing it will result in reduced quality of service.

DN70397367 73
LTE iOMS Alarms 70158 FILE SYSTEM USAGE OVER LIMIT
Id:0900d80580953982Confidential
36 70158 FILE SYSTEM USAGE OVER LIMITProbable cause: Threshold Crossed
Event type: Quality of service
Default severity: Major
MeaningThe available disk space on a partition is smaller than the minimal requirement. The par-tition can be filled up, for example, by crashing programs resulting large core files or by large log files, if the rotation of logs does not function.
There is a risk that some data cannot be written to the disk.
Identifying additional information fieldsMountpoint
Additional information fields-
Instructions
1. Run the df -k <mountpoint>Linux command on the node that reports the alarm to get a report of the usage of the file system disk space in 1 kilobyte blocks.See the mountpoint in the Identifying additional information fields of the alarm.Alternatively, run the Linux commanddf -h <mountpoint>to see the information in a human readable format.
2. Run the Linux command du -k or du -h on the node that reports the alarm to disocver the directories that consume most of the space.
3. Check with du -h /var/tmp/. if /var/tmp is among the large directories. If it is, remove the unnecessary files.
4. Check with du -h /var/log/.if /var/log is among the large directories. If it is, move the old files outside the Network Element (NE) using the appropriate network management tools.
5. Check with du -h /var/crash/. if /var/crash is among the large directories. If it is, move the core files outside the NE using the appropriate network management tools.
6. If the alarm is not cleared, contact your local Nokia Siemens Networks representa-tive.
ClearingThe alarm is automatically cleared by the operating system's fault detector once the amount of available disk space increases above the specified limit. The raising / clearing thresholds are different to prevent unnecessary trashing.

74 DN70397367
LTE iOMS Alarms
Id:0900d80580953982Confidential
70158 FILE SYSTEM USAGE OVER LIMIT
Testing instructionsDo not test this alarm, because testing it in a live system will reduce the quality of service.
DN70397367 75
LTE iOMS Alarms 70159 MANAGED OBJECT FAILED
Id:0900d805809539d0Confidential
37 70159 MANAGED OBJECT FAILEDProbable cause: Software program abnormally terminated
Event type: Processing error
Default severity: Major
MeaningThe named managed object (MO) has failed. The managed object can be a software, hardware or logical entity. The type of the managed object identifies the following:
• Node: The physical computing node, its system software, or operating system has failed, or the node has been manually restarted.
• Recovery Unit (RU): A recovery unit contains one or more processes. A recovery unit failure is usually caused by a process failure.
• Process: The process has crashed, terminated abnormally or stopped responding. • Recovery Group (RG): A recovery group consists of one or more recovery units. A
recovery group failure alarm is raised for an active-standby configuration, when both redundant components (recovery units of the recovery group) have failed. This is always a serious situation as it indicates a double failure (for example, two nodes have failed at the same time).
The effect of the situation depends on the managed object type:
• Node: Any important services/functions that are provided with an active-standby or N+M recovery group may be taken over by other operational nodes. Services may be down if standby/spare nodes are also down.
• Recovery Unit (RU): If the recovery unit belongs to an active-standby or N+M recovery group, the service may be taken over by an operational standby/spare recovery unit.
• Process: The service or function that the process provides is not available. A process failure can cause a recovery unit level recovery action or the system may attempt to restart the failed process.
• Recovery Group (RG): The service provided by the recovery group is not available. Manual correction is required, as the automatic system repair actions have not solved the problem.
The system High Availability Services (HAS) will periodically attempt to solve the problem with corrective actions, such as switchovers or restarts. The alarm system also clears the obsolete alarms that may have been raised by this managed object or by its child managed objects.
Identifying additional information fields-
Additional information fields
1. Identifies the managed object type: "Node", "Recovery unit", "Process" or "Recovery group".

76 DN70397367
LTE iOMS Alarms
Id:0900d805809539d0Confidential
70159 MANAGED OBJECT FAILED
2. Explains the string of the fault type (if that information is available) or just the string "failure".For example: "Process has stopped responding to heartbeats""Node connection heartbeat failure""Recovery group failure"
Instructions
1. Log into the cluster and check that the named managed object has been success-fully restarted.
2. Verify also that the MO did not raise any new alarms that would explain the failure.
You can check the status of an MO with the HAS user interface tool fshascli. An opera-tional MO has the value ENABLED in the operational state attribute and an empty pro-cedural status attribute.
For example, the state of the process NodeDNS in the recovery unit FSNodeDNSServer of the node AS-5 can be seen as follows:
$ fshascli --status /AS-5/FSNodeDNSServer/NodeDNS /AS-5/FSNodeDNSServer/NodeDNS:administrative(UNLOCKED) operational(ENABLED) usage(ACTIVE) procedural() availability( ) unknown(FALSE) role(ACTIVE)
If the MO is not operational, perform the following steps:
1. With a node MO, you can wait for a node restart. The system will raise another alarm (70011 NODE NOT RESPONDING) if the node does not come up within some time.
2. Check the system logs (/var/log/master-syslog on the active CLA node) for error(s) that have occurred by searching for the MO's name and/or by looking at events that occurred before this alarm was raised.
3. You can also use the HAS user interface tool to initiate an immediate restart attempt of the failed MO using the -r (--restart) command line option:
$ fshascli --restart /AS-5/FSNodeDNSServer
The restart operation is mostly useful after a problem has been corrected. Verify the result from the syslog and by checking the status of the MO.
4. An alarm for a recovery group implies a multiple error situation (for example, multiple node failures) or a persistent configuration or corruption problem. In this case, contact your local Nokia Siemens Networks representative.
ClearingThe system clears the alarm automatically when the fault has been corrected.
Testing instructionsScenario 1: Alarm for a node
1. Restart an operational unlocked node using fshascli. For example,

DN70397367 77
LTE iOMS Alarms 70159 MANAGED OBJECT FAILED
Id:0900d805809539d0Confidential
$ fshascli --state /AS-1/AS-1administrative(UNLOCKED) <== Unlockedoperational(ENABLED) <== Operationalusage(IDLE)procedural()availability()unknown(FALSE)alarm()$ fshascli --restart --nowarning /AS-1/AS-1 is restarted successfully
2. Wait for a few seconds for the node to turn DISABLED. The alarm is raised after this. For example, $ fshascli --state /AS-1/AS-1administrative(UNLOCKED) <== Unlockedoperational(DISABLED) <== No longer operationalusage(IDLE)procedural(TERMINATING)availability()unknown(FALSE)alarm()$ fshascli --state /AS-1/AS-1administrative(UNLOCKED) <== Unlockedoperational(DISABLED) <== No longer operationalusage(IDLE)procedural(TERMINATING)availability()unknown(FALSE)alarm(MAJOR,OUTSTANDING) <== Alarm has been raised
The alarm raising is also visible in the syslog as a message that begins as follows:
ALARM RAISE SP=70159 . . .
The alarm is automatically cancelled when the node has successfully restarted.
The alarm cancellation is also visible in the syslog as a message that begins as follows:
ALARM CANCEL SP=70159 . . .
Scenario 2: Alarm for a process
1. Terminate an operational and unlocked "modest" severity process. An operational process has ENABLED operational state and an empty procedural status. You can search for modest criticality processes with the fshascli command --view. For example,
$ fshascli --view --filter process "/*/*/*". . .

78 DN70397367
LTE iOMS Alarms
Id:0900d805809539d0Confidential
70159 MANAGED OBJECT FAILED
/TA-A/TestApplAServer/TestProcA:Process /TA-A/TestApplAServer/TestProcA command=(/opt/Nokia/SS_ABC/bin/testProcA) status=(fullHA) startMethod=(requested) severity(modest). . . $ fshascli -state /TA-A/TestApplAServer/TestProcA /TA-A/TestApplAServer/TestProcA:administrative(UNLOCKED) <== Unlockedoperational(ENABLED) <== Operationalusage(ACTIVE)procedural() <== Empty PS = runningavailability()unknown(FALSE)alarm()role(ACTIVE)
$ ssh TA-A killall testProcA
2. Verify that the alarm was raised and (very likely) also immediately cancelled. The HAS cancels the alarm immediately if the process repair cycle allowed an immediate restart.
The alarm raising is also visible in the syslog as a message that begins as follows:
ALARM RAISE SP=70159 . . .
Similarly, the alarm cancellation is also visible in the syslog as a message that begins as follows:
ALARM CANCEL SP=70159 . . .
Scenario 3 : Alarm for a recovery unit
1. Terminate an operational and unlocked "important" severity process. This causes a failure of the recovery unit. An operational process has ENABLED operational state and an empty procedural status. You can search for important criticality processes with the fshascli command --view. For example,
$ fshascli --view --filter process "/*/*/*". . . /TA-A/TestApplBServer/TestProcB:Process /TA-A/TestApplBServer/TestProcB command=(/opt/Nokia/SS_ABC/bin/testProcB) status=(fullHA) startMethod=(requested) severity(important). . . $ fshascli -state /TA-A/TestApplBServer/TestProcB/TA-A/TestApplBServer/TestProcB:administrative(UNLOCKED) <== Unlockedoperational(ENABLED) <== Operationalusage(ACTIVE)
DN70397367 79
LTE iOMS Alarms 70159 MANAGED OBJECT FAILED
Id:0900d805809539d0Confidential
procedural() <== Empty PS = runningavailability()unknown(FALSE)alarm()role(ACTIVE)
$ ssh TA-A killall testProcB
2. Verify that the alarm was raised and (very likely) also immediately cancelled. The HAS cancels the alarm immediately if the recovery unit repair cycle allowed an immediate restart.The alarm raising is also visible in the syslog as a message that begins as follows:
ALARM RAISE SP=70159 . . .
Similarly, the alarm cancellation is also visible in the syslog as a message that begins as follows:
ALARM CANCEL SP=70159 . . .

80 DN70397367
LTE iOMS Alarms
Id:0900d805809539c1Confidential
70160 MEMORY USAGE OVER LIMIT
38 70160 MEMORY USAGE OVER LIMITProbable cause: Threshold crossed
Event type: Quality of service
Default severity: Major
MeaningMemory consumption is too high because some processes are using too much memory.
There is a risk that the node is unable to fulfil the tasks allocated to it because the pro-cesses cannot reserve enough memory for their use. As a result, the processes cannot perform the tasks allocated to them.
Identifying additional information fields-
Additional information fields-
Instructions
1. RuntopLinux command on the node that reports the alarm to view a snapshot of the current global memory. Press M to sort the processes in the node based on their memory resident size to check which processes consume the most memory.
2. If the problem persists, contact your local Nokia Siemens Networks representative and provide them with the information gathered in the previous step.
ClearingThe alarm is automatically cleared by the operating system's fault detector once the memory usage is on a low enough level. The raising / clearing thresholds are different to prevent unnecessary trashing.
Testing instructionsDo not test this alarm, because testing it will result in reduced quality of service.

DN70397367 81
LTE iOMS Alarms 70161 OPERATING SYSTEM MONITORING FAIL-URE
Id:0900d805809539cfConfidential
39 70161 OPERATING SYSTEM MONITORING FAILUREProbable cause: System call unsuccessful
Event type: Processing error
Default severity: Major
MeaningThe fault detector in the operating system has failed to capture the statistics of the usage of a given resource.
The state of the named device cannot be discovered, which may indicate that there are some fundamental problems with it.
Identifying additional information fields
1. Failed subsystem2. Failed resource, where the values are
• CPU: Index of the processor • FILESYSTEM: Name of the mountpoint • ETHERNET: Name of the interface • MEMORY: • RAID: Name of the device • FC (Fibre Channel):
Additional information fields-
InstructionsIf the alarm is not cleared automatically, contact your Nokia Siemens Networks repre-sentative.
ClearingDo not clear the alarm. The alarm is automatically cleared when the fault detector of the operating system is able to capture the statistics of the failed resource.
Testing instructionsThis alarm is difficult to test, because the hardware problem cannot be simulated.

82 DN70397367
LTE iOMS Alarms
Id:0900d80580953932Confidential
70162 RAID ARRAY HAS BEEN DEGRADED
40 70162 RAID ARRAY HAS BEEN DEGRADEDProbable cause: Disk problem
Event type: Equipment
Default severity: 3 Major
MeaningRedundancy of the RAID array is lost. A device belonging to the RAID array can be marked faulty by the system. The alarm may be caused by either errors in the fibre channel (FC) or small computer system interface (SCSI) bus or by a potentially broken disk media.
In the case of a subsequent disk failure, data will be lost.
Identifying additional information fields1. RAID array.
Additional information fields2. Faulty device (optional).
InstructionsIf the hardware is FlexiServer Blade Hardware, then follow these instructions:
1. Use the command cat /proc/mdstat to check the status of the RAID array found in the Identifying additional information field of the alarm on the node that reports the alarm.The [UU] field printed by the command describes whether both of the disks are in the RAID array or not. If this field contains [_U] or [U_], one of the disks is not in the RAID array.
2. The redundancy of the RAID array should be automatically restored by the system within an hour. If the problem persists and the alarm is not cleared within an hour, contact your local Nokia Siemens Networks representative.
3. If the problem persists, try changing the faulty disk according to the hardware main-tenance instructions. If that does not help, contact your local Nokia Siemens Networks representative.
If the hardware is IBM BladeCenter, then follow these instructions:
1. Check the Maintenance Module and find the faulty disk and the possible cause of the fault. Replace the faulty disk with a new disk, referring to the hardware mainte-nance documentation for detailed replacement instructions.
2. The redundancy of the RAID array should be automatically restored by the system within an hour. If the problem persists and the alarm is not cleared within an hour, contact your local Nokia Siemens Networks representative.
ClearingThe alarm is automatically cleared by the operating system's fault detector once the redundancy of the RAID array is restored.
Testing instructionsDo not test this alarm in a live system. Any real disk faults during the execution of this test may lead to data corruption.
DN70397367 83
LTE iOMS Alarms 70163 ETHERNET INTERFACE USAGE OVER LIMIT
Id:0900d805809538f7Confidential
41 70163 ETHERNET INTERFACE USAGE OVER LIMIT Probable cause: Threshold Crossed
Event type: Quality of service
Default severity: Minor
MeaningThe Ethernet interface is used at a very high level. This alarm may be raised, for example, when large files are copied over the network causing a lot of network file system (NFS) traffic.
Packages are not lost yet but if the interface is loaded increasingly, packages might eventually be lost.
Identifying additional information fields1. Bonding interface
2. Ethernet interface
Additional information fields-
InstructionsThis is an informative alarm and does not require direct actions.
ClearingThe alarm is automatically cleared by the operating system's fault detector once the Ethernet load has decreased to a tolerable level.
Testing instructionsDo not test this alarm, because testing it will create instability in the system.

84 DN70397367
LTE iOMS Alarms
Id:0900d805809539d4Confidential
70164 ETHERNET LINK FAILURE
42 70164 ETHERNET LINK FAILURE Probable cause: Link failure
Event type: Equipment
Default severity: Minor
MeaningThe redundancy of Ethernet is lost because of an Ethernet link failure. The error might have been caused by a hardware failure, that is, a potentially broken Ethernet port, by an unplugged cable on the front panel of the gateway (GW) node, or if some program or user has issued a command shutting down the Ethernet interface.
In case of subsequent link failure, the Ethernet packages are lost which means that the node cannot receive or transmit data over the network.
Identifying additional information fields1. Bonding interface
2. Ethernet interface
Additional information fields-
Instructions
1. If the alarm is raised for an external Ethernet interface, check that the cable is properly connected in the front panel of the GW node.
2. Take a console connection to the node with the alarming interface.3. Check the status of the interface with the following command:
ifconfig -a <interface>For example, ifconfig -a eth0
4. Assuming that the interface does not have the UP and RUNNING flags set, try to configure the interface UP with the following command ifup <interface>For example, ifup eth0
5. If the previous steps have not resolved the situation, contact your local Nokia Siemens Networks representative.
ClearingThe alarm is automatically cleared by the operating system's fault detector when the Ethernet link comes up.
Testing instructionsDo not test this alarm, because testing it will create instability in the system.

DN70397367 85
LTE iOMS Alarms 70166 MANAGED OBJECT LOCKED
Id:0900d805809539adConfidential
43 70166 MANAGED OBJECT LOCKEDProbable cause: Software program abnormally terminated
Event type: Processing error
Default severity: Warning
MeaningThe administrative state of the named managed object (MO) which can be a cluster, a node, or a recovery unit (RU) has changed to LOCKED as a result of a user action (grace-ful shutdown or lock operation).
The named MO and its child MOs have been stopped and will not be started before a corresponding unlock operation is performed by the user. The service provided by the MO is not available, unless the MO is a RU with some operational and UNLOCKED redun-dant resources.
When a MO is locked, the alarm system of the cluster clears the alarms raised by the MO and its child MOs.
Identifying additional information fields-
Additional information fieldsIdentifies the MO type: a cluster, a node, or a RU.
InstructionsThis is an informative alarm and does not require any actions.
ClearingDo not clear the alarm. This is an informative alarm and will be cleared automatically by the alarm system after its time to live has expired.
Testing instructionsLock the managed object using fshascli. For example:
$ fshascli --lock --nowarning /AS-1/FSNodeDNSServer
The alarm raising is also visible in the syslog as a message that begins as follows:
ALARM RAISE SP=70166...
Note that test case for alarm 70189 MANAGED OBJECT UNLOCKED BY OPERATOR should be run after this to get the initial situation restored.

86 DN70397367
LTE iOMS Alarms
Id:0900d80580953956Confidential
70168 CLUSTER STARTED (RESTARTED)
44 70168 CLUSTER STARTED (RESTARTED) Probable cause: Software environment problem
Event type: Processing error
Default severity: Major
MeaningThe whole cluster is starting or restarting.
Starting or restarting of the whole cluster means (re)starting of all managed objects within the cluster.
The (re)start may have been initiated by an operator or be caused by fatal errors in some critical hardware or software component. When the cluster is restarted, the alarm system clears all alarms that were raised by the cluster's managed objects before the restart.
Identifying additional information fields-
Additional information fields-
InstructionsThis alarm is an informative alarm indicating that the whole cluster has been (re)started. As this operation is critical for software and hardware, check carefully the alarm status in the cluster after the restart.
ClearingClear the alarm after carefully checking the alarm status in the cluster.
Testing instructions
1. Restart the cluster usingfshascli:$ fshascli --restart --nowarning /
2. Wait for the cluster to restartThe alarm is visible in the alarm database (if configured) and in syslog as a message that begins as follows:
ALARM RAISE SP=70168 ...
3. Note that all services are unavailable during restart.
DN70397367 87
LTE iOMS Alarms 70169 COMPACTING IN-MEMORY DATABASEFAILED
Id:0900d805809539e7Confidential
45 70169 COMPACTING IN-MEMORY DATABASE FAILED Probable cause: Application subsystem failure
Event type: Processing error
Default severity: Warning
MeaningDefragmentation of the in-memory database is not completed.
The database is not compacted to reduce memory fragmentation. This does not affect the functioning of the system. In an extreme case, it is possible that some executions may become slower.
Identifying additional information fields1. Database Name
Additional information fields2. Failure reason, possible values: FAIL, TIMEOUT, ATTRIBUTE
3. Error code
InstructionsIn these instructions TimesTen is referring to the concept in-memory database.
1. Use the parameter management application to check the value of fsdbCompactInt-erval or fsdbCompactTime for the database in question.
2. After the next compaction operation (as defined in fsdbCompactInterval or fsdb-CompactTime), check with alarm management application if the alarm remains in the Active Alarms List.
3. If the compacting failed, check the alarm reason in the application additional infor-mation field 2 and continue according to the respective procedures:If the reason is TIMEOUT or FAIL:a) Copy the original master-syslog to the temporary directory:
cp /var/log/master-syslog /tmp/<filenameA>.<extension> (Choose filenameA and extension, for example, 70169_syslog.log)
b) Go to the tmp directory:cd /tmp
c) In the node where the alarm was raised, determine the TimesTen status:ttStatus -v > /tmp/<filenameB>.txt(Choose filename, for example, 70169_ttstatus.log; filenameB must be different from the filenameA.)
d) Compress the files with the tar command:tar -cf <tarname>.tar <filenameA>.<extension><filenameB>.txt(Choose tarname, for example, 70169.tar.)
t The tar command does not delete the original files. When the files are not needed anymore, they can be deleted.

88 DN70397367
LTE iOMS Alarms
Id:0900d805809539e7Confidential
70169 COMPACTING IN-MEMORY DATABASE FAILED
e) Contact your Nokia Siemens Networks representative with the information gathered (<tarname>.tar).
If the reason is ATTRIBUTE:a) Use the parameter management application to check the values of fsdbCom-
pactInterval and fsdbCompactTime.b) If the values are correct, follow the procedure for TIMEOUT or FAIL and contact
your Nokia Siemens Networks representative with the information described in TIMEOUT/FAIL section.
If the values are not correct, proceed as follows:a) Use the parameter management application to change the values fsdbCom-
pactInterval, fsdbCompactQuantum, or fsdbCompactTime for the database in question. The database can be found from the entry fsdbFragmentId DB.
b) Perform graceful shutdown to the managed object (MO) of TimesTen Watchdog and start it up to activate the changed parameters.
c) Search the TimesTen Watchdog MO:fshascli -v | grep InMemoryDB
d) From the result, search the information of process:/<node>/FSInMemoryDB<x>Server/TimestenWD<x> command=(opt/Nokia/SS_DBHAforTT/bin/TimesTenWD <Database Name>)where <node> is the node for which the alarm is raised, <x> is a letter for the distinctive part of the process type name (see Application Id of the alarm), and <Database Name> is the database in question. For example:Process /TA-A/FSInMemoryDBaServer/TimesTenWDa command=(opt/Nokia/SS_DBHAforTT/bin/TimesTenWD DB_Name)
e) Shut down the TimesTen Watchdog process gracefully:fshascli -X /<node>/FSInMemoryDB<x>Server/TimesTenWD<x>
f) Startup the the TimesTen Watchdog process to activate the parameter values:fshascli -u /<node>/FSInMemoryDB<x>Server/TimesTenWD<x>
g) After the next compaction operation, check with alarm management application if the alarm remains in the Active Alarms List.
ClearingThe alarm system clears the alarm automatically after the next successful database compact operation.
Testing instructions
1. Use the parameter management application (for example, parameter management application) to check that the value has been set for either both attributes fsdbCom-pactInterval and fsdbCompactQuantum or for the attribute fsdbCompactTime for the database to be used for testing.In case the attribute values need to be updated, TimesTenWD must be re-started for the changes to take effect.
2. Before the next compaction is due, stop TimesTenWD process heartbeating in the node where the database resides:fshascli -B OFF /<node>/<InMemoryDB>Server/<TimesTenWD>
3. Invalidate the database connections to cause the next compaction to fail:ttIsql -connStr "dns=<DBName>" -e "call invalidate; quit;"
4. Wait for the compaction to fail and alarm to be raised.

DN70397367 89
LTE iOMS Alarms 70169 COMPACTING IN-MEMORY DATABASEFAILED
Id:0900d805809539e7Confidential
Clearing
1. Restart TimesTenWD heartbeating to restore the DB connection:fshascli -B ON /<node>/<InMemoryDB>Server/<TimesTenWD>
2. Wait for the next successful compaction to clear the alarm.
90 DN70397367
LTE iOMS Alarms
Id:0900d80580953a6eConfidential
70170 IN-MEMORY DATABASE WATCHDOG START-UP FAILED
46 70170 IN-MEMORY DATABASE WATCHDOG START-UP FAILED Probable cause: Configuration or customizing error
Event type: Processing error
Default severity: Critical
MeaningThe in-memory database watchdog cannot start up because its start arguments are invalid.
All in-memory databases of the node of the failed watchdog process are unavailable.
Identifying additional information fields
Additional information fields
1. Reason, possible values: InvalidValue, MissingParameter, InvalidArgument, Missin-gArgument.
2. Argument name.3. Argument value.
InstructionsContact your local Nokia Siemens Networks representative and provide them with the information you obtained from the alarm notification fields.
ClearingClear the alarm with an alarm management application after correcting the fault as pre-sented in Instructions.
Testing instructions
1. Use the parameter management application to modify the process instance of an in-memory database watchdog process in the HA-fragment of the LDAP Directory. Modify the start parameters (attribute fshaAbsolutepath) of the process by adding an invalid option (e.g., --invalidOption) to the arguments.
2. Restart the node running the modified process instance. For example, if the node is TA-A, use the command fshascli –r /TA-A

DN70397367 91
LTE iOMS Alarms 70171 RECREATING STANDBY IN-MEMORY DATA-BASE FAILED
Id:0900d80580953a31Confidential
47 70171 RECREATING STANDBY IN-MEMORY DATABASE FAILED Probable cause: Application subsystem failure
Event type: Processing error
Default severity: Critical
MeaningThe watchdog process failed to copy the database from the active database to standby at start-up, either after switchover or after failover.
The standby database does not exist any more or contains out-of-date data. High avail-ability of the database cannot be guaranteed. Typically, the active database raises the alarms 70205 and 71065 because the standby database replication agents are not func-tional.
Identifying additional information fields
Additional information fields
1. Failure reason. The values used are:SyncError – database synchronization failedConnectErr – connection to the database failedReplErr – starting of replication agents failedTimeout – synchronization, connection or replication agent start failed for timeoutldapErr – persistent state update failedPeerErr – communication with other peer failed
2. Peer node name.
InstructionsIf the reason for the failure is SyncError,
1. Get the recovery unit name of the peer watchdog by using the command fshascli -v / | grep '^RecoveryUnit.*InMemoryDB' The correct recovery unit is the one that has the prefix /<node>, where <node> is the peer node name in the addi-tional information field #2.
2. Check the status of the recovery unit with the command fshascli -s <RU name>
3. If the administrative state of the recovery unit is LOCKED, unlock the recovery unit with the command fshascli -LN <RU name>
4. If the problem does not disappear, contact your Nokia Siemens Networks represen-tative and provide them with the information in the alarm notification and the results of the actions described above.
In other cases contact your Nokia Siemens Networks representative and provide them with the information in the alarm notification and system log.
ClearingThe alarm is cleared automatically by the watchdog process when recreating finally suc-ceeds.

92 DN70397367
LTE iOMS Alarms
Id:0900d80580953a31Confidential
70171 RECREATING STANDBY IN-MEMORY DATA-BASE FAILED
Testing instructions
1. Log in as root user to a node having a replicated in-memory database with an active role.
2. Set the environment variables with the command # source /opt/Nokia/SS_TimesTen/srcipt/ttenv.sh
3. Connect to the database with the command# ttIsql <DB-name>4. Use the fshascli-tool and set the persistent state of the active database to
ACTIVE-DUPLICATE.5. Use another terminal connection to log in, e.g., to the active CLA of the same cluster.6. Perform the switchover of the primary application recovery group related to the
database (see Directory for attribute fsdbAppRecoveryGroup in DB-fragment of the database) with the command:
# fshascli –w <RG-name>
DN70397367 93
LTE iOMS Alarms 70172 TAKING CHECKPOINT OF IN-MEMORY DA-TABASE FAILED
Id:0900d80580953a6dConfidential
48 70172 TAKING CHECKPOINT OF IN-MEMORY DATABASE FAILED Probable cause: Underlying Resource Unavailable
Event type: Processing error
Default severity: Warning
MeaningAn attempt to take a checkpoint of an in-memory database has been failed.
The new checkpoint file is not written to the disk. The transaction log files are not purged. The accumulation of log files may cause the disk to run out of space and thus to total unavailability of the database instance. Moreover, the accumulation may result in a lengthy recovery operation in the case of a data store crash.
Identifying additional information fields
Additional information fields
1. Failure reason, possible values: OngoingBackupOrCheckpointTimeOutError
2. Error code3. Checkpoint type, possible values:
StaticBlockingFuzzyNone
4. Checkpoint start time in format dd.mm.yyyy hh:mm:ss5. Checkpoint initiator, possible values
UserCheckpointerSubdaemon
Instructions
1. Refer to /var/opt/TimesTen/sys.odbc.ini of the node running the database instance in question. Try to determine the time of the next checkpoint fromCkptFrequency and the CkptLogVolume attributes.
2. Use the parameter management application to check when the checkpoint status is next checked. Attribute fsdbCheckpointStatusCheckInterval of the database defines the checking interval.
3. Wait until the next checkpoint takes place and the check is completed; use the alarm management application to check whether the alarm stays in active alarms list.
4. If the next checkpoint also fails, check the reason for the failure and continue accord-ing to the respective procedures.

94 DN70397367
LTE iOMS Alarms
Id:0900d80580953a6dConfidential
70172 TAKING CHECKPOINT OF IN-MEMORY DA-TABASE FAILED
If the reason for the alarm is “OngoingBackupOrCheckpoint”
1. A backup or some other checkpoint operation for the data storage is in progress. The completion time for the backup depends on the size of the database: in some cases it may take a couple of minutes. Wait until the ongoing backup or checkpoint operation is completed.
2. Wait until the next scheduled checkpoint takes place and the check is completed; use the alarm management application to check whether the alarm stays in the active alarms list.
3. Wait until the next checkpoint takes place and the check is completed; use the alarm management application to check whether the alarm stays in active alarms list.
4. If also next checkpoint fails contact your local Nokia Siemens Networks representa-tive.
If the reason for the alarm is “TimeOut” or “Failure”
1. Collect following information:- contents of current syslog (/var/log/master-syslog)- output of command ‘ttStatus –v’and contact your local Nokia Siemens Networks representative and provide them with this information.
ClearingThe system clears the alarm automatically when the fault has been corrected.
Testing instructionsIn practice, simulating TimesTen checkpoint failure is an extremely difficult task. No fool-proof approach can be given. However, the following guidelines should sooner or later activate the alarm:
• Use the parameter tool to set fsdbCheckpointTimeout to 1 second • Use the parameter tool to set fsdbCheckpointStatusCheckInterval to 1
second • Modify/var/opt/TimesTen/sys.odbc.ini such that CkptFrequency and
CkptLogVolume attributes have relatively large values. The idea is to guarantee that a single checkpoint takes more than one second. It might take several iterations to tune these attributes to the correct value. The recovery group running the TimesTen must be restarted after tuning the attributes.
• Use a suitable tool to generate transactions in the database.
If the CkptFrequency and CkptLogVolume are large enough and sufficient transac-tions are generated by the tool, the alarm should be activated with the reason "TimeOut".

DN70397367 95
LTE iOMS Alarms 70173 BACKEND DATABASE REQUIRED BY COR-BA NAMING SERVICE IS UNAVAILABLE
Id:0900d805809539bdConfidential
49 70173 BACKEND DATABASE REQUIRED BY CORBA NAMING SERVICE IS UNAVAILABLE Probable cause: Underlying Resource Unavailable
Event type: Processing error
Default severity: Major
MeaningThe MySQL database instance DB_CosNaming, used by the private CORBA naming service (NaS) instance, cannot be contacted by the NaS wrapper. Note that the recovery group that owns the backend database is NamingServiceDB and CORBA NaS instances belong to recovery group PrivateCosNaming.
The CORBA NaS is not able to store data in the database. Therefore the CORBA NaS is not functional and replies to the high availability services (HAS) heartbeats with a failure indication.
Identifying additional information fields-
Additional information fields-
Instructions
• Check that the error situation still exists /opt/Nokia/SS_Naming/bin/ns_listallThese commands should list the content of the private naming graphs when the NaS is working correctly. If the command throw exceptions, the NaS is not working cor-rectly, which may result, for example, from an unavailable backend database.
• Check if the backend database DB_CosNaming (RG NamingServiceDB) is unlocked and active.fshascli -s /NamingServiceDBIf the NamingServiceDB is locked, unlock it.fshascli -u /NamingServiceDB After a few seconds the database should have restarted and the NaS should have automatically re-established connections. Ensure the restart and the re-established connections by issuing the ns_listall command mentioned above.
• If this does not solve the problem, there is something wrong with the database deployment or configuration. In that case, also the alarm 70156 DISK DATABASE WATCHDOG START-UP FAILED should be raised by the MySQL DB watchdog dedicated for the DB_CosNaming database instance.The following steps describe the error checking procedure if NamingServiceDB RG fails (see alarm description 70156 DISK DATABASE WATCHDOG START-UP FAILED for more information).
1. Check the master-syslog for any indication of errors.less /var/log/master-syslog
2. Check that the LDAP (Lightweight Directory Access Protocol) server is up and running. • Check that the RG owning the LDAP server is unlocked.
fshascli -s /Directory

96 DN70397367
LTE iOMS Alarms
Id:0900d805809539bdConfidential
70173 BACKEND DATABASE REQUIRED BY COR-BA NAMING SERVICE IS UNAVAILABLE
• Check that the LDAP server is really working by listing the content of the LDAP tree (CTRL-C aborts the listing).ldapsearch
3. If the LDAP is working correctly, check that the DB directory mount is functional: • Lock the NamingServiceDB RG (if not yet locked). • Mount the database directory manually.
a) Create the SW RAID (md device) to where the DB_CosNaming directory is stored at.
create_sw_raid /dev/md8 \ /dev/VG_62/MySQL_DB_CosNaming \ /dev/VG_63/MySQL_DB_CosNaming
Note that the device paths given as arguments above may be different in your system.Check the correct device paths from:/opt/Nokia_BP/etc/ldapfile/ldif_in/PFSAN*.ldifThe device paths are defined under an entry defining the FSHWSWRAID object class for the NaS:dn: fshwStorageResourceName=/dev/md8, fshwSANName=0,fsFragmentId=HW, fsClusterId=ClusterRootfshwStorageResourceName: /dev/md8objectClass: FSHWStorageResourceobjectClass: FSHWSWRAIDobjectClass: extensibleObjectfshwRAIDLevel: 1fshwPartitionName: /dev/VG_62/MySQL_DB_CosNamingfshwPartitionName: /dev/VG_63/MySQL_DB_CosNamingfsUserComment: MySQL DB for CORBA Naming Service
b) Mount the directory.mkdir /tmp/tmp_nasDBmount /dev/md8 /tmp/tmp_nasDB
Remember to unmount the directory and to stop the md device after the following checks have been performed (see the last step).
4. Check that the database disk content is accessible and readable ls -la /tmp/tmp_nasDB
5. Check that the my.cnf and odbc.ini files exist in that directory and have read access rights. Check also that these files are identical to those under the SS_Naming home directory.
diff /tmp/tmp_nasDB/odbc.ini /opt/Nokia/SS_Naming/etc/odbc.inidiff /tmp/tmp_nasDB/my.cnf /opt/Nokia/SS_Naming/etc/my.cnf
6. Check the mysql.err file for any error indications. You can also find this file from the /tmp/tmp_nasDB directory.
7. Remove the mount and stop the md devicesa) Unmount and remove the directory.
umount /tmp/tmp_nasDBrmdir /tmp/tmp_nasDB
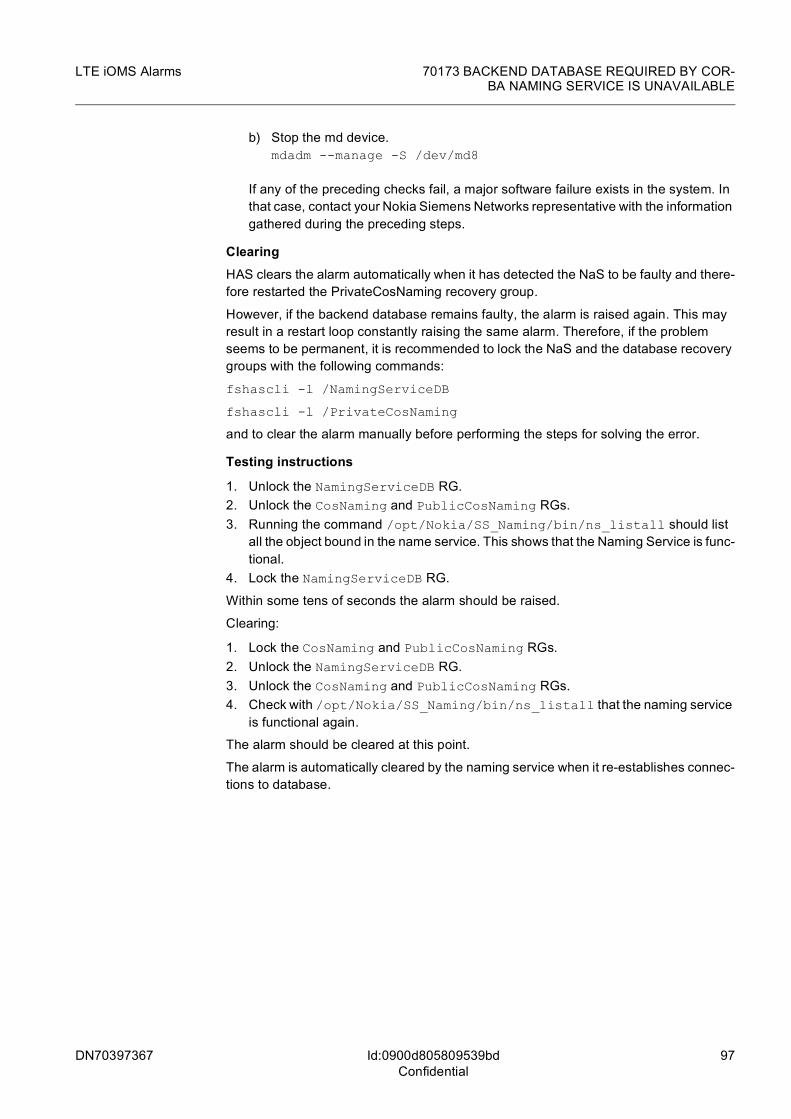
DN70397367 97
LTE iOMS Alarms 70173 BACKEND DATABASE REQUIRED BY COR-BA NAMING SERVICE IS UNAVAILABLE
Id:0900d805809539bdConfidential
b) Stop the md device.mdadm --manage -S /dev/md8
If any of the preceding checks fail, a major software failure exists in the system. In that case, contact your Nokia Siemens Networks representative with the information gathered during the preceding steps.
ClearingHAS clears the alarm automatically when it has detected the NaS to be faulty and there-fore restarted the PrivateCosNaming recovery group.
However, if the backend database remains faulty, the alarm is raised again. This may result in a restart loop constantly raising the same alarm. Therefore, if the problem seems to be permanent, it is recommended to lock the NaS and the database recovery groups with the following commands:
fshascli -l /NamingServiceDB
fshascli -l /PrivateCosNaming
and to clear the alarm manually before performing the steps for solving the error.
Testing instructions
1. Unlock the NamingServiceDB RG.2. Unlock the CosNaming and PublicCosNaming RGs.3. Running the command /opt/Nokia/SS_Naming/bin/ns_listall should list
all the object bound in the name service. This shows that the Naming Service is func-tional.
4. Lock the NamingServiceDB RG.
Within some tens of seconds the alarm should be raised.
Clearing:
1. Lock the CosNaming and PublicCosNaming RGs.2. Unlock the NamingServiceDB RG.3. Unlock the CosNaming and PublicCosNaming RGs.4. Check with /opt/Nokia/SS_Naming/bin/ns_listall that the naming service
is functional again.
The alarm should be cleared at this point.
The alarm is automatically cleared by the naming service when it re-establishes connec-tions to database.

98 DN70397367
LTE iOMS Alarms
Id:0900d80580953a0bConfidential
70174 SWITCH AND SERVICE UNIT: QUEUE EN-GINE MEMORY FULL
50 70174 SWITCH AND SERVICE UNIT: QUEUE ENGINE MEMORY FULL Probable cause: System resources overload
Event type: Quality of service
Default severity: Warning
MeaningThe queue engine inside the switch fabric processor has detected that the link memory is full. This is an indication of some level of congestion in the internal communication network.
The Ethernet switch may not be able to correctly duplicate packets to all the links because the buffer is full or becoming full. This is not a fatal error, but if the situation is prolonged, for example, because of heavy congestion in the communication network, the switch will have to drop some packets and excessive packet forwarding delays will be experienced as well.
The system will tolerate these disturbances to some extent without noticeable problems. However, if the situation is prolonged, it will eventually cause more severe problems. For example, software will start to report problems in peer-to-peer communication, and in severe cases, the system heartbeats will be lost, which can lead to some software and/or nodes being restarted.
Identifying additional information fields1. IP address of the switch
Additional information fields-
InstructionsNo specific actions are required.
ClearingThe alarm system clears the alarm automatically after its time to live has expired.
Testing instructionsThis alarm is difficult to test. This is an indication of hardware failure and cannot be tested without special tools and/or arrangements.

DN70397367 99
LTE iOMS Alarms 70175 SWITCH AND SERVICE UNIT: FABRICBROADCAST STORM
Id:0900d80580953990Confidential
51 70175 SWITCH AND SERVICE UNIT: FABRIC BROADCAST STORMProbable cause: System resources overload
Event type: Quality of service
Default severity: Warning
MeaningA broadcast storm control condition has started within the last 250 milliseconds.
The switch will drop broadcast frames for a fixed period of 250 milliseconds.
Identifying additional information fields1. IP address of the switch
Additional information fields2. fabricBroadcastControlGroupConditions
• A 32-bit counter which denotes the number of broadcast storm control conditions that have been detected.
3. fabricBroadcastControlRxFrameDiscards
• A 32-bit counter which denotes the amount of frames discarded due to broadcast storm control.
InstructionsNo specific actions are required.
However, it should be noted that a broadcast storm is traditionally considered as an indi-cation of the existence of a loop in the network. Loops, however, should not be encoun-tered in FlexiServer-based systems since rapid spanning tree protocol (RSTP) is used for blocking the redundant links.
Therefore, if the system does not clear this alarm automatically, it indicates severe error(s) in the elementary system configuration. In this case, handle the alarm as addi-tional debugging information and add it, for example, to a problem report to your Nokia Siemens Networks representative.
ClearingThe system clears the alarm automatically.
Testing instructionsThe broadcast storm is simulated by attacking the internal network. Effectiveness of the STP is esed by another test case. You need root privileges in order to perform the test.
1. Log into a switch control utility.root@CLA-0(samuel):~# ssh switch-0Linux swse 2.4.17_mvl21-swse #1 Thu Feb 23 14:54:22 CST 2006 ppc unknown root@swse@1-1-7:~# swc RadiSys SWSE Switch) >
2. Check the switch/port configuration.

100 DN70397367
LTE iOMS Alarms
Id:0900d80580953990Confidential
70175 SWITCH AND SERVICE UNIT: FABRIC BROADCAST STORM
(RadiSys SWSE Switch) > show switchconfig NOTE: Broadcast Storm Recovery Mode is Disable(RadiSys SWSE Switch) > show vlan port allNOTE: Select a switch port under observation. (0.x , where x=slot). Checkvlan assigned to the port.(RadiSys SWSE Switch) > show vlan detailed <VLANid>NOTE: Check VLAN BCSC Group.(RadiSys SWSE Switch) > show bcaststorm NOTE: Observe the broadcast condition of the BCSC Group.
3. Enable the broadcast storm control mechanism.(RadiSys SWSE Switch) > config switchconfig broadcast enable
4. Lower the BCSC Group threshold.(RadiSys SWSE Switch) > config bcaststorm threshold <BCSC group>16
5. Log into a node under observation. Generate a "smurf" attack.root@AS-2(samuel):~#ping192.168.255.255 -bf
6. In the switch control utility, observe the switch behavior.(RadiSys SWSE Switch) > show bcaststorm NOTE: Observe the broadcast condition of the BCSC Group.(RadiSys SWSE Switch) > show traplog NOTE: Broadcast Storm Recovery Start/End
7. In the alarm management application, observe the broadcast storm alarm.
Clearing:
1. Stop attacking the network.2. Log into the switch control utility.
root@CLA-0(samuel):~# ssh switch-0Linux swse 2.4.17_mvl21-swse #1 Thu eb 23 14:54:22 CST 2006ppc unknownroot@swse@1-1-7:~# swc(RadiSys SWSE Switch) >
3. Disable the broadcast storm control mechanism.(RadiSys SWSE Switch) > config switchconfig broadcast disable
4. Revert back to the initial BCSC Group threshold.(RadiSys SWSE Switch) > config bcaststorm threshold <BCSC group><Init Threshold>

DN70397367 101
LTE iOMS Alarms 70178 SWITCH AND SERVICE UNIT: RSTP NEWROOT
Id:0900d8058095391fConfidential
52 70178 SWITCH AND SERVICE UNIT: RSTP NEW ROOT Probable cause: Equipment Malfunction
Event type: Equipment
Default severity: Warning
MeaningThis switch is now the root for the rapid spanning tree protocol (RSTP) instance.
The former root switch blade of the cluster has gone down (or is not accessible for some other reason) forcing this switch blade to be the new root, or this switch blade has come up as a root.
The altered connectivity topology will most likely cause small disturbances in the com-munication of the system. Some data frames may be lost or data frame forwarding will be greatly delayed. These disturbances do not affect the functioning of the system.
However, other disturbances, such as error log writing from the applications' software will most likely be encountered during the restart. In addition, other alarms indicating, for example, network topology change may be encountered.
Note: Even though this alarm does not indicate that the former root switch has neces-sarily failed, this alarm would be raised in that situation as well.
Identifying additional information fields1. IP address of the switch
Additional information fields-
InstructionsThis alarm does not require any actions.
ClearingThe alarm system clears the alarm automatically after its time to live has expired.
Testing instructions
1. Locate the active RSTP root switch and log into it.2. You can use the hwcli tool to check the switch names. An example of a hwcli
output:CLM: available (FlexiSrv CPI1 000157:0108 01.03)IPD-0-A: available (FlexiSrv CPI1 000157:0108 01.03)IPD-0-B: available (FlexiSrv CPI1 000157:0108 01.03)CLA-0: available (FlexiSrv CPI1 000157:0108 01.03)CLA-1: available (FlexiSrv CPI1 000157:0108 01.03)HDF-1-1-6: available (FlexiSrv HDF1B 0010F1:0659 00.02)Switch-0: available (FlexiSrv SWSE 0010F1:7972 00.85)Switch-1: available (FlexiSrv SWSE 0010F1:7972 00.85)HDF-1-1-9: available (FlexiSrv HDF1B 0010F1:0659 00.02)WAS-0: available (FlexiSrv CPI1 000157:0108 01.03)WAS-1: available (FlexiSrv CPI1 000157:0108 01.03)

102 DN70397367
LTE iOMS Alarms
Id:0900d8058095391fConfidential
70178 SWITCH AND SERVICE UNIT: RSTP NEW ROOT
TA-A: available (FlexiSrv CPI1 000157:0108 01.03)TA-B: available (FlexiSvr CPI1 000157:0108 01.03)TA-C: available (FlexiSvr CPI1 000157:0108 01.03)
If you do not know which of the switches is the active RSTP, see step 5 below.3. After you have found out the active root switch, log into it. For example,
root@CLA-0(samuel):~#ssh switch-0
4. Give the following command n the switch in order to enter the switch management CLI:
swc
5. Check that the root path cost is zero to verify that t really is the root switch with the following command (notice also the Bridge Priority value):
show spanningtree cst detailedDepending on the switch hardware and software versions, the output is,for example, as follows:(RadiSys SWSE-A Switch) >show spanningtree cst detailedBridge Priority ...............................0BridgeIdentifier...............................00:00:00:00:50:18:7B:EETime Since Topology Change............0 day 0 hr 50 min 19 secTopology Change Count....................3Topology Change in progress.............FalseDesignated Root.............................00:00:00:00:50:18:7B:EERoot Path Cost...............................0Root Port Identifier..........................00:00Root Port Max Age.........................20Root Port Bridge Forward Delay.......15Hello Time.......................................1Bridge Hold Time...............................3CST Regional Root ...........................00:00:00:00:50:18:7B:EERegional Root Path Cost....................0
6. The other swches have a non-zero number as their root path cost (as opposed to the root switch). Log into some other switch than the active RSTP root and check the Bridge Priority with:
show spanningtree cst detailedAn example of the output:RadiSys SWSE-A Switch) >show spanningtree cst detailedBridge Priority ............................8192BridgeIdentifier...........................20:00:00:00:50:0C:BA:CCTime Since Topology Change.......0 day 1 hr 1 min 29 sec Topology Change Count...................115Topology Change in progress............FalseDesignated Root..............................00:00:00:00:50:18:7B:EERoot Path Cost................................20000
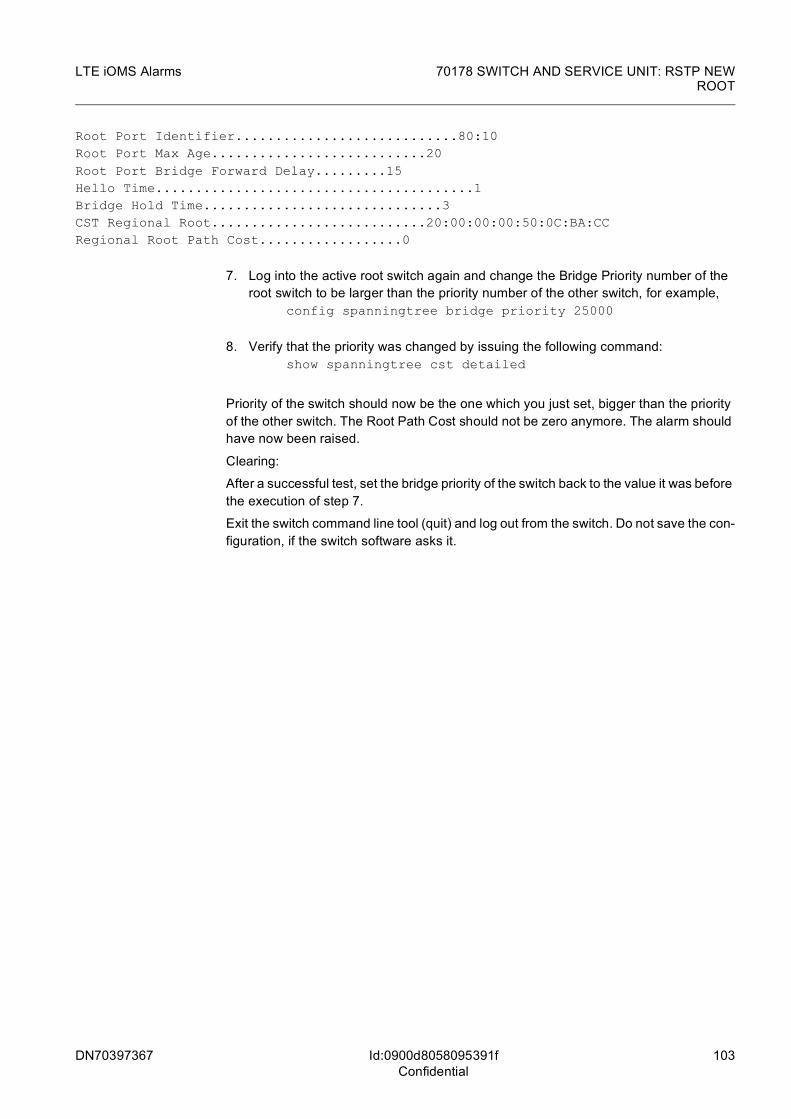
DN70397367 103
LTE iOMS Alarms 70178 SWITCH AND SERVICE UNIT: RSTP NEWROOT
Id:0900d8058095391fConfidential
Root Port Identifier............................80:10Root Port Max Age...........................20Root Port Bridge Forward Delay.........15Hello Time........................................1Bridge Hold Time..............................3CST Regional Root...........................20:00:00:00:50:0C:BA:CCRegional Root Path Cost..................0
7. Log into the active root switch again and change the Bridge Priority number of the root switch to be larger than the priority number of the other switch, for example,
config spanningtree bridge priority 25000
8. Verify that the priority was changed by issuing the following command:show spanningtree cst detailed
Priority of the switch should now be the one which you just set, bigger than the priority of the other switch. The Root Path Cost should not be zero anymore. The alarm should have now been raised.
Clearing:
After a successful test, set the bridge priority of the switch back to the value it was before the execution of step 7.
Exit the switch command line tool (quit) and log out from the switch. Do not save the con-figuration, if the switch software asks it.

104 DN70397367
LTE iOMS Alarms
Id:0900d80580953a39Confidential
70179 SWITCH AND SERVICE UNIT: QUEUE EN-GINE RESTART
53 70179 SWITCH AND SERVICE UNIT: QUEUE ENGINE RESTARTProbable cause: Software error
Event type: Processing error
Default severity: Minor
MeaningThe queue engine inside the switch fabric processor has detected a fatal error, and a queue engine restart has occurred. The switch will not forward traffic before the engine has restarted.
The fabric processor is restarted. The part of the system using this Ethernet switch expe-riences a small connectivity break and some data frames are lost. The system will tolerate this. However, other disturbances such as error log writing from the applications' software will most likely be encountered during the restart. Also, other alarms indicating, for example, network topology change, may be raised.
Identifying additional information fields1. IP address of the switch
2. fabricQueueEngineRestartReason, possible values:
• lengthError • linkerParityError • freeFifoParityError • bufferParityError • externalMemoryControllerParityError • externalMemoryControllerOverflow • externalMemoryControllerUnderflow • externalMemoryControllerRibError • externalMemoryControllerLastError • freeFifoOverflow • linkerFreeFifoOverflow • externalMemoryControllerFifoError • addressLearningRestart • cpuPortRestart
Additional information fields-
Instructions
1. Provide your local Nokia Siemens Networks representative with the following infor-mation: • the type of the switch blade, its serial number, software version, fabricQueueEn-
gineRestartReason • information provided by the "show inventory" command:a) Connect to the switch blade, for example, from the CLA-0 node.b) Start the switch management program by issuing the swc shell command.c) Execute the show inventory command.

DN70397367 105
LTE iOMS Alarms 70179 SWITCH AND SERVICE UNIT: QUEUE EN-GINE RESTART
Id:0900d80580953a39Confidential
2. In addition to these, provide your local Nokia Siemens Networks representative with as much information about the type of applications and traffic patterns in the switch blade prior to the error as possible.
ClearingClear the alarm with an alarm management application after correcting the fault as pre-sented in Instructions.
Testing instructionsThis alarm is difficult to test. This is an indication of hardware failure and cannot be tested without special tools and/or arrangements.

106 DN70397367
LTE iOMS Alarms
Id:0900d80580953a6fConfidential
70180 SWITCH AND SERVICE UNIT: (RSTP) TO-POLOGY CHANGE
54 70180 SWITCH AND SERVICE UNIT: (RSTP) TOPOLOGY CHANGEProbable cause: Equipment malfunction
Event type: Equipment
Default severity: Warning
MeaningRSTP (rapid spanning tree protocol) has changed the topology of the communication network. Possible reasons are, for example, a switch has crashed or encountered a spontaneous restart, a switch blade might have been replaced or a new switch might have been added to the communication network during a system upgrade.
The topology change, that is, blocking/unblocking of some links, causes small commu-nication disturbances and in many cases loss of some data frames. The system will tolerate this, but as a symptom, some error logs or other warnings may be encountered momentarily.
Identifying additional information fields1. IP address of the switch
Additional information fields-
InstructionsNo specific actions are required.
ClearingDo not clear the alarm. The alarm system clears the alarm automatically after its time to live has expired.
Testing instructions
1. Disconnect the front panel Ethernet cable connecting any two switches in the network element.
2. Wait for a couple of seconds. The state change for the port should happen in about 2 seconds.
3. Connect the cable again.4. The switches will have their ports in the forwarding state again and they trigger a
topology change in the spanning tree and the corresponding alarm.

DN70397367 107
LTE iOMS Alarms 70186 CLUSTER OPERATION INITIATED BY OPER-ATOR
Id:0900d805809539a6Confidential
55 70186 CLUSTER OPERATION INITIATED BY OPERATOR Probable cause: Congestion
Event type: Quality of service
Default severity: Warning
MeaningThis is an informative alarm which indicates that an operator has initiated a cluster oper-ation on the specified managed object (MO). The MO can refer to the whole cluster, a node, a recovery unit (RU), recovery group (RG), or a process. The platform high avail-ability services (HAS) is now executing the operation. The operation can be
• switchover • restart • power-off.
The operations have different effects:
• SwitchoverApplicable only to recovery groups (RG). The active RU instance of the RG is termi-nated and a standby instance on another node started or, in case of a hot active standby RG, activated. The service provided by the named RU is down until the swi-tchover is complete.
• RestartFor the cluster and nodes this means a physical restart (reboot) of node(s). For other MOs, the named MO is stopped and restarted. The services provided by the named MO are down during the restart.
• Power-offApplicable only to nodes. The named node is being powered off.
Identifying additional information fields-
Additional information fields1. Identifies the MO type (the cluster, a node, a process, or an RU).
InstructionsThis is an informative alarm and does not require any actions.
ClearingThe alarm system clears the alarm automatically after its time to live has expired.
Testing instructions
1. Log into the cluster.2. Restart a managed object using fshascli. For example:
fshascli --restart --nowarning /AS-1
The alarm is visible in the alarm database (if configured) and in the syslog as a message that begins as follows:

108 DN70397367
LTE iOMS Alarms
Id:0900d805809539a6Confidential
70186 CLUSTER OPERATION INITIATED BY OPER-ATOR
ALARM RAISE SP=70186 ...

DN70397367 109
LTE iOMS Alarms 70187 MANUAL NODE ISOLATION VERIFICATIONNEEDED
Id:0900d80580953a61Confidential
56 70187 MANUAL NODE ISOLATION VERIFI-CATION NEEDEDProbable cause: Equipment malfunction
Event type: Equipment
Default severity: Critical
MeaningThe platform high availability services (HAS) subsystem is unable to reset a faulty node with Intelligent Platform Management Interface (IPMI). The operational state of the node is not known, and therefore, it is not known if the node still holds and/or updates the shared resources.
This is a severe platform error that may result, for example, from
• a double hardware fault • an IPMI configuration error • a network partitioning problem • manual power-off of a complete chassis.
Because the HAS is not able to determine the state of the node, the active/standby recovery groups (RG) are delaying the switchovers until the node has become opera-tional again or the node is manually set to the isolation state.
The possible active/standby RGs, which have an active recovery unit (RU) instance running on the failed node, cannot recover from the situation by applying a switchover to another node. The services provided by these RGs are currently down.
Identifying additional information fields-
Additional information fields-
InstructionsThe node may currently be restarting but this cannot be verified by the HAS. The imme-diate priority is to ensure that the services can be activated. If the node becomes avail-able, which will happen if it is merely restarting, the HAS will be able to perform recovery actions and no user action is required.
However, if the node does not restart itself within a few minutes, the HAS recovery oper-ations will pend waiting for the verification that the node has been isolated (that is, it cannot access any databases or other shared resources). In this case, you must manually verify that the node is down
• Press the hot swap button of the blade. • Remove the blade and wait a while. • Re-insert the blade.
Once the node has been reset, set it to the isolation state using the HAS user interface tool fshascli:

110 DN70397367
LTE iOMS Alarms
Id:0900d80580953a61Confidential
70187 MANUAL NODE ISOLATION VERIFICATION NEEDED
1. Log into the cluster. Note that there is a risk of data corruption. Make sure that the node is down before setting the isolation state of the node.
2. Set the node to the isolated state using the -i (--isolate) option. For example,fshascli -i /AS-10After the node isolation has been set, the HAS will perform recovery actions that were pending because of this node.
3. Check from the cluster syslog (/var/log/master-syslog ) that no errors were reported following the node isolation. The node isolation will leave log entries, such as:
INFO Managed object - set isolated - operation initiated. Target=/AS-10INFO Managed object - set isolated - operation completed. Target=/AS-10
Note that if the isolation state of a node is set without actually verifying that the node is down, some serious data corruption may happen.
Contact your Nokia Siemens Networks representative for finding out the reason for the failure.
ClearingClear the alarm with an alarm management application after the reason for the IPMI failure has been clarified and the problem solved.
Testing instructionsNote! The alarm is only valid in multi-node environments.
1. Select a node that will be taken down and on the active Directory node (CLA-0 or CLA-1) comment it out from /etc/opt/Nokia_BP/hwmap by adding a # charac-ter at the beginning of the line. For example,rack1_chassis1_slot9 = "TA-A", "192.168.0.6", "LS21"=> # rack1_chassis1_slot9 = "TA-A", "192.168.0.6", "LS21"
2. Verify that master CMF is running in the current node by issuing fscmfcli command, for example:
$ fscmfcli -s /CLA-0CLA-0: CMF-BACKUP priority: 5CLA-1: CMF-SERVING priority: 6
3. In the above situation the master CMF is running in the remote node. Force master CMF to yield to the current node using fscmfcli and wait for the master CMF to start up in the current node, for example:
$ fscmfcli -y /CLA-1Host CLA-1 is giving up active role.
$ fscmfcli -s /CLA-0CLA-0: CMF-SERVING priority: 5CLA-1: CMF-BACKUP priority: 6
4. Verify that the node selected earlier is operational using fshascli, for example:$ fshascli -s /TA-A/TA-A:

DN70397367 111
LTE iOMS Alarms 70187 MANUAL NODE ISOLATION VERIFICATIONNEEDED
Id:0900d80580953a61Confidential
administrative(UNLOCKED) <== Unlockedoperational(ENABLED) <== Operationalusage(ACTIVE)procedural()availability()unknown(FALSE)alarm()
5. Restart the node using fshascli and wait for it to stop responding to pings, for example:
$ fshascli -rn /TA-A/TA-A is restarted successfully
$ ping ta-aPING TA-A.internalnet.localdomain (192.168.0.6) 56(84) bytes of data.64 bytes from TA-A.internalnet.localdomain (192.168.0.6): icmp_seq=0 ttl=64time=0.774 ms...--- TA-A.internalnet.localdomain ping statistics ---61 packets transmitted, 31 received, 49% packet loss, time 60027msrtt min/avg/max/mdev = 0.080/0.106/0.774/0.122 ms, pipe 2
6. Restart the node again using fshascli, for example:$ fshascli -rn /TA-AUnable to REBOOT node; No IPMI and no connection to node
7. Set the node as isolated using fshascli, for example:$ fshascli -i /TA-A/TA-A set as isolated
The alarm raising is visible in the alarm database (if configured) and in syslog as a message that begins as follows:
ALARM RAISE SP=70187 ...
Clearing:
1. Uncomment the commented line in /etc/opt/Nokia_BP/hwmap and restart the node using fshascli, for example:
$ fshascli -rn /TA-A
The alarm cancellation is visible in the alarm database (if configured) and in syslog as a message that begins as follows:
ALARM CANCEL SP=70187 ...
Note! Remember to yield the master CMF back to its original node after testing the alarm.

112 DN70397367
LTE iOMS Alarms
Id:0900d80580953920Confidential
70188 MANAGED OBJECT SHUTDOWN BY OPERA-TOR
57 70188 MANAGED OBJECT SHUTDOWN BY OPERATOR Probable cause: Congestion
Event type: Quality of service
Default severity: Warning
MeaningThis is an informative alarm which indicates that the specified managed object (MO) which can be the whole cluster, a node or a recovery unit (RU) is being shutdown. The named MO and all its unlocked sub-resources are now terminating.
The MO is being shutdown by an operator. All services provided by the named MO are terminating. Once the operation is completed, the administrative state of the MO and all its sub-MOs will be changed to locked.
Note that a shutdown request may take a long time if the maximum duration for the oper-ation has not been specified. The shutdown request can be forced to completion by issuing a lock command. In that case the platform high availability services (HAS) will terminate the services ungracefully.
Identifying additional information fields-
Additional information fields1. Identifies the MO type (a cluster, a node, or an RU)
InstructionsThis is an informative alarm which requires no user actions.
ClearingThe alarm system clears this alarm automatically after its time to live has expired.
Testing instructionsThe target of the shutdown command can be a cluster, node, recovery group or recovery unit.
1. Log into the cluster2. Execute the shutdown command to the managed object. For example: fshascli --
shutdown /AS-1
The alarm is also visible in the syslog as a message that begins as follows:
ALARMRAISE SP=70188 ...
Note that in the example above --shutdown does not power off the node. It just grace-fully shuts down all HAS managed non-critical processes in the node.
After the testing is finished, use the fshascli --unlock command to get the initial situation restored. For example:
fshascli --unlock /AS-1

DN70397367 113
LTE iOMS Alarms 70189 MANAGED OBJECT UNLOCKED BY OPERA-TOR
Id:0900d80580953996Confidential
58 70189 MANAGED OBJECT UNLOCKED BY OPERATOR Probable cause: Congestion
Event type: Quality of service
Default severity: Warning
MeaningThis is an informative alarm which indicates that the specified managed object (MO) which can be the whole cluster, a node, or a recovery unit (RU) has been unlocked. The named MO and its unlocked sub-resources (if there are any) can now be activated.
Notice that the MO (or its sub-MOs) can remain locked because of the dependency on a higher level MOs. That is, the unlock operation will not have effect on the MO in question before the higher level MOs are unlocked. For example, an RU in a node will remain locked, if the node or the cluster MO is locked.
The MO has been set to the unlocked state. If all the higher level MOs are unlocked as well, the services provided by the MO are activated.
Identifying additional information fields-
Additional information fieldsIdentifies the MO type (a cluster, a node, or an RU)
InstructionsThis is an informative alarm and does not require any actions.
ClearingThe alarm system clears the alarm automatically after its time to live has expired.
Testing instructionsUnlock the previously locked managed object using fshascli:
1. Log into the cluster.2. Unlock the managed object using fshascli. For example:
fshascli -unlock /AS-1/FSNodeDNSServer
The alarm is also visible in the syslog as a message that begins as follows:
ALARM RAISE SP=70189 ...
Note that this test should be run after the test case for alarm 70166 MANAGED OBJECT LOCKED.

114 DN70397367
LTE iOMS Alarms
Id:0900d805809539d5Confidential
70194 RECOVERY GROUP SWITCHOVER
59 70194 RECOVERY GROUP SWITCHOVERProbable cause: Software program abnormally terminated
Event type: Processing error
Default severity: Major
MeaningThe platform high availability services (HAS) has initiated a switchover. This may be a recovery action to a recovery unit (RU) failure or result from an administrative operation such as lock or shutdown of the active RU or a switchover request from an explicit recovery group (RG). The new active recovery unit is now starting (a cold active standby RG) or being activated (a hot active standby RG).
The service provided by the RG is currently unavailable. The normal operation will resume if the switchover operation is successful.
Identifying additional information fields-
Additional information fields1. Identifies the managed object (MO) name of the new active RU.
InstructionsVerify that the switchover operation is successful. This alarm is automatically cleared if the switchover succeeds. However, depending on the type of the application, the time for starting (or activating) a standby RU can vary from a few seconds to tens of minutes. The state of the new active RU can be checked using the HAS user interface fshascli:
1. Log into the cluster.2. Use the fshascli -s option to see the state of the new active RU.
The MO name of the new active RU can be found in the application additional infor-mation field 1. For example:fshascli -s /AS-10/ApplServer-0An operational RU has UNLOCKED administrative state, ENABLED operational state, an empty procedural status, and "ACTIVE" role. The procedural status of INI-TIALIZING means that the RU is still starting up.If the switchover fails (operational state of the new active RU is DISABLED), check the syslog for a possible explanation for the failure and if required, contact your Nokia Siemens Networks representative.
Note that if both RUs in the active standby RG fail repeatedly, this alarm may be raised for both RUs. In that case the situation has to be corrected immediately.
ClearingThe alarm system will clear the alarm automatically after the problem is solved (the swi-tchover succeeds).
Testing instructionsThe alarm can be tested by issuing a forced switchover command to a RG.
1. Log into the cluster.2. Issue a switchover for a recovery group using fshascli. For example:
DN70397367 115
LTE iOMS Alarms 70194 RECOVERY GROUP SWITCHOVER
Id:0900d805809539d5Confidential
fshascli -wn /LogDB
The alarm is raised and stored to the alarm database (if configured) once the command has been successfully issued. The raising of the alarm can be observed using an alarm management application.
Clearing
The alarm is automatically cleared after the problem is solved (that is, the switchover succeeds). In this case, the alarm cancellation is also visible in the alarm management application.
Note however, that the alarm may have to be cleared manually, if the node running the cluster manager functionality is rebooted.

116 DN70397367
LTE iOMS Alarms
Id:0900d80580953a0fConfidential
70197 MINIMUM THRESHOLD HAS BEEN CROSSED
60 70197 MINIMUM THRESHOLD HAS BEEN CROSSED Probable cause: Threshold Crossed
Event type: Quality of service
Default severity: Warning
MeaningThis alarm indicates that a minimum threshold crossing, based on the threshold rule defined for the measurement result, has been detected. The seriousness of the alarm depends on the measurement(s) that reached the defined threshold value.
The precise effect of this alarm cannot be determined since the nature of the alarm depends on the measurement(s) involved in the measurement result.
Identifying additional information fields-
Additional information fields1. The name of the performance indicator (PI) that crossed the threshold boundary.
InstructionsThe user has configured the threshold rules so that the events the user is interested in will be notified. As a result, any detailed instructions cannot be given.
Use the performance management application to get detailed information on the mea-surement(s) that caused this alarm.
ClearingThe system clears the alarm automatically when the measurement result goes up and is continuously held at the minimum threshold clearing level or above.
Testing instructionsDo not test this alarm. Testing this alarm would generate a huge flow of Ethernet packets, which is not recommended in a live system.

DN70397367 117
LTE iOMS Alarms 70204 UNEXPECTED PERSISTENT STATUS DATAVALUES FOR IN-MEMORY DATABASE
Id:0900d8058095392fConfidential
61 70204 UNEXPECTED PERSISTENT STATUS DATA VALUES FOR IN-MEMORY DATABASEProbable cause: Application Subsystem Failure
Event type: Processing error
Default severity: Critical
MeaningPersistent status data values for a replicated pair of in-memory databases have become corrupted (inconsistent combination of values or erroneous single value).
The database high availability (HA) service for the in-memory database cannot deter-mine which of the databases should accept the active role. The watchdog process cannot enable the database and application does not connect to any of the database instances. Manual recovery is required.
Identifying additional information fields
Additional information fields2. Persistent role
3. Persistent status
4. Peer persistent role
5. Peer persistent status
Instructions
1. Check the persistent status info in application additional info for types or invalid com-binations. The valid combinations are:
(“”,””,””,””)(“active”,”sync”,””,””)(“active”,”oosync”,””,””)(“active”,”oosync”,”active”,”sync”)(“active”,”duplicate”,””,””)(“active”,”duplicate”,”active”,”sync”)(“standby”,”sync”,”active”,”sync”)(“standby”,”sync”,”active”,”oosync”)(“standby”,”sync”,”active”,”duplicate”)(“standby”,”oosync”,”active”,”sync”)(“standby”,”oosync”,”active”,”oosync”)(“standby”,”oosync”,”active,”duplicate”)
plus all the combinations made from above combinations by swapping persistent role and peer persistent role, and persistent status and peer persistent status.
2. If a typo is found and it is known that the values have been updated manually, correct the value with the fshascli command as illustrated in the following exam-ple:fshascli –S Role=active fsdbHostName=TA-A,fsdbName=DB_TestTT,fsFragmentId=DB,fsClusterId=ClusterRoot
3. If an invalid value combination is found, try to validate it if one of the database instances is able to play an active role. Then, use the fshascli-command to set

118 DN70397367
LTE iOMS Alarms
Id:0900d8058095392fConfidential
70204 UNEXPECTED PERSISTENT STATUS DATA VALUES FOR IN-MEMORY DATABASE
the correct combination. For example, if an instance of node TA-A gets the active role and an instance of TA-B the standby role, use the following commands to correct the status:
fshascli –S Role=standby fsdbHostName=TA-B,fsdbName=DB_TestTT,fsFragmentId=DB,fsClusterId=ClusterRootfshascli –S State=oosync fsdbHostName=TA-B,fsdbName=DB_TestTT,fsFragmentId=DB,fsClusterId=ClusterRootfshascli –S Role=active fsdbHostName=TA-A,fsdbName=DB_TestTT,fsFragmentId=DB,fsClusterId=ClusterRootfshascli –S State=oosync fsdbHostName=TA-A,fsdbName=DB_TestTT,fsFragmentId=DB,fsClusterId=ClusterRoot
The in-memory database watchdog process checks periodically the persistent status data and will enable the TA-A instance after a while.
ClearingClear the alarm with alarm management application after correcting the fault as explained in Instruction.
Testing instructions
1. Lock the TimesTen recovery groups running both instances of the database. For example:
fshascli –ln /InMemoryDBafshascli –ln /InMemoryDBb
2. Corrupt persistent state of the database. For example:fshascli –S Role=reactive fsdbHostName=TA-A,fsdbName=DB_TestTT,fsFragmentId=DB,fsClusterId=ClusterRoot
3. Unlock the TimesTen recovery groups running both instances of the database. For example:
fshascli –u /InMemoryDBafshascli –u /InMemoryDBb

DN70397367 119
LTE iOMS Alarms 70205 REPLICATION FAILING FOR IN-MEMORY DA-TABASE
Id:0900d80580953a36Confidential
62 70205 REPLICATION FAILING FOR IN-MEMORY DATABASE Probable cause: Application Subsystem Failure
Event type: Processing error
Default severity: Minor
MeaningReplication for the in-memory database is not functioning.
Updates from the active to the standby database are not replicated. The standby database cannot become active (no successful failover for database application) unless replication starts functioning again (or the database is copied from the active node as a part of start-up or switchover recovery).
Log files may not be purged; this may eventually fill the database disk partition making further updates to the database impossible.
Identifying additional information fields1. Database name
Additional information fields2. Current role (active, standby, unknown)
3. Peer node name
Instructions
1. See the reason for the failure from field 1 of the application additional info.2. If the reason is “NoReplicationAgent” the watchdog process attempts to restart
the agent automatically after raising the alarm. Use the parameter management application to check the value of fsdbReplicationStatusCheckInterval attribute. The value defines how often the watchdog checks the status of the repli-cation. Wait until the next status check takes place. If the alarm still remains in the active alarms list, copy the current contents of syslog and give item to your local Nokia Siemens Networks representative.
3. If the reason is “ReplicationStopped” somebody has stopped the replication typically intentionally. The watchdog process does not attempt to restart the replica-tion automatically. The replication must be restarted manually with the command
ttAdmin –repStart <DB-name>If the alarm does not go away from or re-appears soon the active alarm list, copy the current contents of syslog and contact your local Nokia Siemens Networks repre-sentative.
4. If the reason is “ReplicationFallenBehind”, the database instance having active role is not able to keep the standby database synchronised as required by the fsdbReplicationStatusCheckLimit attribute. Typically, one of the two nodes running peer database instances or network is overloaded when this alarm is raised. A peak in transaction flow produced by the database applications may also cause this alarm.If this alarm persists in the active alarms list, use top and ifconfig tools to estimate the current load in your system and contact your local Nokia Siemens Networks representative.

120 DN70397367
LTE iOMS Alarms
Id:0900d80580953a36Confidential
70205 REPLICATION FAILING FOR IN-MEMORY DA-TABASE
5. If the reason is “CommunicationProblem” usefshascli –s /<node>/<RU-name>
to verify that the status of the peer in-memory database recovery unit (<node> is of the 3 from application additional info and that the <RU-name> can be derived from the Application field of the alarm). If the peer recovery unit is locked, unlock it with the command
fshascli –u /<node>/<RU-name>If the alarm still persists , copy the current contents of syslog and contact your local Nokia Siemens Networks representative.
ClearingThe system clears the alarm automatically when the fault has been corrected.
Testing instructionsStop replication with the command
ttAdmin –repStop <DB-name>
The alarm with the reason “ReplicationStopped” should appear shortly.

DN70397367 121
LTE iOMS Alarms 70236 LDAP DATABASE CORRUPTED
Id:0900d805809539e8Confidential
63 70236 LDAP DATABASE CORRUPTED70236 LDAP DATABASE CORRUPTED
Severity Major
Fault reasonA primary or secondary Lightweight Directory Access Protocol (LDAP) database is cor-rupted and cannot be accessed anymore. An LDAP database can get corrupted, for example, when:
• a disk becomes full while the database is being updated • a node failure and/or ungraceful node restart happens while the database is being
updated.
The identified LDAP database is currently unavailable.
In case of a secondary database, the only impact is that the node start-ups can take slightly longer because some platform services attempt to use the secondary data-base(s) by default.
Failure of the primary database has a more significant impact. Most application pro-cesses cannot be (re)started anymore and applications that update LDAP will fail. If a secondary database is still available, nodes can still be (re)started but only basic platform services will be able to start. If the primary and all secondary databases have failed, the cluster or any of its nodes cannot (re)start anymore. The system will next automatically try to recover the corrupted database from an operational primary or sec-ondary database.
Description
Identifying additional information fields-
Additional information fields
1. Type of the database: Primary or Secondary2. Relative path of the database directory. Notice that secondary databases are
usually located in a directory such as /var/mnt/local/localimg/<platform release>/opt/Nokia_BP/var/pmgmt/pt/Nokia_BP/var/pmgmt/<platform release>/fsPlatformSlave-ldbm. Primary LDAP database directory is usually of the following format: /var/mnt/local/sysimg/<platform release>/opt/Nokia_BP/var/pmgmt/<platform release>/fsPlatform-ldbm. Notice especially that the lowest level directory is fsPlatformSlave-ldbm for secondary databases and fsPlatform-ldbm for the primary database.
InstructionsThe system will automatically attempt to recover the corrupted database from a func-tional copy. If the automatic recovery is successful, this alarm is automatically cleared and the system raises a new "CORRUPTED LDAP DATABASE RECOVERED" warning alarm. The automatic recovery, if successful, takes less than a minute.
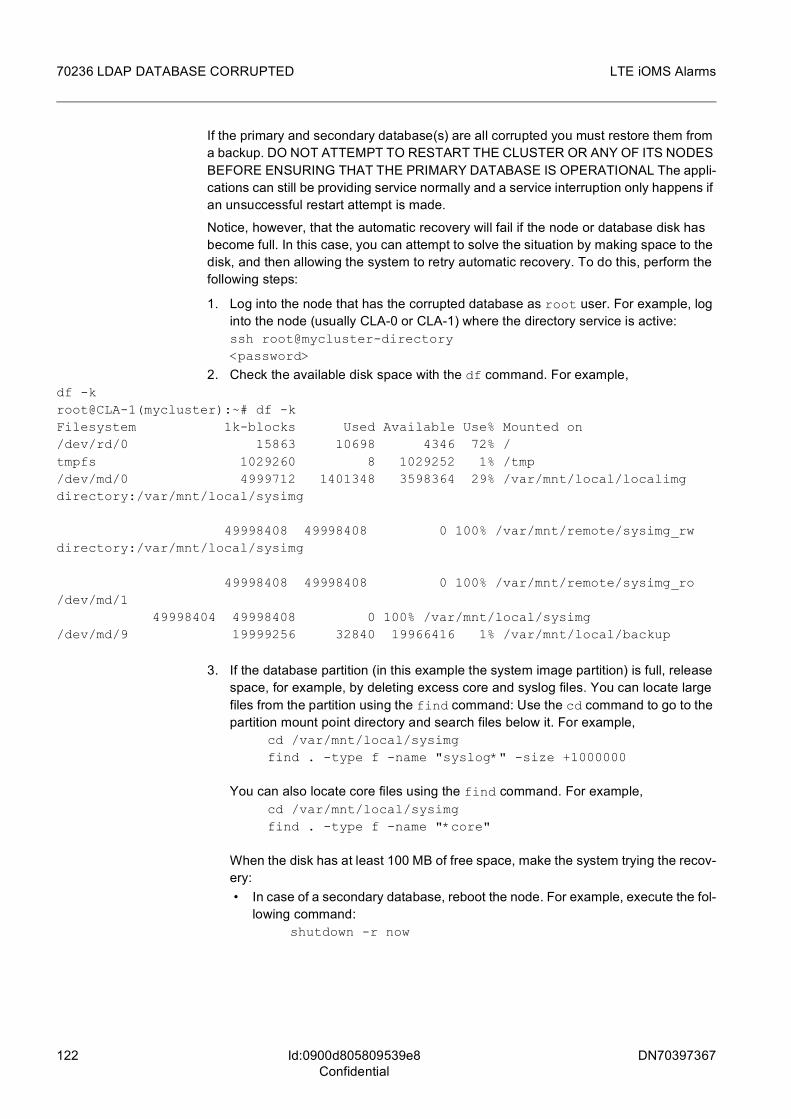
122 DN70397367
LTE iOMS Alarms
Id:0900d805809539e8Confidential
70236 LDAP DATABASE CORRUPTED
If the primary and secondary database(s) are all corrupted you must restore them from a backup. DO NOT ATTEMPT TO RESTART THE CLUSTER OR ANY OF ITS NODES BEFORE ENSURING THAT THE PRIMARY DATABASE IS OPERATIONAL The appli-cations can still be providing service normally and a service interruption only happens if an unsuccessful restart attempt is made.
Notice, however, that the automatic recovery will fail if the node or database disk has become full. In this case, you can attempt to solve the situation by making space to the disk, and then allowing the system to retry automatic recovery. To do this, perform the following steps:
1. Log into the node that has the corrupted database as root user. For example, log into the node (usually CLA-0 or CLA-1) where the directory service is active:ssh root@mycluster-directory<password>
2. Check the available disk space with the df command. For example,df -kroot@CLA-1(mycluster):~# df -k Filesystem 1k-blocks Used Available Use% Mounted on/dev/rd/0 15863 10698 4346 72% /tmpfs 1029260 8 1029252 1% /tmp/dev/md/0 4999712 1401348 3598364 29% /var/mnt/local/localimgdirectory:/var/mnt/local/sysimg
49998408 49998408 0 100% /var/mnt/remote/sysimg_rwdirectory:/var/mnt/local/sysimg
49998408 49998408 0 100% /var/mnt/remote/sysimg_ro/dev/md/1 49998404 49998408 0 100% /var/mnt/local/sysimg/dev/md/9 19999256 32840 19966416 1% /var/mnt/local/backup
3. If the database partition (in this example the system image partition) is full, release space, for example, by deleting excess core and syslog files. You can locate large files from the partition using the find command: Use the cd command to go to the partition mount point directory and search files below it. For example,
cd /var/mnt/local/sysimgfind . -type f -name "syslog*" -size +1000000
You can also locate core files using the find command. For example,cd /var/mnt/local/sysimgfind . -type f -name "*core"
When the disk has at least 100 MB of free space, make the system trying the recov-ery: • In case of a secondary database, reboot the node. For example, execute the fol-
lowing command:shutdown -r now
DN70397367 123
LTE iOMS Alarms 70236 LDAP DATABASE CORRUPTED
Id:0900d805809539e8Confidential
• In case of the primary database, use fshascli to restart the Directory service: fshascli -rnF /Directory Note that this will terminate your terminal connection, thus you will need to log in again.If the database was not corrupted because of a full disk, or the automatic recovery fails again, for example, because all LDAP databases are corrupted, you must restore the databases from a backup copy. For instructions on the restore process, see the backup and restore customer documentation.
ClearingThe alarm is cleared automatically if the automatic recovery operation is successful. The alarm must be cleared manually, in case the database has to be manually restored from a backup.
Testing instructionsThe alarm can be tested by simulating a secondary LDAP corruption. This can be done by renaming the secondary LDAP database directory in the CLA node where the Direc-tory recovery group is active.
Move to the directory where the secondary LDAP is located. The default location is /var/mnt/local/localimg/flexiserver/opt/Nokia_BP/var/pmgmt/_active/. The location and the name of the database can also be verified from fsPlatformSlave.conf file located under /opt/Nokia_BP/etc/ldapfiles. The secondary LDAP database is defined after "directory" tag.
cd /var/mnt/local/localimg/flexiserver/opt/Nokia_BP/var/pmgmt/_active
Rename the current secondary LDAP database.
mv fsPlatformSlave-ldbm fsPlatformSlave-ldbm.bkp
Execute the LDAP recovery script manually. The execution of the script may take several minutes.
/opt/Nokia_BP/bin/fsLDAPRecoverDatabase -s
The alarm should be visible immediately after starting the recovery script. The script will use the primary LDAP to restore the secondary LDAP database after which the alarm will be cancelled. Also alarm "70237: CORRUPTED LDAP DATABASE RECOVERED" will be raised.
If the alarm was cancelled successfully and a new secondary LDAP database was created the backup database can safely be removed.
rm -rf fsPlatformSlave-ldbm.bkp
If the alarm was not cancelled, the secondary LDAP database was not created or the script was terminated before it could finish, restore the backup database. In this case the alarm needs to be cancelled manually. Remove the partially created secondary LDAP database if one exists.
rm -rf fsPlatformSlave-ldbm
Restore the original database.
cp -r fsPlatformSlave-ldbm.bkp fsPlatformSlave-ldbm

124 DN70397367
LTE iOMS Alarms
Id:0900d805809539e8Confidential
70236 LDAP DATABASE CORRUPTED
Cancelling

DN70397367 125
LTE iOMS Alarms 70237 CORRUPTED LDAP DATABASE RECOV-ERED
Id:0900d805809539bbConfidential
64 70237 CORRUPTED LDAP DATABASE RECOVEREDProbable cause: Corrupt data
Event type: Processing error
Default severity: Warning
MeaningA primary or secondary LDAP (Lightweight Database Access Protocol) database was corrupted but it has been successfully recovered. The LDAP databases can get cor-rupted, for example, when
• a disk becomes full while the database is being updated • a node failure and/or ungraceful node restart happens while the database is being
updated.
The platform software has automatically recovered the database from an operational primary or secondary database. Some applications may have been impacted by the temporary unavailability of the LDAP database. As the platform restarts the failed appli-cations, the problem should not have caused permanent problems.
Identifying additional information fields-
Additional information fields
1. Type of the database that was corrupted; "Primary" or "Secondary".2. Relative path of the database directory. Notice that secondary databases are
usually located in a directory such as /var/mnt/local/localimg/<platform release>/opt/Nokia_BP/var/pmgmt/<platform release>/fsPlatformSlave-ldbm. The primary LDAP database directory is usually in the following format: /var/mnt/local/sysimg/<platform release>/opt/Nokia_BP/var/pmgmt/<platform release>/fsPlatform-ldbm. Notice especially that the lowest level directory is fsPlatformSlave-ldbm for secondary databases and fsPlatform-ldbm for the primary database.
InstructionsThis is an informative alarm. No operator actions required.
ClearingThe system clears the alarm automatically when the fault has been corrected.
Testing instructionsThe alarm can be tested by simulating a secondary LDAP corruption. This can be done by renaming the secondary LDAP database directory in the CLA node where the Direc-tory recovery group is active.
Change the directory to the one where the secondary LDAP is located. The default location is /var/mnt/local/localimg/flexiserver/opt/Nokia_BP/var/pmgmt/_active/. The location and the name of the database can also be verified from

126 DN70397367
LTE iOMS Alarms
Id:0900d805809539bbConfidential
70237 CORRUPTED LDAP DATABASE RECOV-ERED
fsPlatformSlave.conf file located under /opt/Nokia_BP/etc/ldapfiles. The secondary LDAP database is defined after "directory" tag.
cd /var/mnt/local/localimg/flexiserver/opt/Nokia_BP/var/pmgmt/_active
Rename the current secondary LDAP database.
mv fsPlatformSlave-ldbm fsPlatformSlave-ldbm.bkp
Execute the LDAP recovery script manually. The execution of the script may take several minutes.
/opt/Nokia_BP/bin/fsLDAPRecoverDatabase -s
Alarm "70236: LDAP DATABASE CORRUPTED" should be visible immediately after starting the recovery script. The script will use the primary LDAP to restore the second-ary LDAP database after which the alarm will be raised. Also alarm "70236: LDAP DATABASE CORRUPTED" will be cancelled.
If the alarm was raised successfully and a new secondary LDAP database was created the backup database can safely be removed.
rm -rf fsPlatformSlave-ldbm.bkp
If the alarm was not raised, the secondary LDAP database was not created or the script was terminated before it could finish, restore the backup database. Remove the partially created secondary LDAP database if one exists.
rm -rf fsPlatformSlave-ldbm
Restore the original database.
cp -r fsPlatformSlave-ldbm.bkp fsPlatformSlave-ldbm

DN70397367 127
LTE iOMS Alarms 70239 FRONTPANEL LINK FAULTY
Id:0900d80580953918Confidential
65 70239 FRONTPANEL LINK FAULTYProbable cause: 325
Event type: x1
Default severity: 5 Warning
MeaningThe LAN (Local Area Network) monitoring software has declared a frontpanel link faulty.
This is a serious condition as the redundancy level of the system is lowered due to the failed link.
Additional information fields
1. Distinguished Name of the first endpoint.2. Distinguished Name of the second endpoint. The value may be 'outside', indicating
an outside link.3. 0 - resets are not enabled, 1 - resets are enabled.
InstructionsCheck the severity of the alarm. If the severity is WARNING, then: the system is trying to recover the failed link so currently no actions are needed. If the severity is MAJOR, then: A frontplane link consists of one of three components from which it is impossible for the system to distinguish the real cause. The components are:
1. The physical frontpanel cable 2. The physical port on the blade 1 OR a FlexiServer external peer3. The physical port on the blade 2 OR a FlexiServer external peer
If the "are_resets_enabled" parameter is true in the alarm info, then the system has already tried to reset the components and the method of repairing the fault is to replace one or more of these components starting from the top, except if the peer is an external entity. In the case of an external entity, the LAN monitoring software has no influence over it. If the "are_resets_enabled" is false, however, it means that no automatic resets have been executed on these components and manual resets could be beneficial as instructed in the hardware maintenance documentation.
Refer to the hardware maintenance documentation for how to change faulty compo-nents. After replacing any components and powering on the system or restarting a com-ponent, allow the system at least five (5) minutes to stabilise the fault information. During this time other alarms might appear and this alarm might be cancelled for a while but do not react to the other alarms.
ClearingThe system clears the alarm automatically when the fault has been corrected.
Testing instructionsThe alarm is issued only when there is the optional 'Switch Monitoring' feature present in the system.
1. Select a frontpanel interface that can be disconnected. 2. Disconnect the Ethernet cable to the interface.3. Observe the alarm.4. Reconnect the cable.

128 DN70397367
LTE iOMS Alarms
Id:0900d80580953918Confidential
70239 FRONTPANEL LINK FAULTY
5. Observe the cancelling of the alarm.
DN70397367 129
LTE iOMS Alarms 70240 BACKPLANE LINK FAULTY
Id:0900d80580953a37Confidential
66 70240 BACKPLANE LINK FAULTYProbable cause: 325
Event type: x1
Default severity: 5 Warning
MeaningThe LAN (Local Area Network) monitoring software has declared a backplane link faulty.
This is a serious condition as the redundancy level of the system is lowered due to the failed link.
Additional information fields
1. Distinguished Name of the first endpoint.2. Distinguished Name of the second endpoint.3. 0 - resets are not enabled, 1 - resets are enabled.
InstructionsCheck the severity of the alarm. If the severity is WARNING, then: the system is trying to recover the failed link so no actions are needed at this point. If the severity is MAJOR, then: a backplane link consists of one of three components from which it is impossible for the system to distinguish the real cause. The components are:
1. The physical port on the node. 2. The physical port on the switch.3. The physical media between those two ports (i.e. the chassis).
If the "are_resets_enabled" parameter is true in the alarm info the system has already tried to reset the components and the method of repairing the fault is to replace one or more of these components starting from the top. If the "are_resets_enabled" is off, however, it means that no automatic resets have been executed on these components and manual resets could be beneficial as instructed in the hardware maintenance documentation. The name and location of the node are included in the application additional info. Refer to the hardware maintenance documentation for how to change faulty compo-nents. After replacing any of the components and powering on the system or restart-ing a component, allow the system at least five (5) minutes to stabilise the fault information. During that time other alarms might appear and this alarm might be can-celled for a while but do not react to the other alarms.
ClearingThe system clears the alarm automatically when the fault has been corrected.
Testing instructions
1. Select a backplane interface that can be shut down. 2. Shut the interface down with the 'ifconfig interface_name down'
command.3. Observe the alarm.4. Observe the cancelling of the alarm as the system recovers

130 DN70397367
LTE iOMS Alarms
Id:0900d805809539e5Confidential
70241 SWITCH FAULTY
67 70241 SWITCH FAULTYProbable cause: 325
Event type: x1
Default severity: 5 Warning
MeaningThe LAN (Local Area Network) monitoring software has declared a switch faulty.
This is a serious condition as the redundancy level of the system is lowered due to the failed switch.
Additional information fields
1. The location of the switch (cabinet, chassis, plugin unit).2. 0 - resets aren't enabled, 1 - resets are enabled.
InstructionsCheck the severity of the alarm. If the severity is WARNING, then: The system is trying to recover the switch and no user actions are needed. If the severity is MAJOR, then: If the "are_resets_enabled" parameter is true in the alarm info, then the system has already tried to reset the switch and the switch must therefore be replaced. If "are_resets_enabled" is off, however, it means that no automatic resets have been executed on this switch and manual reset could be beneficial as instructed in the hardware maintenance documentation. The name of the switch is included in the appli-cation additional info. Refer to the hardware maintenance documentation for how to change faulty switch. After replacing the switch and powering it on or restarting it, allow the system at least five (5) minutes to stabilise the fault information. During that time other alarms might appear and this alarm might be cancelled for a time but do not react the other alarms.
ClearingThe system clears the alarm automatically when the fault has been corrected.
Testing instructionsThe alarm is issued only when there is the optional 'Switch Monitoring' feature present in the system.
1. Select an Ethernet switch blade that can be removed from the chassis.2. Remove the switch blade from the chassis.3. Observe the alarm.4. Put the switch blade back in the chassis. 5. Observe the cancelling of the alarm.

DN70397367 131
LTE iOMS Alarms 70242 ALARM LOG FILE INACCESSIBLE
Id:0900d80580953942Confidential
68 70242 ALARM LOG FILE INACCESSIBLEProbable cause: File Error
Event type: Processing error
Default severity: Critical
MeaningAlarm processor cannot open or read the alarm log file.
Alarm notifications recorded in the alarm log file cannot reach the alarm system, and as a result the control for the alarm situation in the network element is lost.
Identifying additional information fields-
Additional information fields
1. reason, possible values: • file cannot be opened • permanent file read error
2. additional information about the problem (for example, text of the corresponding system exception.)
Instructions
1. Check with the parameter management application that the alarm log file name in the alarm processor configuration in LDAP (Lightweight Directory Access Protocol) ( fsParameterId=fsLogFileName, fsAlarmProcessorConfigurationId=Default, fsAlarmProcessorId=AlarmProcessor1, fsFragmentId= AlarmProcessors, fsFragmentId=AlarmMgmt, fsClusterId=ClusterRoot) is the same as the name specified in the Manage-ment Object Model in the SS_MOMfsAlarm document.
2. If the value in LDAP is different, then modify the LDAP value and restart the alarm processor with the following command:fshascli -r /<node>/FSAlarmSystemServer/AlarmProcessorwhere <node> is the name of the node where alarm processor is deployed.
3. If the values are the same, then fill in a problem report with the alarm data and send it to your Nokia Siemens Networks representative.
ClearingThe alarm is cleared automatically by the alarm system when access to the alarm log file is restored.
Testing instructions
1. Use the parameter management application to set a wrong log file name in the LDAP alarm processor configuration (fsParameterId=fsLogFileName, fsAlarmProcessorConfigurationId=Default, fsAlarmProcessorId=AlarmProcessor1, fsFragmentId= AlarmProcessors, fsFragmentId=AlarmMgmt, fsClusterId=ClusterRoot).
2. Restart alarm processor with the following command:

132 DN70397367
LTE iOMS Alarms
Id:0900d80580953942Confidential
70242 ALARM LOG FILE INACCESSIBLE
fshascli -r /<node>/FSAlarmSystemServer/AlarmProcessorwhere <node> is the name of the node where alarm processor is deployed.
3. After verifying that an alarm for the situation has been raised, correct the fault as described in the 'Instructions for operator' field and check that the alarm is cleared.

DN70397367 133
LTE iOMS Alarms 70243 ALARM PROCESSOR CONFIGURATION ISOUT OF ORDER
Id:0900d80580953949Confidential
69 70243 ALARM PROCESSOR CONFIGURA-TION IS OUT OF ORDERProbable cause: Configuration or customising error
Event type: Processing error
Default severity: 4 Minor
MeaningThe configuration of alarm processor contains an invalid attribute value or an attribute is missing.
The system ignores the invalid value and uses a default value.
Additional information fields
1. Invalid attribute's value or an empty string if attribute or its value is missing.
Instructions
1. Use the parameter management application to correct the invalid value of the attri-bute. The distinguished name of the attribute - identifying its location in the LDAP - can be found in the 'Managed Object Id' field of the alarm.
2. Restart alarm processor with the following command:fshascli -r /<Node>/FSAlarmSystemServer/AlarmProcessorwhere <Node> is the name of the node where alarm processor is deployed. The default values of the alarm processor attributes used when correcting the situation are listed below:
Attribute Default value
fsNumProcessors 5
fsHasSimpleAware true
fsLogFileName /var/log/master-alarms
fsLogParserSleepTime 1
fsAlarmNotificationCollectorSleepTime 1
fsParameterNotificationProcessorSleepTime 15
fsAlarmHistoryProcessorSleepTime 60
fsAlarmHistorySize 1000000
fsBatchSize 120
fsHeartbeatInterval 300
fsAlarm70247raise true
fsSeverityChangeReRaise false
fsNotificationBatchSize 20
fsStrictAlarmTimeOrder false
fsAllowedMCACAlarms true
fsDatSupport true
fsAutoAckedDAT true

134 DN70397367
LTE iOMS Alarms
Id:0900d80580953949Confidential
70243 ALARM PROCESSOR CONFIGURATION IS OUT OF ORDER
ClearingThe system clears the alarm automatically when the fault has been corrected.
Testing instructions
1. Use the parameter management application to set an invalid value for an attribute, for example, Customized configuration i.e. specific values for parameters can be found in the Alarm System configuration in LDAP under (fsAlarmProcessorConfigurationId=Default ,fsAlarmProcessorId=AlarmProcessor1 , fsFragmentId= AlarmProcessors, fsFragmentId=AlarmMgmt, fsClusterId=ClusterRoot).
2. Restart alarm processor with the following command:fshascli -r /<Node>/FSAlarmSystemServer/AlarmProcessorWhere, <Node> is the name of the node where alarm processor is deployed.
3. After verifying that an alarm for the situation has been raised, correct the fault as described in the 'Instructions for operator' field and check that the alarm is cleared.
fsTimeBasedAlarmHistorySize false
fsDeletedAlarmHistorySize 4000
fsStoredAlarmNotificationsPerSecond 0
fsZeroTTLforWarnings False

DN70397367 135
LTE iOMS Alarms 70244 CORRUPTED ALARM DATA
Id:0900d80580953993Confidential
70 70244 CORRUPTED ALARM DATAProbable cause: Corrupt data
Event type: Processing error
Default severity: Major
MeaningCorrupted data found in the alarm log file.
The corrupted record in the alarm log file is ignored, meaning that it is possible that an alarm notification was lost or a more serious system error has occurred.
Identifying additional information fields1. Invalid record (please note that the field can hold no more than ~390 symbols, so the original invalid record can be cut).
Additional information fields2. Error code, possible values:
1. missing mandatory field2. duplicated field 3. empty record4. non-alarm data record.
3. Field name (for missing or duplicated field).
Instructions
1. Fill in a problem report with the alarm data and send it to your local Nokia Siemens Networks representative.
ClearingClear the alarm with alarm management application after correcting the fault as pre-sented in Instructions.
Testing instructions
1. Create a text file containing an empty row or a row with some dummy information.2. Use the parameter management application to store the value of the
fsParameterId=fsLogFileName, fsAlarmProcessorConfigurationId=Default, fsAlarmProcessorId=AlarmProcessor1, fsFragmentId=AlarmProcessors, fsFragmentId=AlarmMgmt, fsClusterId=ClusterRoot attribute in the alarm processor LDAP configuration and replace it with the name of the created file.
3. Restart alarm processor with the following command:fshascli -r /<node>/FSAlarmSystemServer/AlarmProcessor
where <node> is the name of the node where alarm processor is deployed.4. After verifying that an alarm for the situation has been raised, clear it with alarm man-
agement application.5. Use the parameter management application to restore the original name of the
alarm log file.6. Restart alarm processor.
136 DN70397367
LTE iOMS Alarms
Id:0900d805809539f9Confidential
70245 ILLEGAL INTERNAL USAGE OF EXTERNAL ALARM NOTIFICATION FORMAT
71 70245 ILLEGAL INTERNAL USAGE OF EXTERNAL ALARM NOTIFICATION FORMATProbable cause: Software Program Error
Event type: x2
Default severity: Major
MeaningThe application raised or cleared an alarm containing an internal MOID (Managed Object ID) and provided its own alarm time. The application is allowed to provide an alarm time only for external alarms (alarms with external MOIDs). This alarm is also raised if the application raised or cleared an alarm containing an external MOID but did not provide its own alarm time.
The original alarm is discarded.
Identifying additional information fieldsData from the original alarm:
1. Managed Object ID2. Specific problem 3. Identifying application additional information
(The application ID is present in the MOID field of the alarm)
Additional information fields-
InstructionsFill in a problem report with the alarm data and send it to your Nokia Siemens Networks representative.
ClearingClear the alarm with the alarm management application after correcting the fault as pre-sented in Instructions.
Testing instructions
1. Create a text file containing the following single row:2008 Oct 15 18:31:39 ALARM RAISE SP=70156 \MO=fshaProcessInstanceName= XWDforAlarmType,\fshaRecoveryUnitName=FSAlarmDBServer,fsipHostName=WAS,\fsFragmentId=Nodes,fsFragmentId=HA,fsClusterId=ClusterRoot \AP=fshaProcessInstanceName=XWDforAlarmType,\fshaRecoveryUnitName=FSAlarmDBServer,fsipHostName=WAS,\fsFragmentId=Nodes,fsFragmentId=HA, fsClusterId=ClusterRoot \ SE=5 NINFO="1" TIME=E1224084699996
2. Use the parameter management application to store the value of the fsParameterId=fsLogFileName, fsAlarmProcessorConfigurationId=Default, fsAlarmProcessorId=AlarmProcessor1, fsFragmentId= AlarmProcessors, fsFragmentId=AlarmMgmt,
DN70397367 137
LTE iOMS Alarms 70245 ILLEGAL INTERNAL USAGE OF EXTERNALALARM NOTIFICATION FORMAT
Id:0900d805809539f9Confidential
fsClusterId=ClusterRoot attribute in the alarm processor LDAP configuration and replace it with the name of the created file.
3. Restart alarm processor with the following command:fshascli -r /<Node>/FSAlarmSystemServer/AlarmProcessorwhere <Node> is the name of the node where alarm processor is deployed.
4. After verifying that an alarm for the situation has been raised (in the case of an internal MOID with provided time), clear it with the alarm management application.
5. Use the parameter management application to restore the original name of the alarm log file.
6. Restart the alarm processor.7. Create a text file containing the following single row:
2008 Oct 15 18:32:39 ALARM RAISE SP=70159 \MO=rncMOId=DN:NE-WBTS-34/WCEL-1,fsLogicalNetworkElemId=OMS,\fsFragmentId=external,fsClusterId=ClusterRoot AP=fshaProcessInstanceName=HASNodeAgent,\fshaRecoveryUnitName=FSNodeHAServer, \fsipHostName=CLA-0,fsFragmentId=Nodes,fsFragmentId=HA, \fsClusterId=ClusterRoot SE=3 NINFO="MO failed".
8. Repeat steps 2,3.9. After verifying that an alarm for the situation has been raised (in the case of an
external MOID without provided time), clear it with the alarm management applica-tion.
10. Repeat steps 5, 6.
138 DN70397367
LTE iOMS Alarms
Id:0900d805809539f6Confidential
70246 ALARM SYSTEM HEARTBEAT
72 70246 ALARM SYSTEM HEARTBEATProbable cause: Timeout expired
Event type: Processing error
Default severity: Warning
MeaningThis is an informative alarm, which indicates that the alarm system itself is in operational state. The alarm system is continuously (after each expiration of a heartbeat interval) raising or clearing this alarm, which means that the state of this alarm is constantly changing in a loop (new alarm > cleared alarm > new alarm > cleared alarm > new alarm > ...) and the alarm time is updated by the time of the last raise or clear operation. If the refreshing of the alarm does not occur, it signals that the alarm system is faulty.
Note that there is a delay before the raise/clear operation becomes visible in the alarm monitoring tool. If the system is under heavy load it might take even longer for the oper-ation to be visible in the alarm monitoring tool.
Identifying additional information fields-
Additional information fields
1. Heartbeat interval in seconds.
Instructions
1. If the used alarm monitor tool does not support an automatic alert in situations where the alarm system heartbeating is not functioning, check occasionally that the heart-beating functions properly. The time of the alarm and the value of the heartbeat interval (specified in the 'Application Additional Info' field) should be used in the analysis of the situation.
2. Perform such checking also when the system does not generate any alarm events for a long time.
3. If the checking shows that the alarm time is not continuously refreshed, restart the alarm processor with the following command:fshascli -r /<Node>/FSAlarmSystemServer/AlarmProcessor
where <Node> is the name of the node where the alarm processor is deployed.4. If restarting the alarm processor does not help, also restart the alarm system
database with the following command:fshascli -r /AlarmDB
ClearingThe alarm system clears the alarm when the heartbeat interval expires.
Testing instructions
1. Check with the parameter management application that the alarm system heartbeat-ing is switched on, for example, the fsParameterId= fsHeartbeatInterval, fsAlarmProcessorConfigurationId=Default, fsAlarmProcessorId=AlarmProcessor1, fsFragmentId= AlarmProcessors, fsFragmentId=AlarmMgmt,

DN70397367 139
LTE iOMS Alarms 70246 ALARM SYSTEM HEARTBEAT
Id:0900d805809539f6Confidential
fsClusterId=ClusterRoot attribute in the alarm system LDAP configuration has a positive value (set the positive value if it is needed).
2. Restart the alarm processor with the following command:fshascli -r /<Node>/FSAlarmSystemServer/AlarmProcessor
where <Node> is the name of the node where the alarm processor is deployed.3. With the alarm system heartbeating switched on, check that only one instance of this
alarm is raised or cleared within a period that is approximately equal to the heartbeat interval.

140 DN70397367
LTE iOMS Alarms
Id:0900d80580953906Confidential
70247 ALARM SYSTEM HEARTBEATING SWITCHED OFF
73 70247 ALARM SYSTEM HEARTBEATING SWITCHED OFFProbable cause: Configuration or Customising Error
Event type: Processing error
Default severity: Major
MeaningThe alarm system heartbeating is switched off, which means that the alarm system does not raise or clear its heartbeat alarms.
The alarm system heartbeating is the simplest and most efficient way for the operator to monitor that the alarm system itself is healthy. If the system is in a switched off state, the operator cannot detect if the alarm system becomes faulty. This is why it is strongly rec-ommended that you have the alarm system heartbeating always switched on. Neverthe-less the alarm system heartbeating can be switched off if an alternative heartbeating exists. In the alarm system configuration, by setting the value of the fsAlarm70247raise configuration parameter to false, raising the 70247 alarm will be disabled.
Identifying additional information fields-
Additional information fields
1. Heartbeat interval in seconds.
Instructions
1. Use the parameter management application to set a non-zero (0 means that heart-beating is switched off) heartbeat interval in seconds for the fsParameterId= fsHeartbeatInterval, fsAlarmProcessorConfigurationId=Default, fsAlarmProcessorId=AlarmProcessor1, fsFragmentId= AlarmProcessors, fsFragmentId=AlarmMgmt, fsClusterId=ClusterRoot attribute in the alarm system LDAP configuration.
2. Use the parameter management application to set the value of the fsParameterId=fsAlarm70247raise,fsAlarmProcessorConfigurationId=Default, fsAlarmProcessorId=AlarmProcessor1, fsFragmentId= AlarmProcessors, fsFragmentId=AlarmMgmt, fsClusterId=ClusterRoot attribute to false in the alarm system LDAP configu-ration for the case when the alarm system heartbeating is desired to be switched off.
3. Restart alarm processor with the following command:fshascli -r /<Node>/FSAlarmSystemServer/AlarmProcessor
where <Node> is the name of the node where alarm processor is deployed.
ClearingThe alarm system clears the alarm automatically after restart if the alarm system heart-beating is switched on in the configuration.
Testing instructions
1. Use the parameter management application to set the value of the fsParameterId= fsHeartbeatInterval,

DN70397367 141
LTE iOMS Alarms 70247 ALARM SYSTEM HEARTBEATINGSWITCHED OFF
Id:0900d80580953906Confidential
fsAlarmProcessorConfigurationId=Default, fsAlarmProcessorId=AlarmProcessor1, fsFragmentId= AlarmProcessors, fsFragmentId=AlarmMgmt, fsClusterId=ClusterRoot attribute to zero in the alarm system LDAP configu-ration. The value of the fsParameterId=fsAlarm70247raise, fsAlarmProcessorConfigurationId=Default, fsAlarmProcessorId=AlarmProcessor1, fsFragmentId= AlarmProcessors, fsFragmentId=AlarmMgmt, fsClusterId=ClusterRoot attribute should be true.
2. Restart alarm processor with the following command:fshascli -r /<Node>/FSAlarmSystemServer/AlarmProcessor
where <Node> is the name of the node where alarm processor is deployed.3. After verifying that an alarm for the situation has been raised, correct the fault as
described in the 'Instructions for operator' field and check that the alarm is cleared.

142 DN70397367
LTE iOMS Alarms
Id:0900d805809539e6Confidential
70249 CRITICAL CLUSTER SERVICES WITHOUT STANDBY
74 70249 CRITICAL CLUSTER SERVICES WITHOUT STANDBYProbable cause: Equipment Malfunction
Event type: Equipment
Default severity: Minor
MeaningServices that are critical for the operation of the system, are provided in the CLA-0 and CLA-1 -nodes using an active-standby redundancy model. The standby node is cur-rently not operational.
The situation has no immediate impact to system operation. The system provides services normally as long as the remaining CLA node is operational. If the remaining CLA node fails, the critical services (cluster management functionality and Directory service) become unavailable. Especially Directory service downtime has immediate impact on the services provided by the network element, because the shared system disk will be unavailable.
Identifying additional information fields-
Additional information fields
1. Name of the still operational CLA node. For example: "Operational: /CLA-0"2. Name of the unavailable CLA node. For example: "Unavailable: /CLA-1"
InstructionsTo find out why the other CLA node is unavailable, perform the following steps:
1. Log into the remaining CLA node as root user. 2. Use the fshascli command to verify that the node has not been manually
powered off. Note that the node name must be preceded by a slash as fshascli expects a managed object name instead of a plain host name. For example:
$ fshascli --state /CLA-1/CLA-1:administrative(LOCKED)operational(DISABLED)usage(IDLE)procedural(NOTINITIALIZED)availability(POWEROFF)unknown(TRUE)alarm()
3. If the node has been manually powered off by an operator, the availability status has the POWEROFF value (as in the previous example). In this case, find out why the node was powered off. The node can be restarted with fshascli. For example:
$ fshascli --power ON /CLA-1 /CLA-1 is powered ON successfully

DN70397367 143
LTE iOMS Alarms 70249 CRITICAL CLUSTER SERVICES WITHOUTSTANDBY
Id:0900d805809539e6Confidential
4. If the node has not been powered off, use the hwcli command to check the state of the unavailable node. Note that hwcli expects a host name instead of a managed object name. For example:
$ hwcli CLA-1CLA-1: available (FlexiSvr CPI1 000157:0109 01.02)
5. High availability services (HAS) of the system automatically attempts a power-off, power-on and reset sequence after about 30 minutes after the node failure. If you do not want to wait for this, you can execute the commands manually. For example:
$ hwcli --power off CLA-1ATTEMPTING TO POWER OFF NODECLA-1ARE YOU SURE YOU WANT TO PROCEED? yesPowering off CLA-1: OK$ hwcli --power on CLA-1Powering on CLA-1: OK$ hwcli --reset CLA-1ATTEMPTING TO RESET NODECLA-1ARE YOU SURE YOU WANT TO PROCEED? yesResetting CLA-1: OK
6. If these actions do not bring the node up, or hwcli shows that the node is not avail-able, you must manually verify the state of the node. If required, pull the node phys-ically out and re-insert it after some time.
7. Contact your Nokia Siemens Networks representative even if these operations bring the node up. It is possible that the computing node needs to be replaced or that it, for example, needs a BIOS upgrade.
ClearingThe system clears the alarm automatically when the fault has been corrected.
Testing instructions
1. Verify that both CLA nodes are unlocked. Unlock them, if required. For example,$ fshascli --state /CLA-0 /CLA-1/CLA-0administrative(UNLOCKED)operational(ENABLED)usage(IDLE)procedural()availability()unknown(FALSE)alarm()
/CLA-1administrative(LOCKED)operational(ENABLED)usage(IDLE)procedural()availability()

144 DN70397367
LTE iOMS Alarms
Id:0900d805809539e6Confidential
70249 CRITICAL CLUSTER SERVICES WITHOUT STANDBY
unknown(FALSE)alarm()$ fshascli --unlock /CLA-1
2. Power-off either the CLA-0 or the CLA-1 node using hwcli. For example,$ hwcli --power off CLA-1ATTEMPTING TO POWER OFF NODECLA-1ARE YOU SURE YOU WANT TO PROCEED? yesPowering off CLA-1: OK
3. Wait for the alarm to be raised. By default, it is raised after 10 minutes when the powered-off CLA node turns FAULTY. A faulty node has values FAILED and OFFLINE in the availability status attribute. When HAS raises the alarm, it also sets values MAJOR and OUTSTANDING for the node alarm status attribute. You can see this with fshascli. For example,
$ fshascli --state /CLA-1/CLA-1:administrative(UNLOCKED)operational(DISABLED)usage(IDLE)procedural(NOTINITIALIZED)availability(FAILED,OFFLINE)unknown(FALSE)alarm(MAJOR,OUTSTANDING)
The alarm raising is visible in the syslog as a message that begins as follows:ALARM RAISE SP=70249 MO=/Directory AP=. . .
4. The alarm is cancelled when the CLA node that was powered off has successfully restarted. Power-on the node using hwcli. For example,
$ hwcli --power on CLA-1Powering on CLA-1: OK
The alarm cancellation is visible in the syslog as a message that begins as follows:ALARM CANCEL SP=70249 MO=/Directory AP=. . .

DN70397367 145
LTE iOMS Alarms 70250 NO OPERATIONAL RECOVERY UNIT FORSERVICE INSTANCE
Id:0900d805809539d2Confidential
75 70250 NO OPERATIONAL RECOVERY UNIT FOR SERVICE INSTANCEProbable cause: 347
Event type: x2
Default severity: 4 Minor
MeaningAn N+M recovery group does not have an unlocked operational recovery unit for the service instance. An N+M recovery group has N active recovery units that provide service and M spare recovery units. All unlocked recovery units that have been assigned a service instance workload are active and providing service. The rest of the unlocked recovery units that have not been assigned a service instance workload are spare recovery units. At this moment, the system cannot assign the workload of the named service instance to any recovery unit, because there are no unlocked operational recovery units without service assignments. This can happen, for example, in the follow-ing situations:
• Multiple node reboots have been initiated. • Multiple node failures have happened. • One or more service instances have problems causing failures for the recovery units
where it has been assigned. • All spare recovery units are locked when a recovery unit failure happens.
The workload associated with the named service instance (part of the service provided by the recovery group) is currently down.
Additional information fields
1. The number of recovery units providing service: RUsInService=<n>2. The number of faulty and non operational nodes: NodesFaulty/Down=<n>Non-
operational nodes turn faulty if the system does not manage to bring them up within some minutes. For example string "NodesFaulty/Down=1/3" means that 3 nodes are currently non operational and one is currently declared faulty.
3. The number of failed recovery units: FailedRUs=<n>4. The number of locked RUs: LockedRUs=<n>
InstructionsThis problem can indicate one or both of the following:
• A hardware-related situation that is, for example, caused by node reboots or node failures. In these cases, the alarm severity is MINOR and the problem is likely to dis-appear quickly. The severity of this alarm will be raised to MAJOR if the node(s) do not restart within a few minutes.
• An application problem caused, for example, by a program error, a configuration error, or data corruption. In this case, the alarm severity is MAJOR and manual inter-vention may be needed. If the severity of this alarm is MINOR, you may choose to wait a few minutes to see if the alarm is cancelled. In node reboot and transient failure situations, the system will cancel the alarm as soon as the node reboots have completed and the service instance(s) has been successfully reassigned and the recovery unit restarted. If the severity of this alarm is MAJOR, perform the following steps:

146 DN70397367
LTE iOMS Alarms
Id:0900d805809539d2Confidential
70250 NO OPERATIONAL RECOVERY UNIT FOR SERVICE INSTANCE
1. Log into the active CLA as root user. 2. Check the system syslog (/var/log/master-syslog) for possible failure reasons and
contact your Nokia Siemens Networks representative if you need assistance.
ClearingThe system clears the alarm automatically when the fault has been corrected.
Testing instructions

DN70397367 147
LTE iOMS Alarms 70251 UNRECOMMENDED CONFIGURATIONFORCED BY OPERATOR
Id:0900d805809539bfConfidential
76 70251 UNRECOMMENDED CONFIGURATION FORCED BY OPERATORProbable cause: Equipment Malfunction
Event type: Equipment
Default severity: Minor
MeaningServices that are critical to the system operation are provided in the CLA-0 and CLA-1 nodes using an active-standby redundancy model. The most important service is called Directory.
One of the following has happened:
• An operator has, by issuing a switchover or lock command, forced the Directory service to run in the same node as the cluster management functionality (CMF).
• An operator has locked the current standby FSDirectoryServer recovery unit. The Directory and cluster management functionality services are, however, not running in the same node.
• An operator has, by issuing CFM yield or CMF disable command, forced the master CMF to run in the same node with Directory service.
• An operator has disabled both CMF services using CMF disable command and then started CMF in the same node with Directory service by issuing CMF enable command.
The system attempts to keep the services on separate nodes. If a failure or an operator action forces the services to the same node the system automatically tries to move CMF service to another node after some time. The automatic service separation however will not work if one of the CMF services is disabled or the CMF service was forced to run in the same node with Directory service by issuing a CMF yield command.
The situation has no immediate impact to system operation. The system provides services normally as long as the currently operational CLA node(s) and their services remain functional. An operator can choose to set this configuration if, for example, one CLA node needs maintenance.
If the critical system services are currently running in the same node, a node failure causes their services to be down for some time. Especially the Directory service swi-tchover can last considerably longer than usual. Directory service downtime has often immediate impact on the services provided by the network element, because the shared system disk is unavailable.
If the critical services of the system are running on separate CLA nodes, but the FSDi-rectoryServer recovery unit is locked in one CLA node, failure of the node that provides the Directory service causes the Directory service to be down for a few minutes (until the node has successfully rebooted) or permanently (if the node fails to start).
Identifying additional information fields-
Additional information fields
1. String explaining if the situation was caused by a switchover or a lock operation.
148 DN70397367
LTE iOMS Alarms
Id:0900d805809539bfConfidential
70251 UNRECOMMENDED CONFIGURATION FORCED BY OPERATOR
InstructionsFind out why the Directory service has been forced to run in the same node as the cluster management functionality or why an FSDirectoryServer recovery unit has been locked.
If the situation was not intentional, the system can be restored to a safer state by per-forming the following steps:
1. Log into the system as root user. 2. Check the status of the FSDirectoryServer recovery units using the fshascli
command:$ fshascli --state "/*/FSDirectoryServer"/CLA-0/FSDirectoryServer:administrative(UNLOCKED)operational(ENABLED)usage(ACTIVE)procedural()availability()unknown(FALSE)alarm()role(ACTIVE)
/CLA-1/FSDirectoryServer:administrative(LOCKED)operational(ENABLED)usage(IDLE)procedural(NOTINITIALIZED)availability(OFFDUTY)unknown(FALSE)alarm()role(COLDSTANDBY)
3. If one of the recovery units is LOCKED, unlock it using the fshascli command. For example:
$ fshascli --unlock /CLA-1/FSDirectoryServer/CLA-1/FSDirectoryServer is unlocked successfully.
4. Once both recovery units are unlocked, you need to check if the Directory service is running in the same CLA node as the cluster management functionality. Use the fshascli command to check which one of CLA node is providing the service.
$ fshascli --state "/*/FSDirectoryServer"/CLA-0/FSDirectoryServer:administrative(UNLOCKED)operational(ENABLED)usage(ACTIVE)procedural()availability()unknown(FALSE)alarm()role(ACTIVE)

DN70397367 149
LTE iOMS Alarms 70251 UNRECOMMENDED CONFIGURATIONFORCED BY OPERATOR
Id:0900d805809539bfConfidential
/CLA-1/FSDirectoryServer:administrative(UNLOCKED)operational(ENABLED)usage(IDLE)procedural(NOTINITIALIZED)availability()unknown(FALSE)alarm()role(COLDSTANDBY)
The recovery unit that has the ACTIVE role is providing the service. Note that the operational recovery unit must also have operational state ENABLED, usage state ACTIVE and the procedural status value must be empty.
5. Use the fscmfcli command to check which node is providing the cluster manage-ment functionality. Note that with the --status option, the fscmfcli expects the node managed object name of an operational CLA node. If both CLA nodes are operational, it does not matter which one is specified. For example,
$ fscmfcli --status /CLA-0CLA-0: CMF-SERVING priority: 5CLA-1: CMF-DISABLED priority: 6
6. If the services are provided by different nodes, no further actions are required. In the example situation the services are both provided by the CLA-0 node. The sit-uation can be solved by forcing either Directory or CMF service to another node. Usually a CMF switchover is recommended as the Directory service switchover takes more time and applications using the services provided by the Directory will be un-operational during the switchover.In this case the backup CMF is disabled which will prevent the CMF switchover. The backup CMF needs to be enabled first;$ fscmfcli --enable /CLA-1Cluster management functionality enabled on host CLA-1$ fscmfcli -s /CLA-0CLA-0: CMF-SERVING priority: 5CLA-1: CMF-BACKUP priority: 6
7. After both of the CMF services are enabled the CMF service can be switched over to backup node:
$ fscmfcli --yield /CLA-0Host CLA-0 is giving up active role.$ fscmfcli -s /CLA-0CLA-0: CMF-BACKUP priority: 5CLA-1: CMF-SERVING priority: 6
8. If you choose to execute a Directory service switchover, enter the following fshascli switchover command:
$ fshascli --switchover --nowarning --force /Directory \/Directory switchover done successfully

150 DN70397367
LTE iOMS Alarms
Id:0900d805809539bfConfidential
70251 UNRECOMMENDED CONFIGURATION FORCED BY OPERATOR
Note that if your terminal connection to the cluster was established to the Directory service IP address, your terminal connection is closed and you must log in again.
ClearingThe system clears the alarm automatically when the fault has been corrected.
Testing instructionsScenario 1
1. Check which Directory recovery unit (/CLA-0/FSDirectoryServer or /CLA-1/FSDirec-toryServer) is acting as a STANDBY and lock it. The standby recovery unit has value COLDSTANDBY in the role attribute. For example,
$ fshascli --state "/CLA-*/FSDirectoryServer"/CLA-0/FSDirectoryServeradministrative(UNLOCKED)operational(ENABLED)usage(IDLE)procedural(NOTINITIALIZED)availability()unknown(FALSE)alarm()role(COLDSTANDBY)
/CLA-1/FSDirectoryServeradministrative(UNLOCKED)operational(ENABLED)usage(ACTIVE)procedural()availability()unknown(FALSE)alarm()role(ACTIVE)$ fshascli --lock --force --nowarning /CLA-0/FSDirectoryServer/CLA-0/FSDirectoryServer is locked successfully
2. Verify that the alarm was raised. The alarm raising is visible in the syslog as a message that begins as follows:
ALARM RAISE SP=70251 MO=/Directory AP=. . .
3. Unlock the previously locked FSDirectoryServer recovery unit. For example,$ fshascli --unlock /CLA-0/FSDirectoryServer/CLA-0/FSDirectoryServer is unlocked successfully
4. Check that the alarm was cancelled. The alarm cancellation is visible in the syslog as a message that begins as follows:
ALARM CANCEL SP=70251 MO=/Directory AP=. . .
Scenario 2
1. Execute a Directory switchover that forces the active FSDirectoryServer recovery unit to the same node that runs the cluster management functionality. Note that this

DN70397367 151
LTE iOMS Alarms 70251 UNRECOMMENDED CONFIGURATIONFORCED BY OPERATOR
Id:0900d805809539bfConfidential
breaks your terminal connection if you have logged into the cluster using the Direc-tory IP address. In this case, you need to log in again. For example,$ fshascli --state "/CLA-*/FSDirectoryServer"/CLA-0/FSDirectoryServeradministrative(UNLOCKED)operational(ENABLED)usage(IDLE)procedural(NOTINITIALIZED)availability()unknown(FALSE)alarm()role(COLDSTANDBY)
/CLA-1/FSDirectoryServeradministrative(UNLOCKED)operational(ENABLED)usage(ACTIVE)procedural()availability()unknown(FALSE)alarm()role(ACTIVE)$ fscmfcli --status /CLA-0CLA-0: CMF-SERVING priority: 5CLA-1: CMF-BACKUP priority: 6$ fshascli --switchover --force --nowarning /Directory/Directory switchover done successfully
2. Verify that the alarm was raised. The alarm raising is visible in the syslog as a message that begins as follows:
ALARM RAISE SP=70251 MO=/Directory AP=. . .
3. Yield the cluster management functionality from the node so that it restarts in the other CLA node. For example,
$ fscmfcli --yield --force /CLA-0Host /CLA-0 is giving up active role.$ fscmfcli --status /CLA-0CLA-0: CMF-BACKUP priority: 5CLA-1: CMF-SERVING priority: 6
4. Check that the alarm was cancelled. The alarm cancellation is visible in the syslog as a message that begins as follows:
ALARM CANCEL SP=70251 MO=/Directory AP=. . .
Scenario 3
1. Check which CLA node is providing the CMF service:$ fscmfcli --status /CLA-0CLA-0: CMF-BACKUP priority: 5CLA-1: CMF-SERVING priority: 6

152 DN70397367
LTE iOMS Alarms
Id:0900d805809539bfConfidential
70251 UNRECOMMENDED CONFIGURATION FORCED BY OPERATOR
2. Execute a CMF switchover to that forces the CMF service into the same node that runs the Directory service:
$ fscmfcli --yield /CLA-1Host CLA-1 is giving up active role.$ fscmfcli --status /CLA-0CLA-0: CMF-SERVING priority: 5CLA-1: CMF-BACKUP priority: 6
3. Verify that the alarm was raised. The alarm raising is visible in the syslog as a message that begins as follows:
ALARM RAISE SP=70251 MO=/Directory AP=. . .
4. Yield the Cluster Management Functionality from the node so that it re-starts in the other CLA node. For example,
$ fscmfcli --yield --force /CLA-0Host /CLA-0 is giving up active role.$ fscmfcli --status /CLA-0CLA-0: CMF-BACKUP priority: 5CLA-1: CMF-SERVING priority: 6
Verify that the alarm was cancelled. The alarm cancellation is visible in the syslog as a message that begins as follows:
ALARM CANCEL SP=70251 MO=/Directory AP=. . .
Scenario 4
1. Check which CLA node is providing the CMF service:$ fscmfcli --status /CLA-0CLA-0: CMF-BACKUP priority: 5CLA-1: CMF-SERVING priority: 6
2. Disable the CMF currently providing the service forcing the service into the same node that runs the Directory service:$ fscmfcli --disable --force /CLA-1Cluster management functionality disabled on host CLA-1Host CLA-1 is giving up active role.$ fscmfcli --status /CLA-0CLA-0: CMF-SERVING priority: 5CLA-1: CMF-DISABLED priority: 6
3. Verify that the alarm was raised. The alarm raising is visible in the syslog as a message that begins as follows:
ALARM RAISE SP=70251 MO=/Directory AP=. . .
DN70397367 153
LTE iOMS Alarms 70251 UNRECOMMENDED CONFIGURATIONFORCED BY OPERATOR
Id:0900d805809539bfConfidential
4. Enable the Cluster Management Functionality from the disables node and wait for the automatic separation to force the CMF service to another node. The switchover should occur after 10 minutes (default value, can be modified in LDAP): $ fscmfcli --enable /CLA-1Cluster management functionality enabled on host CLA-1$ fscmfcli --status /CLA-0CLA-0: CMF-SERVING priority: 5CLA-1: CMF-BACKUP priority: 6
5. After the defined timeout the CMF service has been switched over to backup CLA node:
$ fscmfcli --status /CLA-0CLA-0: CMF-BACKUP priority: 5CLA-1: CMF-SERVING priority: 6
6. Verify that the alarm was cancelled. The alarm cancellation is visible in the syslog as a message that begins as follows:
ALARM CANCEL SP=70251 MO=/Directory AP=. . .
154 DN70397367
LTE iOMS Alarms
Id:0900d80580953a6cConfidential
70254 DRBD HARDWARE FAILURE
77 70254 DRBD HARDWARE FAILURE Probable cause: Equipment Malfunction
Event type: Equipment
Default severity: Major
MeaningA physical disk partition of a Distributed Replicated Block Device (DRBD) is broken or is reporting errors. DRBD is used to replicate data of an application partition between two nodes. The nodes form an active/standby redundancy pair where a standby node can take over in case the active node or application fails. The identified DRBD partition or logical volume is currently unavailable or functioning poorly.
The service that the application provides is not impacted if the other node and the DRBD device are still functioning. In this case, the application is, however, no longer redundant, and recovery from possible forthcoming failures may take longer or may not be possible at all. The service provided by the application is down if also the other node or partition is not functioning.
Identifying additional information fields-
Additional information fields
1. Name of the application mount point. 2. Name of the broken partition or logical volume
InstructionsThis situation is most likely caused by a hardware fault. Contact your Nokia Siemens Networks representative to have the disk replaced.
ClearingClear the alarm manually after the disk has been replaced.
Testing instructionsSimulate a disk failure
1. It is difficult to break a DRBD device without actually damaging the hardware. A hardware failure can, however, be simulated by issuing DRBD state changes man-ually. Use fscmfcli to find out the secondary and primary DRBD nodes. Enter the following command:
$ fscmfcli --status --verbose /CLA-0CLA-0: CMF-SERVING priority: 5 disk: DRBD_PRIMARY peer: 1CLA-1: CMF-BACKUP priority: 6 disk: DRBD_SECONDARY peer: 1
2. You can find out the name of the DRBD device by using the mount command in the serving cmf node. Enter the following command:
$ mount | grep cmf/dev/drbd2 on /var/mnt/local/cmf type ext3 (ro)
3. Tell high availability services (HAS) with the fsdrbdcli command that a DRBD device is broken. Enter the following command:

DN70397367 155
LTE iOMS Alarms 70254 DRBD HARDWARE FAILURE
Id:0900d80580953a6cConfidential
$ fsdrbdcli -drbd-status broken -partition /dev/drbd2 -drbd-node /CLA-0CLA-1:DRBD notification succeeded
An alarm should be raised immediately, and it is visible, for example, in the alarm log as a message such as the following:
ALARM RAISE SP=XXXXX . . . Note that the fsdrbdcli commands can only be given inside the node you are logged in.Note that if the broken command was given to a primary partition, HAS recovery actions follow immediately and partition gets a secondary status.
4. Cancel the alarm manually. Note that high availability services does not raise the alarm again, unless the node is rebooted.
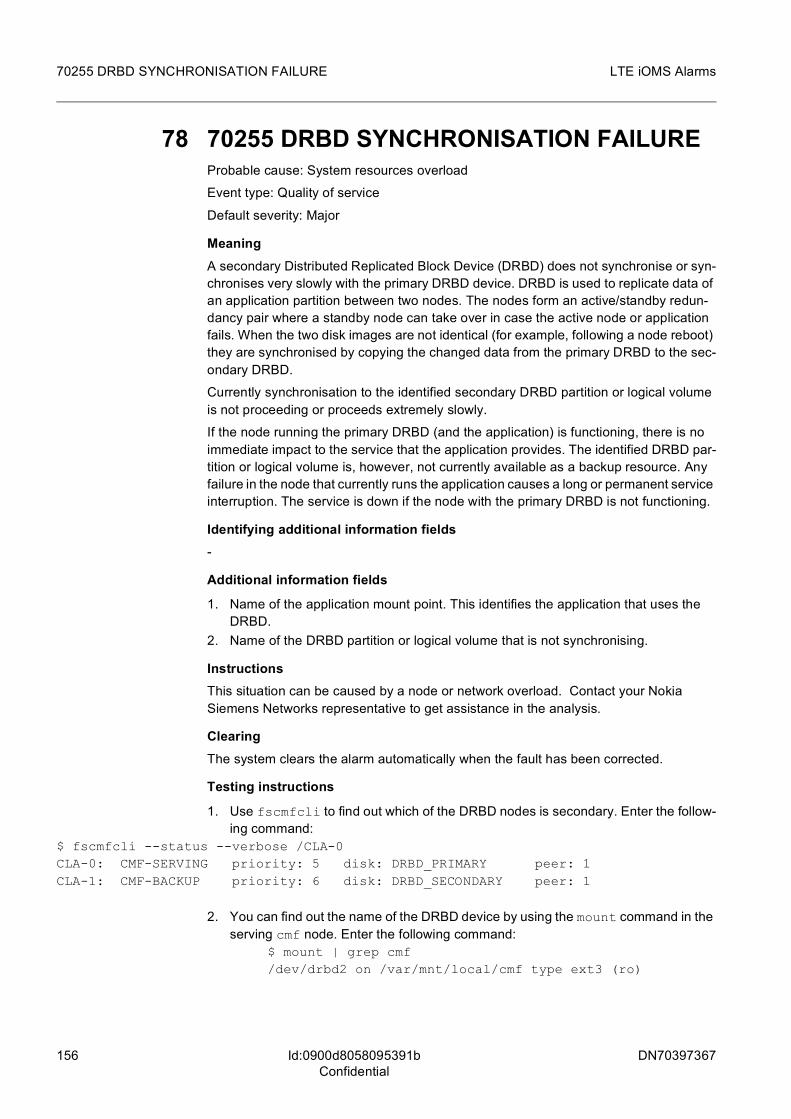
156 DN70397367
LTE iOMS Alarms
Id:0900d8058095391bConfidential
70255 DRBD SYNCHRONISATION FAILURE
78 70255 DRBD SYNCHRONISATION FAILUREProbable cause: System resources overload
Event type: Quality of service
Default severity: Major
MeaningA secondary Distributed Replicated Block Device (DRBD) does not synchronise or syn-chronises very slowly with the primary DRBD device. DRBD is used to replicate data of an application partition between two nodes. The nodes form an active/standby redun-dancy pair where a standby node can take over in case the active node or application fails. When the two disk images are not identical (for example, following a node reboot) they are synchronised by copying the changed data from the primary DRBD to the sec-ondary DRBD.
Currently synchronisation to the identified secondary DRBD partition or logical volume is not proceeding or proceeds extremely slowly.
If the node running the primary DRBD (and the application) is functioning, there is no immediate impact to the service that the application provides. The identified DRBD par-tition or logical volume is, however, not currently available as a backup resource. Any failure in the node that currently runs the application causes a long or permanent service interruption. The service is down if the node with the primary DRBD is not functioning.
Identifying additional information fields-
Additional information fields
1. Name of the application mount point. This identifies the application that uses the DRBD.
2. Name of the DRBD partition or logical volume that is not synchronising.
InstructionsThis situation can be caused by a node or network overload. Contact your Nokia Siemens Networks representative to get assistance in the analysis.
ClearingThe system clears the alarm automatically when the fault has been corrected.
Testing instructions
1. Use fscmfcli to find out which of the DRBD nodes is secondary. Enter the follow-ing command:
$ fscmfcli --status --verbose /CLA-0CLA-0: CMF-SERVING priority: 5 disk: DRBD_PRIMARY peer: 1CLA-1: CMF-BACKUP priority: 6 disk: DRBD_SECONDARY peer: 1
2. You can find out the name of the DRBD device by using the mount command in the serving cmf node. Enter the following command:
$ mount | grep cmf/dev/drbd2 on /var/mnt/local/cmf type ext3 (ro)
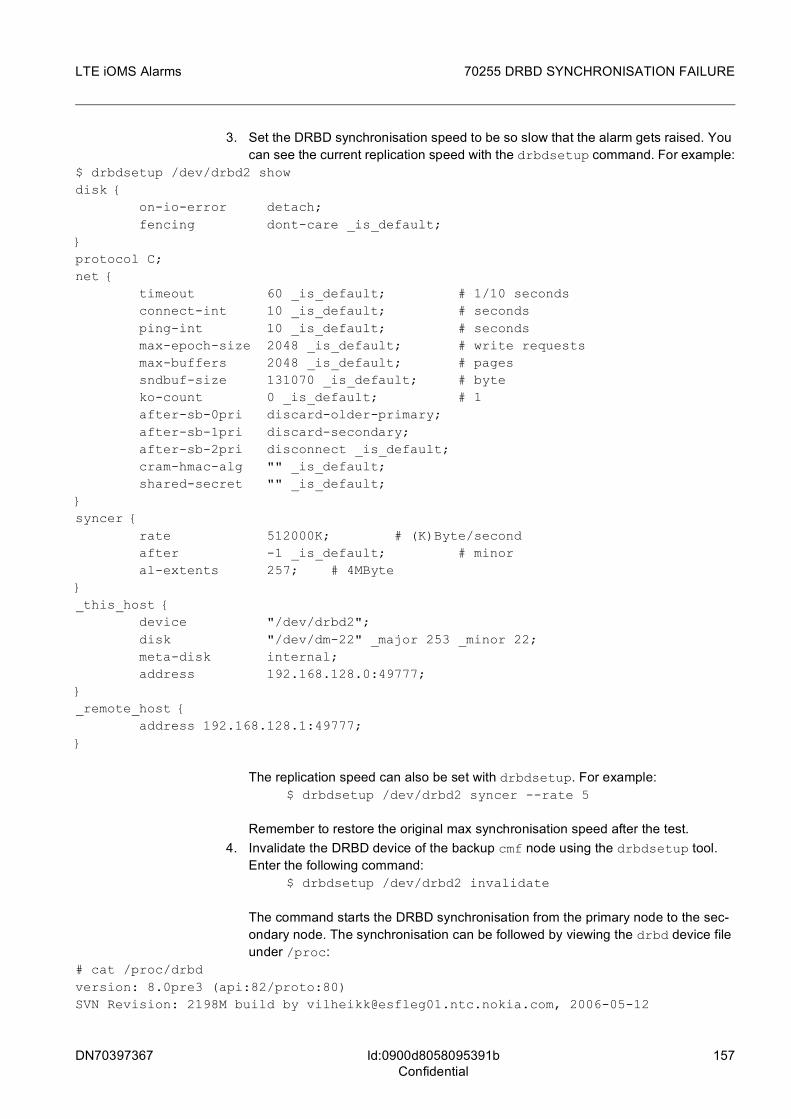
DN70397367 157
LTE iOMS Alarms 70255 DRBD SYNCHRONISATION FAILURE
Id:0900d8058095391bConfidential
3. Set the DRBD synchronisation speed to be so slow that the alarm gets raised. You can see the current replication speed with the drbdsetup command. For example:
$ drbdsetup /dev/drbd2 showdisk { on-io-error detach; fencing dont-care _is_default;}protocol C;net { timeout 60 _is_default; # 1/10 seconds connect-int 10 _is_default; # seconds ping-int 10 _is_default; # seconds max-epoch-size 2048 _is_default; # write requests max-buffers 2048 _is_default; # pages sndbuf-size 131070 _is_default; # byte ko-count 0 _is_default; # 1 after-sb-0pri discard-older-primary; after-sb-1pri discard-secondary; after-sb-2pri disconnect _is_default; cram-hmac-alg "" _is_default; shared-secret "" _is_default;}syncer { rate 512000K; # (K)Byte/second after -1 _is_default; # minor al-extents 257; # 4MByte}_this_host { device "/dev/drbd2"; disk "/dev/dm-22" _major 253 _minor 22; meta-disk internal; address 192.168.128.0:49777;}_remote_host { address 192.168.128.1:49777;}
The replication speed can also be set with drbdsetup. For example:$ drbdsetup /dev/drbd2 syncer --rate 5
Remember to restore the original max synchronisation speed after the test.4. Invalidate the DRBD device of the backup cmf node using the drbdsetup tool.
Enter the following command:$ drbdsetup /dev/drbd2 invalidate
The command starts the DRBD synchronisation from the primary node to the sec-ondary node. The synchronisation can be followed by viewing the drbd device file under /proc:
# cat /proc/drbdversion: 8.0pre3 (api:82/proto:80)SVN Revision: 2198M build by [email protected], 2006-05-12

158 DN70397367
LTE iOMS Alarms
Id:0900d8058095391bConfidential
70255 DRBD SYNCHRONISATION FAILURE
14:08:54 0: cs:Connected st:Primary/Secondary ds:UpToDate/UpToDate r--- ns:1041560 nr:0 dw:1500736 dr:1082117 al:2 bm:482 lo:0 pe:0 ua:0 ap:0
resync: used:6/7 hits:128776 misses:235 starving:0 dirty:0 changed:235
act_log: used:0/257 hits:60758 misses:2 starving:0 dirty:0 changed:2
1: cs:Unconfigured 2: cs:SyncTarget st:Secondary/Primary ds:Inconsistent/UpToDate r--- ns:8 nr:4308128 dw:9701076 dr:178 al:0 bm:644 lo:0 pe:2006 ua:0 ap:0
[=>..................] sync'ed: 8.0% (2898460/3145596)K finish: 0:03:39 speed: 12,864 (24,712) K/sec resync: used:14/7 hits:610714 misses:606 starving:0 dirty:0 changed:606
act_log: used:0/257 hits:4 misses:0 starving:0 dirty:0 changed:0
3: cs:Unconfigured 4: cs:Unconfigured 5: cs:Unconfigured 6: cs:Unconfigured 7: cs:Unconfigured
If the synchronisation lasts longer than one minute, a minor alarm is raised. This is visible, for example, in the alarm log as a message such as the following:
ALARM RAISE SP=XXXXX SE=4 . . .
5. Synchronisation does not normally last for one hour. After an hour, a major alarm must be raised. To test the raising of a major alarm, drbdmonitor script must be stopped before the synchronisation is ready. Enter the following command:
killall -STOP drbdmonitor
After drbdmonitor has been stopped, it does not notify the DRBD state changes to HAS anymore. An hour after DRBD invalidation (step 3), a major alarm is raised. This is, for example, visible in the alarm log as a message such as the following:
ALARM RAISE SP=XXXXX SE=3 . . .
6. The alarm clearing can be tested by enabling drbdmonitor and repeating test steps 1-3. Enter the following command:
killall -CONT drbdmonitor
After the synchronisation is ready, the alarm is cancelled and a message, such as the following, is written to the alarm log:
ALARM CANCEL SP=XXXXX . . .

DN70397367 159
LTE iOMS Alarms 70256 RESOURCE ALLOCATION OR DE-ALLOCA-TION FAILURE
Id:0900d805809539ccConfidential
79 70256 RESOURCE ALLOCATION OR DE-ALLOCATION FAILUREProbable cause: Software Program Abnormally Terminated
Event type: Processing error
Default severity: Major
MeaningAllocation or deallocation of resources to or from a computer node in the cluster has failed.
Applications running in the cluster are often identified with resources that are allocated to the node before the application is started and released from the node after the appli-cation has terminated. Such resources can, for example, be TCP/IP addresses that are associated with the service provided by the software or a disk partition that contains the application database. In addition, the application can allocate and deallocate other resources (for example, start and stop 3rd party applications) in its control scripts.
An operation failure has been reported for the defined recovery unit while it was starting or stopping.
The application start-up is aborted, when an error occurs at the start of the application. In case of a permanent fault, the service provided by the application is down. With a tran-sient or node-specific fault, and providing that the application has a standby, the appli-cation may have been restarted successfully on another node.
If a fault occurs when the application is terminating, the node on which the error occurred is restarted to restore it to a known state. If the node has restarted successfully or has a standby resource, the application is restarted and service is again available.
Identifying additional information fields-
Additional information fields
1. Name of the recovery group to which the recovery unit belongs. For example, "/Directory".
2. Situation when the failure happened: string "allocating" or "de-allocating"3. Type of the resource allocation: "IP(address)", "disk(mount point)" or "ctrlscript". For
example, "IP(192.1.1.78)" or "disk(sysimg)". 4. Only present if argument 3 is "ctrlscript". Contains the name of the control script that
reported the failure. For example, "RUControlDirectoryServer.sh"
Instructions
1. Log into the network element as root user to check the situation. 2. Use the fshascli command to check the state of all recovery units within the
recovery group (name of the recovery group is in the Application Additional Informa-tion field). If the recovery group is providing service, its every UNLOCKED recovery unit that has the ACTIVE role, has the ENABLED operational state and an empty procedural status. For example, the state of recovery units of the /Directory recovery groups can be checked as follows:
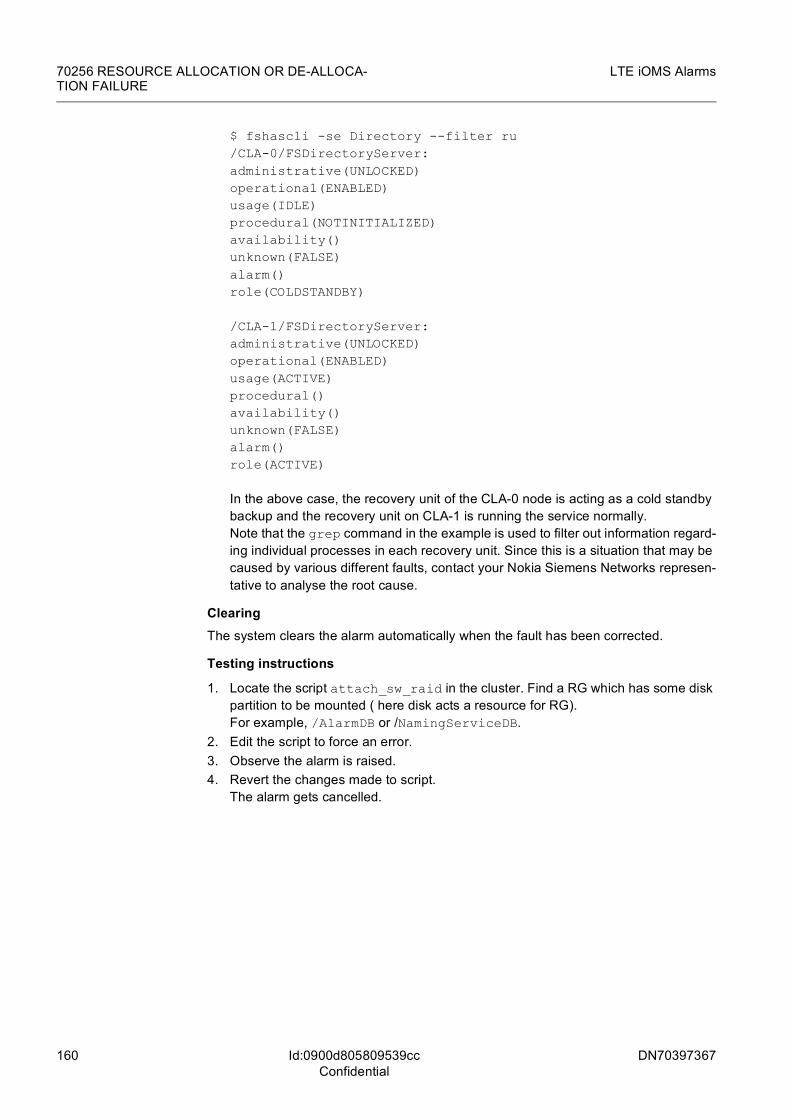
160 DN70397367
LTE iOMS Alarms
Id:0900d805809539ccConfidential
70256 RESOURCE ALLOCATION OR DE-ALLOCA-TION FAILURE
$ fshascli -se Directory --filter ru /CLA-0/FSDirectoryServer:administrative(UNLOCKED)operational(ENABLED)usage(IDLE)procedural(NOTINITIALIZED)availability()unknown(FALSE)alarm()role(COLDSTANDBY)
/CLA-1/FSDirectoryServer:administrative(UNLOCKED)operational(ENABLED)usage(ACTIVE)procedural()availability()unknown(FALSE)alarm()role(ACTIVE)
In the above case, the recovery unit of the CLA-0 node is acting as a cold standby backup and the recovery unit on CLA-1 is running the service normally. Note that the grep command in the example is used to filter out information regard-ing individual processes in each recovery unit. Since this is a situation that may be caused by various different faults, contact your Nokia Siemens Networks represen-tative to analyse the root cause.
ClearingThe system clears the alarm automatically when the fault has been corrected.
Testing instructions
1. Locate the script attach_sw_raid in the cluster. Find a RG which has some disk partition to be mounted ( here disk acts a resource for RG). For example, /AlarmDB or /NamingServiceDB.
2. Edit the script to force an error.3. Observe the alarm is raised. 4. Revert the changes made to script.
The alarm gets cancelled.

DN70397367 161
LTE iOMS Alarms 70257 TAKING SCHEDULED CHECKPOINT OF IN-MEMORY DATABASE FAILED
Id:0900d805809539f7Confidential
80 70257 TAKING SCHEDULED CHECKPOINT OF IN-MEMORY DATABASE FAILEDProbable cause: Application subsystem failure
Event type: Processing error
Default severity: Warning
MeaningTaking scheduled checkpoint of in-memory database failed.
The new checkpoint file is not written to the disc. The transaction log files are not purged. The accumulation of log files may cause the disk to run out of space. Moreover, the accumulation may result in a lengthy recovery operation in the case of a data store crash.
Identifying additional information fields-
Additional information fields
1. Database name2. IP address of the sender3. Error code
InstructionsNote: In these instructions, TimesTen is referring to the concept in-memory database.
1. Determine the node from the Application Additional Information field of the alarm, in other words, the node where the database in question resides.
2. Log into the database node.3. In the node where the alarm was raised, determine the directory of the checkpoint
files (.ds0 and .ds1) for the database in question with the following command:ttStatus
See data management documentation for more instructions about the ttStatus command.
4. Check the timestamps of the checkpoint files of the database.If the timestamp of one of the checkpoints is later than the time of the alarm, the next checkpoint has been successful and the alarm can be cleared.
5. If the alarm still has the latest timestamp compared to the checkpoint files of the database, gather the following information:a) Copy the original master-syslog to the temporary directory.
cp /var/log/master-syslog /tmp/<filenameA>.<extension>Select filenameA and extension, for example, <alarm_number>_syslog.log.
b) Move to the tmp directory.cd /tmp
c) In the node where the alarm was raised, determine the TimesTen status.ttStatus -v > /tmp/<filenameB>.txt
Select filenameB, for example, <alarm number>_ttstatus.log. The requirement is that filenameB differs from filenameA.
d) Compress the files with the tar command.
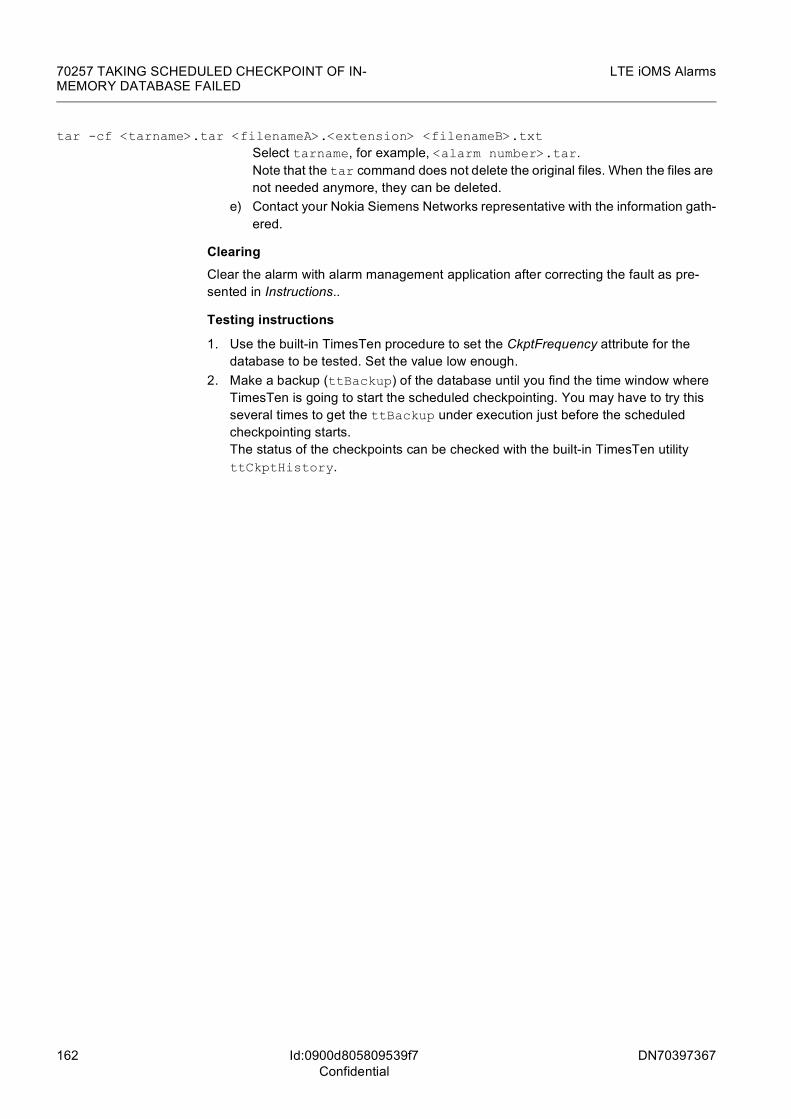
162 DN70397367
LTE iOMS Alarms
Id:0900d805809539f7Confidential
70257 TAKING SCHEDULED CHECKPOINT OF IN-MEMORY DATABASE FAILED
tar -cf <tarname>.tar <filenameA>.<extension> <filenameB>.txtSelect tarname, for example, <alarm number>.tar.Note that the tar command does not delete the original files. When the files are not needed anymore, they can be deleted.
e) Contact your Nokia Siemens Networks representative with the information gath-ered.
ClearingClear the alarm with alarm management application after correcting the fault as pre-sented in Instructions..
Testing instructions
1. Use the built-in TimesTen procedure to set the CkptFrequency attribute for the database to be tested. Set the value low enough.
2. Make a backup (ttBackup) of the database until you find the time window where TimesTen is going to start the scheduled checkpointing. You may have to try this several times to get the ttBackup under execution just before the scheduled checkpointing starts.The status of the checkpoints can be checked with the built-in TimesTen utility ttCkptHistory.
DN70397367 163
LTE iOMS Alarms 70258 BLADECENTER BLOWER SPEED OUT OFLIMIT
Id:0900d80580953a46Confidential
81 70258 BLADECENTER BLOWER SPEED OUT OF LIMITProbable cause: Equipment malfunction
Event type: Equipment
Default severity: Critical
MeaningThe reading of a single Intelligent Platform Management Interface (IPMI) fan sensor is out of limit. The rotation speed of a fan group is either low or abnormally high.
High speed may indicate a temperature-related problem which might eventually cause hardware management to automatically shut down the plug-in units to prevent any physical damage to them.
Identifying additional information fields
1. spTrapMsgText - Alert Message Text2. spTrapSysUuid - Host System UUID (Cabinet & Chassis can be deducted)3. spTrapBladeUuid - Blade UUID (Slot can be deducted)
Additional information fields-
Instructions
1. Check the IBM BladeCenter Hardware Maintenance Manual and Troubleshooting Guide (ID MIGR-50053) for instructions at manufacturer's WWW pages http://www.ibm.com.
2. If the problem remains, contact your local Nokia Siemens Networks representative.
ClearingClear the alarm with an alarm management application after correcting the fault as pre-sented in Instructions.
Testing instructionsDo no test this alarm, because the hardware fault is not reproducible without a risk to cause a permanent damage to the system.

164 DN70397367
LTE iOMS Alarms
Id:0900d80580953981Confidential
70259 BLADECENTER INCOMPATIBLE HARDWARE CONFIGURATION
82 70259 BLADECENTER INCOMPATIBLE HARDWARE CONFIGURATION Probable cause: Equipment malfunction
Event type: Equipment
Default severity: Critical
MeaningIncompatible hardware configuration has been detected.
Configuration of a hardware contains a severe incompatibility problem. This may cause, for example, a blade to be inaccessible.
Identifying additional information fields
1. spTrapMsgText - Alert Message Text2. spTrapSysUuid - Host System UUID (Cabinet & Chassis can be deducted)3. spTrapBladeUuid - Blade UUID (Slot can be deducted)
Additional information fields-
Instructions
1. Check the IBM BladeCenter Hardware Maintenance Manual and Troubleshooting Guide (ID MIGR-50053) for instructions at manufacturer's WWW pages http://www.ibm.com.
2. If the problem remains, contact your local Nokia Siemens Networks representative.You can find the details of the faulty plug-in unit in the Identifying Application Addi-tional Info field of the alarm.
ClearingClear the alarm with an alarm management application after correcting the fault as pre-sented in Instructions.
Testing instructionsDo no test this alarm, because the hardware fault is not reproducible without a risk to cause a permanent damage to the system.

DN70397367 165
LTE iOMS Alarms 70260 BLADECENTER PLUG-IN UNIT FAILURE
Id:0900d80580953931Confidential
83 70260 BLADECENTER PLUG-IN UNIT FAILURE Probable cause: Equipment malfunction
Event type: Equipment
Default severity: Critical
MeaningA fatal failure in the plug-in unit hardware has been detected.
There is a severe fault in the plug-in unit hardware. This may cause, for example, hardware management to automatically shut down the plug-in unit to prevent any physical damage to it.
Identifying additional information fields
1. spTrapMsgText - Alert Message Text2. spTrapSysUuid - Host System UUID (Cabinet & Chassis can be deducted)3. spTrapBladeUuid - Blade UUID (Slot can be deducted)
Additional information fields-
Instructions
1. Check the IBM BladeCenter Hardware Maintenance Manual and Troubleshooting Guide (ID MIGR-50053) for instructions at manufacturer's WWW pages http://www.ibm.com.
2. If the problem remains, contact your local Nokia Siemens Networks representative to replace the plug-in unit.Note that replacing an operational disk drive may cause loss of data.You can find the details of the faulty plug-in unit in the Identifying Application Addi-tional Info field of the alarm.
ClearingClear the alarm with an alarm management application after correcting the fault as pre-sented in Instructions.
Testing instructionsDo no test this alarm, because the hardware fault is not reproducible without a risk to cause a permanent damage to the system.
166 DN70397367
LTE iOMS Alarms
Id:0900d80580953948Confidential
70261 BLADECENTER PLUG-IN UNIT TEMPERA-TURE OUT OF LIMIT
84 70261 BLADECENTER PLUG-IN UNIT TEM-PERATURE OUT OF LIMIT Probable cause: Equipment malfunction
Event type: Equipment
Default severity: Critical
MeaningThe reading of a single Intelligent Platform Management Interface (IPMI) temperature sensor is out of limit.
If the alarm is constantly raised, there is a severe temperature-related problem and the plug-in unit may behave unexpectedly.
Identifying additional information fields
1. spTrapMsgText - Alert Message Text2. spTrapSysUuid - Host System UUID (Cabinet & Chassis can be deducted)3. spTrapBladeUuid - Blade UUID (Slot can be deducted)
Additional information fields-
Instructions
1. Check the IBM BladeCenter Hardware Maintenance Manual and Troubleshooting Guide (ID MIGR-50053) for instructions at manufacturer's WWW pages http://www.ibm.com.
2. If the problem remains, contact your local Nokia Siemens Networks representative.You can find the details of the faulty plug-in unit in the Identifying Application Addi-tional Info field of the alarm.
ClearingClear the alarm with an alarm management application after correcting the fault as pre-sented in Instructions.
Testing instructionsDo no test this alarm, because the hardware fault is not reproducible without a risk to cause a permanent damage to the system.

DN70397367 167
LTE iOMS Alarms 70262 BLADECENTER PLUG-IN UNIT VOLTAGEOUT OF LIMIT
Id:0900d80580953970Confidential
85 70262 BLADECENTER PLUG-IN UNIT VOLTAGE OUT OF LIMIT Probable cause: Power supply failure
Event type: Equipment
Default severity: Critical
MeaningThe reading of a single Intelligent Platform Management Interface (IPMI) voltage sensor is out of limit.
If the alarm is constantly raised, there is a severe hardware problem and the plug-in unit may behave unexpectedly.
Identifying additional information fields
1. spTrapMsgText - Alert Message Text2. spTrapSysUuid - Host System UUID (Cabinet & Chassis can be deducted)3. spTrapBladeUuid - Blade UUID (Slot can be deducted)
Additional information fields-
Instructions
1. Check the IBM BladeCenter Hardware Maintenance Manual and Troubleshooting Guide (ID MIGR-50053) for instructions at manufacturer's WWW pages http://www.ibm.com.
2. If the problem remains, contact your local Nokia Siemens Networks representative.You can find the details of the faulty plug-in unit in the Identifying Application Addi-tional Info field of the alarm.
ClearingClear the alarm with an alarm management application after correcting the fault as pre-sented in Instructions.
Testing instructionsDo no test this alarm, because the hardware fault is not reproducible without a risk to cause a permanent damage to the system.

168 DN70397367
LTE iOMS Alarms
Id:0900d80580953a11Confidential
70263 BLADECENTER POWER SUPPLY FAILURE
86 70263 BLADECENTER POWER SUPPLY FAILURE Probable cause: Power supply failure
Event type: Equipment
Default severity: Major
MeaningThere is a failure in one of the power modules.
If all the power entry modules are down, it results in degraded chassispower supply redundancy, or total loss of power.
Identifying additional information fields
1. spTrapEvtName - Event code of the Trap . Using this trap, the exact cause of the alarm can be determined. It is a Hexadecimal value (for example: 0x0000006B)
2. spTrapSysUuid - Host System UUID - Using this trap, you can identify the Chassis where the problem occurred. (For example: UUID- 07A3284990D2893F40224195720A145)
3. spTrapSourceId - The exact source where the problem has occurred. It could have the following values depending on the context of the alarm:Audit - A user action log.SERVPROC - The service processor for the advanced management module.
Additional information fields-
Instructions
1. With the help of the Event code displayed in Identifying Application additional info (spTrapEvtName) of the alarm, find the exact cause from IBM reference documen-tation available at the following site: http://publib.boulder.ibm.com/infocenter/bladectr/documentation/topic/com.ibm.bladecenter.advmgtmod.doc/kp1avAMMMessagesGuide.pdf
2. Perform the actions mentioned in the User Response section of the IBM reference documents.
ClearingIn the IBM Reference documentation, Chapter 2 contains information on mapping of the event codes against the exact cause of the alarm.
For information on clearing the alarm, refer to the Recoverable section of the reference documents. If the Recoverable section says yes, it means that the alarm generated will be automatically cleared. If the Recoverable section says no, the alarm has to be manually cleared using the alarm management application.
Testing instructionsDo not test this alarm because the hardware fault is not reproducible without a risk of permanent damage to the system.

DN70397367 169
LTE iOMS Alarms 70264 EXTERNAL STORAGE SYSTEM FAILURE
Id:0900d805809538f9Confidential
87 70264 EXTERNAL STORAGE SYSTEM FAILUREProbable cause: Equipment malfunction
Event type: Equipment
Default severity: 2 Critical
MeaningFailure in the external storage system has been detected.
The external storage system is behaving erratically, is non-responsive, or becomes non-responsive if this error is not solved. More details can be found in the eventText description of the Application Additional Info field.
Indentifying additional information fields
1. hostName - Host Name. 2. deviceID - Device ID.3. eventID - Event ID.
Additional information fields4. eventText - Event description.
5. storageSystem - Storage System Name.
Instructions
1. For instructions, check the manufacturer's documentation for EMC CLARiiON storage system.
2. If the problem remains, contact your local Nokia Siemens Networks representative to replace the external storage unit. Caution: Risk of data loss. Before replacing an operational disk drive, take the necessary backups. You can find the details of the faulty storage unit in the Identifying Application Additional Info field and Application Additional Info field of the alarm
ClearingThe system clears the alarm automatically when the fault has been corrected.
Testing instructionsDo no test this alarm, because the hardware fault is not reproducible without a risk to cause a permanent damage to the system.

170 DN70397367
LTE iOMS Alarms
Id:0900d80580953a1cConfidential
70265 RECOVERY ACTIONS BANNED FOR MAN-AGED OBJECT
88 70265 RECOVERY ACTIONS BANNED FOR MANAGED OBJECTProbable cause: Software Error
Event type: Processing error
Default severity: Major
MeaningAn operator has set the specified managed object to an inert mode. The managed object identifies a node. If the inert mode is set for the whole cluster, this alarm is raised sep-arately for each node. While the inert mode is on, high availability services (HAS) does not attempt to recover services from failures, for example, by restarting nodes or appli-cations, or by performing switchovers within the specified managed objects. Note that the inert mode should be used only by qualified supplier's representatives when analysing problems in the system.
The inert mode is switched on by issuing an fshascli command, for example:
$ fshascli --inert-mode on /CLA-0
The command above switches the inert mode on for the /CLA-0 node. Accordingly, the inert mode can be switched off by using the fshascli command:
$ fshascli --inert-mode off /CLA-0
This alarm is raised when an operator switches the inert mode on for either a set of nodes or the cluster. The inert mode has the following effects on the behaviour of the system in nodes for which the inert mode has been switched on:
• If there are no failures, the service provided by the network element is not affected. • If failures occur, no recovery actions are performed and the service may be affected.
For example, if a process fails, it is not restarted by HAS. • Process failures are still propagated to the recovery unit level, but the recovery unit
level fault recovery does not take place. In practice, this means that the propagated process failure does not cause restarts of other recovery unit processes, and swi-tchovers do not take place with active/standby recovery groups.
• HAS logs pending recovery actions to master syslog (/var/log/master-syslog on the active CLA node) in the form "INFO Inert mode set for <managed object name>. Recovery action \"restart\" pending.".
• HAS does not raise any alarms for managed objects in the inert mode. The inert mode for a node sets all managed objects within the node to the inert mode.
• The inert mode sustains in the nodes over node or cluster restarts. • Only the node and cluster restart, power on and power off fshascli commands
work while the inert mode is set for the nodes or the cluster.
Note that fault recovery works in a normal way in the nodes that are not in the inert mode .
Identifying additional information fields-
Additional information fields-

DN70397367 171
LTE iOMS Alarms 70265 RECOVERY ACTIONS BANNED FOR MAN-AGED OBJECT
Id:0900d80580953a1cConfidential
Instructions
1. To ensure proper functionality of the system, switch off the inert mode after the problem analysis is done.
2. You can switch off the inert mode from all nodes of the cluster by issuing the fshascli command: $ fshascli --inert-mode off /
Note that this should be done by the supplier's field engineer that is currently analysing the system.
When the inert mode is switched off, pending recovery actions take place. For example, if an important severity process in a cold active/standby recovery group has failed in a node that was in the inert mode, switching the inert mode off for the node causes a swi-tchover of the recovery group.
ClearingThe system clears the alarm when the inert mode is switched off from the managed object.
Testing instructions
1. Switch the inert mode on for the cluster:$ fshascli --inert-mode on / An alarm should be raised for all present nodes of the cluster.
2. Switch the inert mode off for the cluster: $ fshascli --inert-mode off / The alarm should be cancelled for all present nodes of the cluster.

172 DN70397367
LTE iOMS Alarms
Id:0900d80580953957Confidential
70267 EXTERNAL USER ACCOUNT VALIDATION FAILED
89 70267 EXTERNAL USER ACCOUNT VALIDA-TION FAILEDProbable cause: Configuration or Customizing Error
Event type: Processing error
Default severity: Warning
MeaningNetwork Element (NE) has detected that according to the NetAct Remote User Informa-tion Management (RUIM) LDAP (Lightweight Directory Access Protocol) access control lists, an external user account defined in NetAct LDAP user database has permissions for this NE. According to the NE security architecture, remote user accounts are repli-cated locally. The validation check performed before the replication for the user account did not pass and therefore the user account was not replicated.
Possible reasons for a failing validation check are:
1. External username is the same as one of the NE internal usernames. This should not happen if NetAct is following the agreed way of naming users.
2. External username is a reserved username. 3. External username is invalid, for example, too long (supported usernames are up to
31 characters long).4. External username contains invalid characters.5. Account is not assigned with any valid permissions.6. External user ID is the same as one of internal user IDs.7. External user ID is not in the supported range.8. Some permissions do not map to any valid groups.9. User ID is not a valid number.
The user account cannot be used to log into the NE (except for case 8 above, where user is still able to log in).
Identifying additional information fieldsUsername
Additional information fieldserror type (1-9 according to the list in "Meaning of alarm")
uid (numeric user ID). Note that in case of error type 9, the user ID in this field is set to -1
comma-separated list of invalid group names (for error type 8)
InstructionsCheck that the username complies with the restrictions imposed by the NE and correct the account information in NetAct LDAP.
The restrictions (based on /RUIMFLEXI/) are the following:
• the username must be created according to [a-zA-Z0-9_.][a-zA-Z0-0_-.]{0,30}{a-zA-Z0-9_.$-]? (32 characters maximum)
• the username cannot start with one of the prefixes reserved for network elements: "_nok", "_nsn"
DN70397367 173
LTE iOMS Alarms 70267 EXTERNAL USER ACCOUNT VALIDATIONFAILED
Id:0900d80580953957Confidential
• the username cannot be the same as one of the reserved names from the list (defined in /RUIMFLEXI/): root, wheel, daemon, adm, sync, shutdown, halt, lp, mail, uucp, operator, games, nobody, gopher, nfs, nfsnobody, named, ntp, ldap, mysql, postgres, apache, sshd, rpm, dbus, vcsa, nscd
• the numeric user ID of a RUIM user must be in the range of [1.000, 9.999.999], that is, greater or equal to one thousand and less than ten million.
• the account must be assigned with at least one valid permission. Valid permissions are those that allow mapping an external user account to one or more network element groups.
ClearingClear the alarm with an alarm management application after correcting the fault as presented in Instructions.
Testing instructionsThe test setup must include an external LDAP server supporting the RUIM schema (defined in /RUIMSCHEMA/).
Before you start, check that:
• FlexiPlatform cluster is commissioned and up. • NE account is defined in the NE's internal LDAP (NWI3 Security fragment). • External LDAP server is up. • All RUIM-related RGs (RuimRep and PAP) are unlocked and enabled.
1. Create a user account in external LDAP in a way that conflicts with the restrictions described in the Meaning of the alarm section.
2. Make this user a member of an LDAP ACL that is linked with ruiAuthObject that defines a valid permission in the network element. For example,
ruiAuthObject and ruiAuthOperation. dn: ruiAuthObjectName=fsui,ou=SystemPermissionsSet,ou=NetAct,ou=Authori zation,ou=ruim, ou=region-911080,ou=regions,ou=NetAct,dc=noklab,dc=netruiIsStereoType: FALSEruiAuthObjectName: fsuiobjectClass: topobjectClass: ruiAuthorizationObjectruiMgmtDomain: ALL
dn: ruiAuthOperationName=monitor,ruiAuthObjectName=fsui,ou=Syst emPermissionsSet,ou=NetAct,ou=Authorization,ou=ruim, ou=region-911080,ou=reg ions,ou=NetAct,dc=noklab,dc=netruiIsScopeDependent: FALSEobjectClass: topobjectClass: ruiAuthorizedOperationruiClassification:ruiAuthOperationName: monitor
You can construct the group name _nokfsuimonitor, if applying the rule "_nok"+rui-AuthObject+ruiAuthOperation. Making a user a member of this group gives it per-missions FSNASVIEW, FSIPVIEW, FSLBVIEW, FSLANVIEW, and so on.
3. Initiate an ssh login using the created account.

174 DN70397367
LTE iOMS Alarms
Id:0900d80580953957Confidential
70267 EXTERNAL USER ACCOUNT VALIDATION FAILED
4. Observe that the alarm is raised and check that the user is not replicated to the NE's internal LDAP RUIM cache fragment (fsFragmentId=security-ruim-cache,fsClus-terId=ClusterRoot). Login is not successful.
5. Clear the alarm manually.
DN70397367 175
LTE iOMS Alarms 70268 EXTERNAL LDAP FAILURE
Id:0900d8058095391cConfidential
90 70268 EXTERNAL LDAP FAILURE Probable cause: Underlying resource unavailable
Event type: Processing error
Default severity: Warning
MeaningNetwork element (NE) experiences problems with the connection to the NetAct external Lightweight Directory Access Protocol (LDAP) server. The alarm is raised for the follow-ing types of problems:
1. Both primary and secondary NetAct LDAP servers are down, unreachable, not responding within certain time, or replying with a return code indicating that LDAP is busy. This indicates a failure.
2. Both the NE account and the initial registration account are not accepted by neither primary nor secondary NetAct LDAP servers. This indicates a failure.
3. Bad LDAP data (for example, loops in referrals, too big a result set).4. Other types of problems, for example invalid RUIM configuration in the local LDAP
server.
The NE is trying to contact the external NetAct LDAP server in the following scenarios:
1. NE connects to the NetAct LDAP server to verify external user's password informa-tion.
2. NE connects to the NetAct LDAP server to obtain external user's authorization data. There are several use cases when this scenario is triggered:a) User authorization data is fetched and replicated locally during the first login of
an external user into the NE, or a login occurring after the replicated user account is removed from NE's internal user database due to cache expiry. This scenario occurs after external user's password has been verified in the context of user authentication.
b) User authorization data replication that is triggered by NE Name Service Switch (NSS) module, for example, by using the id command.
c) User authorization data is fetched and replicated after a relevant CLI command (fsruimrepcli --refreshusers --username <username>) is exe-cuted. For more information, see the RUIM user guide.
d) User authorization data is fetched and replicated due to a scheduled cache update. Scheduled cache updates are performed by the RuimReplicator process of the RuimReplicator Recovery Group automatically and regularly with time interval in between replications. The time interval between replications is configured by the following property in the RuimReplicator property file (in /opt/Nokia_BP/SS_AAA/etc ): // automatic cache refresh interval in secondsruim.replicator.refresh_interval
Problems 1 and 2 prevent successful completion of all scenarios. The effect of the problems is described below:
• In scenarios 1 and 2a external user's login is denied with appropriate PAM (Plugga-ble Authentication Module) error code.
• In scenario 2b there can be various problems related to user-to-group mappings for external users.

176 DN70397367
LTE iOMS Alarms
Id:0900d8058095391cConfidential
70268 EXTERNAL LDAP FAILURE
• In scenario 2c the CLI operation fails. • In scenario 2d the scheduled cache update fails. If time-based replication fails due
to the NetAct LDAP server unavailability (problem 1), RuimReplicator process starts to recover from the failure by retrying the replication according to the following prop-erties:// retry count incase of cache refresh failureruim.replicator.refresh_retry_count// sleep between cache refresh tries in secondsruim.replicator.refresh_retry_interval
Identifying additional information fields1. Problem type (1 - NetAct LDAP not available, 2 - both NE account and initial registra-tion accounts not usable, 3 - Bad data, 4 - Other)
2. Scenario (1 - PAM or NSS failure, 2 - RuimReplicator replication)
Additional information fields
1. LDAP or RUIMCppAPI error code2. Number of retries (applicable for scenario with time-based replication (2d))3. Retry interval (in seconds as defined by the RuimReplicator properties)
InstructionsDepending on the problem type (see Identifying Application Additional Info) the cause for the problem can be:
• Network configuration problems.Check that the primary and secondary NetAct LDAP server addresses (related attri-butes in LDAP are fsnwi3PrimaryLDAPServer and fsnwi3SecondaryLDAPServer) defined in the active configuration fragment under the NWI3 Mediator fragment (fsClusterId=ClusterRoot fsFragmentId=NWI3 fsFragmentId=mediator fsnwi3N3CFId=<your number>) are reachable.
• NE and the initial registration accounts are both invalid as compared to NetAct (wrong account name, password, and so on).Check that the accounts (related attributes in LDAP are fsnwi3NEAccountUsername and fsnwi3InitialRegistrationUsername) stored in the internal LDAP server (fsClusterId=ClusterRoot fsFragmentId=NWI3 fsFragmentId=security and fsClusterId=ClusterRoot fsFragmentId=NWI3 fsFragmentId=mediator fsnwi3N3CFId=<your number>) exist also in the NetAct LDAP servers, have not expired, have correct passwords, and so on.
• NetAct LDAP is overloaded or shut down.
ClearingAlarm is automatically cleared by the RuimReplicator when replication is successful. The alarm is also cleared when a new alarm with the same specific problem but with dif-ferent Identifying Application Additional Info is raised by the RuimReplicator.
Testing instructionsThe test setup must include an external LDAP server populated according to NetAct Remote User Information Management (RUIM) schema (/RUIMSCHEMA/).

DN70397367 177
LTE iOMS Alarms 70268 EXTERNAL LDAP FAILURE
Id:0900d8058095391cConfidential
Before you start, check that:
• NE is commissioned and functioning. • Connection with the external LDAP is established. • All RUIM-related RGs (RuimReplicator and PAP) are unlocked and enabled.
Execution scenario 1:
1. Shut both the primary and secondary NetAct LDAP servers down.2. Login through ssh with a valid external (RUIM) user to the NE.3. If login is unsuccessful, observe that the alarm is raised in NE with the following SCLI
command:show alarm active filter-by specific-problem 70268Alarm additional info must indicate the problem correctly.
4. Start the NetAct LDAP servers.5. Login through ssh with a valid external (RUIM) user to the NE.6. If login is successful, observe that the alarm is cleared automatically by RuimRepli-
cator in NE by using the SCLI command provided in step 3.
Execution scenario 2:
1. In NE, modify the registration accounts (NE and the initial registration: related attri-butes in LDAP are fsnwi3NEAccountUsername and fsnwi3InitialRegistrationUsername) so that both the primary and second-ary NetAct LDAP servers are not accessible (fsClusterId=ClusterRoot fsFragmentId=NWI3 fsFragmentId=security and fsClusterId=ClusterRoot fsFragmentId=NWI3 fsFragmentId=mediator fsnwi3N3CFId=<your number>).
2. Initiate an ssh login with an external account. 3. Observe that the login is denied and an alarm is raised. Alarm additional info must
indicate the problem correctly.
178 DN70397367
LTE iOMS Alarms
Id:0900d80580953958Confidential
70269 INVALID ACTIVE SESSIONS
91 70269 INVALID ACTIVE SESSIONSProbable cause: Database inconsistency
Event type: Processing error
Default severity: Critical
MeaningCurrently there are open sessions to the Network Element (NE) that operate according to outdated authorisation profiles. This situation occurs when there are changes in NetAct Lightweight Directory Access Protocol (LDAP) affecting those external Remote User Information Management (RUIM) user accounts (or permissions associated with those accounts) which were replicated into the NE's local user database.
The change can be one of the following:
• The user account has been removed from NetAct. • The user account cannot be used to access the NE anymore. • The permissions associated with this account have changed in NetAct.
Currently there are active user sessions, opened before the above-mentioned changes were detected in the NE. Within those already created user sessions, access control changes are not automatically taken into effect. Users logged in with affected user accounts still continue to operate with the old permission set.
Note that only sessions maintained in /var/run/utmp are monitored. Currently those are only SSH sessions (ftp sessions opened with vsftpd are also visible in /var/run/utmp, but ftp sessions are not possible with external user accounts accord-ing to the platform configuration). For other types of sessions no alarms are raised.
g The session list in /var/run/utmp is not currently accessible with SCLI commands.
This alarm can indicate that some users operate within the NE with higher permissions than allowed by NetAct according to a changed user account authorisation profile. There are four possible reasons for this:
1. A non-existent user is still logged into the NE (user account removed from NetAct).2. A user with no permissions for the NE is logged in (user account has been detached
from the NE according to RUIM Access Control Lists).3. A user has higher permissions than defined in NetAct (permissions for the user
account were lowered).4. A user has lower permissions than defined in NetAct (permissions for the user
account were raised).
Note that cases 1-3 indicate a security risk.
Identifying additional information fieldsusername
Additional information fieldschange type (user was removed or denied access to the NE (1), user's permissions changed (2))
InstructionsAll currently active SSH sessions based on user accounts mentioned in the Application Additional Info field of the alarm must be closed and reopened, if needed. After reopen-

DN70397367 179
LTE iOMS Alarms 70269 INVALID ACTIVE SESSIONS
Id:0900d80580953958Confidential
ing a session, correct permissions are taken into use, if the account is still in use for the NE.
• Initiate SSH sessions:1. Log into the active CLA.2. To check the open SSH session, execute the following command:
# utmpdump /var/run/utmpNote that there is currently no equivalent SCLI command.For example, the result of invoking utmpdump may look as follows:
# utmpdump /var/run/utmp...[6] [06306] [co ] [LOGIN ] [ttyS1 ] [ ] [196.144.10.0 ] [Tue Nov 14 16:20:58 2006 EET][7] [32610] [ts/0] [testuser] [pts/0 ] [fle4gr01.ntc.nokia.com] [172.21.216.104 ] [Tue Nov 21 19:06:11 2006 EET][7] [32679] [ts/1] [testuser] [pts/1 ] [fle4gr01.ntc.nokia.com] [172.21.216.104 ] [Tue Nov 21 19:07:07 2006 EET][7] [32743] [ts/2] [testuser] [pts/2 ] [fle4gr01.ntc.nokia.com] [172.21.216.104 ] [Tue Nov 21 19:07:45 2006 EET][7] [00361] [ts/3] [testuser] [pts/3 ] [fle4gr01.ntc.nokia.com] [172.21.216.104 ] [Tue Nov 21 19:08:50 2006 EET][7] [17382] [ts/4] [root ] [pts/4 ] [flegrp13.ntc.nokia.com] [172.21.220.61 ] [Fri Dec 01 14:59:47 2006 EET][7] [01256] [ts/5] [extuser ] [pts/5 ] [esfleg03.ntc.nokia.com] [172.21.216.127 ] [Sun Dec 03 13:05:44 2006 EET][7] [04574] [ts/6] [root ] [pts/6 ] [esfleg02.ntc.nokia.com] [172.21.216.126 ] [Fri Dec 01 12:29:21 2006 EET]...
The preferred way of closing a session is a graceful exit. It is, however, possible to close it forcefully. The following example illustrates a forceful cleanup of a session for user extuser.1. First, check the sshd process ID of the child process of 01256:
# ps -ef | grep 1256root 1256 7701 0 13:05 ? 00:00:00 sshd: extuser [priv]10009 1276 1256 0 13:05 ? 00:00:00 sshd: extuser@pts/5root 2504 17382 0 13:06 pts/4 00:00:00 grep 1256
2. Terminate the session:# kill -9 1276
ssh session for user extuser is terminated.
ClearingAfter correcting the fault, as presented in the Instructions section, clearthe alarm in NE using the following SCLI command:set alarm clear alarm-id <alarm id of the alarm>
If the alarm id of the alarm is unknown, use the following SCLI command(that requires the full alarm information):
set alarm clear-matching-alarms filter-by specific-problem 70269 \managed-object <managed object of the alarm> application-id \<application id of the alarm> identifying-application-additional-info \<identifying application additional info of the alarm>
180 DN70397367
LTE iOMS Alarms
Id:0900d80580953958Confidential
70269 INVALID ACTIVE SESSIONS
Testing instructionsThe test setup must include an external LDAP server populated according to the RUIM schema.
Before you start, check that:
• NE is commissioned and up. • All RUIM-related RGs (RuimRep and PAP) are unlocked and enabled.
Execution scenario for SSH:
1. Open an SSH session to the NE using an account defined in RUIM LDAP, for example, extaccount.
2. Remove extaccount from RUIM LDAP. Execute the following CLI command: set user-management ruim replicator refresh users extaccountThis helps to enforce synchronisation between RUIM LDAP and the local replicat-edsecurity fragment.
3. Verify that an alarm for the situation is raised using the following SCLI command:show alarm active filter-by specific-problem 70269This indicates that user extuser is the one for which sessions should be restarted.
4. Exit extuser from the session.5. Try to login again using account extuser. Access must be denied.6. Clear the alarm in NE using the following SCLI command:
set alarm clear alarm-id <alarm id of the alarm found in \step 3>

DN70397367 181
LTE iOMS Alarms 70270 BLADECENTER MANAGEMENT MODULEREDUNDANCY LOST
Id:0900d805809539faConfidential
92 70270 BLADECENTER MANAGEMENT MODULE REDUNDANCY LOSTProbable cause: Lost redundancy
Event type: Equipment
Default severity: Minor
MeaningOne of the management modules has failed or has been removed from the system. The active management module is still operational.
The system is fully operational with only a single management module. However, the faulty or removed management module should be replaced as soon as possible to ensure fault tolerant operability. If the redundant management module is not replaced and the active one fails, the whole system becomes inoperable.
Identifying additional information fields
1. Alert Message Text 2. Host System UUID (Universally Unique Identifier)3. Blade UUID
Additional information fields-
Instructions
1. If there is only one management module present in the chassis, insert another module to the chassis to ensure fault tolerant operability. Check the IBM BladeCen-ter Advanced Management Module Installation Guide (ID MIGR-63781) for instruc-tions at manufacturer's WWW pages http://www.ibm.com.
2. If both management modules are present, try removing and re-inserting the standby management module. Check the IBM BladeCenter Troubleshooting Management Module issues (ID MIGR-58898) for instructions at manufacturer's WWW pages http://www.ibm.com. If the problem persists, replace the standby management module with a new one.
If the previous steps have not resolved the situation, contact your local Nokia Siemens Networks representative.
ClearingThe alarm is automatically cleared by the operating system's fault detector when a working management module is re-inserted in the chassis.
Testing instructions
1. Remove the standby management module from the chassis. 2. Observe that the alarm is raised. 3. Re-insert the removed module.4. Observe cancelling of the alarm.

182 DN70397367
LTE iOMS Alarms
Id:0900d805809538f2Confidential
70271 APPLICATION CONFIGURATION IS OUT OF ORDER
93 70271 APPLICATION CONFIGURATION IS OUT OF ORDER Probable cause: Configuration or customising error
Event type: Processing error
Default severity: Minor
MeaningThe configuration of an application contains an invalid attribute value or an attribute is missing.
Depending on the alarm severity, application’s start-up or run-time session can fail (CRITICAL severity), application can partially loose functionality (MAJOR severity) or ignore the invalid configuration and use default or the closest acceptable value(s) (MINOR severity).
Additional information fields
1. Invalid configuration attribute 2. Configuration repository type (LDAP, FILE, JPROP – Java property, ENVVAR –
environment variable))3. Fault type (1 – attribute is missing, 2 – attribute value is invalid)4. Wrong attribute value (N/A if the attribute is missing) – optionally5. Used default or closest acceptable value – optionally
Instructions
1. Observe the application in question by checking the ‘Application Id’ field of the alarm.
2. Lock the application in the case of a CRITICAL severity alarm to prevent its infinite restart using command:
fshascli –l <Application id>3. Observe the invalid or missing attribute by checking the ‘Identifying Additional Info’
field of the alarm.4. Observe the configuration location by checking the ‘Managed Object’ field (which
contains, for example, a branch for the LDAP-based configuration or a path for the file-based one ).
5. Add or correct the invalid attribute mentioned in the ‘Identifying Additional Info’ field. Follow the guidelines in the customer documentation for the application using the appropriate tool (for example, a text editor for the file-based configuration).
6. Unlock (if the second step was used) or restart the application with commands:- unlock:
fshascli –u <Application Id>- restart:
fshascli –r <Application Id>
ClearingThe system clears the alarm automatically when the fault has been corrected.
Testing instructions
1. Select the application that raises the alarm.

DN70397367 183
LTE iOMS Alarms 70271 APPLICATION CONFIGURATION IS OUT OFORDER
Id:0900d805809538f2Confidential
2. Following the customer documentation guidelines of the application, set a wrong value to a configuration attribute.
3. Restart the application using command:fshascli –r <Application Id>
4. Observe that an alarm is raised 5. Correct the fault following the instructions.6. Restart the application again.7. Observe that the alarm is automatically cleared after some time.

184 DN70397367
LTE iOMS Alarms
Id:0900d80580953a5bConfidential
70272 FIBRE CHANNEL LINK FAILURE
94 70272 FIBRE CHANNEL LINK FAILURE Probable cause: 517
Event type: x5
Default severity: 4 Minor
MeaningOne of the fibre channel switch modules has lost its connection. The error might have been caused by a hardware failure, that is, a potentially broken fibre channel switch module, a broken simple form-factor pluggable (SFP) transceiver or by an unplugged or broken fibre channel cable.
Usually there are at least two fibre channel switch modules equipped and the fibre channel connection is still fully operational if at least one fibre channel link is up. However, the lost connection should be re-established as soon as possible to ensure fault tolerant operability. If the redundant connection is not re-established and the only remaining link goes down, the devices attached to the fibre channel become inaccessi-ble.
Indentifying additional information fields
1. Fibre channel switch module address2. Fibre channel port ID
Additional information fields3. Fibre channel port state
Instructions
1. If the alarm is raised, check that all fibre channel cables at the back of the chassis are properly connected to their corresponding fibre channel switch modules.
2. If all the cables are connected and the problem persists, try replacing the fibre channel SFP transceiver and the fibre channel cable.
3. If the problem still persists, replace the affected fibre channel switch module in the chassis
4. If the previous steps have not resolved the situation, contact your local Nokia Siemens Networks representative.
ClearingThe alarm is automatically cleared by the fault detector of the operating system when the corresponding fibre channel link comes up.
Testing instructions
1. Remove one of the fibre channel cables from the module in the chassis.2. Observe that the alarm is raised. 3. Re-insert the removed cable.4. Verify that the alarm is cleared after the clearing delay.
DN70397367 185
LTE iOMS Alarms 70273 REQUIRED SERVICE UNAVAILABLE
Id:0900d805809539e4Confidential
95 70273 REQUIRED SERVICE UNAVAILABLE Probable cause: Underlying Resource Unavailable
Event type: Processing error
Default severity: Major
MeaningA service required for the application functionality is unavailable.
Depending on the alarm severity, application’s start-up or run-time session can fail (CRITICAL severity) or application can partially loose functionality (MAJOR severity).
Additional information fields
Instructions
1. Observe the application dependent on the service by checking the ‘Application Id’ field of the alarm.
2. Observe the service in question by checking the ‘Managed Object’ field of the alarm that contains the recovery group (RG) of the service.
3. Lock the application in the case of a CRITICAL severity alarm to prevent its infinite restart using command:
fshascli –l <Application Id>
4. Follow the troubleshooting instructions in the customer documentation for the appli-cation in question and try to repair the service. For example, service can be locked by high availability services (HAS) and its recovery assumes unlocking the service.
5. Check also any potential alarm(s) for the service in the list of active ones. The cor-responding alarm manual(s) describe recovery actions for the service.
6. Check also the troubleshooting instructions in the service customer documentation.7. If the service was successfully recovered, unlock (if the third step was used) the
application with command:fshascli –u <Application Id>
8. If the previous steps have not resolved the situation, contact your local Nokia Siemens Networks representative.
ClearingThe alarm will be cleared automatically by the alarm system after five minutes. If the service is still unavailable after that, the alarm is raised again.
Testing instructions
1. Select the application that raises the alarm.2. Following the customer documentation of the application, find the required service
and lock it by using command:fshascli –l <Service RG>
3. Observe that an alarm is raised. 4. Correct the fault following the instructions. As a result, the service should be
unlocked with command:fshascli –l <Service RG>
5. Observe that the alarm is automatically cleared after some time.

186 DN70397367
LTE iOMS Alarms
Id:0900d80580953971Confidential
70274 SWITCH CONFIGURATION LOAD FAILED
96 70274 SWITCH CONFIGURATION LOAD FAILEDProbable cause: Underlying Resource Unavailable
Event type: Processing error
Default severity: Major
MeaningThe upload or download of the configuration file was unsuccessful.
The unit may become unstable or unusable.
Additional information fields1. Configuration file name.
2. IP address of the TFTP (Trivial File Transfer Protocol) server.
InstructionsPreparing to Download a Configuration File Using TFTP (Trivial File Transfer Protocol):1. Ensure that the workstation acting as the TFTP server is configured properly.2. Ensure that the switch has a route to the TFTP server. The switch and the TFTP server must be in the same subnet if you do not have a router to route traffic between subnets. Check connectivity to the TFTP server using the ping command.3. Ensure that the configuration file to be downloaded is in the correct directory on the TFTP server.4. If you are downloading the configuration file to the running configuration, make sure that there are no conflicts between the two configuration files. 5. Ensure that the permissions in the file are set correctly. The user should always have permission to read the specific username.
Preparing to Upload a Configuration File Using TFTP:6. Ensure that the workstation acting as the TFTP server is configured properly.7. Ensure that the switch has a route to the TFTP server. The switch and the TFTP server must be in the same subnet if you do not have a router to route traffic between subnets. Check connectivity to the TFTP server using the ping command.8. Ensure that the directory into which the file is to be uploaded does not contain a con-figuration file with the same name.
ClearingClear the alarm with the alarm management application after correcting the fault accord-ing to the instructions.
Testing instruction1. Try to upload and download the configuration file when TFTP server is unavailable.2. Alarm should be raised in both cases.
DN70397367 187
LTE iOMS Alarms 70275 SWITCH CPU TEMPERATURE EXCEEDED
Id:0900d80580953959Confidential
97 70275 SWITCH CPU TEMPERATURE EXCEEDEDProbable cause: High temperature
Event type: Environmental
Default severity: Critical
MeaningThe internal temperature of the CPU has passed the programmed threshold.
There is a severe temperature-related problem in the referred component, and the unit may behave unexpectedly.
Additional information fields1. The internal temperature of the unit in degrees Celsius.
Instructions1. Check that the air flows freely through the cabinet and the chassis. 2. If the alarm is persistent, replace the faulty plug-in unit. - Refer to the hardware maintenance documentation for detailed replacing instructions.- The details of the faulty plug-in unit (cabinet, chassis and slot) are found in the Appli-cation Additional Info field of the alarm.3. If there are numerous alarms of this kind from several plug-in units, check the air con-ditioning and temperature in the network element (NE) equipment room.4. If the problem remains after applying the instructions, please contact your local Nokia Siemens Networks representative.
ClearingClear the alarm with the alarm management application after correcting the fault accord-ing to the instructions.
Testing instructionsDo not test this alarm because the hardware fault is not reproducible without a risk to cause a permanent damage to the system.
188 DN70397367
LTE iOMS Alarms
Id:0900d8058095395bConfidential
70276 SWITCH CPU UTILIZATION EXCEEDED
98 70276 SWITCH CPU UTILIZATION EXCEEDEDProbable cause: Threshold Crossed
Event type: Quality of service
Default severity: Major
MeaningThe CPU utilization has passed the programmed threshold.
Unit may become unstable.
Additional information fields1. High limit in percent of normal CPU utilization.
2. The current level in percent of CPU utilization.
Instructions1. Check according to the user (troubleshooting) guide that the CPU usage threshold is not set abnormally low.2. Check if excessive traffic is taking place in the network, causing the load to the switch.3. If CPU usage stays abnormally high, perform a switchover to the other switch, if pos-sible.4. If the problem remains after applying the instructions, please contact your local Nokia Siemens Networks representative.
ClearingClear the alarm with the alarm management application after correcting the fault accord-ing to the instructions.
Testing instructions1. Make sure CPU usage monitoring is enabled according to the switch user (trouble-shooting) guide.2. Set the threshold low according to the switch user (troubleshooting) guide.3. Use CPUburn to stress the CPU over the threshold.4. The alarm should be raised.

DN70397367 189
LTE iOMS Alarms 70277 SWITCH IMAGE CHECK FAILED
Id:0900d80580953968Confidential
99 70277 SWITCH IMAGE CHECK FAILEDProbable cause: File Error
Event type: processingErrorAlarm
Default severity: Major
MeaningThe image loaded via TFTP (Trivial File Transfer Protocol) has not passed the CRC (cyclic redundancy check) check and has been discarded.
The loaded binary image is corrupted and can't be used. The corruption may have happened during the transfer or the original image on the server was already corrupted.
Additional information fields1. Image file name.
2. IP address of the TFTP server.
Instructions1. Reload the image from the TFTP server.2. If the problem remains, reload the image from the original source to the TFTP server, and reload the same image from the TFTP server.3. If the problem remains, compare the md5sum of the image file on the TFTP server to that of the original source.4. If the md5sums are the same, the original image file is also corrupted, in which case please contact your local Nokia Siemens Networks representative in order to get the valid image.5. If the md5sums differ, something is continually corrupting the image during the transfer from the original source to the TFTP server. If possible, please replace the sus-pected component, e.g. cable, switch unit etc.6. If the problem remains after applying the instructions, please contact your local Nokia Siemens Networks representative.
ClearingClear the alarm with the alarm management application after correcting the fault accord-ing to the instructions.
Testing instructions1. Rename any text file to the original image file name and use it instead for the update.2. The alarm should be raised during the software update where the faulty image is used.

190 DN70397367
LTE iOMS Alarms
Id:0900d80580953969Confidential
70278 SWITCH MEMORY UTILIZATION EXCEEDED
100 70278 SWITCH MEMORY UTILIZATION EXCEEDEDProbable cause: Out of Memory
Event type: Processing error
Default severity: Major
MeaningThe system memory utilization has passed the programmed threshold.
System is running out of memory which may cause the system to behave erratically.
Additional information fields1. Memory bytes free.
2. Threshold for memory bytes free.
Instructions1. Check according to the user (trouble shooting) guide that the memory usage thresh-old is not set abnormally low.2. If memory usage stays abnormally high, perform a switchover to the other switch, if possible.3. If the problem remains after applying the instructions, please contact your local Nokia Siemens Networks representative.
ClearingClear the alarm with the alarm management application after correcting the fault accord-ing to the instructions.
Testing instructions1. Make sure memory usage monitoring is enabled according to the switch user (trou-bleshooting) guide.2. Set the threshold low according to the switch user (troubleshooting) guide.3. Alarm should be raised when threshold is below current memory utilization level.

DN70397367 191
LTE iOMS Alarms 70279 SWITCH PORT ERROR
Id:0900d80580953a49Confidential
101 70279 SWITCH PORT ERRORProbable cause: Threshold crossed
Event type: Quality of service
Default severity: Major
MeaningThe switch port error alarm is raised for the following reasons on a (physical) port of the switch:
• portErrorsExceeded: the level of errors on the port has passed the programmed threshold. Compared (as a percentage) to the total amount of packets over a period of time.
• portsBroadcastExceeded: the level of broadcast-limit has passed the pro-grammed threshold.
• portsCRCErrExceeded: the level of CRC (cyclic redundancy check) errors has passed the programmed threshold. Compared (as a percentage) to the total amount of packets over a period of time.
• portsRuntsExceeded: the level of runts (=broken (too short) packets) has passed the programmed threshold. Compared (as a percentage) to the total amount of packets over a period of time.
• portsOverSizeExceeded: the level of oversize packets has passed the pro-grammed threshold. Compared (as a percentage) to the total amount of packets over a period of time.
There is a problem with one of the physical ports in the switch, which may severely affect system performance.
It is an expected behaviour of the application to raise this alarm when a switch blade or server is either plugged or unplugged.
Identifying additional information fields
1. Type of the original trap. Contains the string value portErrorsExceeded, portsBroadcastExceeded, portsCRCErrExceeded, portsRuntsExceeded or portsOverSizeExceeded.
2. High limit in percent of exceeding port error.
Instructions
1. Check according to the user (troubleshooting) guide that the port monitoring thresh-old is set correctly.
2. If the port needs to be disabled, refer to the trouble shooting guide on disabling a port due to an excessive number of errors received.
3. Check the network topology and cables related to the affected port.4. If the problem remains, perform a switchover to another switch, if possible. Replace
the faulty unit if needed.5. If the problem remains after following these instructions, please contact your local
Nokia Siemens Networks representative.

192 DN70397367
LTE iOMS Alarms
Id:0900d80580953a49Confidential
70279 SWITCH PORT ERROR
ClearingClear the alarm with the alarm management application after correcting the fault as pre-sented in the instructions.
Testing instructions
1. Make sure port monitoring is enabled according to the switch user (troubleshoot-ing)guide.
2. Set the threshold low according to the switch user (troubleshooting)guide.3. Use a tester to simulate the different scenarios for this alarm, exceedingthe thresh-
old.4. The alarm should be raised.

DN70397367 193
LTE iOMS Alarms 70280 UNKNOWN SPECIFIC PROBLEM
Id:0900d80580953a32Confidential
102 70280 UNKNOWN SPECIFIC PROBLEMProbable cause: Configuration or customising error
Event type: Processing error
Default severity: 5 Warning
MeaningThis alarm is raised when an alarm notification is detected for a specific problem (alarm number) that is unknown to the alarm system (the corresponding alarm type is not defined in the reference data).
The unknown specific problem can be the result of either using a dynamic alarm type (a type that is not inherently predefined and correspondingly not ported to the alarm system) or a mistake due to a missing import of the existing alarm definition in the alarm system.
The alarm is raised in two cases:
1. When the alarm system is configured for supporting dynamic alarm types (the fsDatSupport attribute in the alarm system's LDAP configuration is set to true).
2. When the alarm system doesn't support dynamic alarm types but is configured for raising alarm 70280 instead of alarm 70005 for unknown specific problems (the fsRaise70280insteadOf70005forUnknownSP attribute in the alarm system's LDAP configuration is set to true).
For the first case, the alarm system creates a new type of alarm instantaneously, using the data from the alarm notification. This sets the alarm type parameters and applies it to the alarm notification in question, that is not discarded.
This alarm type is stored persistently in the reference data of the alarm system data-base. It is then applied to the subsequent new alarm notifications that contain the specific problem in question. This results in no longer raising alarm 70280, in the case of recently registered specific problem.
For the second case the alarm system discards the alarm notification in question and raises alarm 70280 that includes data from the original alarm notification.
Identifying application additional information fields
1. Unknown specific problem in the original alarm notification.2. Managed object ID in the original alarm notification.3. Identifying application additional information in the original alarm notification.
Application Additional information fields
1. Perceived severity in the original alarm notification.2. Application additional information in the original alarm notification.
InstructionsThe alarm either announces the use of a dynamic alarm type in alarm notification or indi-cates an undefined alarm in the alarm system (the exact reason can be identified by checking the list of known alarms in the customer documentation). In latter case, contact your Nokia Siemens Networks representative to upgrade the system with the definition of the missing alarm.
The alarm system creates a new alarm type using the following values for its parame-ters:

194 DN70397367
LTE iOMS Alarms
Id:0900d80580953a32Confidential
70280 UNKNOWN SPECIFIC PROBLEM
A. Static Parameters:
B. Dynamic Parameters:
If required, the static parameters can be changed by using SCLI commands:
ClearingThe alarm system clears the alarm automatically after its time to live has expired.
Testing instructionsScenario 1 (dynamic alarm type support is switched on).
1. Check with the parameter tool that dynamic alarm type support is switched on, i.e. the fsDatSupport attribute in the alarm system LDAP configuration is set to true (modify the configuration if necessary and restart the Alarm Processor using the fshascli -rn /AlarmSystem command).
Parameter Value
Alarm text The value of a special field in the alarm notifi-cation; if the field is not defined then the text takes the following form: "ALARM NNN" where NNN is the specific problem in question.
Probable cause 0 (INDETERMINATE).
Event type Environmental.
Specific problem The specific problem in question.
Clearing info Automatic clearing.
Parameter Value
Default severity The perceived severity of the alarm notifica-tion; if it is not set then the INDETERMINATE value is used.
Autoacknowledgment Yes, if the fsParameterId=fsAutoAckedDAT, fsAlarmProcessorConfigurationId=Default, fsAlarmProcessorId=AlarmProcessor1, fsFragmentId= AlarmProcessors, fsFragmentId=AlarmMgmt, fsClusterId=ClusterRootdefined attri-bute in the alarm system’s configuration in Configuration Directory are set to "true"; other-wise - no.
Switch over update No
Clearing delay 0
Informing delay 0
Time to live 0
Operation Instructions "Not defined".

DN70397367 195
LTE iOMS Alarms 70280 UNKNOWN SPECIFIC PROBLEM
Id:0900d80580953a32Confidential
2. Raise any unknown test alarm using the flexalarm tool - for instance 79999:# flexalarm --raise --sp=79999 --mo=/ --ap=/CLA-0/TestRU/TestApp --se=3
3. Observe that a new alarm type with the parameters described in the Instructions field has been added to the alarm system reference data.
4. Observe that alarm 70280 has also been raised.5. Observe that alarm for the created alarm type (with the specific problem unknown
before) has also been raised.6. Observe that alarm 70280 has been cleared after its time to live has expired.
Scenario 2 (dynamic alarm type support is switched off, but alarm 70280 is raised instead of alarm 70005).
1. Check with the parameter tool that dynamic alarm type support is switched off, i.e. the fsDatSupport attribute in the alarm system's LDAP configuration is set to false; and that the fsRaise70280insteadOf70005forUnknownSP attribute is set to true (modify the attributes if necessary and restart the Alarm Processor using the fshascli -rn /AlarmSystem command ).
2. Raise any unknown test alarm using the flexalarm tool - for instance 89999:# flexalarm --raise --sp=89999 --mo=/ --ap=/CLA-0/TestRU/TestApp --se=3
3. Observe that a new alarm type has not been added to the reference data of the alarm system.
4. Observe that alarm 70280 has been raised with the data from the original alarm noti-fication.
5. Observe that the original alarm notification has been discarded.6. Observe that alarm 70280 has been cleared after its time to live has expired.

196 DN70397367
LTE iOMS Alarms
Id:0900d80580953a72Confidential
70281 CABINET DOOR OPEN
103 70281 CABINET DOOR OPENProbable cause: Enclosure Door Open
Event type: Environmental
Default severity: Minor
MeaningFront or rear door of the cabinet is open.
There may be an unauthorized access attempt to the cabinet. In addition, air flow inside the cabinet might not be optimal with cabinet doors open, leading to temperature prob-lems.
Identifying additional information fields1. Front or rear door.
Instructions1. Check that the front and rear doors of the cabinet are closed.2. If the problem remains after applying the instructions, please contact your local Nokia Siemens Networks representative.
ClearingThe system clears the alarm automatically when the fault has been corrected.
Testing instructions
1. Check that alarm input can be enabled and disabled. The alarm in the test should be raised only if the alarm input is enabled. Relevant commands:To enable (unlock) alarm input: fshascli -u /wiredAlarmsTo disable (lock) alarm input: fshascli -l /wiredAlarmsNote! Enabling and disabling the alarm input simultaneously enables and disables two different alarms - Power distribution unit failure (70282) and Cabinet door open (70281) - which share the same alarm input.
2. When alarm input is enabled and a cabinet door is open, the alarm should be raised. Check all open door combinations: front door, back door, or both.
3. Check that the alarm remains after a failover.4. When the doors are closed, alarm should clear itself.

DN70397367 197
LTE iOMS Alarms 70282 POWER DISTRIBUTION UNIT FAILURE
Id:0900d80580953a71Confidential
104 70282 POWER DISTRIBUTION UNIT FAILUREProbable cause: Power supply failure
Event type: Equipment
Default severity: Critical
MeaningOne or more PDUs (power distribution units) in a cabinet have asserted a failure indica-tion. This may refer to a detected anomaly in the PDU input, output, or internal condition. The failure indication might have an additional latching red LED indication. This latching effect is not visible in IO ports.
When the situation has been resolved, the LED indication is removed either by pressing the submerged reset switch in the PDU or with a reset pulse from fshwcli. PDU input undervoltage or overvoltage periods can cause this latching LED indication.
The system may become unstable or unusable due to power problems.
Instructions1. Check for other alarms indicating actual loss of power from the system. The PDU is redundant - losing one PDU does not cause loss of power.2. Use the remote reset command in hwcli to test for the persistence of the failure.- To check units that are present, use the following command: hwcli -a It should show units like pdu-1.- For remote reset, use the following command: hwcli -r pdu-1
If the alarm clears, does not return, and no other alarms indicate actual loss of power, the probable cause is a transient in the power feed, and on-site analysis may be deferred. If the alarm returns, or power loss is evident, the failure should be analyzed and corrected at the target site without delay.- Check the power feed to the PDUs in the cabinet for proper input voltage. Check the status of the PDUs, and replace the faulty unit (failure indication led lit).- If the problem remains after following these instructions, please contact your local Nokia Siemens Networks representative.
ClearingThe alarm will clear automatically when the failure indication from the PDU is cleared via remote reset or manually from the PDU.
Testing instructions
1. Check that alarm input can be enabled and disabled. The alarm in the test should be raised only if the alarm input is enabled. Relevant commands:To enable (unlock) alarm input: fshascli -u /wiredAlarmsTo disable (lock) alarm input: fshascli -l /wiredAlarmsNote! Power distribution unit failure (70282) and Cabinet door open (70281), though wired separately, share the same alarm input, so enabling and disabling the alarm input enables and disables it simultaneously on both.
2. Power down the system, remove/disable one PDU, and power up. The alarm should be raised if alarm input is enabled.
3. Check that the alarm remains after a CLA node failover. A CLA node is a node that is used to run services that are critical to the FlexiServer platform.

198 DN70397367
LTE iOMS Alarms
Id:0900d80580953a71Confidential
70282 POWER DISTRIBUTION UNIT FAILURE
4. Try clearing the alarm by resetting the failure indication both manually from the PDU, and remotely from HWCLI (user interface).

DN70397367 199
LTE iOMS Alarms 70283 FIELD-REPLACEABLE UNIT UNAVAILABLE
Id:0900d80580953991Confidential
105 70283 FIELD-REPLACEABLE UNIT UNAVAIL-ABLEProbable cause: Equipment Malfunction
Event type: Equipment
Default severity: Critical
MeaningThe FRU (Field Replaceable Unit) has been removed from the system or is not healthy.
FRU is a hardware component that can be removed and replaced on-site. Typical FRUs include cards, power supply units, and rackmount components.
System functionality and performance may degrade, or the system may not work at all.
Identifying additional information fieldsThe ILOM (Integrated Lights Out Manager) IP address of the node from where the FRU has been removed or inserted.
Instructions1. Check that all the FRUs are plugged-in and healthy.2. If the problem exists even after following the instructions, please contact your local Nokia Siemens Networks representative.
ClearingThe system clears the alarm automatically when the fault has been corrected.
Testing instruction
1. The alarm should be raised when you remove any FRU from the rackmount accord-ing to the instructions provided in the Sun’s Service manual.
2. The alarm should be cleared when you re-insert the FRU in the rackmount according to the instructions provided in the Sun’s Service manual.

200 DN70397367
LTE iOMS Alarms
Id:0900d80580953a70Confidential
70285 BUS ERROR
106 70285 BUS ERRORProbable cause: Equipment Malfunction
Event type: Equipment
Default severity: Critical
MeaningBus error has taken place. Possible error types are:
Front Panel NMI (non-maskable interrupt request) / Diagnostic InterruptBus TimeoutI/O (input/output) channel check NMISoftware NMIPCI PERR (peripheral component interconnect parity error)PCI SERR (peripheral component interconnect system error)EISA (Enhanced Industry Standard Architecture bus) Fail Safe TimeoutBus Correctable ErrorBus Uncorrectable ErrorFatal NMI
Unit may exhibit erratic behaviour or decreased functionality.
Identifying additional information fields1. Name of the affected unit.
2. Position of the affected unit.
3. Error type.
Instructions1. Check that the affected unit is healthy and plugged in properly.2. Restart the unit if needed.3. Replace the unit if needed.4. If the problem remains after following these instructions, please contact your local Nokia Siemens Networks representative.
ClearingClear the alarm with the alarm management application after correcting the fault as pre-sented in the instructions.
Testing instructionsDo not test this alarm, because a hardware fault is not reproducible without risking per-manent system damage.

DN70397367 201
LTE iOMS Alarms 70286 CPU MALFUNCTION
Id:0900d80580953994Confidential
107 70286 CPU MALFUNCTIONProbable cause: Processor Problem
Event type: Equipment
Default severity: Critical
MeaningA problem in Central Processing Unit (CPU) functionality has been detected. Possible error types are:
• IERR (internal error) • Thermal Trip • FRB1/BIST (fault resilient boot/built-in self-test) failure • FRB2/Hang in POST (power-on self-test) failure (believed to be due or related to a
processor failure) • FRB3/Processor Startup/Initialization failure (CPU didn't start) • Configuration Error • SM BIOS (system management basic input/output system) 'Uncorrectable CPU-
complex Error' • Processor Presence not detected • Processor disabled • Terminator Presence Detected
Identifying additional information fields ILOM (Integrated Lights Out Manager) IP address of the node where the CPU error is detected.
Instructions1. Check that the affected unit is healthy and plugged-in properly.2. Restart the unit if necessary.3. Replace the unit if necessary.4. If the problem persists even after following these instructions, please contact your local Nokia Siemens Networks representative.
ClearingThe alarm is cleared automatically once the fault is rectified.
Testing instructionsDo not test this alarm because the hardware fault is not reproducible without the risk of causing permanent damage to the system.

202 DN70397367
LTE iOMS Alarms
Id:0900d80580953997Confidential
70287 CURRENT OUT OF LIMIT
108 70287 CURRENT OUT OF LIMITProbable cause: Power supply failure
Event type: Equipment
Default severity: Critical
MeaningThe node's current has exceeded the programmed threshold.
The node may behave erratically.
Identifying additional information fieldsILOM (Integrated Lights Out Manager) IP address of the node where the fault has been detected.
Instructions
1. Check the power feed in the cabinet for proper input current.2. Check that the affected unit is healthy and plugged-in properly.3. Restart the unit if necessary.4. Replace the unit if necessary.5. If the problem exists even after following these instructions, please contact your
local Nokia Siemens Networks representative.
ClearingThe alarm is cleared automatically once the fault is rectified.
Testing instructionsDo not test this alarm, because a hardware fault is not reproducible without the risk of causing a permanent damage to the system.

DN70397367 203
LTE iOMS Alarms 70288 EVENT LOGGING DISABLED
Id:0900d80580953a47Confidential
109 70288 EVENT LOGGING DISABLEDProbable cause: Reduced logging capability
Event type: Quality of service
Default severity: Major
MeaningHardware event logging has been intentionally or unintentionally disabled (for example because automatic clearing of logs is not working, thus logs have accumulated).
Hardware alarms can't be detected.
Identifying additional information fields1. Position of the affected unit.
Instructions
1. Check according to the user guide that automatic log clearing is working.2. Enable event logging according to the user guide.3. If the problem remains after following these instructions, please contact your local
Nokia Siemens Networks representative.
ClearingThe system clears the alarm automatically when the fault has been corrected.
Testing instructionsDo not test this alarm because the hardware fault is not reproducible without a risk of permanent damage to the system.

204 DN70397367
LTE iOMS Alarms
Id:0900d80580953999Confidential
70291 BOOTING FAILURE
110 70291 BOOTING FAILUREProbable cause: Equipment Malfunction
Event type: Equipment
Default severity: Critical
MeaningA booting failure has taken place. Possible causes are:
• No bootable media • PXE (preboot execution environment) Server not found • Invalid boot sector • Timeout waiting for user selection of boot source
Unit boot-up may be failing.
Identifying additional information fieldsIntegrated Lights out Manager (ILOM) IP address of the node where the booting failure is detected.
Instructions
1. Try to restart the unit.2. Select the boot source at the prompt.3. Check that boot media exists.4. Check the validity of the boot media (such as, the disk is bootable or the PXE server
is available).5. If the problem remains after following these instructions, please contact your local
Nokia Siemens Networks representative.
ClearingClear the alarm with the alarm management application after correcting the fault accord-ing to the instructions.
Testing instructionsNone

DN70397367 205
LTE iOMS Alarms 70294 SYSTEM FIRMWARE ERROR
Id:0900d8058095392cConfidential
111 70294 SYSTEM FIRMWARE ERRORProbable cause: Equipment Malfunction
Event type: Equipment
Default severity: Critical
MeaningA system firmware error (POST (power-on self-test) error) has been detected. Possible causes are:
No system memory is physically installed in the system. No usable system memory, because all installed memory has experienced an unrecov-erable failure. Unrecoverable hard-disk/ATAPI (Advanced Technology Attachment Packet Inter-face)/IDE (Integrated Drive Electronics) device failure. Unrecoverable system-board failure. Unrecoverable hard-disk controller failure. Removable boot media not found Firmware (BIOS (basic input/output system)) ROM (read-only memory) corruption detected CPU (central processing unit) voltage mismatch (processors that share the same supply have mismatched voltage requirements) CPU speed matching failure System Firmware Hang
Unit boot-up may be failing or the unit may be failing in some other respect.
Identifying additional information fields1. Name of the affected unit.
2. Position of the affected unit.
3. Error type.
Instructions1. Check that the affected unit is healthy and plugged in properly.2. Restart the unit if necessary.3. Replace the unit if necessary.4. If the problem remains after following these instructions, please contact your local Nokia Siemens Networks representative.
ClearingClear the alarm with the alarm management application after correcting the fault accord-ing to the instructions.
Testing instructionsDo not test this alarm, because a hardware fault is not reproducible without risking per-manent system damage.

206 DN70397367
LTE iOMS Alarms
Id:0900d805809539a5Confidential
70295 POWER UNIT FAILURE
112 70295 POWER UNIT FAILUREProbable cause: Power Problem
Event type: Equipment
Default severity: Critical
MeaningA problem in the power unit of the rackmount has been detected. Possible causes are:
• Power Off / Power Down • Power Cycle • Soft Power Control Failure (unit did not respond to request to turn on) • Power Unit Failure detected (other)
System may be out of service.
Identifying additional information fieldsILOM (Integrated Lights Out Manager) IP address of the node where the power unit failure has occurred.
Instructions
1. Check the power feed in the cabinet.2. Check that the affected unit is healthy and properly plugged-in.3. Restart the unit if necessary.4. Replace the unit if necessary.5. If the problem persists even after following these instructions, please contact your
local Nokia Siemens Networks representative.
ClearingThe system clears the alarm automatically when the fault has been corrected.
Testing instructions1. The alarm should be raised when you manually switch off one of the PDUs (Power Distribution Units) according to the instructions provided in the Sun’s service manual..2. The alarm should be cleared automatically when the PDU is switched on.

DN70397367 207
LTE iOMS Alarms 70296 PLATFORM SECURITY VIOLATION
Id:0900d8058095391dConfidential
113 70296 PLATFORM SECURITY VIOLATIONProbable cause: Invalid parameter
Event type: Processing error
Default severity: Major
MeaningOne of the following is taking place:
Pre-boot Password Violation - user password Pre-boot Password Violation attempt - setup password Pre-boot Password Violation - network boot password Out-of-band Access Password Violation Other pre-boot Password Violation
Platform security may have been compromised.
Identifying additional information fields1. Name of the affected unit.
2. Position of the affected unit.
3. Violation type.
Instructions1. If the alarm is raised when you try to log in at boot phase, check that caps lock is off.2. Check if alarm is being caused by another user. 3. If the problem remains after following these instructions, please contact your local Nokia Siemens Networks representative.
ClearingClear the alarm with the alarm management application after correcting the fault accord-ing to the instructions.
Testing instructions
1. The alarm should be raised if you try to login three times with the wrong password at the boot phase.
208 DN70397367
LTE iOMS Alarms
Id:0900d8058095395cConfidential
70297 HIGH TEMPERATURE
114 70297 HIGH TEMPERATUREProbable cause: Temperature Unacceptable
Event type: Environmental
Default severity: Major
MeaningThe rackmount's temperature has exceeded the programmed threshold.
Unit may behave erratically.
Identifying additional information fieldsILOM (Integrated Lights Out Manager) IP address of the node where the high tempera-ture is observed.
Instructions
1. Check that the air flows freely through the cabinet and the rackmount. 2. If the alarm persists, replace the faulty plug-in unit.
- Refer to the Sun’s service manual for detailed replacement instructions.3. If there are similar alarms from several plug-in units, check the air conditioning and
temperature in the room where the Network Element (NE) is installed.4. If the problem exists even after following these instructions, please contact your
local Nokia Siemens Networks representative.
ClearingThe system clears the alarm automatically when the fault has been corrected.
Testing instructions1. The alarm should be raised when you configure the temperature limit below the ambient temperature value, according to the instructions given in the Sun’s service manual.2. The alarm should be cleared when you configure the temperature limit back to the previous value (that is, higher than the ambient temperature).
DN70397367 209
LTE iOMS Alarms 70299 MEMORY ERROR
Id:0900d8058095395aConfidential
115 70299 MEMORY ERRORProbable cause: Equipment Malfunction
Event type: Equipment
Default severity: Critical
MeaningA memory error has been detected. The possible causes are:
• Correctable ECC (error-correcting code) or other correctable memory error • Uncorrectable ECC or other uncorrectable memory error • Parity error • Memory Scrub Failed (stuck bit) • Memory Device Disabled • Correctable ECC or other correctable memory error logging limit reached
The rackmount may have erratic behaviour or decreased functionality.
Identifying additional information fieldsILOM (Integrated Lights Out Manager) IP address of the node where the power unit failure has occurred.
Instructions
1. Check that the affected unit is healthy and plugged-in properly.2. Restart the unit if necessary.3. Replace the unit if necessary.4. If the problem exists even after following these instructions, please contact your
local Nokia Siemens Networks representative.
ClearingThe system clears the alarm automatically when the fault has been corrected.
Testing instructionsDo not test this alarm, because a hardware fault is not reproducible without the risk of causing permanent damage to the system.

210 DN70397367
LTE iOMS Alarms
Id:0900d80580953a20Confidential
70301 BATTERY FAILURE
116 70301 BATTERY FAILUREProbable cause: Battery breakdown
Event type: Equipment
Default severity: Major
Meaning- Battery low- Battery missing- Battery failed (other reason)
Unit may boot up with wrong configuration or date and time.
Identifying additional information fields1. Name of the affected unit.
2. Position of the affected unit.
3. Error type.
Instructions1. Replace the battery of the affected unit.2. If the problem remains after following these instructions, please contact your local Nokia Siemens Networks representative.
ClearingClear the alarm with the alarm management application after correcting the fault accord-ing to the instructions.
Testing instructionsDo not test this alarm, because a hardware fault is not reproducible without risking per-manent system damage.
DN70397367 211
LTE iOMS Alarms 70302 FAN SPEED TOO LOW
Id:0900d8058095396aConfidential
117 70302 FAN SPEED TOO LOWProbable cause: Cooling Fan failure
Event type: Environmental
Default severity: Critical
MeaningThe rotation speed of one of the fans is abnormally low.
Low fan speed may indicate a mechanical or electrical problem with the fan.
Identifying additional information fieldsILOM (Integrated Lights Out manager) IP address of the node where the power unit failure has occurred.
Instructions
1. If the problem persists, please contact your local Nokia Siemens Networks repre-sentative.
ClearingThe system clears the alarm automatically when the fault has been corrected.
Testing instructionsDo not test this alarm because a hardware fault is not reproducible without risking per-manent system damage.

212 DN70397367
LTE iOMS Alarms
Id:0900d80580953a60Confidential
70303 CLUSTER MANAGEMENT NODE DISK OUT OF SYNC
118 70303 CLUSTER MANAGEMENT NODE DISK OUT OF SYNCProbable cause: Equipment malfunction
Event type: Equipment
Default severity: Critical
MeaningThis alarm indicates that one of the Cluster Management Functionality Node (CMFN) has detected that the disk contents are out of sync with the other CMFNs.
This alarm is raised during the boot process, if the system notices that the disks of the CMFNs are not identical. The process automatically puts the booting node into inert mode and powers it off. The user has to take steps manually to get the disks in sync again.
Identifying Additional Information fields-
Instructions
g The following steps reinitialize one of the CMFNs, which deletes all the data on that node.
To recover CMFN from out-of-sync, perform the following steps:
1. Connect to the active CMFN via Secure Shell (SSH). 2. Enable the Preboot Execution Environment (PXE) boot.
To enable PXE boot, enter the following command:set networking-service dhcp pxe-boot enable
3. Power on the out-of-sync node.To find the out-of-sync node from the alarm information, enter the following command:set has power on managed-object <node>(where <node> refers to CLA-0)
4. Select 'boot from network' after restarting the node and during the reboot process.To select 'boot from network', perform following steps:4.1 Select boot menu4.2 Select boot from network4.3 Login to the node, after the boot up process has been completed.
The following message is displayed on the shell prompt:[INITIALIZATION STATE]
5. Reinitialize the out-of-sync node.To reinitialize the out-of-sync node, enter the following command on the cluster master node:initialize hw
6. Disable PXE boot. To disable the PXE boot, enter the following command:set networking-service dhcp pxe-boot disable
7. Remove the INERT flag from the out-of-sync node.To remove the INERT flag, enter the following command:

DN70397367 213
LTE iOMS Alarms 70303 CLUSTER MANAGEMENT NODE DISK OUTOF SYNC
Id:0900d80580953a60Confidential
set has inert off managed-object <CMFN>
8. Reboot the CMFN.To reboot the CMFN, enter the following command:set has restart managed-object <node>
g The node must start up from the local disk.
9. Wait for the Distributed Block Device (DRBD) synchronization to get ready.
ClearingTo clear the alarm, enter the following command:
set alarm clear alarm-id <alarm id of the alarm>
To locate the alarm id of the alarm, enter the following command:
show alarm active
Testing instructionsDo not test this alarm, because a hardware fault is not reproducible without riskingpermanent system damage.

214 DN70397367
LTE iOMS Alarms
Id:0900d80580953a34Confidential
70304 SHELF MANAGER UNAVAILABLE
119 70304 SHELF MANAGER UNAVAILABLE Probable cause: Equipment Malfunction
Event type: Equipment error
Default severity: Critical
MeaningThis alarm is triggered when the system notices that the shelf manager is unavailable. Shelf manager may be missing or is not running in a healthy state. It is also possible that the shelf manager is experiencing a connection problem.
If the system is not able to contact the shelf manager after several retries (currently pro-grammed for 35 retries, 1 retry in 1 second) it queries the existence of the shelf manager by pinging the main IP address and an alarm is raised.
The system then tries to switchover from the main IP address to one of the secondary Ip addresses. If this also fails the alarm is raised again.
The health of the backup shelf manager is also monitored by normal ICMP (Internet Control Message Protocol) pings. If it becomes unavailable, an alarm is raised with alarm Id 70304. No recovery action is taken up in this case. At this point of time, if the active shelf manager fails then the switchover will also fail and controlling of nodes with libhwm will not be possible anymore.
System functionality and performance may degrade, or the system may not work at all.
Identifying Additional Information fields1. IP address of the affected shelf manager.
2. Number of times the retry was done.
3. One of the secondary IP addresses if switchover failed (optional).
Instructions
1. Check that the shelf managers are appropriately plugged in and are running in a healthy state.
2. Check the configuration of shelf managers (whether username exists, network con-figuration etc.).
3. If the problem persists even after following the instructions, please contact your local Nokia Siemens Networks representative.
ClearingThe system clears the alarm automatically when the shelf manager becomes available through the primary IP address. System also clears the backup shelf manager unavail-able alarm, once the ICMP pings to the backup shelf manager succeeds.
Testing instructions
1. Alarm should be raised when you remove a shelf manager from the shelf according to the instructions given in the user guide. You must wait for 35 seconds before the alarm is raised. When the shelf managers are put back and are in functional state again, the alarm should be cleared.
2. Alarm should be raised when the active shelf manager's interface goes down. You can simulate this by manually bringing down the shelf manager's interface. Again, you must wait for 35 seconds before the alarm is raised.

DN70397367 215
LTE iOMS Alarms 70304 SHELF MANAGER UNAVAILABLE
Id:0900d80580953a34Confidential
3. Alarm should also be raised when the backup shelf manager's interface goes down. You can simulate this by manually bringing down the shelf manager's interface. Again, you must wait for 35 seconds before the backup shelf manager unavailable alarm is raised.

216 DN70397367
LTE iOMS Alarms
Id:0900d805809539f5Confidential
70305 FIELD-REPLACEABLE UNIT TYPE MIS-MATCH
120 70305 FIELD-REPLACEABLE UNIT TYPE MISMATCHProbable cause: Equipment Malfunction
Event type: Equipment
Default severity: Critical
MeaningThis alarm is raised when the inserted FRU (field-replaceable unit) does not match with the expected unit based on the target hardware configuration. The alarm is also raised if a unit is inserted in to a slot which is expected to be empty.
FRU is a hardware component that can be removed and replaced on-site. Typical field-replaceable units include cards, power supply units, and chassis components.
System functionality and performance may be degraded, or the system may not be working at all.
Identifying additional information fields
1. Type of the inserted unit.2. Type of the target (intended) unit.
Additional information fields-
Instructions
1. Check that all the FRUs are plugged in into their correct places based on the intended hardware configuration.
2. If the problem remains after applying the instructions, please contact your local Nokia Siemens Networks representative.
ClearingThe system clears the alarm automatically when the fault has been corrected.
Testing instructions
1. Alarm should be raised when inserting a FRU into a slot which is expected to be empty.
2. Alarm should be raised when inserting a FRU into a slot which is reserved to another type of FRU.
3. Alarm should be cleared when all the FRUs are plugged into their correct places based on the intended hardware configuration.

DN70397367 217
LTE iOMS Alarms 70307 VOLTAGE OUT OF LIMIT
Id:0900d80580953909Confidential
121 70307 VOLTAGE OUT OF LIMITProbable cause: Power supply failure
Event type: Equipment
Default severity: Critical
MeaningThe unit’s voltage has exceeded the programmed threshold (high or low values).
The units may behave erratically.
Identifying additional information fieldsILOM (Integrated Lights Out manager) IP address of the node where the power unit failure has occurred.
Instructions
1. Check that the input voltage of the power feed in the cabinet is correct.2. Check that the affected unit is healthy and plugged-in properly.3. Restart the unit if necessary.4. Replace the unit if necessary.5. If the problem exists even after following the instructions, please contact your local
Nokia Siemens Networks representative.
ClearingThe system clears the alarm automatically when the fault has been corrected.
Testing instructionsDo not test this alarm because the hardware fault is not reproducible without the risk of causing permanent damage to the system.
218 DN70397367
LTE iOMS Alarms
Id:0900d805809539f4Confidential
70309 ERROR IN MESSAGE TRANSFER PART 3
122 70309 ERROR IN MESSAGE TRANSFER PART 3Probable cause: SS7 Protocol Failure
Event type: Communications
Default severity: Minor
MeaningThis alarm indicates that there is an error in MTP3 (Message Transfer Part 3) layer of the stack.
Since there is an error in MTP3, it can not handle Signaling System 7 (SS7) traffic.
Identifying additional information fields1. Given below are the error codes along with their possible values:
• 882 AAI_EMTP3_CONTROLLED_REROUTE_BUFFER_FULL • 883 AAI_EMTP3_CHANGEOVER_BUFFER_FULL • 948 AAI_EDMTP3_MARKED_BUFFER_FULL • 017 AAI_EMTP3_UNIQUE_INVOKE_ID_UNAVAILABLE
InstructionsThis alarm could be raised for various reasons. The exact cause of the failure can be determined through the error code values.
These errors codes are shown as a result of some unexpected error in the MTP3 layer:
AAI_EMTP3_CONTROLLED_REROUTE_BUFFER_FULL: This event indicates that when an unavailable route becomes available, the controlled re-routing procedure will be initiated by the stack. If the event has been raised during the re-routing procedure, then there will be a loss of messages till the re-routing proce-dure is completed successfully. It is an indication to the operator that there will be some message loss during the operation.
AAI_EMTP3_CHANGEOVER_BUFFER_FULL: This event indicates that when an unavailable link becomes available, the changeover buffer will be used for re-routing. Re-routing procedure will be initiated by the stack to re-route the messages to the currently available link.
AAI_EDMTP3_MARKED_BUFFER_FULL:This event indicates that the buffer used by the stack to store messages that are coming from the application to the stack during the time of re-routing procedures, has become full. If the application pumps more data than the allocated memory, then this event will be raised. It is an indication to the operator that there will be message loss which is being pumped by the application.The operator may reduce the rate at which the messages flow from the application to the stack to reduce message loss. The message loss cannot be avoided until unless the re-routing procedure is completed successfully.
AAI_EMTP3_UNIQUE_INVOKE_ID_UNAVAILABLE: This event indicates that when an unavailable link becomes available, the stack assigns a Unique Invoke ID to the links during the re-routing procedure. The process is internal to the stack as these invoke ID's are generated by the stack itself.

DN70397367 219
LTE iOMS Alarms 70309 ERROR IN MESSAGE TRANSFER PART 3
Id:0900d805809539f4Confidential
It's just an indication to the operator that during the re-route operation of the links this event occurred.
ClearingThe alarm will be cleared after its Time To Live has expired.
Testing InstructionsDo not test this alarm as its testing requires special software.

220 DN70397367
LTE iOMS Alarms
Id:0900d80580953a1eConfidential
70310 LICENSE MANAGER FAILED TO OBTAIN TARGET ID
123 70310 LICENSE MANAGER FAILED TO OBTAIN TARGET IDProbable cause: Processing error
Event type: Corrupt data
Default severity: Critical
MeaningLicense Manager has failed to obtain the ID of the network element from the source specified in the first Application Additional Information field. The second field includes the previously obtained value. The value N/A means that the value was never set before.
License Manager will not start. Licensed applications will stop operating.
Identifying additional information fields-
Application additional information fields
1. Target ID source2. Previous value of the target ID
InstructionsIf the target ID source is SM-1_networkelementid, verify that the network element ID can be obtained from CLA nodes by executing the following command:
sshSM-1 clia networkelementid
Example:
root@CLA-0(ATCA28) /root/# ssh SM-1 clia networkelementid
Pigeon Point Shelf Manager Command Line Interpreter.
Network Element ID: "ATCA28"
If target ID source is Directory_fsLogicalNetworkElemId, verify that the value of the attribute fsLogicalNetworkElemId in Configuration Directory root has been set:
If target ID source is Directory_fsLogicalNetworkElemId, verify that the value of attribute fsLogicalNetworkElemId in LDAP root has been set:
1. Start SCLI by executing the following command:fsclish
2. Display the value of fsLogicalNetworkElemId by executing the following command: show config scope base fsClusterId=ClusterRoot
Example:
[root@CLA-0(ATCA28) /root/# fsclishroot@CLA-0 [ATCA28] > show config scope base fsClusterId=ClusterRoot
DN70397367 221
LTE iOMS Alarms 70310 LICENSE MANAGER FAILED TO OBTAINTARGET ID
Id:0900d80580953a1eConfidential
dn:fsClusterId=ClusterRootfsClusterId: ClusterRootobjectClass: FSClusterobjectClass: extensibleObjectfsMOID: 1fsLastMOID: 1111fsLogicalNetworkElemId: ATCA28
ClearingThe alarm will be automatically cleared when the License Manager recovery group starts and is able to obtain the ID of the network element.
Testing instructionsIn ATCA environment:
1. Login to the Shelf Manager by executing the following command:ssh SM-1
2. Rename the file .ssh/authorization_keys to .ssh/authorization.org.3. Restart the License Manager by executing the following SCLI command:
set has restart managed-object /CLicMgr

222 DN70397367
LTE iOMS Alarms
Id:0900d80580953a1dConfidential
70311 LICENSE FILE REJECTED
124 70311 LICENSE FILE REJECTED Probable cause:Corrupt Data
Event type: Processing Error
Default severity: Critical
MeaningAn imported license file has been rejected, because it has become invalid. A license file is invalid, if it contains corrupt data. Also, a target-specific license file can be invalid, if the target ID of the network element does not match the target ID listed in the license file.
If the rejected license is the only license for the feature in question, the application imple-menting the licensed feature will stop operating.
Identifying additional information fields1. License file name
Application Additional Information fields1. Reason for license file rejection:
• TIDM - target ID mismatch • LDC - license data corrupted
InstructionsCheck the value of the attributetargetID in the rejected license file. Compare this targetID with the value displayed when you execute the ssh sm-1 clia networkelementid command . If the values do not match, a new license is required.
1. To check the status of a license execute the following SCLI (fsclish) command: show licence code <licence code> where <licence code> is the code of the license to be checked.
2. To install a new license execute the following command:add licence file <licence file>where <licence file> is a fully qualified filename of the license file to be installed.Once you have installed the license, clear the alarm manually.
ClearingClear the alarm manually.
Testing instructions
1. Add a license by executing the following SCLI command: add licence file /root/<filename>
2. Modify the license file /var/opt/nokiasiemens/licmgmt/licences/<filename> manually - add, for instance, one year to endTime.
3. Restart License Manager by executing the following SCLI command:set has restart managed-object /CLicMgrThe alarm will be raised and the license file will be moved to /var/opt/nokiasie-mens/licmgmt/removed_licences/<filename>.

DN70397367 223
LTE iOMS Alarms 70312 SIGNALING GATEWAY/ SIGTRAN LDAP OP-ERATION ERROR
Id:0900d805809539e9Confidential
125 70312 SIGNALING GATEWAY/ SIGTRAN LDAP OPERATION ERRORProbable cause: UNDERLYING RESOURCE UNAVAILABLE
Event type: Processing error
Default severity: Critical
MeaningThis alarm indicates that the Configuration Directory operation has failed in Signaling Gateway or SIGTRAN Network Manager.
Signaling Gateway or SIGTRAN Network Manager would not be able to fetch configu-ration data from the Configuration Directory and will not be able to provide services for configuration of the stacks. Configuration data is essential for the SGW/SIGTRAN solution to run. So this will cause the Network Manager to shut down followed by its restart by HAS (High Availability Services).
Additional information fields1. Error code. Possible values:
• AAI_PM_LDAP_OPEN_NOK: The Configuration Directory services are not available or are down.
• AAI_PM_LDAP_SEARCH_NOK: The Configuration Directory search operation has failed.
Instructions
1. It must be ensured that the Configuration Directory services are running and avail-able before the next restart of Network Manager. To check that the Configuration Directory is running, execute the following SCLI command:show has state administrative operational usage managed-object /DirectoryThe following output should be displayed: /Directory: administrative(UNLOCKED) operational(ENABLED) usage(ACTIVE)
2. The following command can also be used to see if Configuration Directory pro-cesses are running:ps -ef | grep slapdThis will show one or more entries of slapd processes running.
ClearingThe alarm will be cleared once the Network Manager is restarted by the alarm system. If the problem persists, the alarm will be raised again.
Testing InstructionsFor the error AAI_PM_LDAP_OPEN_NOK:This event cannot be tested for both Signalling Gateway and SIGTRAN.

224 DN70397367
LTE iOMS Alarms
Id:0900d805809539e9Confidential
70312 SIGNALING GATEWAY/ SIGTRAN LDAP OP-ERATION ERROR
For the error AAI_PM_LDAP_SEARCH_NOK:
1. Lock the Recovery Group by executing the following SCLI command: set has lock managed-object /SGWNetMgrThe following output is shown: /SGWNetMgr locked successfully.
2. Delete any fragment from the Configuration Directory. For example, you may delete the AS fragment by executing the following command:ldapdelete -v -h Directory -p 389 -D uid=fsLDAPRoot,ou=People,fsFragmentId=SystemSecurity,fsClusterId=ClusterRoot-y /etc/opt/nokiasiemens/ldapfiles/fssecldap.ldaproot "fsFragmentId=ASes,fsFragmentId=SGW,fsClusterId=ClusterRoot" -r -x
3. Unlock the Recovery Group by executing the following SCLI command: set has unlock managed-object /SGWNetMgrFollowing output is shown: /SGWNetMgr unlocked successfully.
4. Alarm 70312 is raised. To verify that the alarm is raised execute thefollowing SCLI command: show alarm active filter-by specific-problem 70312
DN70397367 225
LTE iOMS Alarms 70313 SIGNALING GATEWAY/SIGTRAN CONFIGU-RATION ERROR
Id:0900d80580953a58Confidential
126 70313 SIGNALING GATEWAY/SIGTRAN CONFIGURATION ERRORProbable cause: Software Error
Event type: Processing error
Default severity: Critical
MeaningThis alarm indicates that there has been a configuration error in Signaling Gateway or SIGTRAN.
Effect of the alarm depends on the Application Additional Info field of the alarm.
If the alarm event raised is AAI_IUA_SET_TRACE_FAILED it indicates that the Trace Log level for the corresponding protocol stack will be set to the default level.
For all other alarm events, Signaling Gateway/SIGTRAN Network Manager (SNM) or Signaling Gateway/SIGTRAN Layer Managers (SLMs) will not be able to provide any services. The alarm indicates a shutdown of the entity in question followed by its restart from HAS (High Availability Services).
Identifying additional information fields1. Error source.
Error source field is applicable only for the following error codes displayed in the Appli-cation Additional Information fields:
1. AAI_PM_ERR_RESPONSE event:Following are the possible values:a) MTP3_CONFIG : MTP3 Configuration Errorb) M3UA_CONFIG : M3UA Configuration Errorc) MTP2_CONFIG : MTP2 Configuration Errord) MTP1_CONFIG : MTP1 Configuration Errore) SLMINFO_CONFIG : SLM Info Configuration error.f) IUA_CONFIG : IUA Configuration Errorg) SCCP_CONFIG : SCCP Configuration Error.
2. AAI_M3UA_ADD_LOCAL_AS_FAILED - AS Id (1-1000) identifying the M3UA Local AS
3. AAI_M3UA_ADD_REMOTE_AS_FAILED - AS Id (1-1000) identifying the M3UA Remote AS
4. AAI_M3UA_ADD_LOCAL_ASP_FAILED - AS Id (1-1000) identifying the M3UA Local ASP Id
5. AAI_M3UA_ADD_REMOTE_ASP_FAILED - AS Id (1-1000) identifying the M3UA Remote ASP ID
Additional information fields2. Error codes. Possible values are:
• AAI_SNM_INIT_CONFIG_NOK::This event is raised when the IP address of Signaling Gateway or SIGTRAN Network Manager (SNM) is unavailable to the SNM itself. This IP address is supposed to be assigned as a part of the commissioning procedure and should be available to all processes running in the cluster.

226 DN70397367
LTE iOMS Alarms
Id:0900d80580953a58Confidential
70313 SIGNALING GATEWAY/SIGTRAN CONFIGU-RATION ERROR
• AAI_SNM_SERVER_IPPORT_NOK:This event indicates that the IP address and port configured for the Signaling Gateway or SIGTRAN Network Manager (SNM) is not available for use. This could happen if another program is using the same IP address and port combination.
• AAI_PM_ERR_RESPONSE: This event is raised when the PMHandler (the entity that reads configuration data from Configuration Directory) sends a configuration-read error to the Signaling Gateway or SIGTRAN Network Manager (SNM).
• AAI_SLM_INIT_CONFIG_NOK: This event is raised when the IP address of Signaling Gateway or SIGTRAN Network Manager (SNM) is unavailable to the Signaling Gateway or SIGTRAN Layer Manager (SLM) that has raised this alarm. This IP address is supposed to be assigned as a part of the commissioning procedure and should be available to all processes running in the cluster.
• AAI_SLM_STACKHNDLR_SERVER_IPPORT_NOK: This event is raised when the Stack Handler within a Signaling Gateway or SIGTRAN Layer Manager (SLM) is unable to create a server using the IP address and port configured in Configuration Directory.
• AAI_MTP3_ADD_SAP_FAILED:This event is raised while adding the MTP3-SAP. There was an exception raised and the operation failed.
• AAI_MTP3_ADD_SELF_PC_FAILED:This event is raised while adding the MTP3-Self point code. There was an exception raised and the operation failed.
• AAI_MTP3_ADD_DEST_PC_FAILED : This event is raised while adding the MTP3-Destination point code. There was an exception raised and the operation failed.
• AAI_MTP3_ADD_LINK_FAILED : This event is raised while adding the MTP3-links. There was an exception raised and the operation failed.
• AAI_MTP3_ADD_LINKSET_FAILED : This event is raised while adding the MTP3-Linkset. There was an exception raised and the operation failed.
• AAI_MTP3_ADD_ROUTE_FAILED: This event is raised while adding the MTP3-Route. There was an exception raised and the operation failed.
• AAI_MTP3_INIT_FAILED: This event is raised when there is a failure of the initialization of MTP3 details, during the MTP3 provision process due to some invalid entries in MTP3.
• AAI_MTP3_SET_TRACE_FAILED: This event is raised when there is a failure in enabling the trace levels for MTP3 during the MTP3 provision.
• AAI_MTP3_SM_ACTIVATE_FAILED: This event indicates the failure of the MTP3.
• AAI_MTP3_SM_INIT_REDN_FAILED: This event indicates that the redundancy-related data initialization has failed.
• AAI_M3UA_INIT_FAILED: This alarm indicates the failure of the initialization of M3UA due to some invalid entries in the M3UA configuration.

DN70397367 227
LTE iOMS Alarms 70313 SIGNALING GATEWAY/SIGTRAN CONFIGU-RATION ERROR
Id:0900d80580953a58Confidential
• AAI_M3UA_ADD_SGP_FAILED: This event is raised when SGP(signaling gateway process) with a given id cannot be added due to some invalid entries in the configuration.
• AAI_M3UA_SET_TRACE_FAILED: This event indicates a failure in enabling the trace levels for M3UA during the M3UA provisioning.
• AAI_M3UA_ADD_REMOTE_AS_FAILED: This event is raised when the Remote AS (Application Server) with the given id cannot be added due to some invalid entries in the configuration.
• AAI_M3UA_ADD_REMOTE_ASP_FAILED:This event is raised when the Remote ASP(Application Server Process) with the given id cannot be added due to some invalid entries in the configuration.
• AAI_M3UA_ADD_LOCAL_ASP_FAILED:This event is raised when the Local ASP with the given id cannot be added due to some invalid entries in the configuration.
• AAI_M3UA_ADD_LOCAL_AS_FAILED: This event is raised when the Local AS with the given id cannot be added due to some invalid entries in the configuration.
• AAI_SCCP_SS7_DMR_CONFIG_FAILED:This event is raised when adding SCCP (Signaling Connection Control Part) DMR (downward message routing) configuration fails.
• AAI_SCCP_SET_EVENT_REPORT_FAILED: This event is raised when setting SCCP event reporting fails.
• AAI_SCCP_ADD_SAP_FAILED: This event is raised when adding SCCP SAP (Service Access Point) fails.
• AAI_SCCP_ADD_SP_FAILED: This event is raised when adding SCCP SP (Signaling Point) fails.
• AAI_SCCP_ADD_SS_FAILED: This event is raised when adding SCCP SS (Subsystem) fails.
• AAI_SCCP_ADD_CSS_FAILED: This event is raised when adding SCCP CSS (Concerned Subsystem) fails.
• AAI_SCCP_ADD_CSP_FAILED: This event is raised when adding SCCP CSP (Concerned Signaling Point) fails.
• AAI_SCCP_ADD_TRANS_RULE_FAILED: This event is raised when adding GT Translation rule fails.
• AAI_SCCP_ADD_DPC_SSN_FAILED: This event is raised when adding DPC (Destination Point Code) SSN (Subsystem Number) table fails.
• AAI_SCCP_INIT_FAILED: This event is raised when SCCP stack initialization fails.
• AAI_SCCP_SET_TRACE_FAILED: This event is raised when setting SCCP trace level fails.
• AAI_IUA_INIT_FAILED: This event is raised when IUA(ISDN(Integrated Service Digital Network) Q.921User Application Layer) stack layer initialization fails.
• AAI_IUANIF_INIT_FAILED: This event is raised when IUA NIF(Nodal Inter-working Function) stack layer initial-ization fails.

228 DN70397367
LTE iOMS Alarms
Id:0900d80580953a58Confidential
70313 SIGNALING GATEWAY/SIGTRAN CONFIGU-RATION ERROR
• AAI_IUA_ADD_AS_FAILED: This event is raised when addition of an AS(Application Server) fails during IUA stack provisioning.
• AAI_IUA_ADD_ASP_FAILED: This event is raised when addition of an ASP (Application Server Process) fails during IUA stack provisioning.
• AAI_IUA_CONFIG_SERVER_FAILED: This event is raised when the setup of server at an SG (Signaling Gateway) fails during IUA stack provisioning.
• AAI_IUA_CONFIG_SG_FAILED: This event is raised when configuration of an SG (Signaling Gateway) fails during IUA stack provisioning.
• AAI_IUA_SET_TRACE_FAILED: This event is raised when setting an IUA stack trace level fails.
InstructionsGiven below are the possible error codes as shown in the Application Additional Info field and the associated procedures to be followed for each of the error code:After making the change in the configuration, the respective entity must be restarted.
1. AAI_SNM_INIT_CONFIG_NOK : a) Check the entry for SGWNetMgr in /etc/hosts on the cluster. An entry MUST be present with a valid IP address. For example: 169.254.0.10 SGWNetMgr.internalnet.localdomain SGWNetMgr b) If the entry is not present please contact your local Nokia Siemens Network Rep-resentative.
2. AAI_SNM_SERVER_IPPORT_NOK: a) Check that the port used by SGWNetMgr is 49231. b) Check if the IP address and port intended to be used by the SGWNetMgr is not being used by any other program. You can check this by executing the following command:netstat -np -t -l | grep -i <IP address of SGWNetMgr>This command MUST NOT show any entries with the same IP address and port as the ones assigned for the SGWNetMgr.
3. AAI_PM_ERR_RESPONSE: a) This event indicates error in the reading of the configuration from the Configu-ration Directory. Identify the type of configuration error from the Identifying Applica-tion Additional info. b) Correct the configuration identified by the Identifying Application Additional Info as per the customer documentation provided.
4. AAI_SLM_INIT_CONFIG_NOK a) Check the entry for SGWNetMgr in /etc/hosts on the cluster. An entry MUST be present with a valid IP address. For example:169.254.0.10 SGWNetMgr.internalnet.localdomain SGWNetMgr b) If the entry is not present please contact your local Nokia Siemens Networks representative.
5. AAI_SLM_STACKHNDLR_SERVER_IPPORT_NOK a) Check the SGUs (Signaling Gateway Units) within each SGW fragment in the Configuration Directory and ensure that the ports defined are correct and available on the cluster as explained in step 2.b above.The IP addresses to be used for each SLM type (for SCCP and ISDN) are defined

DN70397367 229
LTE iOMS Alarms 70313 SIGNALING GATEWAY/SIGTRAN CONFIGU-RATION ERROR
Id:0900d80580953a58Confidential
in /etc/hosts. For example: 169.254.0.12 SCCPSGU-CLA-1-0.internalnet.localdomain SCCPSGU-CLA-1-0169.254.0.14 SCCPSGU-CLA-0-1.internalnet.localdomain SCCPSGU-CLA-0-1169.254.0.28 SCCPSGU-AS-0-1.internalnet.localdomain SCCPSGU-AS-0-1169.254.0.33 SCCPSGU-AS-1-0.internalnet.localdomain SCCPSGU-AS-1-0169.254.0.13 ISDNSGU-CLA-0-1.internalnet.localdomain ISDNSGU-CLA-0-1169.254.0.20 ISDNSGU-AS-0-1.internalnet.localdomain ISDNSGU-AS-0-1For SS7 SLMs, the IP addresses used are the same as the Node IP addresses on which they run.
6. AAI_M3UA_INIT_FAILED: Following are the reasons for the Initialization to fail a) Memory initialization failed b) Invalid parameter value
7. AAI_M3UA_SET_TRACE_FAILED: If this event is raised the operator should verify the configuration at M3UA trace level.
8. AAI_M3UA_ADD_REMOTE_AS_FAILED and AAI_M3UA_ADD_LOCAL_AS_FAILED: If this event is raised the operator should verify the configuration at M3UA. Following are the possible causes for this event to be raised: a) The given ID is outside the valid range. b) AS with the given ID is already added c) Traffic mode is invalid d) Limit for maximum ASPs serving an AS is exceeded e) The routing context that is added is already configured into the M3UA stack. f) The number of ASPs in an AS are invalid g) Invalid/Undefined network appearance. h) Any of the ASPs in the list does not exist. i) Duplicate entries in the ASP list.
9. AAI_M3UA_ADD_REMOTE_ASP_FAILED and AAI_M3UA_ADD_LOCAL_ASP_FAILED: If this event is raised the operator should verify the configuration at M3UA. Following could be the possible causes for this event to be raised: a) If the ASP ID given is outside the valid range. b) Number of addresses specified is equal to zero. c) The maximum number of IP addresses per endpoint limit is exceeded. d) Transport address passed is invalid. e) The address list supplied with API has duplicate entries. f) Network ASP ID is already configured
10. AAI_MTP3_INIT_FAILED: Following are the reasons for the Initialization to fail a) Memory initialization failed b) Invalid parameter value
11. AAI_MTP3_SET_TRACE_FAILED: The operator should verify the configuration at M3UA trace level.
230 DN70397367
LTE iOMS Alarms
Id:0900d80580953a58Confidential
70313 SIGNALING GATEWAY/SIGTRAN CONFIGU-RATION ERROR
12. AAI_MTP3_ADD_SAP_FAILED, AAI_MTP3_ADD_SELF_PC_FAILED, AAI_MTP3_ADD_DEST_PC_FAILED, AAI_MTP3_ADD_LINK_FAILED, AAI_MTP3_ADD_LINKSET_FAILED:If these events are raised the operator should verify the configuration at M3UA. Fol-lowing are the possible causes for this event to be raised: a) The given ID is outside the valid range. b) SAP//LINKSET/LINK/ROUTE/SelfPC/DPC with the given ID are already added
13. AAI_SCCP_INIT_FAILED: Following reasons will lead to SCCP initialization failure: a) SCCP already initialized b) Invalid state c) Invalid stack standard specified d) Maximum values exceeded e) Memory allocation failure
14. AAI_SCCP_SET_TRACE_FAILED: Following reasons will lead to set trace failure: a) Invalid module id specified b) Invalid trace flag c) Invalid trace level d) SCCP trace disabled
15. AAI_SCCP_SET_EVENT_REPORT_FAILED:Following reasons will lead to set event reporting failure: a) Invalid module id b) Invalid event level c) Invalid event object id
16. AAI_SCCP_ADD_SAP_FAILED: Following reasons will lead to failure in adding SAP: a) Memory allocation failure b) MTP SAP already exists c) MTPS SAP list overflow
17. AAI_SCCP_ADD_SP_FAILED: Following reasons will lead to failure in adding an SP: a) Invalid point code b) Point Code already exists
18. AAI_SCCP_ADD_SS_FAILED: Following reasons will lead to failure in adding an SS: a) Invalid SP id b) Invalid SS id
19. AAI_SCCP_ADD_CSS_FAILED: Following reasons will lead to failure in adding CSS: a) Invalid SS id b) Invalid CSS id
20. AAI_SCCP_ADD_TRANS_RULE_FAILED:Following reasons will lead to failure in adding GT rule: a) Memory allocation failure b) Invalid global title indicator c) Invalid GTI value

DN70397367 231
LTE iOMS Alarms 70313 SIGNALING GATEWAY/SIGTRAN CONFIGU-RATION ERROR
Id:0900d80580953a58Confidential
d) Invalid NAI or NP or ES e) No translation rule found f) GTT memory allocation failure
21. AAI_SCCP_ADD_DPC_SSN_FAILED:Following reasons will lead to failure in adding GT DPC SSN: a) Memory allocation failure c) Invalid GT digits number d) GTT SSN invalid e) Invalid PC value f) Invalid MTPSAP g) Invalid table mask h) Invalid class defined i) Invalid bound j) Invalid route flag
22. AAI_IUA_INIT_FAILED: Following reasons could lead to this error: a) Memory allocation failure Ensure enough memory is available for SGW (Signaling Gateway). Restart the ISDN SLM. b) Invalid IUA configuration in Configuration Directory Check the IUA configuration in Configuration Directory and correct the errors. Restart the ISDN SLM.
23. AAI_IUANIF_INIT_FAILED:Following reasons could lead to this error: a) Memory allocation failure Ensure enough memory is available for SGW (Signaling Gateway). Restart the ISDN SLM. b) Invalid IUANIF configuration in Configuration Directory Check the IUANIF configuration in Configuration Directory and correct the errors. Restart the ISDN SLM.
24. AAI_IUA_ADD_AS_FAILED: Check the IUA AS configurations and Restart the ISDN SLM after correcting the errors.
25. AAI_IUA_ADD_ASP_FAILED: Check the IUA ASP configurations and restart the ISDN SLM after correcting the errors.
26. AAI_IUA_CONFIG_SERVER_FAILED: Check the IUA server configurations and restart the ISDN SLM after correcting the errors.
27. AAI_IUA_CONFIG_SG_FAILED:Check the IUA SG configurations and restart the ISDN SLM after correcting the errors.
28. AAI_IUA_SET_TRACE_FAILED: Check the IUA Stack Trace level value in Configuration Directory and restart the ISDN SLM after correcting the error.
ClearingThe alarm will be cleared automatically once the faulty entity is restarted by the alarm system. However it must be ensured that the configuration and setup has been cor-rected as described in Instructions, otherwise the alarm will be raised again.

232 DN70397367
LTE iOMS Alarms
Id:0900d80580953a58Confidential
70313 SIGNALING GATEWAY/SIGTRAN CONFIGU-RATION ERROR
Testing InstructionsAs per the Application Additional Info enumerations:
1. AAI_SNM_INIT_CONFIG_NOK
a) Unset the hostname provided/configured for SGWNetMgrb) Restart SGWNetMgr to get the error
2. AAI_SNM_SERVER_IPPORT_NOK:a) Run a sample TCP server using the same IP address and port (49231)b) Restart the SGWNetMgr to get the error.
3. AAI_PM_ERR_RESPONSE:a) Edit or remove any mandatory parameter in any of the configuration (required
as per customer documentation provided).b) Restart SGWNetMgr to get the error.
4. AAI_SLM_INIT_CONFIG_NOK
a) Unset the hostname provided/configured for SGWNetMgr. b) Restart SGWNetMgr to get the error.
5. AAI_SLM_STACKHNDLR_SERVER_IPPORT_NOK
a) Run a sample TCP server using the same IP address and port as used by any of the SLMs.
b) Restart the SLM to get the error.6. AAI_IUA_INIT_FAILED
a) Change the value of fssgwIUAMaxAs to 0 in IUA Init fragment in Configura-tionDirectory.
b) Restart the SLM to get the error.7. AAI_IUANIF_INIT_FAILED
a) Change the value of fssgwIUANIFNai to 0 from one of the IUA NIF NAIfrag-ments in Configuration Directory.
b) Restart the SLM to get the error.8. AAI_IUA_ADD_AS_FAILED
a) Change the value of fssgwIUAAspIdList attribute to 0 in one of the IUA AS fragments in Configuration Directory
b) Restart the SLM to get the error.9. AAI_IUA_ADD_ASP_FAILED
a) Change the value of the parameter fssgwIUASctpPort to 0 in one of the IUA ASP fragments in Configuration Directory
b) Restart the SLM to get the error10. AAI_IUA_CONFIG_SERVER_FAILED
a) Change the value of the parameter fssgwIUAMaxInStreams to 0 in IUA ServerInfo fragment in Configuration Directory.
b) Restart the SLM to get the error11. AAI_IUA_CONFIG_SG_FAILED
a) Change the value of the parameter fssgwIUASctpPort to 0 in IUA Config SG fragment in Configuration Directory.
b) Restart the SLM to get the error12. AAI_IUA_SET_TRACE_FAILED
a) Change the value of the parameter fssgwIUATraceLevel to 10 in SGWLogger DEBUG fragment in Configuration Directory.
DN70397367 233
LTE iOMS Alarms 70313 SIGNALING GATEWAY/SIGTRAN CONFIGU-RATION ERROR
Id:0900d80580953a58Confidential
b) Restart the SLM to get the error

234 DN70397367
LTE iOMS Alarms
Id:0900d80580953a35Confidential
70314 SIGNALING GATEWAY/SIGTRAN SNM SLM COMMUNICATION ERROR
127 70314 SIGNALING GATEWAY/SIGTRAN SNM SLM COMMUNICATION ERRORProbable cause: Software Error
Event type: Processing error
Default severity: Warning
MeaningThis alarm indicates that there has been a communication error between Signaling Gateway or SIGTRAN Network Manager (SNM) and Signaling Gateway or SIGTRAN Layer Managers (SLMs).
This is a warning alarm intended to inform the operator of the breakage of the commu-nication channel between the SLM and SNM. This could be a transient error until the communication path between the SLM and SNM is re-established.
Additional information fields1. Given below are the error codes along with their possible values:
• AAI_SLM_SNM_DISCONNECT: The SLM has detected a connection breakage from the Signaling Gateway or SIGTRAN Network Manager (SNM).
• AAI_SLM_SNM_CONN_MAX_ATTEMPTS:The SLM has reached a maximum limit of connection attempts to SNM.
InstructionsGiven below are the possible error codes as shown in the Application Additional Info field and the associated procedures to be followed for each of the error code:
1. AAI_SLM_SNM_DISCONNECT: This event is noticed when an SNM is restarted while the SLM is up and running. The SLM will keep trying to connect to the SNM (whenever it is restarted). The dis-connection can be investigated, though on some occasions this is a valid scenario where SNM is brought down for maintenance and other cases.
2. AAI_SLM_SNM_CONN_MAX_ATTEMPTS: This event is noticed if the SNM and SLM connection has broken and the SNM has not restarted again for a long time (until the maximum number of attempts have been reached). In such a scenario, you may do the following:i. Check the status of the SNM. Restart the SNM if it is not already running.ii. If the SNM is up, check if it is indeed listening on the IP and Port (49231) on the cluster by using the following command: netstat -nap | grep -i sgwNetMgriii. If the above two steps are successful, then check that the network path is avail-able between the node on which the SNM is running and the node on which the SLM (that has raised the alarm) is running.
These events will be cleared if the connection between the SLM and SNM is re-estab-lished.
DN70397367 235
LTE iOMS Alarms 70314 SIGNALING GATEWAY/SIGTRAN SNM SLMCOMMUNICATION ERROR
Id:0900d80580953a35Confidential
ClearingThe alarm will be automatically cleared if the connection between the SLM and SNM is re-established or the faulty entity is restarted.
Testing Instructions
1. Execute the following commands (a) and (b) on the same node on which SNM is running. The commands will kill the SNM forcefully and lock it for some time to avoid restart.a) pid=`ps -eaf | grep sgwNetMgr | grep -v grep | awk '{print
$2}'`
b) kill -9 $pid; fsclish -c "set has lock managed-object /SGWNetMgr"
2. Verify whether the alarm has been raised, by executing the following SCLI command:show alarm active filter-by specific-problem 70314
3. Execute the following command to unlock the SNM: fsclish -c “set has unlock managed-object /SGWNetMgr”
4. Verify if the alarm is cleared, by executing the following SCLI command:show alarm active filter-by specific-problem 70314
236 DN70397367
LTE iOMS Alarms
Id:0900d805809539a8Confidential
70315 SIGNALING GATEWAY/SIGTRAN INTERNAL ERROR
128 70315 SIGNALING GATEWAY/SIGTRAN INTERNAL ERRORProbable cause: Software Error
Event type: Processing error
Default severity: Critical
MeaningThis alarm indicates that there has been an internal error in Signaling Gateway/SIG-TRAN Network Manager (SNM) or Signaling Gateway/SIGTRAN Layer Managers (SLMs).
These are critical errors which will cause the Signaling Gateway/SIGTRAN entities to malfunction. They indicate shutdown of the entity in question.
Additional information fields1. Given below are the error codes along with their possible values:
• AAI_SNM_BAD_ALLOC: Memory Allocation failure within the SNM subsystem • AAI_PM_INIT_NOK: Could not start the PMHandler (the entity responsible for
fetching configuration data from Configuration Directory) thread. • AAI_SLM_BAD_ALLOC: Memory Allocation failure within the SLM subsystem. • AAI_SLM_STACKHNDLR_INIT_NOK: Could not start the Stack Handler (the entity
responsible for configuring the stack) thread. • AAI_STACKHNDLR_SEND_FAILED: SLM's communication with the Stack Handler
failed. • AAI_SLM_SEND_FAILED: Stack Handler's communication with SLM failed. • AAI_STACKHNDLR_HEALTHCHK_NO_RESPONSE: Stack Handler did not respond to
SLM's health check requests. • AAI_SGW_MEMORY_ALLOC_FAILURE: Memory Allocation failure in Signaling
Stacks.
InstructionsFor this alarm type, all events are generated for errors that are very rare and mostly due to environmental defects/ issues. These are generated as an indication that the faulty subsystem will be restarted.In all these events the faulty subsystem will shutdown and will be restarted by HAS. On restart these errors will be cleared and should not recur.Refer to customer documentation to gather information on error logs and statistics.If the problem persists please contact your local Nokia Siemens Networks representa-tive.AAI_SGW_MEMORY_ALLOC_FAILURE: In case of memory allocation failure, operator should ensure that enough memory is available for proper functioning of the Signalling stacks.
ClearingThe alarm is cleared automatically once the alarm application is restarted. If the problem persists the alarm will be raised again.

DN70397367 237
LTE iOMS Alarms 70315 SIGNALING GATEWAY/SIGTRAN INTERNALERROR
Id:0900d805809539a8Confidential
Testing InstructionsDo not test this alarm because the fault is not reproducible without risking system damage or instability.

238 DN70397367
LTE iOMS Alarms
Id:0900d8058095396cConfidential
70316 LOCAL OR REMOTE APPLICATION SERVER [PROCESS] DOWN
129 70316 LOCAL OR REMOTE APPLICATION SERVER [PROCESS] DOWNProbable cause: Connection establishment error
Event type: Communications
Default severity: Major
MeaningThis alarm is intended to inform the operator about the events received from the M3UA (Message Transfer Part 3 Adaptation Layer) stack or IUA (ISDN (Integrated Service Digital Network) Q.921User Application Layer) stack.
The services provided by the entity in question will not be available.
Identifying additional information fields1. Object Id. Value depends on Application Additional Information field.
• AAI_M3UA_SM_SPMC_DOWN: M3UA Local SGP Id Subfield 1: M3UA local SGP ID Subfield 2: 2
• AAI_M3UA_SM_LOCAL_AS_DOWN: M3UA Local AS Id Subfield 1: M3UA local AS Id Subfield 2: 1 - 1000
• AAI_M3UA_SM_REMOTE_AS_DOWN: M3UA Remote AS Id Subfield 1: M3UA Remote AS Id Subfield 2: 1 - 1000
• AAI_M3UA_ASSOC_DOWN:Subfield 1: Association Id (1 to 22000)
• AAI_M3UA_ASSOC_INACTIVE:Subfield 1: Association Id (1 to 22000)
• AAI_M3UA_REMOTE_AS_STATE_INACTIVE:Subfield 1: AS Id (1 to 65535)
• AAI_M3UA_CONN_DOWN:Subfield 1: Association Id (1 to 22000)
• AAI_IUA_AS_STATE_DOWN: IUA Remote AS Id Subfield 1: IUA Remote AS Id Subfield 2: 1 - 100
• AAI_IUA_AS_STATE_INACTIVE: IUA Remote AS Id Subfield 1: IUA Remote AS Id Subfield 2: 1 - 100
• AAI_IUA_ASP_STATE_DOWN: IUA Remote ASP Id Subfield 1: IUA Remote ASP Id Subfield 2: 1 - 128

DN70397367 239
LTE iOMS Alarms 70316 LOCAL OR REMOTE APPLICATION SERVER[PROCESS] DOWN
Id:0900d8058095396cConfidential
• AAI_IUA_ASP_STATE_INACTIVE: IUA Remote ASP Id Subfield 1: IUA Remote ASP Id Subfield 2: 1 - 128
• AAI_IUA_CONN_DOWN: IUA Remote ASP Id Subfield 1: IUA Remote ASP Id Subfield 2: 1 - 128
• AAI_DST_STATE_CHANGE_NOK: Destination IP Subfield 1: IP address Subfield 2: Any IPV4 IP address
Additional information fields2. Given below are the error codes along with their possible values:
• AAI_M3UA_SM_SPMC_DOWN: This event indicates that the status of an SPMC (Signaling Point Management Cluster) is down.
• AAI_M3UA_SM_LOCAL_AS_DOWN: This event indicates that the state of an M3UA Local AS (Application Server) has changed to DOWN.
• AAI_M3UA_SM_REMOTE_AS_DOWN: This event indicates that the state of an M3UA Remote AS has changed to DOWN.
• AAI_M3UA_ASSOC_DOWN:This event indicates that an M3UA connection between the peers has been lost ordown.
• AAI_M3UA_REMOTE_AS_STATE_INACTIVE:This event indicates that the state of an M3UA Remote AS has changed toINACTIVE.
• AAI_M3UA_ASSOC_INACTIVE <AS Id> :This event indicates that the state of an M3UA association has changed toINACTIVE.
• AAI_M3UA_SM_DEST_UNREACHABLE:This event indicates that a destination is now not reachable.
• AAI_M3UA_CONN_DOWN:This event indicates that an M3UA connection between the peers has been lost.
• AAI_IUA_AS_STATE_DOWN: This event indicates that the state of an IUA Remote AS has changed to DOWN.
• AAI_IUA_AS_STATE_INACTIVE: This event indicates that the state of an IUA Remote AS has changed to INACTIVE.
• AAI_IUA_ASP_STATE_DOWN: This event indicates that the state of an IUA Remote ASP has changed to DOWN.
• AAI_IUA_ASP_STATE_INACTIVE: This event indicates that the state of an IUA Remote ASP has changed to INAC-TIVE.
• AAI_IUA_CONN_DOWN: This event indicates that the state of an IUA connection is DOWN.
• AAI_DST_STATE_CHANGE_NOK: This event indicates that Destination state is not OK, IP is down.

240 DN70397367
LTE iOMS Alarms
Id:0900d8058095396cConfidential
70316 LOCAL OR REMOTE APPLICATION SERVER [PROCESS] DOWN
InstructionsThe above events will be automatically cleared if the corresponding positive indications are received from the stack.
1. AAI_M3UA_SM_SPMC_DOWN: It is used to indicate a change in status of SPMC to SM. The SPMC state is depen-dent on the state of all the Application Servers. The SPMC state is maintained per Local SGP (Signaling gateway process) or the Local SP (Signaling Process) for which the State has changed.This event is cleared when an M3UA_SM_SPMC_UP from M3UA message is received.
2. AAI_M3UA_SM_LOCAL_AS_DOWN: This event indicates a change in the status of the Local AS to the SLM at the remote IPSP (Internet Protocol Signaling point). Local AS refer to the AS whose ASPs are present on the stack entity itself.This event is cleared when an M3UA_SM_LOCAL_AS_ACTIVE message is received from M3UA.
3. AAI_M3UA_SM_REMOTE_AS_DOWN: This event indicates a change in the statu of the Remote Application Server (AS). Remote AS implies that the traffic for these Application Servers is being processed by Remote ASP/IPSPs.This event is cleared when an M3UA_SM_REMOTE_AS_ACTIVE message is received from M3UA.
4. AAI_M3UA_ASSOC_INACTIVE:This event indicates that an M3UA association state has gone INACTIVE. This may happen if either LOCAL ASP state or REMOTE ASP state goes INACTIVE from ACTIVE; even in one of the respective AS. This event shall be raised when associ-ation state goes from ACTIVE to INACTIVE. This event is cleared when both LOCAL ASP and REMOTE ASP are not in INACTIVE state simultaneously. And none of them is in DOWN state.
5. AAI_M3UA_ASSOC_DOWN:This event indicates that an M3UA association state has gone DOWN. This may happen if either LOCAL ASP state or REMOTE ASP state goes DOWN even in one of the respective AS. This event shall be raised when association state goes from INACTIVE or ACTIVE to DOWN. This event is cleared when both LOCAL ASP and REMOTE ASP are not in DOWN state simultaneously. The association state is DOWN when global state of either LOCAL ASP or REMOTE ASP goes DOWN.
6. AAI_M3UA_SM_DEST_UNREACHABLE: This event is used to indicate a change in reach ability status of peer SP to SM.
7. AAI_M3UA_CONN_DOWN:It is used to indicate change in the connection status between a local SP and remote SP. This event is cleared when an M3UA_SM_CONN_ESTABLISHED message is received from M3UA.
8. AAI_IUA_AS_STATE_DOWN: This event will be cleared when the particular AS becomes ACTIVE again.
9. AAI_IUA_AS_STATE_INACTIVE: This event will be cleared when the particular AS becomes ACTIVE again.
10. AAI_IUA_ASP_STATE_DOWN: This event will be cleared when the particular ASP becomes ACTIVE again.
DN70397367 241
LTE iOMS Alarms 70316 LOCAL OR REMOTE APPLICATION SERVER[PROCESS] DOWN
Id:0900d8058095396cConfidential
11. AAI_IUA_ASP_STATE_INACTIVE: This event will be cleared when the particular ASP becomes ACTIVE again.
12. AAI_IUA_CONN_DOWN: This event will be cleared when the particular connection is re-established again.
13. AAI_DST_STATE_CHANGE_NOK: This event will be cleared whenever positive des-tination status indication is received and remote IP is accessible.
14. AAI_M3UA_REMOTE_AS_STATE_INACTIVE:This event indicates a change in the status of the Remote Application Server (AS) to INACTIVE. Remote AS implies that the traffic for these Application Servers is being processed by Remote ASP/IPSPs. This event is cleared when an M3UA_SM_REMOTE_AS_ACTIVE event is received from M3UA.
ClearingThe alarm will be automatically cleared if the corresponding positive indication is received.
Testing InstructionsDo not test the alarm as its testing requires special software.
242 DN70397367
LTE iOMS Alarms
Id:0900d80580953a4dConfidential
70317 SIGNALING GATEWAY SS7 NIF CONFIGURA-TION ERROR
130 70317 SIGNALING GATEWAY SS7 NIF CON-FIGURATION ERRORProbable cause: Configuration or Customizing Error
Event type: Processing error
Default severity: Major
MeaningThis alarm indicates configuration error in Signaling Gateway (SGW) Signaling System 7 (SS7), and Nodal Internetworking Functionality (NIF).
SGW can not handle the traffic that is coming from other nodes and will fail in sending traffic to other nodes.
Identifying additional information fields1. Given below are the error codes along with their possible values:
• 4 : AAI_M3UA_DF_MAX_DPC_EXCEEDED • 25 : AAI_ESGW_REGISTRATION_FAILURE
InstructionsBased on the possible error codes displayed in the Application Additional Info field, follow the procedure associated with each error code:
AAI_M3UA_DF_MAX_DPC_EXCEEDED: Since the operator is trying to add more PCs than the allowed limit, operator should check whether the support for the number of PCs which the operator is trying to add is provided in the SGW solution or not. The maximum number of DPC currently supported in the SGW solution are 284. If the DPCs configured are within this limit, then it indicates a software bug.
AAI_ESGW_REGISTRATION_FAILURE: The operator should verify the configuration at M3UA layer, and check whether the Self PC and NA (Network Appearance) are configured at M3UA layer.
ClearingThe alarms will be cleared automatically by the Alarm Management System once the faulty Managed Object (MO) is restarted. The alarm will be raised again if the configu-ration hasn't been corrected as per the instructions.
Testing InstructionsDo not test this alarm as its testing requires special software.

DN70397367 243
LTE iOMS Alarms 70320 SCCP SIGNALING POINT INACCESSIBLE
Id:0900d805809538d4Confidential
131 70320 SCCP SIGNALING POINT INACCESSI-BLEProbable cause: Communication Protocol Error
Event type: Communications
Default severity: Major
MeaningThe alarm indicates that a signaling point (SP), configured at SGW/SIGTRAN SCCP (Signaling Gateway/SIGTRAN SCCP(Signaling Connection Control Part)) has become inaccessible. Identifying Application Additional Information field identifies the specific point code.
Since the signaling point is reported as inaccessible it can not handle traffic and hence no data can be sent to it.
Identifying additional information fields1. Point code.
Inaccessible point code value.
Possible values are in the following range: 1-16777215 (3 bytes)
InstructionsSP is inaccessible at SCCP only when it receives a pause indication from MTP3/M3UA (Message Transfer Part 3/ MTP Level 3 User Adaptation) layer. When MTP/M3UA detect the Point Code accessibility, they again send a resume indication and the state of the PC transitions to accessible.
ClearingThe alarm will be cleared by SCCP SLM (SGW/SIGTRAN Layer Manager) whenever SCCP stack sends an SP_ACCESSIBLE indication to SCCP SLM.
Testing InstructionsDo not test the alarm as its testing requires special software.

244 DN70397367
LTE iOMS Alarms
Id:0900d805809538cfConfidential
70321 SIGNALING MESSAGE DROPPED
132 70321 SIGNALING MESSAGE DROPPEDProbable cause: Invalid message received
Event type: Communications
Default severity: Major
MeaningThis alarm indicates that neighbor information frame (NIF) protocol is not able to suc-cessfully process the message received, and it cannot transfer the same to the user/net-work as the case may be.
Message is not delivered to its intended recipient.
Identifying additional information fields
1. Protocol layer: Error Description, Additional informationProtocol layer: Protocol layer provides information about which stack has raised this alarm. Possible values are NIF layer.
Error Description: Error Description indicates the reason for message dropped.
Possible Error Descriptions for NIF layer: • NIF_PC_NOT_REACHABLE
• NIF_INVALID_SAP_FROM_SCCP
• NIF_DSP_NOT_AVAILABLE • NIF_SEND_TO_DSP_FAILED
• NIF_INVALID_DSP_SIGNAL
• NIF_INVALID_DSP_API_ID
• NIF_INVALID_LINK_ID • NIF_INVALID_DATA_LENGTH
• NIF_DSP_NOT_CONFIGURED
• NIF_NO_CONNECTION_AVAILABLE
Additional information: Additional information to identify the problem.
InstructionsRefer to Identifying Application Additional Information fields for error codes. Given below are the probable faults for the alarm to be raised and the corrective action that needs to be taken.
• NIF_PC_NOT_REACHABLE: Meaning: Signaling message is dropped by the NIF layer, and the message cannot be delivered to the peer node, as the peer node point code is not reachable. Reason: Point Code is inaccessible from NIF layer. Action: Validate peer node for inaccessible point code.
• NIF_INVALID_SAP_FROM_SCCP: Meaning: Signaling message is dropped by the NIF layer, and the message cannot be delivered to the peer node, as an invalid Sap ID is received from SCCP in a message. Reason: Incorrect SCCP user/SCCP configuration. Action: Validate the SCCP user and SCCP configuration.

DN70397367 245
LTE iOMS Alarms 70321 SIGNALING MESSAGE DROPPED
Id:0900d805809538cfConfidential
• NIF_DSP_NOT_AVAILABLE: Meaning: Signaling message is dropped, and the message cannot be delivered to the peer node, as DSP is not available. Reason: DSP is not available to send message to peer node. Action: Validate DSP ID for checking availability.
• NIF_SEND_TO_DSP_FAILED: Meaning: Signaling message is dropped, and the message cannot be delivered to the peer node, as message is not delivered to DSP. Reason: Failure in sending message to DSP. Action: Validate DSP/MTP2 configuration.
• NIF_INVALID_DSP_SIGNAL: Meaning: Signaling message is dropped and cannot be delivered to the peer node, as after sending the message to DSP, DSP has replied with an invalid signal.Reason: DSP is unable to deliver the message to peer node. Action: Not applicable.
• NIF_INVALID_DSP_API_ID: Meaning: Signaling message is dropped, and the message cannot be delivered to the peer node, as an invalid DSP API ID is used. Reason: Failure in sending message to DSP. Action: Not applicable.
• NIF_INVALID_LINK_ID: Meaning: Signaling message is dropped, and the message cannot be delivered to the peer node, as an invalid link ID is used. Reason: Incorrect configuration at MTP2 convergence layer. Action: Validate configuration at MTP2 convergence layer.
• NIF_INVALID_DATA_LENGTH: Meaning: Signaling message is dropped, and the message cannot be delivered to the peer node, as data length is invalid in the message. Reason: Failure in sending message to DSP. Action: Not applicable.
• NIF_DSP_NOT_CONFIGURED: Meaning: Signaling message is dropped, and the message cannot be delivered to the peer node, as DSP is not configured. Reason: Incorrect configuration at MTP2 convergence layer. Action: Validate configuration at MTP2 convergence layer.
• NIF_NO_CONNECTION_AVAILABLE: Meaning: Signaling message is dropped, and the message cannot be delivered to the peer node, as no connection is available to other SS7 or SCCP processes.Reason: Connection to other SS7 or SCCP processes is not available. Action: Not applicable.
ClearingThe system automatically clears the alarm after its time to live has expired.
Testing instructionsDo not test this alarm, as its testing requires special software.

246 DN70397367
LTE iOMS Alarms
Id:0900d805809538d3Confidential
70322 SCCP USER OUT OF SERVICE
133 70322 SCCP USER OUT OF SERVICEProbable cause: Application Subsystem Failure
Event type: Processing error
Default severity: Major
MeaningThis alarm indicates the status of a subsystem, configured at SGW/SIGTRAN SCCP (Signaling Gateway/SIGTRAN Signaling Connection Control Part) and identified by the subsystem number in the alarm, is out of service or unavailable.
The affected subsystem that is referred by the subsystem number in the alarm, can no longer receive or send messages.
Identifying additional information fields1. Subsystem Number.
Subsystem Number (SSN) or user which is in out of service state.
Possible values: 1-255
InstructionsOperator should try to find the reason for the subsystem to be out of service.
The alarm is possibly raised for the following main reasons:
a) user is un-registeredb) Node is down and not accessiblec) N_STATE request from the user for out of service
1. Check the /tmp/SCCPSGU-1-0-1/sgwsccplog.log file (if alarm is raised in CLA-0 node) and /tmp/sgwss7log.log file for any unregistration messages from user or N_STATE request with out of service.
For example:
If subsystem number 7, on point code 2011 goes down, then the following message is seen in the sccplmlog.log file:
SCCP::SCMG: SSN 7 on pc 2011 nw 1 goes down
ClearingThis alarm will be cleared whenever the SCCP stack sends the SCCP_USER_IN_SERVICE indication to SCCP SLM (SGW Layer Manager).
Testing InstructionsDo not test this alarm as its testing requires special software.

DN70397367 247
LTE iOMS Alarms 70323 SIGNALING POINT CONGESTED
Id:0900d8058095396dConfidential
134 70323 SIGNALING POINT CONGESTEDProbable cause: Congestion
Event type: Quality of service
Default severity: Major
MeaningThis alarm indicates that a signaling point (SP), configured at the network node has become congested. Point Code parameter of the Additional information appearing in Identifying Application Additional Information (IAAI) field tells which point code is con-gested.
No traffic can be sent to the point code that is congested.
Identifying additional information fields1. Protocol layer: Additional information.
Protocol layer: This indicates which stack has raised this alarm. Possible values are NIF layer and SCCP layer.
Additional information: Additional information to identify the issue.
Possible information for NIF protocol layer:
SapId=<value>, NetworkApperanceId=<value>, Pointcode=<value>, CongestionLevel=<Value>
Possible information for SCCP protocol layer:
Pointcode=<value>
InstructionsWhen traffic at a higher rate is sent to a particular point code from the peer node it handles, that point code becomes congested.
ClearingControl the traffic from the peer node to remove the congestion level.
Testing InstructionsDo not test this alarm as its testing requires special software.
248 DN70397367
LTE iOMS Alarms
Id:0900d805809538f1Confidential
70324 MESSAGE TRANSFER PART 3 POINT CODE CONGESTED
135 70324 MESSAGE TRANSFER PART 3 POINT CODE CONGESTEDProbable cause: SS7 Protocol Failure
Event type: Communications
Default severity: Major
MeaningThis alarm indicates that a signalling point that is configured at SGW (Signalling Gateway) SS7 (Signalling System 7), and identified by the point code parameter in the alarm, has become congested.
Congestion causes the MTP3 link(s) to go down which makes the point code inaccessi-ble. Due to this the traffic coming from the remote node cannot be handled.
Identifying additional information fieldsGiven below is the value range for a congested point code :
1. Congested point code value range: 1-16777215 (3 bytes)
Additional information fields2. Point Code type. Following are the two types of point codes:
• AAI_MTP3_EVENT_PC_CONGESTED • AAI_MTP3_EVENT_DPC_CONGESTED
InstructionsGiven below are the point code types along with their corrective actions:
AAI_MTP3_EVENT_PC_CONGESTED: Operator should reduce traffic or introduce additional links towards the OPC to reduce congestion.
AAI_MTP3_EVENT_DPC_CONGESTED: Operator should reduce traffic or introduce additional links towards the DPC to reduce congestion.
Restarting the reporting unit may not necessarily solve the problem every time. And doing so will result in complete outage and operator may incur revenue loss.
The congested status of a remote node can persist for a long or short duration and in such situations message loss is very common. So it is the responsibility of the operator to clear this alarm after confirming that congestion at remote node is over.
ClearingThe alarms is cleared automatically by restarting service using the SCLI command given below:
# fsclishset config-mode onset has restart managed-object /SS7SGUset config-mode off
Testing InstructionsDo not test this alarmas its testing requires special software.

DN70397367 249
LTE iOMS Alarms 70325 INVALID MESSAGE RECEIVED BY MESSAGETRANSFER PART 3
Id:0900d805809538f4Confidential
136 70325 INVALID MESSAGE RECEIVED BY MESSAGE TRANSFER PART 3Probable cause: Invalid MSU received
Event type: Communications
Default severity: Major
MeaningThis alarm indicates that Signalling Gateway (SGW) has received an invalid message from the network and the Peer is not behaving as expected. There may also be some configuration/interoperability issues at the Peer node or SGW node.
Message will not be delivered to the correct node due to an error in the message.
Identifying additional information fieldsGiven below are the various error codes along with their possible values:
• 977 AAI_EMTP3_UNEXP_SLTA_RECV • 972 AAI_EMTP3_SLTC_MSG_FOR_REM_DPC • 778 AAI_EMTP3_CONG_LEVEL_OUT_OF_RANGE • 799 AAI_EMTP3_INVALID_HEADING_CODE • 1050 AAI_EMTP3_TFC_RECIEVED_WITHOUT_CONG_PRIORITY • 1051 AAI_EMTP3_TFC_NOT_SUPPORTED_IN_INTERNATIONAL • 1052 AAI_EMTP3_INVALID_HEAD_CODE_FOR_NM_MESG • 782 AAI_EMTP3_INVALID_OPC • 781 AAI_EMTP3_INVALID_DPC • 785 AAI_EMTP3_INVALID_POINT_CODE • 798 AAI_EMTP3_INVALID_NW_IND • 904 AAI_EMTP3_INVALID_LINKSET_ID • 905 AAI_EMTP3_INVALID_ROUTE_ID • 783 AAI_EMTP3_INVALID_SIO
InstructionsThe operator should check whether there are any interoperability issues, or there is a configuration mismatch between the SGW entity and the peer nodes. Given below are the error codes along with their description: AAI_EMTP3_UNEXP_SLTA_RECV: This error can arise if the Signalling Link Test Message(SLTM) /Signalling Link Test Acknowledgement (SLTA) is enabled and an SLTA message is received before sending an SLTM. This error occurs if SS7 links are not configured properly. The operator must check the link parameters at MTP2 level and MTP3 level .
AAI_EMTP3_SLTC_MSG_FOR_REM_DPC:This message is received if an automatic Link Test Message is not enabled. The message triggers a signaling link test message to be carried out.
AAI_EMTP3_CONG_LEVEL_OUT_OF_RANGE: This error indicates that the congestion level is invalid in the received message. Operator must check the remote peer's sanity.

250 DN70397367
LTE iOMS Alarms
Id:0900d805809538f4Confidential
70325 INVALID MESSAGE RECEIVED BY MESSAGE TRANSFER PART 3
AAI_EMTP3_INVALID_HEADING_CODE: This error indicates that the heading code is invalid in the received message. Operator must check the remote peer's sanity.
AAI_EMTP3_TFC_RECIEVED_WITHOUT_CONG_PRIORITY:This error indicates that the Transfer Control message received from the peer is missing congestion priority. Operator must check the remote peer's sanity.
AAI_EMTP3_TFC_NOT_SUPPORTED_IN_INTERNATIONAL: This error indicates that the transfer controlled message is received when SGW is con-figured with International standard and the peer node is configured with National stan-dard. Operator must check the remote peer's sanity.
AAI_EMTP3_INVALID_HEAD_CODE_FOR_NM_MESG: This error indicates that the heading code is invalid in the received MTP3 Network Man-agement Message. Operator must check the remote peer's sanity.
AAI_ EMTP3_INVALID_OPC/ AAI_EMTP3_INVALID_DPC: This error indicates that the Pointcode in the received message is invalid. Operator must check the configuration of SGW and the peer. This can be due to a mismatch in the pointcode between SGW and the peer (for example - RAN pointcode).
AAI_EMTP3_INVALID_POINT_CODE: This error indicates that the pointcode in the message is in an invalid format. Operator needs to check the standard (ITU,ANSI etc) configured on the peer and correct it accordingly.
AAI_EMTP3_INVALID_NW_IND: This error code is generated due to erroneous network indicators configured between two nodes. Operator must check the configuration at MTP3 level of self and peer nodes.
AAI_EMTP3_INVALID_LINKSET_ID: This error code is generated due to erroneous Linkset id being configured between two nodes. Operator must check the configuration at MTP3 level of self and the peer nodes.
AAI_EMTP3_INVALID_ROUTE_ID:
This error code is generated due to erroneous routeset id being configured between two nodes. Operator must check the configuration at MTP3 level of self and the peer nodes.
AAI_EMTP3_INVALID_SIO: This error code is generated due to erroneous SIO parameters being configured between two nodes. Operator must check the configuration at MTP3 level of self and the peer nodes.
The above mentioned events are raised if the peer is misbehaving for various reasons. It's the responsibility of the operator to clear these events after ensuring that the remote peer is properly configured and that there are no further issues in the network.
ClearingThe alarm is cleared automatically by restarting the service using the following SCLI command:
# fsclishset config-mode onset has restart managed-object /SS7SGU

DN70397367 251
LTE iOMS Alarms 70325 INVALID MESSAGE RECEIVED BY MESSAGETRANSFER PART 3
Id:0900d805809538f4Confidential
set config-mode off
Testing InstructionsDo not test this alarm as its testing requires special software.

252 DN70397367
LTE iOMS Alarms
Id:0900d8058095391aConfidential
70326 SIGNALING SYSTEM 7 CONNECTION ER-ROR
137 70326 SIGNALING SYSTEM 7 CONNECTION ERRORProbable cause: SS7 Protocol Failure
Event type: Communications
Default severity: Major
MeaningThis alarm indicates that the status of a signaling link, configured between SGW (Sig-nalling Gateway) Self PC (Point Code) and SS7 RAN which is identified by the log_link_id parameter in the alarm, has changed and the current state of the link is unavailable. In case of a Routeset, this alarm indicates that the status of a signaling route, configured between SGW and an SS7 Destination (For example, RAN PC) which is identified by the route_id parameter in the alarm, has changed and the current state of the signal-ing route is unavailable.
This indicates that either all the links used for the signaling route have become out-of-service or SGW has received a TFP message (Transfer Prohibited message) for a remote PC which is reachable through an adjacent STP (Signalling Transfer Point).
Link is unavailable so it can not handle any traffic coming from other node.
Identifying additional information fields1. Link ID.Possible values are:
1 - 1000
Additional information fields2.link type. Possible values are:
• AAI_MTP3_LINK_DOWN
• AAI_MTP3_ROUTE_DOWN
InstructionsAppropriate instructions are provided below based on the link type:
AAI_MTP3_LINK_DOWN: Operator should take necessary steps to restore the signaling link. The link status parameter provides information regarding the current link status. It also identifies the various sub-states [such as LOCALLY BLOCKED, INHIBITED, REMOTELY BLOCKED] etc which can be used by the operator to find the actual cause of link unavailability.
AAI_MTP3_ROUTE_DOWN: The operator should take a corrective action to make the route available. This could usually require bringing up the links, in case of direct routes. For indirect routes, operator needs to find out why TFP message has been received. It could be due to links going down between adjacent PC and remote PC or between two remote PCs.
Restarting the reporting unit may not necessarily solve the problem every time. Doing so will result in complete outage and operator may incur revenue loss.

DN70397367 253
LTE iOMS Alarms 70326 SIGNALING SYSTEM 7 CONNECTION ER-ROR
Id:0900d8058095391aConfidential
ClearingThe alarm is cleared automatically once the MTP3_EVENT_LINK_AVAILABLE message (for MTP3_LINK_DOWN ) or MTP3_EVENT_ROUTE_AVAILABLE message (for MTP3_ROUTE_DOWN) is received from the stack.
Testing InstructionsDo not test this alarm. Testing this alarm requires special software.

254 DN70397367
LTE iOMS Alarms
Id:0900d8058095392eConfidential
70327 MESSAGE TRANSFER PART 3 POINTCODE INACCESSIBLE
138 70327 MESSAGE TRANSFER PART 3 POINT-CODE INACCESSIBLEProbable cause: SS7 Protocol Failure
Event type: Communications
Default severity: Major
MeaningThis alarm indicates a status change in signaling point code (PC) either for self or for remote.If the point code reported is self, then this alarm indicates that a signaling point code configured for signaling gateway, at mtp3 stack, has become inaccessible and isolated from the network. This happens only if none of the point codes (adjacent or remote) con-figured as Message Transfer Part 3 (MTP3) destinations, are reachable through this particular Self PC, and all the links defined from this Self PC are in an out-of-service state.If the point code reported is remote, then this alarm indicates that a Signaling System 7 (SS7) Destination PC (For example, RAN PC) which is identified by the pointcode in the alarm, has become inaccessible and the SS7 Destination PC can no longer handle the signaling traffic.
Since the signaling point is reported as inaccessible it can not handle traffic.
Identifying additional information fields1. Point Code. Possible values are:
1-16777215 (3 bytes)
Additional information fields2. Point Code type. Possible values are:
• AAI_MTP3_EVENT_PC_INACCESSIBLE
• AAI_MTP3_EVENT_DPC_INACCESSIBLE
InstructionsAppropriate instructions are provided below based on the alarm event:
AAI_MTP3_EVENT_PC_INACCESSIBLE:
In case of self point code the operator should bring up the links between the self node and remote node which in turn would initiate the transition of self PC becoming acces-sible.
AAI_MTP3_EVENT_DPC_INACCESSIBLE:
In case of remote point code operator must make the Destination PC accessible.
The Destination PC inaccessibility could be due to link unavailability, Linkset unavailabil-ity or route unavailability. Operator could take corrective measures to make the Desti-nation PC accessible.
Restarting the reporting unit may not necessarily solve the problem every time and doing so will result in complete outage and operator may incur revenue loss.

DN70397367 255
LTE iOMS Alarms 70327 MESSAGE TRANSFER PART 3 POINTCODEINACCESSIBLE
Id:0900d8058095392eConfidential
ClearingThe alarm will be cleared automatically when Layer Manager recieves an MTP3_EVENT_PC_ACCESSIBLE indication from the stack.
Testing InstructionsDo not test this alarm. Testing this alarm requires special software.

256 DN70397367
LTE iOMS Alarms
Id:0900d8058095392dConfidential
70328 SWITCH CONFIGURATION OUT OF SYNC
139 70328 SWITCH CONFIGURATION OUT OF SYNCProbable cause: Connection establishment error
Event type: Communications
Default severity: Major
MeaningSwitch Manager is unable to configure the switch.
Switch may have a different configuration than what is configured in the Configuration Directory. If the alarm doesn't clear soon the user may have to restart either the Switch Manager process in case of a software fault, or the switch itself in case of a hardware fault. Internal network connectivity problem from the active Switch Manager node to the switch management interface may also be the root cause for the alarm being raised. In that case it is good to verify that the used network configurations are not blocking access to the switch management interface.
Additional information fieldsSwitch type.
Last response time.
Instructions
1. Restart the Switch Manager by executing the following SCLI command:set has restart managed-object /SwitchManager
2. Verify from the used network configuration that nothing is blocking the access from the Switch Manager to the switch management interface.
3. Restart the switch by following the hardware platform specific instructions.
ClearingDo not clear the alarm. The system clears the alarm automatically when the fault has been corrected.
Testing InstructionsExact instructions are specific to the switch type . But in general, if the switch is config-ured through specific management interface that is exposed via an IP address, following testing instructions can be used:
1. Create blackhole route to block the traffic from Switch Manager host to the switch management interface. An alarm is raised after a short period when the Switch Manager notices that the switch is not giving back any response. You can check if the alarm is raised or not by executing the following SCLI command: show alarm active filter-by specific-problem 70328
2. To clear the alarm remove the blackhole route created in step 1.The alarm is cleared after a short period when Switch Manager is able to resync with the switch. To check if the alarm is cleared or not execute the following SCLI command:show alarm active filter-by specific-problem 70328

DN70397367 257
LTE iOMS Alarms 70329 DIGITAL SIGNAL PROCESSOR FAILURE
Id:0900d805809538f3Confidential
140 70329 DIGITAL SIGNAL PROCESSOR FAILUREProbable cause: Underlying resource unavailable
Event type: Processing error
Default severity: Critical
MeaningA digital signal processing core is found to be faulty for the following possible reasons:a) The core is crashed.b) The connection to the core is lost.c) An internal DSP (Digital Signal Processor) non-fatal error occurred.d) An internal DSP fatal error occurred.e) The core did not startup within the specified time after being unlocked. f) A general API (Application Programming Interface) error is returned.
A DSP CPU is found faulty in case any of its cores is found to be faulty.
The application image which is running in the core might be faulty or stuck. In practice this means that the core/CPU might no longer be functioning.
Additional information fieldsThe field failureType can contain one of the following values:
CoreCrashed: The Digital Signal Processor core is crashed.
ConnectionLost: The connection between the LMP and the Digital Signal Processor core is lost.
InternalDSPError: Some internal error related to the internal interfaces is detected.
InternalDSPFatalError: Some internal fatal error related to the internal interfaces is detected.
StartupFailed: The core did not startup within the specified timeout after being unlocked.
FaultyCores: The cpu contains some faulty cores.
GeneralAPIError: Some of the used interfaces to initiate an operation to the Digital Signal Processor core has failed.
InstructionsThe raising of this alarm indicates that the digital signal processor device is no longer functioning properly. As a recovery action, the proxy process in high availability services will try to reset the faulty core. If the core becomes functional then this alarm will be auto-matically cleared.
ClearingThe alarm is automatically cleared by the DSP high availability services proxy process when the core is working again.

258 DN70397367
LTE iOMS Alarms
Id:0900d805809538f3Confidential
70329 DIGITAL SIGNAL PROCESSOR FAILURE
Testing InstructionsPreconditions:
• An ATCA environment with ADSP blade installed is commissioned and up and running.
• /DMP, /DSPMgr and /DSPHasProxy Recovery Groups are running.
Execution Scenario:
1. Use the following command to change the booting-mode of one of the DSP devices:fsclish -c "set dsp config boot-policy image <a valid image name> param <a valid param file> mode eth device <DSP device node name>
2. Use the command given below to lock/unlock the changed device. After the timeout which is specified in dspproxy startup script elapses, then the alarm will be raised for all the cores in the device in addition to an alarm for the device itself.fsclish -c "set dsp has-state lock device <DSP device node name>"fsclish -c "set dsp has-state unlock device <DSP device node name>"

DN70397367 259
LTE iOMS Alarms 70330 DATABASE SYNCHRONIZATION FAILURE
Id:0900d80580953934Confidential
141 70330 DATABASE SYNCHRONIZATION FAILUREProbable cause: Communication Subsystem Failure
Event type: Communications
Default severity: Warning
MeaningThe synchronization between active and standby database is failing. This can be due to a temporary overload situation caused by high application load, a network related problem or due to an outage on one of the database nodes. There are three different levels of synchronization loss. The warning severity will be generated when the repli-cation lags very slightly behind the active instance. The severity of the alarm is minor for a short break and critical for a longer time of break.
A warning alarm is reached already after 5 seconds delay to give an early indication when the problem appears. The minor alarm is raised if the standby instance is only a short period of time behind the active instance. In this OutOfSync situation a forced swi-tchover to the standby instance typically means only very recent changes are lost. The critical alarm is raised if the failure continues for a longer period of time to indicate that the standby does not have any valid database content. A switchover in such a situ-ation would make the standby (if working) cleanup any leftovers from the earlier local standby copy and start with an empty database. Note that a minor alarm might just be, but does not have to be, the initial indication of a bigger problem in the network element which will soon lead to raising the severity of the alarm to critical.
If the alarm is raised, it indicates that the standby database is not in sync with the active database. This may lead to degraded redundancy of the system which is also shown via the persistent states and resource states of the database watchdog and resource con-troller. As a consequence of the alarm, the system tries to re-establish the database syn-chronization.
The following severities are supported by this alarm:
• Warning: database synchronization weakens for more than 5 seconds, special observation activated.
• Minor: fsdbInSyncLimit (value from Configuration Directory) reached, standby database is OutOfSync, synchronization repair mechanisms are activated.
• Critical: fsdbAsyncRepStandaloneLimit (value from Configuration Direc-tory) reached, standby database is unavailable, database recovery (from scratch) is activated.
In case of the minor alarm, a short break, the re-synchronization of the standby can be done on the available data and the alarm can disappear very quickly. In this case only the Postgres Server is restarted without a copy of the DB from the active side. In the critical case, it requires some longer time, the standby instance is restarted from scratch with the initial copy of the DB from the active side.
Additional information fields1. Time stamp of the synchronization loss

260 DN70397367
LTE iOMS Alarms
Id:0900d80580953934Confidential
70330 DATABASE SYNCHRONIZATION FAILURE
2. Current value of fsdbInSyncLimit (default is 60 seconds)
3. Current value fsdbAsyncRepStandaloneLimit (default is 300 seconds)
InstructionsThe following diagnosis command must be invoked by the operator in order to gather some diagnostics data for subsequent investigation on the reason of the alarm.
/opt/nokiasiemens/SS_DBHAforPostgres/tools/fsdbdiag.sh
ClearingThe alarm will be cleared automatically by the postgres watchdog as soon as the failure is corrected and the synchronization is established.
Testing InstructionsThe following placeholders must be replaced by the values for the application:
• <dbname> = name of the application DB-database • <RG> = Recovery Group name of the postgres watchdog for the DB-database appli-
cation • <RU> = Recovery Unit name of the postgres watchdog for the DB-database applica-
tion
g Instructions are performed using SCLI commands (Structured Command Line Inter-face). You can enter the SCLI shell by typing the fsclish command.
1. Get the Configuration Directory settings for the application DB-database by execut-ing the following command:show config fsClusterId=ClusterRoot fsFragmentId=DB fsdbName=<dbname>For example: show config fsClusterId=ClusterRoot fsFragmentId=DB fsdbName=DBTestHSBPostgres
2. Check which of the limits are set for the application DB->database fsdbInSyncLimit (value unit is seconds) fsdbAsyncRepStandaloneLimit (value unit is seconds).
3. Execute the following command to modify the parameter values. These values are only examples and have to be modified for tests.set config attribute fsClusterId=ClusterRoot fsFragmentId=DB fsdbName=<dbname> attribute-list fsdbInSyncLimit 10set config attribute fsClusterId=ClusterRoot fsFragmentId=DB fsdbName=<dbname> attribute-list fsdbAsyncRepStandaloneLimit 50
4. Unlock the postgres watchdog RG and RU on both nodes by executing the following command:set has unlock managed-object /<RG>set has unlock managed-object /<RU>For example:set has unlock managed-object /CLA-0/FSTestPostgresHSBServer
g <RG> and <RU> names are application specific.
DN70397367 261
LTE iOMS Alarms 70330 DATABASE SYNCHRONIZATION FAILURE
Id:0900d80580953934Confidential
5. To raise the alarm follow the steps given below:5.1 Stop the wal sender on active database (kill -9 <pid> of wal sender)5.2 Insert data into database.
If the SyncChecker is started, after 5 seconds a warning alarm is issued.After fsdbInSyncLimit seconds a minor alarm is issued to indicate that the synchronization is broken and the standby database is restarted. If the restart is successful, the alarm is cleared and the synchronization will work fine again.If the restart is erroneous, after fsdbAsynRepStandaloneLimit seconds, a critical alarm is raised and the database inclusive of the watchdog is restarted from scratch, i.e. the standby is started completely new.The alarm message may not appear immediately!
6. Verify that an alarm for the situation has been raised by executing the following SCLI command: show alarm active filter-by specific-problem 70330
7. Check that the alarm is cleared by executing the following SCLI command:show alarm active filter-by specific-problem 70330

262 DN70397367
LTE iOMS Alarms
Id:0900d805809538d1Confidential
70331 MAX CONNECTIONS TO DATABASE REACHED
142 70331 MAX CONNECTIONS TO DATABASE REACHEDProbable cause: Threshold Crossed
Event type: Quality of service
Default severity: Warning
MeaningThere is an unexpected high number of connections from the database applications. The maximum number of connections is limited by a system defined default value in the database configuration. Applications can connect to the DB as long as the number of connections has not reached the maximum. If the maximum is reached, this alarm is raised with severity warning.
Additionally, a threshold value for the remaining number of free available connections can be set that defines when this alarm should be raised. This alarm is issued if the specific threshold is crossed, and automatically cleared if the number of available free connections is again higher than the threshold value set. The check for the alarm is done for both the single nodes as well as cluster nodes.
The alarm is raised when the expected, normal, sufficient number of free spare connec-tions is not available. If the number of spare connections is getting too low, it might cause problems. For example, in switchover situations where new connections will be established by the newly activated application, while old connections are still being cleaned up. Also, in other situations when applications establish new connections, this might lead to unexpected failures in other parts of the network element.
Additional information fields
1. Actual number of used connections to the DB->database2. Maximal possible number of connections to the DB->database3. Remaining number of connections to the DB->database4. Limit configured in Configuration Directory fsdbConnectionAlarmLimit (default
is n = 10)5. Limit configured in Configuration Directory fsdbConnectionsCheckFreq (default
is 10 seconds)
InstructionsThe operator should inform the application developer and may report this as a possible problem caused by the application. The configuration may have to be changed if the database has been configured with too few connections. There are two possibilities to avoid the situation. First, increase the maximum number of possible connections to the DB. And second, reduce the number of applications that simultaneously are accessing the database.
The Operator should provide the information about which application uses which IP-address. Each database application has to describe which database connections are used and is responsible for connecting / disconnecting to/from the database. Addition-ally, each application must provide a description of what actions are to be performed if

DN70397367 263
LTE iOMS Alarms 70331 MAX CONNECTIONS TO DATABASEREACHED
Id:0900d805809538d1Confidential
this alarm occurs. This information should be stored in a text field in the Configuration Directory.
The limit can be increased by changing the value of the parameter max_connections in the database configuration file /mnt/<dbname>/db_data/postgresql.conf of all the nodes. The database has to be then restarted by restarting the relevant Recovery Group.
Following severity level is supported: Warning: fsdbConnectionsAlarmLimit (value from Configuration Directory) reached, minimum number of connections which must be free, with check frequency fsdbConnectionsCheckFreq (value from Configuration Directory)
The following diagnosis command must be invoked by the operator in order to gather some diagnostics data for subsequent investigation on the reason of the alarm.
/opt/nokiasiemens/SS_DBHAforPostgres/tools/fsdbdiag.sh
ClearingThe alarm is cleared automatically by the postgres watchdog as soon as the number of free connections is greater than the threshold limit set.
Testing InstructionsThe following placeholders must be replaced by the values for the application:
• <dbname> = name of the application DB-database • <RG> = Recovery Group name of the postgres watchdog for the DB-database appli-
cation • <RU> = Recovery Unit name of the postgres watchdog for the DB-database applica-
tion
g Instructions are performed using structured command line interface (SCLI) commands. You can enter the SCLI shell by typing the fsclish command.
1. Get the Configuration Directory settings for the application DB-database by execut-ing the following command:show config fsClusterId=ClusterRoot fsFragmentId=DB fsdbName=<dbname>For example: show config fsClusterId=ClusterRoot fsFragmentId=DB fsdbName=DBTestHSBPostgres
2. Check which limits are set for the application DB->database fsdbConnectionsAlarmLimit (number from 1...n)
3. Check the frequency of how often the limits are checked for the application DB->database fsdbConnectionsCheckFreq (value unit is seconds).
4. Execute the following command to modify the parameter values. These values are only examples and have to be modified for tests.set config attribute fsClusterId=ClusterRoot fsFragmentId=DB fsdbName=<dbname> attribute-list fsdbConnectionsAlarmLimit 5set config attribute fsClusterId=ClusterRoot fsFragmentId=DB fsdbName=<dbname> attribute-list fsdbConnectionsCheckFreq 10
5. Restart the Recovery Group of the database by executing the following command:

264 DN70397367
LTE iOMS Alarms
Id:0900d805809538d1Confidential
70331 MAX CONNECTIONS TO DATABASE REACHED
set has restart managed-object /<RG>For Example:set has restart managed-object /TestPostgresHSBServer
6. Unlock the postgres watchdog RG and RU by executing the following command:set has unlock managed-object /<RG>set has unlock managed-object /<RU>For example:set has unlock managed-object /CLA-0/FSTestPostgresHSBServer
g <RG> and <RU> names are application specific.
7. To raise the alarm, connect dummy user to DB->database, until the alarm limits are reached.
g The Postgres watchdog checks the number of connections every fsdbConnectionsCheckFreq seconds, alarm message may not appear immedi-ately!
8. Verify that an alarm for the situation has been raised by executing the following SCLI command: show alarm active filter-by specific-problem 70331
9. To clear the alarm disconnect the dummy user to DB->database.
g The Postgres watchdog checks the number of connections every fsdbConnectionsCheckFreq seconds, clearing message may not appear immediately!
10. Check that the alarm is cleared by executing the following SCLI command:show alarm active filter-by specific-problem 70331

DN70397367 265
LTE iOMS Alarms 70332 UNABLE TO WRITE TO DISK
Id:0900d8058095391eConfidential
143 70332 UNABLE TO WRITE TO DISKProbable cause: Storage Capacity Problem
Event type: Processing error
Default severity: Major
MeaningThe alarm indicates that the subsystem cannot write the files to the target directory. The most probable reason for this could be the result directory becoming full. Other reasons, though very unlikely, could be permission issues or disk failure.
The subsystem raising the alarm will no longer be able to write new files to the target directory. The effect will vary from one subsystem to another. For example, in case of Performance Management (PM), server is unable to write result file to result directory, this will result in losing performance counter information that is collected during this period.
Additional information fieldsFailure reason
InstructionsIdentify the application raising the alarm using the Application Id field in the alarm. From the SCLI shell, enter the bash shell to gain access to the system.
exampleaccount@CLA-0 [ATCA25] > shell[exampleaccount@CLA-0(ATCA25) /home/exampleaccount]# Now, if the subsystem, (for example the PM9 server), is unable to write result files into the result directory then:
Following shall be done at the management node where the Subsystem (here PM9 server) is active.
1. If the reason in additional info field of the alarm indicates "not enough disk space" issue then:1.1 Check whether the disk is full, by executing the following command at bash shell
prompt:df -h <TARGET DIRECTORY>For example:df -h /var/opt/nokiasiemens/SS_PM9/storage/
1.2 he disk is full, get the list of the files by executing the following command at bash shell:ls -lrt <TARGET DIRECTORY>For example:ls -lrt /var/opt/nokiasiemens/SS_PM9/storage/results
1.3 Create space on the disk by removing some of the old files.2. If the reason in additional info field of the alarm indicates permission issues then:
2.1 Check whether the required permissions are given by executing the following command at bash shell:ls -lrd <TARGET DIRECTORY>For example:ls -lrd /var/opt/nokiasiemens/SS_PM9/storage/result
266 DN70397367
LTE iOMS Alarms
Id:0900d8058095391eConfidential
70332 UNABLE TO WRITE TO DISK
3. If the output does not indicate rwx permission for user _nokfssyspm9, contact the Nokia Siemens Networks Technical Support. A correct output will be displayed as shown below:drwxr-xr-x 8 _nokfssyspm9 _nokfssyspm9 1024 Feb 9 20:17 /var/opt/nokiasiemens/SS_PM9/storage
ClearingThe alarm will be automatically cleared when the faulty subsystem is able to write files again. The alarm will also be cleared upon subsystem restart/switchover and raised again if the problem persists.
Testing InstructionsThe following instructions provide an example of testing the alarmraised by PM subsys-tem in an event of not being able to write result files to PM result directory.
Case 1: To trigger alarm reporting due to insufficient storage space.
1. Fill the target directory with some temporary files, so that no space is left in it by using the following commands at bash shell prompt, in the instructions provided below-1.1 Check the size of the free space available by using the following command:
-df -h <Target Directory>for example: df -h /var/opt/nokiasiemens/SS_PM9/storage/
1.2 Fill the remaining space using following commands:-cd <target Directory>dd if=/dev/zero of=file.out bs=1MB count=<Space Left in MB>for examplecd /var/opt/nokiasiemens/SS_PM9/storage/dd if=/dev/zero of=file.out bs=1MB count=<Space Left in MB>
2. Follow the instructions below to write a file into the target directory and check if the alarm is raised:2.1 Enter the SCLI shell using the following command:
[exampleaccount@CLA-0(vEcds01)/home/exampleaccount]# fsclishexampleaccount@CLA-0 [vEcds01] >
2.2 Make the subsystem write the file into the target directory and check if the alarm is raised.
2.3 Create a measurement job with say 5 minute granularity and enable it by using the following SCLI commands:add stats m-job name test omes 2002 granularity 300 continuousset stats m-job id 1 enabled
2.4 When the PM server attempts to write the result files at the end of granularity period, check if the alarm is raised by using the following SCLI command:show alarm active filter-by specific-problem <specific problem>
3. Upon deletion of some result files, Server will succeed in writingsubsequent result files. Check whether the alarm gets cleared by usingthe following SCLI command:show alarm active filter-by specific-problem <specific problem>
Case 2: Alarm is raised because required permissions are not given.

DN70397367 267
LTE iOMS Alarms 70332 UNABLE TO WRITE TO DISK
Id:0900d8058095391eConfidential
1. From the bash shell , change the permissions of target directory (for example /var/opt/nokiasiemens/SS_PM9/storage/results) to read-only for the owner.
2. Enter the SCLI shell using the following command:[exampleaccount@CLA-0(vEcds01)/home/exampleaccount]# fsclishexampleaccount@CLA-0 [vEcds01] >
3. Make the subsystem write file into the target directory and check if the alarm is raised3.1 Create a measurement job with say 5 minute granularity and enable it using fol-
lowing SCLI commands:add stats m-job name test omes 2002 granularity 300 continuousset stats m-job id 1 enabled
4. When the PM server attempts to write the result files at the end of the granularity period, check if the alarm is raised using the following SCLIcommand:show alarm active filter-by specific-problem <specific problem>
5. When required permissions are given, Server will succeed in writing subsequent result files. Check whether the alarm gets cleared by usingthe following SCLI command:show alarm active filter-by specific-problem <specific problem>

268 DN70397367
LTE iOMS Alarms
Id:0900d80580953955Confidential
70333 SIGNALING GATEWAY IUA NIF ERROR
144 70333 SIGNALING GATEWAY IUA NIF ERRORProbable cause: Connection establishment error
Event type: Communications
Default severity: Major
MeaningThe alarm indicates major events arising from IUA NIF (ISDN Q.921User Application Layer Nodal Inter working Function) component of the SGW stack (Signaling gateway) which would require operator's attention.
The effect of the alarm depends upon the error codes received by the stack and can be as follows:
• IAAI_IUANIF_SEND_TO_DSP_FAILED: Data can not be sent to DSP which is identified by the DSP Id in Identifying Applica-tion Additional Info.
• IAAI_IUANIF_INVALID_DSP_SIGNAL:SGW will ignore the message.
• IAAI_IUANIF_INVALID_DSP_SIGNAL:SGW will ignore the message.
• IAAI_IUANIF_DSP_NOT_AVAILABLESGW will not be able to send any traffic to DSP that is identified by the DSP Id in Identifying Application Additional Info.
• IAAI_IUANIF_INVALID_DSP_API_IDSGW will ignore the message from the DSP with invalid Q.921 primitive id. SGW supports only DL_EST_IN, DL_EST_CO, DL_REL_IN, DL_REL_CO, DL_DA_IN, and DL_U_DA_IN Q.921 Primitives from DSP
• IAAI_IUANIF_INVALID_LINK_IDEffect depends upon the Q.921 primitive and can be as follows:In case of Establish Indication, Establish Confirm, Data Indication and Unit Data Indication Q921 primitives, SGW sends Release Request on the link id to DSP. In case of Release Indication or Release Confirm from DSP, SGW ignores the message.
• IAAI_IUANIF_INVALID_SAPIEffect depends upon the Q.921 primitive and the originator of the message:Message from MSS: In case of Establish Request, Data Request and Unit Data Request, SGW sends Release Indication to MSS. In case of Release Request, SGW sends Release Confirm to MSS.Message from DSP: In case of Establish Indication, Establish Confirm, Data Indica-tion and Unit Data Indication, SGW sends Release Request to MSS. In case of Release Indication and Release Confirm, message is ignored by SGW.
• IAAI_IUANIF_INVALID_CESEffect depends upon the Q.921 primitive and can be as follows:In case of Establish Indication, Establish Confirm, Data Indication and Unit Data Indication, SGW sends the Release Request on the link id to the DSP. In case of Release Indication and Release Confirm, SGW ignores the message.
• IAAI_IUANIF_INVALID_TEIEffect depends upon the Q.921 primitive and can be as follows:

DN70397367 269
LTE iOMS Alarms 70333 SIGNALING GATEWAY IUA NIF ERROR
Id:0900d80580953955Confidential
In case of Establish Request, Data Request and Unit Data Request, SGW sends the Release Indication to MSS. In case of Release Request, SGW sends Release Confirm to MSS.
• IAAI_IUANIF_INVALID_INTERFACE_IDEffect depends upon the Q.921 primitive and can be as follows:In case of Establish Request, Data Request and Unit Data Request, SGW sends Release Indication to MSS. In case of Release Request, SGW sends Release Confirm to MSS.
• AAI_IUANIF_DSP_NOT_CONFIGUREDEffect depends upon the Q.921 primitive and can be as follows:In case of Establish Request, Data Request and Unit Data Request, SGW sends Release Indication to MSS. In case of Release Request, SGW sends Release Confirm to MSS.
Identifying additional information fields1. Error code.
Possible values are:
IAAI_IUANIF_SEND_TO_DSP_FAILED:
Indicates that there is a packet drop at SGW because packet could not be delivered to DSP (Digital Signal Processor). This can be either due to LINX connection failure between SGW and DSP, or DSP failure.
IAAI_IUANIF_INVALID_DSP_SIGNAL:
Indicates that there is a packet from DSP with an invalid LINX Signal.
IAAI_IUANIF_DSP_NOT_AVAILABLE:
Indicates that SGW is not able to hunt (linx hunt) DSP.
IAAI_IUANIF_INVALID_DSP_API_ID:
Indicates that there is a Q.921 protocol message from DSP with Q.921 primitive code as invalid.
IAAI_IUANIF_INVALID_LINK_ID
Indicates that there is a packet from DSP with an invalid link id.
IAAI_IUANIF_INVALID_SAPI:
Indicates that there is a packet from DSP or from MSS (Mobile Switching Server) with SAPI (other than 0).
IAAI_IUANIF_INVALID_CES:
Indicates that there is a packet from DSP with an invalid CES (other than 1).
IAAI_IUANIF_INVALID_TEI:
Indicates that there is a packet from MSS with an invalid TEI (Terminal Endpoint Identi-fier) (other than 0).
IAAI_IUANIF_INVALID_INTERFACE_ID:
Indicates that there is a packet from MSS with a non-configured interface id.
IAAI_IUANIF_DSP_NOT_CONFIGURED:
Indicates that the Q.921 packet from MSS can not be send to DSP because DSP is not configured for that link.
2. DSP Id of the affected DSP

270 DN70397367
LTE iOMS Alarms
Id:0900d80580953955Confidential
70333 SIGNALING GATEWAY IUA NIF ERROR
(Optional, if Error code equals to IAAI_IUANIF_SEND_TO_DSP_FAILED, IAAI_IUANIF_INVALID_DSP_SIGNAL, IAAI_IUANIF_DSP_NOT_AVAILABLE, IAAI_IUANIF_INVALID_DSP_API_ID or IAAI_IUANIF_DSP_NOT_CONFIGURED)
DSP Id is an Integer value in the range of 1 - 1000
InstructionsBased on the error code displayed in the Identifying Application Additional Information Fields, corrective actions are given below:
IAAI_IUANIF_SEND_TO_DSP_FAILEDTake corrective measures to make DSP reachable. It requires verification of LINX link and connection to be established from both SGW and DSP.IAAI_IUANIF_INVALID_DSP_SIGNALIdentify the reason for DSP sending an invalid signal and correct the error.IAAI_IUANIF_DSP_NOT_AVAILABLEVerify that LINX connectivity is established between SGW and DSP and the DSP linxname that is configured at SGW, is correct.IAAI_IUANIF_INVALID_DSP_API_IDVerify that the Q.921 primitive which the DSP is sending to SGW, is correct.IAAI_IUANIF_INVALID_LINK_IDVerify that correct link id is configured at DSP.IAAI_IUANIF_INVALID_SAPIVerify that MSS and peer ISDN terminal are sending Q.921 packet with correct SAPI.IAAI_IUANIF_INVALID_CESVerify that MSS and peer ISDN terminal are sending Q.921 packet with correct CES.IAAI_IUANIF_INVALID_TEIVerify that MSS is sending Q.921 packet with correct TEI.IAAI_IUANIF_INVALID_INTERFACE_IDVerify that the Interface Id to Link Id mapping, is configured at IUA-NIF.IAAI_IUANIF_DSP_NOT_CONFIGUREDVerify that the link id is configured on the DSP at SGW.
ClearingAfter correcting the fault, as presented in the Instructions section, clear the alarm using the following SCLI command:set alarm clear alarm-id <alarm id of the alarm>If the alarm id of the alarm is unknown, use the following SCLI command(that requires the full alarm information):set alarm clear-matching-alarms filter-by specific-problem <alarm number> managed-object <managed object of the alarm> application-id <application id of the alarm> identifying-application-additional-info <identifying application additional info of the alarm>
Testing InstructionsDo not test this alarm as its testing requires special software.

DN70397367 271
LTE iOMS Alarms 70334 IUA ASSOCIATION / APPLICATION SERVERSTATE CHANGE
Id:0900d80580953980Confidential
145 70334 IUA ASSOCIATION / APPLICATION SERVER STATE CHANGE Probable cause: Connection establishment error
Event type: Communications
Default severity: Major
MeaningThis alarm is intended to inform the operator about the events received from IUA (ISDN (Integrated Service Digital Network) Q.921 User Application Layer) stack.
The services provided by the entity in question will not be available.
Identifying Application Additional Information fields
• AAI_IUA_AS_STATE_DOWN:IUA Remote AS IdSubfield 1: "AsId:"Subfield 2: (1 - 200)
• AAI_IUA_AS_STATE_INACTIVE:IUA Remote AsIdSubfield 1: "AsId:"Subfield 2: (1 - 200)
• AAI_IUA_ASSOC_STATE_DOWN:IUA Association IdSubfield 1: "AssociationId:"Subfield 2: (1 - 65535)
• AAI_IUA_ASSOC_STATE_INACTIVE:IUA Association IdSubfield 1: "AssociationId:"Subfield 2: (1 - 65535)
• AAI_IUA_CONN_DOWN:IUA Association IdSubfield 1: "AssociationId:"Subfield 2: (1 - 65535)
Application additional information fields1. Error code. Possible values are :
• AAI_IUA_AS_STATE_DOWN: This event indicates that the state of an IUA remote AS has changed to DOWN.
• AAI_IUA_AS_STATE_INACTIVE: This event indicates that the state of an IUA remote AS has changed to INACTIVE.
• AAI_IUA_ASSOC_STATE_DOWN: This event indicates that the state of an IUA asso-ciation has changed to DOWN.
• AAI_IUA_ASSOC_STATE_INACTIVE <Remote AS ID>: This event indicates that the state of an IUA association has changed to INACTIVE.Subfield 1: "RemoteAsId:"Subfield 2: (1 - 200)
• AAI_IUA_CONN_DOWN: This event indicates that the state of an IUA connection is DOWN.

272 DN70397367
LTE iOMS Alarms
Id:0900d80580953980Confidential
70334 IUA ASSOCIATION / APPLICATION SERVER STATE CHANGE
InstructionsBased on the error code displayed in the Identifying Application Additional Information Fields, corrective actions are given below:
• AAI_IUA_AS_STATE_DOWN: This event is cleared when the particular AS becomes ACTIVE again.
• AAI_IUA_AS_STATE_INACTIVE: This event is cleared when the particular AS becomes ACTIVE again.
• AAI_IUA_ASSOC_STATE_DOWN: This event indicates that an IUA association state has gone DOWN. This may happen if the state of the remote ASP goes DOWN even in one of the remote application servers. This event is raised when an association state goes from INACTIVE or ACTIVE to DOWN. The event is cleared when remote ASP goes from DOWN state to INACTIVE state, or when SCTP connection goes DOWN.
• AAI_IUA_ASSOC_STATE_INACTIVE: This event indicates that an IUA association state has gone INACTIVE. This may happen if remote ASP state goes INACTIVE from ACTIVE; even in one of the application servers. This event is raised when an association state goes from ACTIVE to INACTIVE. The event is cleared when remote ASP goes in ACTIVE state.
• AAI_IUA_CONN_DOWN: This event is cleared when the particular connection is re-established again.
ClearingThe alarm is automatically cleared if the corresponding positive indication is received.
Testing InstructionsDo not test this alarm as its testing requires special software.
DN70397367 273
LTE iOMS Alarms 70335 ALARM TYPE PARAMETER HAS BEEN MOD-IFIED
Id:0900d80580953919Confidential
146 70335 ALARM TYPE PARAMETER HAS BEEN MODIFIEDProbable cause: Configuration or Customizing Error
Event type: Processing error
Default severity: Warning
MeaningSome parameters for alarm type have been modified.
The changed parameters affect the processing of the alarms, that belong to the alarm type in question.
Identifying additional information fields
1. Specific problem that identified the modified alarm type.2. The list of the modified parameters and their old / new values in the format:
[new.ds=<>] [new.ack=<>] [new.sou=<>] [new.cd=<>] [new.id=<>] [new.ttl=<>] [new.at=<>] [old.ds=<>] [old.ack=<>] [old.sou=<>] [old.cd=<>] [old.id=<>] [old.ttl=<>] [old.at=<>] where, • ds - default severity • ack - autoacknowledged • sou - switchover (changeover) update • cd - clearing delay • id - informing delay • ttl - time to live • at - alarm text
InstructionsThis is an informative alarm which indicates that an operator has modified some param-eters for an alarm type. The alarm doesn't require any action.
ClearingThe system clears the alarm automatically after its time to live has expired.
Testing instructions1. Modify the autoacknowledged parameter for some alarm type.
2. Observe that an instance of alarm 70335 is raised that contains the new and old values for the autoacknowledged parameter.

274 DN70397367
LTE iOMS Alarms
Id:0900d8058095396eConfidential
70336 ALARM RULE HAS BEEN MODIFIED
147 70336 ALARM RULE HAS BEEN MODIFIEDProbable cause: Configuration or Customizing Error
Event type: Processing error
Default severity: Warning
MeaningAlarm rule set in the system has been modified.
The changed rule affects the processing of the alarms that are under the rule's scope.
Identifying additional information fields
1. Specific problem used in the rule as SP:<>.2. The other rule parameters as the list
<parameter1_abbreviature>:<parameter1_value>[;parameter2_abbreviature>:<parameter2_value> ...].';' is used as a separator.If some rule parameter has been modified then it is present in the list as<parameter1_abbreviature-new>:<parameter1_newvalue><parameter1_abbreviature-old>:<parameter1_oldvalue>
3. The type of operation performed on the rule. Possible values are ADDED, DELETED, UPDATED, ACTIVATED, and DEACTIVATED.
Application additional information fields1. The rule type.
InstructionsThis is an informative alarm which indicates that an operator has modified some alarm rule. The alarm doesn't require any action.
ClearingThe system clears the alarm automatically after its time to live has expired.
Testing instructions
1. Create a new alarm indication prevention rule for some specific problem.2. Observe that an instance of alarm 70336 is raised that contains the data about the
rule created.

DN70397367 275
LTE iOMS Alarms 70337 JUNIPER SWITCH OVER TEMPERATURE
Id:0900d80580953995Confidential
148 70337 JUNIPER SWITCH OVER TEMPERA-TUREProbable cause: High Temperature
Event type: Environmental
Default severity: Major
MeaningThe temperature of the switch has risen beyond acceptable conditions.
The service impact of this alarm depends on the temperature of the switch. In general, the switch increases the speed of the fans when any component exceeds 55 °C. The fans remain at a higher speed until the temperature decreases below the threshold. In this case, there is no service impact. However, if the temperature exceeds 75 °C, the switch transmits a warning and automatically shuts down. This scenario creates a sig-nificant service impact because the shutdown affects additional switches and equip-ment. This alarm is repeated every minute until the temperature is brought down to normal.
Identifying additional information fields
1. agentIP - IP address of the switch2. jnxcontentsContainerIndex - Faulty Unit Index3. jnxcontentsL1Index- Faulty Unit L1 Index4. jnxcontentsL2Index -Faulty Unit L2 Index5. jnxcontentsL3Index -Faulty Unit L3 Index
L1 (jnxContentsL1Index), L2 (jnxContentsL2Index), and L3 (jnxContentsL3Index) indexes are the positions of the components within different levels of the containers. This value is 0 if the position is unavailable or not applicable.
6. jnxOperatingTemp - Operating Temperature
InstructionsTo determine the source of the high temperature, you must physically inspect the switch to check if any fan has failed in the switch.
ClearingThe system clears the alarm automatically once the fault has been corrected.
Testing instructionsDo not test this alarm because the hardware fault is not reproducible without the risk of causing permanent damage to the system.
276 DN70397367
LTE iOMS Alarms
Id:0900d80580953992Confidential
70338 JUNIPER SWITCH FAN FAILURE
149 70338 JUNIPER SWITCH FAN FAILUREProbable cause: Cooling Fan Failure
Event type: Environmental
Default severity: Critical
MeaningFan failure has occurred and fan is not functional.
When only one fan has failed, there is no service impact. The remaining fans increase speed to compensate. However, you must resolve the problem before another fan fails. This alarm is repeated every hour until the fan failure is fixed.
Identifying additional information fields
1. agentIP - The IP address of the switch2. jnxcontentsContainerIndex - Faulty Unit Index3. jnxcontentsL1Index - Faulty Unit L1 Index4. jnxcontentsL2Index - Faulty Unit L2 Index5. jnxcontentsL3Index - Faulty Unit L3 Index
L1 (jnxContentsL1Index), L2 (jnxContentsL2Index), and L3 (jnxContentsL3Index) indexes are the positions of the components within different levels of the containers. This value is 0 if the position is unavailable or not applicable.
6. jnxContentsDescr - Faulty Unit Name
InstructionsTo determine the source of the failure, you must physically inspect the switch, and the fuses. For more information, see the hardware installation guide for Juniper switch model at the following link:
http://www.juniper.net/techpubs/en_US/release-independent/junos/information-prod-ucts/pathway-pages/ex-series/hardware/ex3200-ex4200.html
ClearingThe system clears the alarm automatically once the fault has been corrected.
Testing instructions
1. Switch off the fans selectively, one by one.2. Check that the alarm has been raised, using the alarm management application.3. Turn on the fans again.4. Verify that the alarm has been cleared, using the alarm management application.

DN70397367 277
LTE iOMS Alarms 70339 JUNIPER SWITCH FIELD REPLACEABLEUNIT FAILURE
Id:0900d80580953985Confidential
150 70339 JUNIPER SWITCH FIELD REPLACE-ABLE UNIT FAILUREProbable cause: Equipment Malfunction
Event type: Equipment
Default severity: Critical
MeaningA Field Replaceable Unit (FRU) has failed in the chassis.
FRU is not powering up or is unable to load kernel.
Identifying additional information fields
1. agentIP - The IP address of the switch2. jnxFruContainerIndex - Faulty Unit Index3. jnxFruL1Index - Faulty Unit L1 Index4. jnxFruL2Index - Faulty Unit L2 Index5. jnxFruL3Index - Faulty Unit L3 Index
L1 (jnxFruL1Index), L2 (jnxFruL2Index), and L3 (jnxFruL3Index) indexes are the positions of the components within different levels of the containers. This value is 0 if the position is unavailable or not applicable.
6. jnxFruName - Faulty Unit Name7. jnxFruSlot - Faulty Unit Slot Number8. jnxFruType - Faulty Unit Type
InstructionsFRU replacement may be required.
ClearingThe system clears the alarm automatically once the fault has been corrected.
Testing instructions
1. Spoof the trap by executing the following command:request snmp spoof-trap jnxFruFailed
2. Check that the alarm has been raised.3. Spoof the clearing trap by executing the following command:
request snmp spoof-trap jnxFruOK4. Verify that the alarm has been cleared.
For more information, refer to the following link:
http://juniper.fr/techpubs/en_US/junos9.5/information-products/topic-collections/swcm-dref-basics-services/swcmdref-basics-services-TOC.html

278 DN70397367
LTE iOMS Alarms
Id:0900d80580953984Confidential
70340 JUNIPER SWITCH POWER SUPPLY FAILURE
151 70340 JUNIPER SWITCH POWER SUPPLY FAILUREProbable cause: Power Supply Failure
Event type: Equipment
Default severity: Critical
MeaningPower supply failure can occur from one of the following:
• switch circuit breaker failure • power circuit failure • power outage
When only one of the power supplies has failed, the service impact is minimal. One power supply can provide the necessary power for a fully loaded switch. To determine the source of the failure, you must physically inspect the switch. This alarm is repeated every hour until the power supply is restored.
Identifying additional information fields
1. agentIP - The IP address of the switch2. jnxcontentsContainerIndex - Faulty Unit Index3. jnxcontentsL1Index - Faulty Unit L1 Index4. jnxcontentsL2Index - Faulty Unit L2 Index5. jnxcontentsL3Index - Faulty Unit L3 Index
L1 (jnxcontentsL1Index), L2 (jnxcontentsL2Index), and L3 (jnxcontentsL3Index) indexes are the positions of the components within different levels of the containers. This value is 0 if the position is unavailable or not applicable.
6. jnxContentsDescr - Faulty Unit Name
InstructionsTo determine the source of the failure, you must physically inspect the switch, taking care to check the fuses. See the hardware installation guide for Juniper switch model for more information.
ClearingThe system clears the alarm automatically once the fault has been corrected.
Testing instructions
1. Switch off one of the Power Supply Units (PSUs).2. Check that the alarm has been raised, using the alarm management application.3. Switch on the PSU again to clear the alarm.4. Verify that the alarm has been cleared, using the alarm management application.

DN70397367 279
LTE iOMS Alarms 70341 JUNIPER NEW MASTER IN VIRTUAL ROUT-ER REDUNDANCY PROTOCOL MODE
Id:0900d8058095397cConfidential
152 70341 JUNIPER NEW MASTER IN VIRTUAL ROUTER REDUNDANCY PROTOCOL MODEProbable cause: Local alarm indication
Event type: Communications
Default severity: Warning
MeaningThere is a new switch which has taken up the role of the master in Virtual Router Redun-dancy Protocol (VRRP) configuration mode.
The new Master alarm indicates that the router has transitioned to Master state.
An Owner router is assigned to forward traffic designated for the Virtual Router (VR). If the Owner is forwarding traffic for the VR, it is the Master router for that VR.
One or more prioritized Backup routers (If a Backup router is forwarding traffic for the VR), has replaced the Owner as the Master router for that VR..
Identifying additional information fields
1. agentIP - The IP address of the switch2. jnxvrrpMasterIpAddress - The IP address of the Master Router3. jnxvrrpOperVrId - This object contains the Virtual Router Identifier (VRID)
InstructionsThis is an informative alarm. The Master IP address is the primary IP address of the Master router. This is the IP address listed as the source in VRRP advertisement, last received by this virtual router. This can be used by Network Management System (NMS) as an indication to sync with the new Master and show the switchover/failover to the user. This is just an informative alarm for the operator about this event.
ClearingThe system clears the alarm automatically after its time to live has expired.
Testing instructions
1. Manually switchover from current Master to Backup in a VRRP configuration.2. Check that the alarm has been raised, using the alarm management application.3. Verify that the alarm has been cleared after its time to live has expired, using the
alarm management application.
280 DN70397367
LTE iOMS Alarms
Id:0900d805809539bcConfidential
70342 BLADECENTER: CHASSIS/SYSTEM MAN-AGEMENT FAILURE
153 70342 BLADECENTER: CHASSIS/SYSTEM MANAGEMENT FAILURE Probable cause: Equipment failure
Event type: Equipment
Default severity: Major
MeaningSome hardware component in the Chassis has malfunctioned or has stopped working.
There can be multiple effects of this alarm. For example:
The advanced management module may not be able to determine the management module bay in which it is installed. Therefore, it may use management module bay 1 as the installed bay.
Identifying additional information fields
1. spTrapEvtName - Event code of the Trap . Using this trap, the exact cause of the alarm can be determined. It is a Hexadecimal value (for example: 0x0000006B)
2. spTrapSysUuid - Host System UUID - Using this trap, you can identify the Chassis where the problem occurred. (For example: UUID- 07A3284990D2893F40224195720A145)
3. spTrapSourceId - The exact source where the problem has occurred. It could have the following values depending on the context of the alarm:Audit - A user action log.SERVPROC - The service processor for the advanced management module.
Instructions
1. With the help of the Event code displayed in Identifying Application additional info (spTrapEvtName) of the alarm, find the exact cause from IBM reference documen-tation available at the following site: http://publib.boulder.ibm.com/infocenter/bladectr/documentation/topic/com.ibm.bladecenter.advmgtmod.doc/kp1avAMMMessagesGuide.pdf
2. Perform the actions mentioned in the User Response section of the IBM reference documents.
ClearingIn the IBM Reference documentation, Chapter 2 contains information on mapping of the event codes against the exact cause of the alarm.
For information on clearing the alarm, refer to the Recoverable section of the reference documents. If the Recoverable section says yes, it means that the alarm generated will be automatically cleared. If the Recoverable section says no, the alarm has to be manually cleared using the alarm management application.
Testing instructionsDo not test this alarm because the hardware fault is not reproducible without a risk of permanent damage to the system.

DN70397367 281
LTE iOMS Alarms 70343 BLADECENTER: COOLING DEVICE FAILURE
Id:0900d805809539b8Confidential
154 70343 BLADECENTER: COOLING DEVICE FAILURE Probable cause: Cooling system failure
Event type: Environmental
Default severity: Major
MeaningThe specified fan or blower module is no longer operating.
The hardware component where the fan module is not operating, may stop functioning due to overheating.
Identifying additional information fields
1. spTrapEvtName - Event code of the Trap . Using this trap, the exact cause of the alarm can be determined. It is a Hexadecimal value (for example: 0x0000006B)
2. spTrapSysUuid - Host System UUID - Using this trap, you can identify the Chassis where the problem occurred. (For example: UUID- 07A3284990D2893F40224195720A145)
3. spTrapSourceId - The exact source where the problem has occurred. It could have the following values depending on the context of the alarm:Audit - A user action log.Cool number - A fan or a blower, depending upon the chassis type, indicated by the bay number.SERVPROC - The service processor for the advanced management module.
Instructions
1. With the help of the Event code displayed in Identifying Application additional info (spTrapEvtName) of the alarm, find the exact cause from IBM reference documen-tation available at the following site: http://publib.boulder.ibm.com/infocenter/bladectr/documentation/topic/com.ibm.bladecenter.advmgtmod.doc/kp1avAMMMessagesGuide.pdf
2. Perform the actions mentioned in the User Response section of the IBM reference documents.
ClearingIn the IBM Reference documentation, Chapter 2 contains information on mapping of the event codes against the exact cause of the alarm.
For information on clearing the alarm, refer to the Recoverable section of the reference documents. If the Recoverable section says yes, it means that the alarm generated will be automatically cleared. If the Recoverable section says no, the alarm has to be manually cleared using the alarm management application.
Testing instructionsDo not test this alarm because the hardware fault is not reproducible without a risk of permanent damage to the system.

282 DN70397367
LTE iOMS Alarms
Id:0900d805809539baConfidential
70344 BLADECENTER: STORAGE MODULE FAIL-URE
155 70344 BLADECENTER: STORAGE MODULE FAILURE Probable cause: Equipment failure
Event type: Equipment
Default severity: Major
MeaningOne of the Storage modules has stopped working, or has malfunctioned.
A fault has occurred in the battery backup unit used to back up the cachefor the specified SAS (Serial Attached SCSI) RAID controller module.
Identifying additional information fields
1. spTrapEvtName - Event code of the Trap . Using this trap, the exact cause of the alarm can be determined. It is a Hexadecimal value (for example: 0x0000006B)
2. spTrapSysUuid - Host System UUID - Using this trap, you can identify the Chassis where the problem occurred. (For example: UUID- 07A3284990D2893F40224195720A145)
3. spTrapSourceId - The exact source where the problem has occurred. Given below is the value of the source based on the context of the alarm:Stor_number - A storage module indicated by the bay number.
Instructions
1. With the help of the Event code displayed in Identifying Application additional info (spTrapEvtName) of the alarm, find the exact cause from IBM reference documen-tation available at the following site: http://publib.boulder.ibm.com/infocenter/bladectr/documentation/topic/com.ibm.bladecenter.advmgtmod.doc/kp1avAMMMessagesGuide.pdf
2. Perform the actions mentioned in the User Response section of the IBM reference documents.
ClearingIn the IBM Reference documentation, Chapter 2 contains information on mapping of the event codes against the exact cause of the alarm.
For information on clearing the alarm, refer to the Recoverable section of the reference documents. If the Recoverable section says yes, it means that the alarm generated will be automatically cleared. If the Recoverable section says no, the alarm has to be manually cleared using the alarm management application.
Testing instructionsDo not test this alarm because the hardware fault is not reproducible without a risk of permanent damage to the system.
DN70397367 283
LTE iOMS Alarms 70345 BLADECENTER: BLADE FAILURE
Id:0900d805809539beConfidential
156 70345 BLADECENTER: BLADE FAILURE Probable cause: Equipment failure
Event type: Equipment
Default severity: Major
MeaningOne of the Blades has malfunctioned.
The system's boot process for the specified blade server, failed before the operating system was loaded.
Identifying additional information fields
1. spTrapEvtName - Event code of the Trap . Using this trap, the exact cause of the alarm can be determined. It is a Hexadecimal value (for example: 0x0000006B)
2. spTrapSysUuid - Host System UUID - Using this trap, you can identify the Chassis where the problem occurred. (For example: UUID- 07A3284990D2893F40224195720A145)
3. spTrapSourceId - The exact source where the problem has occurred. It could have the following value depending on the context of the alarm:Blade number - The blade server indicated by the bay number.
Instructions
1. With the help of the Event code displayed in Identifying Application additional info (spTrapEvtName) of the alarm, find the exact cause from IBM reference documen-tation available at the following site: http://publib.boulder.ibm.com/infocenter/bladectr/documentation/topic/com.ibm.bladecenter.advmgtmod.doc/kp1avAMMMessagesGuide.pdf
2. Perform the actions mentioned in the User Response section of the IBM reference documents.
ClearingIn the IBM Reference documentation, Chapter 2 contains information on mapping of the event codes against the exact cause of the alarm.
For information on clearing the alarm, refer to the Recoverable section of the reference documents. If the Recoverable section says yes, it means that the alarm generated will be automatically cleared. If the Recoverable section says no, the alarm has to be manually cleared using the alarm management application.
Testing instructionsDo not test this alarm because the hardware fault is not reproducible without a risk of permanent damage to the system.

284 DN70397367
LTE iOMS Alarms
Id:0900d80580953a38Confidential
70346 BLADECENTER: I/O MODULE FAILURE
157 70346 BLADECENTER: I/O MODULE FAILURE Probable cause: Equipment failure
Event type: Equipment
Default severity: Major
MeaningOne of the I/O (Input/Ouput) module has failed,or is malfunctioning.
The advanced management module is unable to read the status of the specifiedI/O module due to a fault.
Identifying additional information fields
1. spTrapEvtName - Event code of the Trap . Using this trap, the exact cause of the alarm can be determined. It is a Hexadecimal value (for example: 0x0000006B)
2. spTrapSysUuid - Host System UUID - Using this trap, you can identify the Chassis where the problem occurred. (For example: UUID- 07A3284990D2893F40224195720A145)
3. spTrapSourceId - The exact source where the problem has occurred. It could have the following value depending on the context of the alarm:IOMod_number - An I/O module indicated by the bay number.
Instructions
1. With the help of the Event code displayed in Identifying Application additional info (spTrapEvtName) of the alarm, find the exact cause from IBM reference documen-tation available at the following site: http://publib.boulder.ibm.com/infocenter/bladectr/documentation/topic/com.ibm.bladecenter.advmgtmod.doc/kp1avAMMMessagesGuide.pdf
2. Perform the actions mentioned in the User Response section of the IBM reference documents.
ClearingIn the IBM Reference documentation, Chapter 2 contains information on mapping of the event codes against the exact cause of the alarm.
For information on clearing the alarm, refer to the Recoverable section of the reference documents. If the Recoverable section says yes, it means that the alarm generated will be automatically cleared. If the Recoverable section says no, the alarm has to be manually cleared using the alarm management application.
Testing instructionsDo not test this alarm because the hardware fault is not reproducible without a risk of permanent damage to the system.

DN70397367 285
LTE iOMS Alarms 70347 DIGITAL SIGNAL PROCESSOR CORE FAIL-URE THRESHOLD EXCEEDED
Id:0900d8058095395dConfidential
158 70347 DIGITAL SIGNAL PROCESSOR CORE FAILURE THRESHOLD EXCEEDEDProbable cause: Software Error
Event type: Processing error
Default severity: Critical
MeaningA digital signal processor (DSP) core is reported as out-of-synch when the mirroring application detects that the core on the active unit is out-of-synch with the DSP core located on the stand-by unit. When the number of the DSP cores that are out-of-synch exceed the configured threshold value, this alarm is raised.
This alarm is raised when the state of the active DSP core is not replicated to the stand-by DSP. In practice, this means that the failover is denied in the case of the number of failed DSP cores exceeding the configured threshold value.
Additional information fields1. The configured out of synch threshold value.
2. Total number of cores in the blade.
InstructionsThe alarm doesn't require any direct action as the mirroring application is running in the DSP core and cannot be controlled. After some time the system will synchronize the DSP cores.
ClearingThe alarm is automatically cleared by the DSPHASProxy (a process that is monitoring and controlling the DSP units) process when the number of out of synch DSP cores goes down the configured threshold value.
Testing InstructionsPreconditions:
• An ATCA environment with advanced digital signal processor (ADSP) blade installed is commissioned and up.
• /DMP and /DSPHasProxy RGs (Recovery Groups) are running.
Execution Scenario:
1. Check the current threshold limit for the target node from the Configuration Directory by executing the following command:ldapsearch -x -b "fsdspLmpNodeName=<node_name>, fsFragmentId=DSPConfig, fsClusterId=ClusterRoot" fsdspCoresOutOfSyncThreshold
2. Use the following dsp-scli command to lock the standby DSP CPUs/cores until the number of the locked DSP cores exceed the configured out of synch threshold value:set dsp has-state lock device <device_name>
3. Check that the alarm is raised using the following SCLI command:show alarm active filter-by specific-problem 70347

286 DN70397367
LTE iOMS Alarms
Id:0900d8058095395dConfidential
70347 DIGITAL SIGNAL PROCESSOR CORE FAIL-URE THRESHOLD EXCEEDED
4. Use the following dsp-scli to unlock DSP CPUs/cores until the number of the locked DSP cores goes under the configured out of synch threshold value: set dsp has-state unlock device <device_name>
5. Verify that the alarm is cleared using the following SCLI command:show alarm active filter-by specific-problem 70347
DN70397367 287
LTE iOMS Alarms 70348 BIDIRECTIONAL FORWARDING DETECTIONSESSION DOWN
Id:0900d805809539acConfidential
159 70348 BIDIRECTIONAL FORWARDING DETECTION SESSION DOWNProbable cause: Transmission Error
Event type: Communications
Default severity: Minor
MeaningThis alarm indicates that a Bidirectional Forwarding Detection (BFD) session is switched from UP to DOWN state. The peer network element might be down or the two-way con-nectivity between the local and remote system is not functional.
The peer network element that is under BFD monitoring is down or unreachable.
Additional information fields1. Diagnostic Code: Possible Values:
• No_Diagnostic
• Control_Detection_Time_Expired • Echo_Function_Failed
• Neighbor_ Signaled_Session_Down
• Forwarding_Plane_Reset
• Path_Down • Concatenated_Path_Down
• Administratively_Down
• Reverse_Concatenated_Path_Down • Unknown
Instructions
1. Check the connectivity to the peer network element using ping, traceroute or similar utilities.
2. Check the Flexi Platform log files (/var/log/master-syslog) for network-related fault.
3. Try to check the state of the peer network element.
ClearingThe system clears the alarm automatically when the BFD session switches to the UP state or when the BFD function is disabled.

288 DN70397367
LTE iOMS Alarms
Id:0900d80580953a4bConfidential
70349 SIGNALING DYNAMIC CONFIGURATION FAILURE
160 70349 SIGNALING DYNAMIC CONFIGURA-TION FAILUREProbable cause: Configuration or Customizing Error
Event type: Processing error
Default severity: Major
MeaningThis alarm indicates that the operation to configure the stack dynamically has failed. The possible error scenarios are explained in Application Additional Info field.
These are critical errors which will cause the Signaling Gateway/SIGTRAN entities to malfunction. This alarm will be raised for a specific component (mentioned in Identifying Application Additional Info) in SS7 Signaling stack.
Identifying additional information fields1: Error code. Possible values:
• M3UA_DYNAMIC_ASSOC_FAILED: Dynamic operation of an association failed • M3UA_DYNAMIC_LOC_AS_FAILED: Dynamic operation of a Local Application
Server failed • M3UA_DYNAMIC_LOC_ASP_FAILED: Dynamic operation of a Local Application
Server Process failed • M3UA_DYNAMIC_LOC_SGP_FAILED: Dynamic operation of a Local Signaling
Gateway Process failed • M3UA_DYNAMIC_NA_FAILED: Dynamic operation of Message Transfer Part 3 User
Adaptation layer Network Appearance failed • M3UA_DYNAMIC_REM_AS_FAILED: Dynamic operation of a Remote Application
Server failed • M3UA_DYNAMIC_REM_ASP_FAILED: Dynamic operation of a Remote Application
Server Process failed • MTP2_DYNAMIC_LINK_FAILED: Dynamic operation of Message Transfer Part 2
Link failed • MTP3_DYNAMIC_FAILED: Dynamic operation of Message Transfer Part 3 failed. • NIF_DYNAMIC_RAN_PC_FAILED: Dynamic operation of a Radio Access Network
Point Code failed • NIF_DYNAMIC_SAP_FAILED: Dynamic operation of a Nodal Inter-working
Function Service Access Point failed • NIF_DYNAMIC_SELF_PC_FAILED: Dynamic operation of Self Point Code failed • SCCP_DYNAMIC_CSP_FAILED: Dynamic operation of Concerned Point Code failed • SCCP_DYNAMIC_CSS_FAILED: Dynamic operation of Concerned Subsystem failed • SCCP_DYNAMIC_GTT_RESULT_DPC_FAILED: Dynamic operation of Global Title
Translation Result Destination Point Code failed • SCCP_DYNAMIC_GTT_RESULT_FAILED: Dynamic operation of Global Title Trans-
lation Result failed • SCCP_DYNAMIC_GTT_RULE_FAILED: Dynamic operation of Global Title Transla-
tion Rule failed • SCCP_DYNAMIC_SAP_FAILED: Dynamic operation of Signaling Connection
Control Part Service Access Point failed
DN70397367 289
LTE iOMS Alarms 70349 SIGNALING DYNAMIC CONFIGURATIONFAILURE
Id:0900d80580953a4bConfidential
• SCCP_DYNAMIC_SP_FAILED: Dynamic operation of Signaling Point failed • SCCP_DYNAMIC_SS_FAILED: Dynamic operation of Subsystem failed
2. Type of operation. Possible Values:
• ADD • MODIFY
• DELETE
3. The field content is defined by the error code:
• M3UA_DYNAMIC_ASSOC_FAILED: Local Association Id • M3UA_DYNAMIC_LOC_AS_FAILED: Local Application Server Name • M3UA_DYNAMIC_LOC_ASP_FAILED: Local Application Server Process Id • M3UA_DYNAMIC_LOC_SGP_FAILED: Local Signaling Gateway Process Id • M3UA_DYNAMIC_NA_FAILED: of Message Transfer Part 3 User Adaptation layer
Network Appearance Name • M3UA_DYNAMIC_REM_AS_FAILED: Remote Application Server Name • M3UA_DYNAMIC_REM_ASP_FAILED: Remote Application Server Process Id • MTP2_DYNAMIC_LINK_FAILED: Message Transfer Part 2 Link Id • MTP3_DYNAMIC_FAILED: Name/Id of component • NIF_DYNAMIC_RAN_PC_FAILED: Radio Access Network Point Code Id • NIF_DYNAMIC_SAP_FAILED: of Nodal Inter-working Function Service Access
Point name • NIF_DYNAMIC_SELF_PC_FAILED: Self Point Code Id • SCCP_DYNAMIC_CSP_FAILED: Concerned Signaling Point Id • SCCP_DYNAMIC_CSS_FAILED: Concerned Sub System Id • SCCP_DYNAMIC_GTT_RESULT_DPC_FAILED,
SCCP_DYNAMIC_GTT_RESULT_FAILED: Result Name • SCCP_DYNAMIC_GTT_RULE_FAILED: Rule Name • SCCP_DYNAMIC_SAP_FAILED: Signaling Connection Control Part Service Access
Point Name • SCCP_DYNAMIC_SP_FAILED: Signaling Point Name • SCCP_DYNAMIC_SS_FAILED: Subsystem Name • SGW_DYNAMIC_SCTP_PROF_FAILED: Profile Name
4. Subsystem name (optional). The subsystem to which Concerned Signaling Point or Concerned Subsystem is added.
This field is used only for the SCCP_DYNAMIC_CSP_FAILED and SCCP_DYNAMIC_CSS_FAILED types of operation
InstructionsThis alarm is generated for errors that are very rare and mostly due to environmental defects/issues. For all events raising this alarm, the faulty command should be rolled back and RG should be restarted. Once you restart the RG the errors will be cleared.Refer to customer documentation for more information on error logs and statistics.If the problem still persists, please contact your localNokia Siemens Networks represen-tative with the error logs and statistics.
ClearingThe system clears the alarm automatically when the fault has been corrected.
290 DN70397367
LTE iOMS Alarms
Id:0900d80580953a4bConfidential
70349 SIGNALING DYNAMIC CONFIGURATION FAILURE
Testing InstructionsDo not test this alarm because the fault is not reproducible without riskingsystem damage or instability.

DN70397367 291
LTE iOMS Alarms 70350 DETECTED CLUSTER INTERNAL MESSAG-ING WITH UNKNOWN ORIGIN
Id:0900d80580953945Confidential
161 70350 DETECTED CLUSTER INTERNAL MESSAGING WITH UNKNOWN ORIGINProbable cause: Leak Detection
Event type: Environmental
Default severity: Critical
MeaningOne of the CMFN (Cluster Management Functionality Node)has received cluster man-agement messages with an unknown origin.
This alarm is a sign of a leakage in the network. It is raised when the cluster manage-ment messages are received simultaneously from more than one sender. This may be possible if the cluster management messages, that in turn utilise the multicast mes-sages, are being leaked from another cluster. When this alarm is raised, the disk-out-of-sync feature is disabled in order to prevent the CMFN nodes to power off each others even if the software configuration seems to be different. While the network leakage is a serious problem, the cluster should tolerate this. However, the restart of a CMFN node might fail during the leakage and therefore administrative task should be avoided.
InstructionsNetwork leakage could be caused by either an incorrect configuration of switches or a switch malfunction. In case of an incorrect configuration, the switch configuration should be fixed immediately. If the leakage is caused by a switch malfunction (for example, the switch is acting as a hub after a reset) and is a temporary problem, no actions are required.
ClearingThe system clears the alarm automatically when the messages from multiple receivers are no longer received and ten minutes pass without any fresh messages being recieved.
Testing InstructionsThe alarm situation can be simulated by sending the unexpected clustermanagement message manually. It is not advisable to test this alarm ina live network.
1. Check that the Cluster Management Functionality is running in both the nodes by executing the following command:fscmfcli -s /CLA-0As a result of executing this command, the state of the two nodes can be viewed. one node should be in CMF-SERVING state and other node should be in CMF-BACKUP state. For example:CLA-0: CMF-BACKUP priority: 5CLA-1: CMF-SERVING priority: 6
2. Raise the alarm by executing the following command:/etc/init.d/doos test-alarmThe alarm should be raised immediately.
Sending unexpected messages can be stopped at any time by breaking the command execution (for example, Ctrl+C). The alarm is then cleared automatically after 10 minutes.

292 DN70397367
LTE iOMS Alarms
Id:0900d805809539aaConfidential
70351 LICENSE STATE OFF FOR ACTIVE FEATURE
162 70351 LICENSE STATE OFF FOR ACTIVE FEATUREProbable cause: Threshold crossed
Event type: Quality of service
Default severity: Warning
MeaningThis is an informative alarm which indicates that the license state for a particular feature has become OFF but the admin state of the feature is still ON.
If the license state for the feature, which is identified by the feature code displayed in the Identifying Application Info field, has become OFF, the application implementing the licensed feature will stop operating.
Identifying additional information fields1. Feature code
Additional information fields2. License state
(possible values are OFF and ON)
3. Feature Admin State
(possible values are OFF and ON)
InstructionsCheck if a new license for the feature is required, and install the new license if required. If the feature itself is not required, set the feature admin state to OFF.
1. To check the status of a feature, execute the following SCLI command:show license feature allThe feature required would not be displayed in the output.
2. To install a new license execute the following SCLI command:add license file <LicenseFilename>where <LicenseFilename> is a fully qualified filename of the license file to be installed.
3. To turn the feature admin state off, execute the following SCLI command:set license feature-mgmt id <FeatureCode> feature-admin-state offwhere <FeatureCode> is the feature code corresponding to the installed license file
ClearingThe system clears the alarm automatically when the fault has been corrected.
Testing Instructions
1. Install a license for a licensed feature(no other installed license files should contain this feature) by executing the following SCLI command:add license file <LicenseFilename>where <LicenseFilename> is a fully qualified filename of the license file to be installed.
DN70397367 293
LTE iOMS Alarms 70351 LICENSE STATE OFF FOR ACTIVE FEATURE
Id:0900d805809539aaConfidential
2. Set the Feature admin state for the feature to ON by using the following SCLI command:set license feature-mgmt id <FeatureCode> feature-admin-state onwhere <FeatureCode> is the feature code corresponding to the installed licence file
3. Delete the installed license file by using the following SCLI command :delete license unique-id <LicenseFilename>where <LicenseFilename> is the name of the license file without the .XML exten-sion.
4. Verify that an alarm for the situation has been raised by using the following SCLI command:show alarm active filter-by specific-problem 70351where 70351 is the alarm number corresponding to this alarm.
5. Set the Feature admin state for the feature to OFF by using the following SCLI command:set license feature-mgmt id <FeatureCode> feature-admin-state offwhere <FeatureCode> is the feature code corresponding to the installed license file.
6. Verify that the alarm for the situation has been cleared using the following SCLI command.show alarm active filter-by specific-problem 70351The alarm list should not display, the Identifying Application Additional Information field, containing <FeatureCode> as its value.

294 DN70397367
LTE iOMS Alarms
Id:0900d80580953904Confidential
70352 USER SPECIFIED CONFIGURATION FAILED DURING POSTCONFIG
163 70352 USER SPECIFIED CONFIGURATION FAILED DURING POSTCONFIG Probable cause: Configuration or Customizing Error
Event type: Processing error
Default severity: Minor
MeaningThis is an informative alarm that could be generated for one of the following reasons:
1. The postconfiguration scripts provided by one of the user/subsystem has failed.2. SCLI scripts could not be executed due to the possible unavailability of the SCLI
daemon.3. fsconfigure --save command failed during the postconfiguration operation.
This command is executed to save the configuration changes provided by the sub-system/user.
Based on the reason for which the alarm is raised, you may notice the following effects:
1. Inconsistencies in Configuration Directory or in the state of the Recovery Groups due to the failure in one of the .sh or the .scli script.
2. If the SCLI daemon is not running , the .scli scripts provided by the user/subsys-tem will not be executed. As a result the configuration changes expected as a part of the .scli scripts will not take place.
3. The added configuration changes will persist only till the next reboot if the fsconfigure --save command failed.
In all cases, any configuration changes made by the scripts till the failure occurred, would be valid till the next reboot. However, the cluster should still be able to provide most of its services.
Identifying additional information fields1. Error code:
Possible values are as follows:
• SCLI_DAEMON_NOT_AVAILABLE - The SCLI daemon was not available at the time of execution of the user/subsystem configuration script.
• FSCONFIGURE_SAVE_ERROR - The fsconfigure --save command did not execute successfully hence the applied configuration was not saved.
• USER_CONFIG_SCRIPT_ERROR - The script mentioned in the second field failed to execute.
2. Script name (optional)
This is an optional parameter which indicates the name of the script that failed. Note that, this parameter is only applicable in case of the USER_CONFIG_SCRIPT_ERROR code.
Additional information fields-
InstructionsFollow the instructions given below to clear this alarm:

DN70397367 295
LTE iOMS Alarms 70352 USER SPECIFIED CONFIGURATION FAILEDDURING POSTCONFIG
Id:0900d80580953904Confidential
1. Verify if the SCLI daemon is up. If you get the fsclish shell, it inidicates that the SCLI daemon is up.
g Note that steps 2 and 3 should be performed with root user permissions.
2. Correct errors, if any, in the script provided by the user/subsystem.The name of the erroneous script is indicated in the alarm as the second Identifying Application Additional Information field.This script can be located at either one of the following locations:/opt/nokiasiemens/configure/sh/Or/var/opt/nokiasiemens/commissioning/session/CONFDIR/
3. Run the configuration scripts manually.4. Run the fsconfigure --save command to save the configuration changes.
ClearingAfter correcting the fault, as presented in the Instructions section, clear the alarm using the following SCLI command:
set alarm clear alarm-id 70352
Testing Instructions
1. Write a dummy script which will fail by default. In other words the script must return with an exit status of 1.
2. While creating the session for commissioning, add the variable COMM_USER_CONFDIR, to the fsetup.conf file, which will hold the path to the directory containing the dummy script mentioned in step 1.
3. Perform commissioning.4. After a successful commissioning session, run the postconfig.py script.5. Check that alarm 70352 has been reported in the master-alarms log.
296 DN70397367
LTE iOMS Alarms
Id:0900d805809539abConfidential
70357 RUIM CERTIFICATE CANNOT BE MADE
164 70357 RUIM CERTIFICATE CANNOT BE MADE Probable cause: Underlying resource unavailable
Event type: Processing error
Default severity: Minor
MeaningThis alarm is indicates that RUIM (Remote User Information Management) certificates cannot be created in the /etc/certs/ruim/ directory.
It also indicates that the SSL connection is unsuccessful by RUIM. Note that you will still be able to login in to RUIM using TLS_OR_PLAIN_TEXT or PLAIN_TEXT modes.
Identifying additional information fieldsPossible values for error codes:
• RUIM_CERT_NO_RW_PERMISSION - 50This error code indicates that the directory is in read-only mode or the parent direc-tory resides on a read-only file system.
• RUIM_CERT_NO_RESOURCES: 51This error code indicates that there is no free disk space on the device for creating a file, or the resources available in the system are insufficient to perform a write operation.
• RUIM_CERT_FSDISTRIBUTE_FAILED - 52This error code indicates that a distribution failure occurred while copying the certif-icate files from Self Loading Node (SLN) to the rest of the nodes in a cluster.
• RUIM_CERT_MAX_FILE_COUNT - 53This error code indicates that the maximum allowable number of files are currently open in the system.
• RUIM_CERT_CREATION_FAILED - 54This error code indicates that a component of the path (prefix specified by the path) does not name an existing directory, the path is an empty string, or the path argument specifies the slave side of a pseudo-terminal device that is locked.
InstructionsTry creating the RUIM certificate again and check why the certificate cannot be created and potentially disable RUIM for the time of investigation (as possible plain-text connec-tions are dangerous).
RUIM can be disabled using the following command:
#fsclish -c "set user-management ruim disable"
Check the following options depending on the error code (for more information, see Identifying Application Additional Info):
1. Check if the directory /etc/certs/ruim is in read-only mount.2. Check if there is enough free disk space available for creation of a certificate file.3. Check if a distribution failure occurred while copying the certificate files from Self
Loading Node (SLN) to the rest of the nodes in a cluster (This fsdistribute oper-ation is done inherently as part of the creation of a certificate file).

DN70397367 297
LTE iOMS Alarms 70357 RUIM CERTIFICATE CANNOT BE MADE
Id:0900d805809539abConfidential
ClearingThe system clears the alarm automatically when the certificate is successfully generated next time.
Testing InstructionsThe test setup must include an external LDAP server populated according to NetAct RUIM schema (/RUIMSCHEMA/).
Preconditions:
• FlexiPlatform cluster is commissioned and up. • All RUIM-related RGs (RuimReplicator and PAP) are unlocked and enabled. • Copy a reference SSL certificate pair of the external LDAP server to
/tmp/orig_certs/cert1.pem
In the following scenario we can generate the alarm, "RUIM CERTIFICATE CANNOT BE MADE".
Note that the following mount commands do not work in SCLI, therefore; the operations must be performed in bash as a root user.
• Create a directory in /etc with the following command: #mkdir /etc/certs
• Mount the configuration partition on read-write mode, using the following command:#mount -o remount,rw /mnt/config/<Rel Label>/INITIAL/
• Create a directory inside the configuration partition with the following command:#/mnt/config/<Rel Label>/INITIAL/nodes/CLA-0/etc/certs
• Restore the configuration partition to read-only mode, using the following command:#mount -o remount,ro /mnt/config/<Rel Label>/INITIAL/
• Bind mount the above created directory on /etc/certs as follows:#mount -o ro --bind /mnt/config/<Rel Label>/INITIAL/ \nodes/CLA-0/etc/certs /etc/certs/
• Check if the above directory is read-only mounted.#mount | grep "/etc/certs" | grep "ro"
The following commands use SCLI for execution:
• Import SSL certificate with the following command.#fsclish -c "set security cert default ca-cert ca-id \ruim cert-file /tmp/orig_certs/cert1.pem"
The above command results in an alarm, as the directory where the alarm file has to be generated is mounted on a read-only file system.
To observe the alarm, enter the following command:
#fsclish -c "show alarm active filter-by specific-problem 70357"

298 DN70397367
LTE iOMS Alarms
Id:0900d8058095397dConfidential
70358 SSL CONNECTION CANNOT BE MADE BY RUIM
165 70358 SSL CONNECTION CANNOT BE MADE BY RUIM Probable cause: Underlying resource unavailable
Event type: Processing error
Default severity: Minor
MeaningThis alarm indicates that the Remote User Information Management (RUIM) configured to make an SSL connection to the external NetAct LDAP server has failed.
This alarm is raised due to the following reasons:
1. Certificate is missing or rejected by the external NetAct LDAP server.2. The external NetAct LDAP server is not supporting SSL connections or connection
to it cannot be established for any other reason (also see alarm 70268).
Note that, when an SSL connection is attempted but no connection is made because of a connection problem, which is not specific to SSL (for example, wrong IP address); both the alarms 70268 and XXXXX are raised. If only the alarm XXXXX is raised, then the TLS_OR_PLAIN_TEXT mode is used and the plain text connection has succeeded.
This alarm indicates that the SSL connection is unsuccessful by RUIM. Note that the user will still be able to login using TLS_OR_PLAIN_TEXT or PLAIN_TEXT modes in RUIM.
Identifying additional information fieldsPossible values for error codes:
• LDAP_PROTOCOL_ERROR: This error is raised, if external LDAP server doesnot support an SSL connection.
• LDAP_CONNECT_ERROR: This error is raised, if an SSL certificate is missingor cor-rupted in /etc/certs/ruim/ directory.
InstructionsCheck why SSL connections cannot be made and potentially disable RUIM for the time of investigation (as possible plain-text connections are dangerous).
To disable RUIM, enter the following command:
#fsclish -c "set user-management RUIM disable"
Depending on the problem type (see Identifying Application Additional Info) the cause for the problem can be:
- Certificates are not present in default or RUIM domain.
- Wrong server certificate is used.
- External LDAP does not support SSL protocol.
ClearingThe system clears the alarm automatically when the SSL connection is established with the external LDAP Server.
DN70397367 299
LTE iOMS Alarms 70358 SSL CONNECTION CANNOT BE MADE BYRUIM
Id:0900d8058095397dConfidential
Testing InstructionsThe test setup must include an external LDAP server populated according to NetAct RUIM schema (/RUIMSCHEMA/).
Preconditions:
• Platform cluster is commissioned and up. • Connection with the external LDAP is established. • All RUIM related recovery groups (RuimReplicator and PAP) are unlocked and
enabled. • Copy of a reference SSL certificate pair is made to the external LDAP server in
/tmp/orig_certs/cert1.pem.
The alarm "SSL CONNECTION CANNOT BE MADE BY RUIM" can be generated in the following scenarios.
Scenario 1:
Certificates are not present in RUIM or default domain.
• RUIM must be enabled in TLS mode only. • If certificates are present, remove them using the following command:
#fsclish -c "delete security cert ruim ca-cert issuer-id \<CA certificate ID> serial-nr <serial-nr>"
• Refresh the users from the external LDAP using the following command.#fsclish -c "set user-management ruim replicator \refresh users <username>"
• Observe that the above command fails, indicating that the problem in authentication and the external user does not get replicated.
• To observe the alarm enter the following command:#fsclish -c "show alarm active filter-by \specific-problem 70358"
Scenario 2:
Wrong server certificates are used.
• RUIM must be enabled in TLS mode only and fsnwi3PrimaryTLSRequireLevel parameter is set to LDAP_OPT_X_TLS_HARD
• Generate an SSL certificate intended for another external LDAP server other than the one meant for external connectivity. This can be done using a reference SSL certificate from another server, for example; cert2.pem instead cert1.pem.Use the following command to generate a mismatching certificate: #fsclish -c "set security cert default ca-cert ca-id ruim \cert-file /tmp/orig_certs/cert2.pem"
• Refresh the users from the external LDAP using the following command.#fsclish -c "set user-management ruim replicator refresh \users <username>"
• Observe that the above command fails, indicating that the problem in authentication and the external user does not get replicated.
• To observe the alarm enter the following command:#fsclish -c "show alarm active filter-by \specific-problem 70358"
Scenario 3:

300 DN70397367
LTE iOMS Alarms
Id:0900d8058095397dConfidential
70358 SSL CONNECTION CANNOT BE MADE BY RUIM
External LDAP does not support SSL protocol.
• RUIM must be enabled in TLS mode only. • Change the external LDAP server to run in the SSL connectivity disabled mode. • Refresh the users from the external LDAP using the following command.
#fsclish -c "set user-management ruim replicator \refresh users <username>"
• Observe that the above command fails, indicating that the problem in making SSL connection to external LDAP and user does not get replicated.
• To observe the alarm enter the following command:#fsclish -c "show alarm active filter-by \specific-problem 70358"
DN70397367 301
LTE iOMS Alarms 70369 ALARM OVERFLOW CACHE FILE INACCES-SIBLE
Id:0900d80580953a48Confidential
166 70369 ALARM OVERFLOW CACHE FILE INACCESSIBLEProbable cause: FILE ERROR
Event type: Processing error
Default severity: Critical
MeaningAlarm processor cannot open or read the alarm overflow cache file.
It's impossible to cache incoming alarm notifications if the Alarm System will be in overload state.
Additional information fields
1. reason, possible values: 1 - file cannot be opened, 2 - permanent file read error2. additional information about the problem (for example, text of the corresponding
system exception)
Instructions
1. Check if the name of the overflow cache alarm log file that is defined by the param-eter fsOverflowAlarmCacheFile in the alarm processor configuration in Con-figuration Directory points out to the existing file name (excluding number suffix). ldapsearch -LLL -H ldap://Directory:389 -x -b "fsClusterId=ClusterRoot" "(objectclass=FSAlarmProcessorConfiguration)"
2. If these files (with number suffixes 0,1, etc..) don't exist, it's possible to leave existing defined filename or change it in the Configuration Directory (LDAP) using the follow-ing SCLI commands: ldapmodify -x -y /opt/Nokia_BP/etc/ldapfiles/fssecldap.ldaproot -D uid=fsLDAPRoot,ou=People,fsFragmentId=Security,fsClusterId=ClusterRoot<<EOF dn: fsAlarmProcessorConfigurationId=Default,fsAlarmProcessorId=AlarmProcessor1,fsFragmentId=AlarmProcessors,fsFragmentId=AlarmMgmt,fsClusterId=ClusterRoot fsOverflowAlarmCacheFile: <correct_value> EOF
Then restart the Alarm System using the following SCLI command: fshascli -r /AlarmSystem
After the Alarm System restarts, files should be recreated anew in the given location.3. If alarm is still active after the Alarm System restart, prepare a problem report with
the alarm data, and send it to your Nokia Siemens Networksrepresentative.
ClearingDo not clear the alarm. The system will automatically clear the alarm.

302 DN70397367
LTE iOMS Alarms
Id:0900d80580953a48Confidential
70369 ALARM OVERFLOW CACHE FILE INACCES-SIBLE
Testing instructions
1. Make sure the Alarm System is unlocked and enabled:fshascli -s /AlarmSystem
Use the Parameter Tool to check the log file name in the LDAP Alarm Processor configuration (fsParameterId=fsOverflowAlarmCacheFile, fsAlarmProcessorConfigurationId=Default,fsAlarmProcessorId=AlarmProcessor1, fsFragmentId= AlarmProcessors, fsFragmentId=AlarmMgmt,fsClusterId=ClusterRoot).
2. Remove the log files (all files with suffixes .0, .1). After verifying that an alarm for the situation has been raised, restart the Alarm Processor with the following command:fshascli -r /AlarmSystem
3. Wait until the Alarm System is unlocked and enabled (see p.1), and then check that the alarm is cleared. Files removed in p.2 should be recreated anew.
DN70397367 303
LTE iOMS Alarms 70374 FALLBACK OCCURED
Id:0900d805809538f0Confidential
167 70374 FALLBACK OCCUREDProbable cause: Software error
Event type: Processing error
Default severity: Critical
MeaningThe alarm is raised if there were errors during a major software upgrade(MSU) proce-dure, which prevents the new version of FlexiPlatform from running after upgrade. If this alarm was raised it, means that either there were errors during boot of the new Flexiplat-Form based system or during the last configuration steps of applications.
Additional information fieldsThis alarm is raised when some error prevented the MSU procedure from being exe-cuted. If this alarm is active, it means that the old installation is still running.
InstructionsFill in a problem report and send it to your local Nokia Siemens Networks representative. The operator should verify the msu.log and check the cause of MSU error.
ClearingAfter correcting the fault, clear the alarm with an alarm management application.
Testing instructionsCheck whether the system is able to detect a high level fallback scenario successfully when a remote MSU is initiated and exit in the absence of control_transfer.
Precondition
1. Perform regular MSU steps up to the convert step (that is fsswcli --major --convert). Refer to the MSU guide or Customer Documentation for these steps.
2. If version SS_SWMan and SS_BPUtils is less than SS_SWMAN_1.0.1.36 and SS_BPUtils_4.0.1.42 respectively, perform MiSU with the latest SS_SWMan and SS_BPUtils as incremental rpm on the target environment.
3. The reference image is prepared on a reference cluster commissioned with SE5_1.16 or greater (upgrade image).
4. control_transfer is not present in the upgrade image.
Execution
1. Execute the cutover step with a valid kernel entry in the new installation.2. Once the updater has rebooted the cluster, add an entry in the /var/log/msu.log
before the postconfiguration completes:#echo "Sep 28 13:49:28 /opt/Nokia_BP/SS_SWMan/bin/major/updater : ERROR : Testing High Level Fallback" >>/var/log/msu.log
Expected results
1. There should be the following entry in the /var/log/msu.log: The /var/lib/misc/msu_status file should contain the follow ing entry:ERROR : Testing High Level Fallback : /opt/Nokia_BP/SS_SWMan/bin/major/updater
2. Execute cutover step to rollback to old installation.
304 DN70397367
LTE iOMS Alarms
Id:0900d805809538f0Confidential
70374 FALLBACK OCCURED
3. After cluster has been booted up with old installation alarm should be raised.
Post conditions
1. If normal cluster environment is desired, then do the following steps.2. Perform cutover step, fssw cli --major --cutover This will take the machine back to
the old image.3. Execute the commit operation fsswcli --major --commit.

DN70397367 305
LTE iOMS Alarms 71000 PM FTP CONNECTION FAILED
Id:0900d8058092025fConfidential
168 71000 PM FTP CONNECTION FAILEDProbable cause: Communication Protocol Error
Event type: Communications
Default severity: Minor
MeaningFile transfer operation failed when trying to upload measurement file. IP-address in the additional information field tells which interface the problem concerns.
This alarm will not be set immediately after a file transfer operation fails, but only after the file transfer has failed to the same IP-address consequently over the duration defined by LDAP parameter OMS/OMSRNC/SS_RNCPM/OMSMeaHandler/BTSFTPAlarmSetDelay.
Measurement data may be lost or delayed.
Identifying additional information fields1. IP-address of FTP/HTTP/HTTPS server
Additional information fields2. Cause information: "Connect_failed", "Get_failed", "Other_error"
3. Network element identifier ("WMBTS-xxx" for BTS-failures, "ASNGW-xxx" for ASN GW failures, "IADA-xxx" for I-HSPA Adapter failures, "FGW-xxx" for Femto Gateway failures)
InstructionsNormally the alarm does not need to be cleared but the system cancels the alarm auto-matically when the file transfer operation is successful. However, if the related network element is removed altogether from the network or its IP-address is changed, it may be necessary to cancel the alarm manually using Element Manager.
Clearing-

306 DN70397367
LTE iOMS Alarms
Id:0900d80580920267Confidential
71001 MEASUREMENT DATA NOT TRANSFERRED
169 71001 MEASUREMENT DATA NOT TRANS-FERREDProbable cause: Queue Size Exceeded
Event type: Quality of service
Default severity: Minor
MeaningThe number of files waiting to be transferred to NetAct has exceeded a defined thresh-old.
Some measurement data may not have been transferred to NetAct or file transfer acknowledgments from NetAct to OMS are not working correctly.
Identifying additional information fields-
Additional information fields-
InstructionsDo not clear the alarm. Alarm System will clear the alarm when the amount of untrans-ferred files decreases below a defined threshold.
If NetAct connection is wanted to be disabled, the alarm will get cancelled automatically within 10 minutes after setting LDAP parameter PMFileBufferAlarmEnabled to value 0 (zero).
Clearing-

DN70397367 307
LTE iOMS Alarms 71002 MEASUREMENT DATA ERROR
Id:0900d8058053d927Confidential
170 71002 MEASUREMENT DATA ERRORProbable cause: Corrupt data
Event type: Processing error
Default severity: Warning
MeaningMeasurement file could not be processed.
Some measurement data could have been lost due to invalid measurement file content.
Identifying additional information fields-
Additional information fields1. Error info, possible values: "Decompression_failed", "File_corrupted", "Other_failure"
2. File name
3. IP-address of data provider
4. Detailed error code for troubleshooting
InstructionsDo not clear the alarm. Alarm System will clear the alarm automatically.
Clearing-

308 DN70397367
LTE iOMS Alarms
Id:0900d8058053d928Confidential
71003 OMS MEASUREMENT DATA PROCESSING OVERLOAD
171 71003 OMS MEASUREMENT DATA PRO-CESSING OVERLOADProbable cause: System Resources Overload
Event type: Quality of service
Default severity: Minor
MeaningThe time used for processing performance measurement data in OMS has exceeded the defined limit. This does not necessarily indicate any loss of measurement data but the measurement parameters should be changed to decrease load and prevent possible problems caused by the overload.
The limits used to set and cancel this alarm can be changed by the user from OMS LDAP parameters.
Too much measurement data is produced in the network elements and OMS overload causes a risk for losing some data.
Identifying additional information fields1. Measurement category, possible values: "RNW_meas", "Transm_hw_meas", "WBTS_meas" which covers also WMBTS, ASN GW and FGW measurements.
Additional information fields-
InstructionsDo not clear the alarm. Alarm System will clear the alarm after data processing load decreases to normal level.
Clearing-
DN70397367 309
LTE iOMS Alarms 71005 THRESHOLD MONITORING LIMIT EXCEED-ED
Id:0900d80580920293Confidential
172 71005 THRESHOLD MONITORING LIMIT EXCEEDEDProbable cause: Threshold Crossed
Event type: Quality of service
Default severity: Minor
MeaningThreshold monitoring makes it easier to detect faults, identify bottlenecks and optimize the network. Using Element Manager GUI, appropriate performance thresholds are determined for each important variable, and exceeding these thresholds indicates a problem worth of attention. These variables can be either single counters or Key Perfor-mance Indicators (KPIs), which can be a combination of several counters. When performance data is gathered on variables of interest from the measured objects in the network, their values are compared against any active threshold limits. When a performance threshold is exceeded, an alarm is generated and sent to the network man-agement system. In addition to this, a threshold event log is saved in the network element for further study of the events which have occurred in that NE during a certain period of time. When this alarm has been triggered, it means that a threshold monitoring rule has been evaluated as true by OMS. The object of this alarm is always OMS, even if the threshold rule had been targeted to some other measured object. The real object of the threshold alarm and more information on the event can be seen with the NE Threshold Manage-ment application.
The effect of this alarm is dependent on what is the operator defined threshold rule that triggered the alarm setting.
Identifying additional information fields1. Measurement type
2. Threshold rule name
InstructionsThreshold alarm does not necessarily mean that there are problems in the network element, because thresholds can be freely set by the operator, and some rules may have been set incorrectly. To get further information on the reason of the threshold alarm: - Connect to the network element with Element Manager.- Open the NE Threshold Management application.- Select "Show Threshold Log" from the View menu and check the threshold log. When the target object and other information of the alarm have been checked from the log, you can obtain more information from the performance counters of measurements and, if necessary, take appropriate action to correct the problem. The counters can be browsed either by using Element Manager applications (NE Measurement Explorer or RNW Measurement Presentation) or by using NetAct reporting tools.
310 DN70397367
LTE iOMS Alarms
Id:0900d80580920293Confidential
71005 THRESHOLD MONITORING LIMIT EXCEED-ED
ClearingDo not clear the alarm. This alarm is cancelled automatically by the system after 15 seconds.

DN70397367 311
LTE iOMS Alarms 71006 WCEL THRESHOLD MONITORING LIMIT EX-CEEDED
Id:0900d80580920295Confidential
173 71006 WCEL THRESHOLD MONITORING LIMIT EXCEEDEDProbable cause: Threshold Crossed
Event type: Quality of service
Default severity: Minor
MeaningWhen this alarm has been triggered, it means that a threshold monitoring rule has been evaluated as true by OMS for some WCDMA cell object in the Cell Resource measure-ment. More information on the event can be seen with the NE Threshold Management application in OMS Element Manager.
Threshold monitoring makes it easier to detect faults, identify bottlenecks and optimize the network. Using OMS Element Manager GUI, appropriate performance thresholds are determined for each important variable, and exceeding these thresholds indicates a problem worth of attention. These variables can be either single counters or Key Perfor-mance Indicators (KPIs), which can be a combination of several counters.
When performance data is gathered on variables of interest from the measured objects in the network, their values are compared against any active threshold limits. When a performance threshold is exceeded, an alarm is generated and sent to the network man-agement system. In addition to this, a threshold event log is saved in the network element for further study of the events which have occurred in that NE during a certain period of time.
Identifying additional information fields1. Measurement type
2. Threshold rule name
Additional information fields-
InstructionsThreshold alarm does not necessarily mean that there are problems in the network element, because thresholds can be freely set by the operator, and some rules may have been set incorrectly.
To get further information on the reason of the threshold alarm:
- Connect to the network element with Element Manager.
- Open the NE Threshold Management application.
- Select "Show Threshold Log" from the View menu and check the threshold log.
When the target object and other information of the alarm have been checked from the log, you can obtain more information from the performance counters of measurements and, if necessary, take appropriate action to correct the problem. The counters can be browsed with RNW Measurement Presentation application or by using NetAct reporting tools.
ClearingDo not clear the alarm. This alarm has a lifetime of 65 minutes.

312 DN70397367
LTE iOMS Alarms
Id:0900d8058082d064Confidential
71007 MEASUREMENT THRESHOLD MONITORING LIMIT EXCEEDED
174 71007 MEASUREMENT THRESHOLD MONI-TORING LIMIT EXCEEDEDProbable cause: Threshold Crossed
Event type: Quality of service
Default severity: Minor
MeaningWhen this alarm has been triggered, it means that a threshold monitoring rule has been evaluated as true by OMS for some WCDMA cell object in some other RNW measure-ment than Cell Resource measurement for which threshold limit breaks are reported with alarm WCEL THRESHOLD MONITORING LIMIT EXCEEDED. More information on the event can be seen with the NE Threshold Management application in RNC Element Manager.
Threshold monitoring makes it easier to detect faults, identify bottlenecks and optimise the network. Using RNC Element Manager GUI, appropriate performance thresholds are determined for each important variable, and exceeding these thresholds indicates a problem worth of attention. These variables can be either single counters or Key Perfor-mance Indicators (KPIs), which can be a combination of several counters.
When performance data is gathered on variables of interest from the measured objects in the network, their values are compared against any active threshold limits. When a performance threshold is exceeded, an alarm is generated and sent to the network man-agement system. In addition to this, a threshold event log is saved in the network element for further study of the events which have occurred in that NE during a certain period of time.
Identifying additional information fields1. Measurement type
2. Threshold rule name
Additional information fields-
InstructionsThreshold alarm does not necessarily mean that there are problems in the network element, because thresholds can be freely set by the operator, and some rules may have been set incorrectly.
To get further information on the reason of the threshold alarm:
- Connect to the network element with Element Manager.
- Open the NE Threshold Management application.
- Select "Show Threshold Log" from the View menu and check the threshold log.
When the target object and other information of the alarm have been checked from the log, you can obtain more information from the performance counters of measurements and, if necessary, take appropriate action to correct the problem. The counters can be browsed with RNW Measurement Presentation application or by using NetAct reporting tools.

DN70397367 313
LTE iOMS Alarms 71007 MEASUREMENT THRESHOLD MONITORINGLIMIT EXCEEDED
Id:0900d8058082d064Confidential
ClearingDo not clear the alarm. This alarm has a lifetime of 65 minutes.
314 DN70397367
LTE iOMS Alarms
Id:0900d805809538f6Confidential
71008 ORACLE CLUSTER ALERT
175 71008 ORACLE CLUSTER ALERTProbable cause: 302
Event type: x2
Default severity: 4 Minor
MeaningAlerts are generated for different types of problem or failure regarding Automatic Storage Management, Oracle Clusterware or Oracle Database Instance. Examine the alert log and Oracle documentation(from Oracle website) for additional information. There might be different alarms for different database instances and alert log files.
The effect varies for different problems or failures. Please refer to the Oracle documen-tation to identify the severity of the problem.
Additional information fields
1. Instance name.2. Alert log file.3. Alert message.
InstructionsCheck alarms and alert logs that occurred before this alarm was raised; check the Oracle documentation for advice according to error code and symptom. Alternatively, you can contact your local Nokia Siemens Networks representative and provide the information you obtained (alarm notification's fields and alert logs). The following alert log files can be found in database node:
${ORACLE_BASE}/admin/<ORACLE_DB_NAME>/bdump/alert_<ORACLE_SID>.log ${ORACLE_BASE}/admin/+ASM/bdump/alert_<ASM_SID>.log ${ORA_CRS_HOME}/log/$(hostname)/alert<hostname>.log
ClearingThis alarm does not automatically clear since there is no automatic way of determining when the problem has been resolved. You will need to clear the alarm manually with alarm management application once the problem is fixed.
Testing instructions
1. Login as privileged user to a Oracle database node.2. Make sure the following global environment variables are set properly:
ORACLE_BASEORACLE_HOMEORA_CRS_HOMEORACLE_SIDAnd
adding ORACLE_HOME and ORA_CRS_HOME to environment variables PATH:export PATH=$ORACLE_HOME/bin:$PATHexport PATH=$ORA_CRS_HOME/bin:$PATH
3. Connect to Oracle database instance as sysdba by using sqlplus.

DN70397367 315
LTE iOMS Alarms 71008 ORACLE CLUSTER ALERT
Id:0900d805809538f6Confidential
4. Manually write fake alert message as following:BEGINDBMS_SYSTEM.KSDWRT(3,'________Alarm testing message________');DBMS_SYSTEM.KSDWRT(3,'This message contain keyword like error or failedin order to raise alarm');END;/
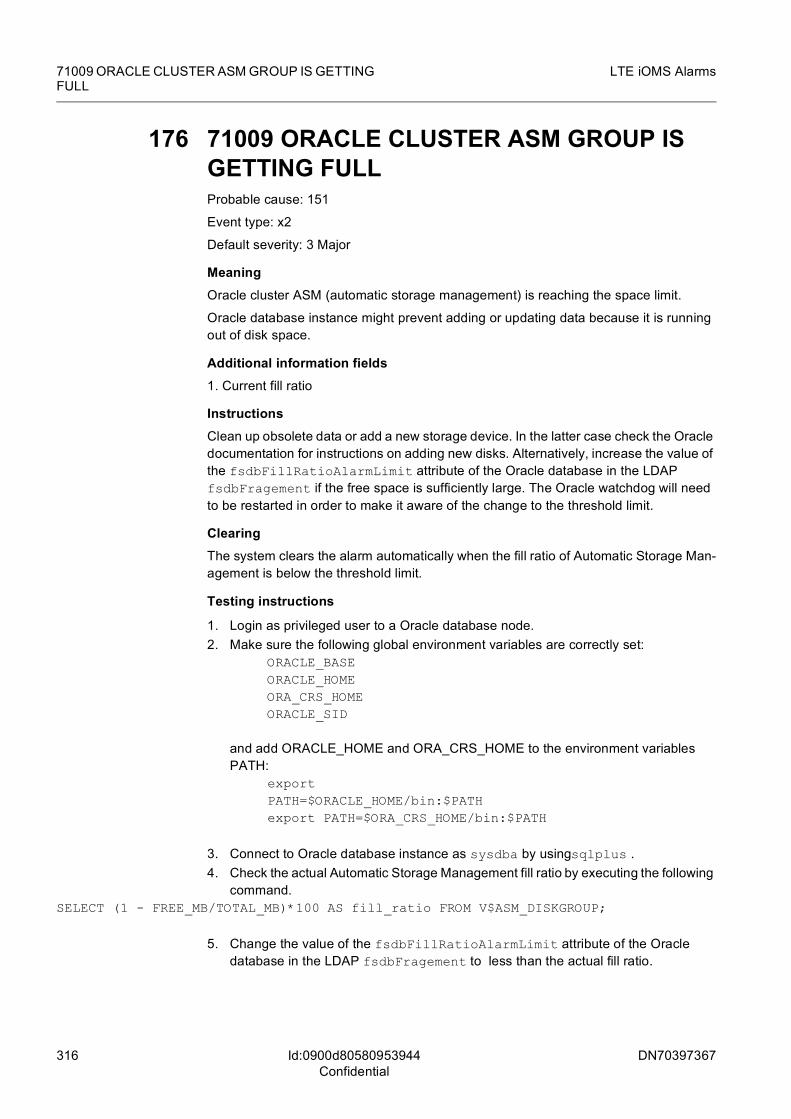
316 DN70397367
LTE iOMS Alarms
Id:0900d80580953944Confidential
71009 ORACLE CLUSTER ASM GROUP IS GETTING FULL
176 71009 ORACLE CLUSTER ASM GROUP IS GETTING FULLProbable cause: 151
Event type: x2
Default severity: 3 Major
MeaningOracle cluster ASM (automatic storage management) is reaching the space limit.
Oracle database instance might prevent adding or updating data because it is running out of disk space.
Additional information fields1. Current fill ratio
InstructionsClean up obsolete data or add a new storage device. In the latter case check the Oracle documentation for instructions on adding new disks. Alternatively, increase the value of the fsdbFillRatioAlarmLimit attribute of the Oracle database in the LDAP fsdbFragement if the free space is sufficiently large. The Oracle watchdog will need to be restarted in order to make it aware of the change to the threshold limit.
ClearingThe system clears the alarm automatically when the fill ratio of Automatic Storage Man-agement is below the threshold limit.
Testing instructions
1. Login as privileged user to a Oracle database node.2. Make sure the following global environment variables are correctly set:
ORACLE_BASEORACLE_HOMEORA_CRS_HOMEORACLE_SID
and add ORACLE_HOME and ORA_CRS_HOME to the environment variables PATH:
exportPATH=$ORACLE_HOME/bin:$PATHexport PATH=$ORA_CRS_HOME/bin:$PATH
3. Connect to Oracle database instance as sysdba by usingsqlplus .4. Check the actual Automatic Storage Management fill ratio by executing the following
command.SELECT (1 - FREE_MB/TOTAL_MB)*100 AS fill_ratio FROM V$ASM_DISKGROUP;
5. Change the value of the fsdbFillRatioAlarmLimit attribute of the Oracle database in the LDAP fsdbFragement to less than the actual fill ratio.

DN70397367 317
LTE iOMS Alarms 71010 ORACLE CLUSTER COMPONENT IS FAULTY
Id:0900d805809539fbConfidential
177 71010 ORACLE CLUSTER COMPONENT IS FAULTYProbable cause: 302
Event type: x2
Default severity: 2 Critical
MeaningOne or more Oracle database server component(s) become unexpectedly unavailable, such as one Oracle database instance or listener is down. There might be more than one different alarm, e.g. different database instance.
The effect may be various depending on the severity of the failure. In addition, Oracle Real Application Clusters has got its own high availability, so it might recover from the fault by itself, later. The worst situation is that all the Oracle database services are unavailable because all database instances are unavailable.
Additional information fields1. Faulty instance name(s).
InstructionsIssue crs_stat to check the status of the Oracle cluster database, and check the Oracle alert logs on the faulty node for the errors issued by the Oracle server. In addition look at events that occurred before this alarm was raised. You can alternatively contact your local Nokia Siemens Networks representative and provide the information you obtained (alarm notification's fields and alert logs).
ClearingThe system clears the alarm automatically when the fault has been corrected.
Testing instructions
1. Login as privileged user to Oracle database node.2. Make sure the following global environment variables are set properly:
ORACLE_BASEORACLE_HOMEORA_CRS_HOMEORACLE_SIDAnd
adding ORACLE_HOME and ORA_CRS_HOME to environment variables PATH:export PATH=$ORACLE_HOME/bin:$PATHexport PATH=$ORA_CRS_HOME/bin:$PATH
3. Stop one of the Oracle database instance node: srvctl stop instance -d <database name> -i <instance name>

318 DN70397367
LTE iOMS Alarms
Id:0900d80580828f39Confidential
71052 OMS FILE TRANSFER CONNECTION COULD NOT BE OPENED
178 71052 OMS FILE TRANSFER CONNECTION COULD NOT BE OPENEDProbable cause: Communication Protocol Error
Event type: Communications
Default severity: Minor
MeaningStarting a new file transfer connection has failed.
File transfer between OMS and target network element is not working.
Identifying additional information fields1. IP address of the failed target
Additional information fields2. URL of the failed target
InstructionsThe error can be caused by many different reasons (configuration error, for example a faulty IP address, out of memory, load is too high, and so on). To find out the reason for the error:
1. Open web browser.
2. Go to page https://<OMS IP address>/
3. Select "Element Manager Login" and open Log Viewer.
4. Check the log for errors.
If the problem persists, see the troubleshooting documentation for how to fix the problem. If that does not provide a solution, contact the local Nokia Siemens Networks representative.
ClearingAlarm will be cleared automatically by the alarm system after its time to live has expired. This alarm has a lifetime of 10 minutes.

DN70397367 319
LTE iOMS Alarms 71054 O&M MEDIATION FAILURE
Id:0900d805809202a3Confidential
179 71054 O&M MEDIATION FAILUREProbable cause: Communication Protocol Error
Event type: Communications
Default severity: Minor
MeaningNWI3 connection problem between OMS and NetAct.
This alarm is set by OMS unit when WBTS O&M operation reply sending from OMS to NetAct has failed.
In case of NWI3 problem the WBTS O&M mediation tasks done by OMS unit cannot be performed (SW download, SW version upload, HW configuration upload).
Identifying additional information fields-
Additional information fields-
InstructionsNo actions required from the operator.
ClearingDo not clear the alarm. This alarm is cancelled automatically by the system.
After the problem in NWI3 connection has been corrected, the system will cancel the alarm only when the next O&M mediation event is successfully sent to NetAct. Thus it is normal behavior that alarm stays active for a while after the problem has been cor-rected.

320 DN70397367
LTE iOMS Alarms
Id:0900d805809150e7Confidential
71057 NWI3 NOTIFICATION MISSING
180 71057 NWI3 NOTIFICATION MISSINGProbable cause: Communication Protocol Error
Event type: Communications
Default severity: Warning
MeaningThe OMS sends notifications to the NMS when the configuration in the network element has been updated. The notification event is related to either configuration or topology changes in the network element. The alarm is set if all the notifications related to the configuration and topology changes cannot be sent to the NMS. The reason is notifica-tion handling error in the OMS or in the NMS. The alarm is set for OMS.
There might be incoherent information in the NMS about the network configuration and/or topology.
Identifying additional information fields-
Additional information fields1. Notification event type, possible values: "configuration", "topology".
InstructionsUpload the information related to the NWI3 fragment in question from the NMS to get the configuration information from network elements up-to-date.
ClearingThe alarm does not need to be cleared, but the system cancels the alarm automatically when the error situation is cleared.

DN70397367 321
LTE iOMS Alarms 71058 NE O&M CONNECTION FAILURE
Id:0900d805808f0fa4Confidential
181 71058 NE O&M CONNECTION FAILUREProbable cause: Communication Protocol Error
Event type: Communications
Default severity: Critical
MeaningThis alarm is raised when the BTS O&M connection between the OMS and a network element fails.
The managed network element is not reachable by the centralized O&M systems like the OMS or the NetAct.
Identifying additional information fields1. IP-address of BTS-O&M interface
Additional information fields-
InstructionsNormally, the alarm does not need to be cleared, but the system cancels the alarm auto-matically when the connection is working again. However, if the related network element is removed altogether from the network or its IP address is changed, it may be neces-sary to cancel the alarm manually using the Element Manager.
ClearingDo not clear the alarm unless the conditions given in the instructions on the manual clearing are fulfilled. This alarm is cancelled automatically by the system after the fault has been corrected. Alarm with certificate validation failure is cancelled automatically by the system if OMS OM security mode has been set to value 'Off' and insecure O&M con-nection has been established successfully.

322 DN70397367
LTE iOMS Alarms
Id:0900d80580953a45Confidential
71059 INCORRECT CONFIGURATION DATA IN LDAP
182 71059 INCORRECT CONFIGURATION DATA IN LDAPProbable cause: 346
Event type: x2
Default severity: 3 Major
MeaningThe LDAP (Lightweight Directory Access Protocol) holds incorrect configuration data for an application. Applications usually retrieve their configuration data from the LDAP either directly or by using configuration translation scripts that will convert the data in the LDAP into configuration files. In this case the translation script has detected that the con-figuration information is incorrect and the application cannot therefore function properly.
The application may be unusable or behave incorrectly due to incorrect configuration data stored in the LDAP. If the error happened after issuing the fsconfigure --translate_config command the application may still be operating using the old con-figuration. If the old configuration was working, the application should keep running normally until restarted or switched over to another recovery unit if running in active / standby recovery group. If the error happened after a cluster restart or after issuing the fsconfigure --activate_config command the application will be started using the incorrect configuration. In this case the application may fail or function incorrectly. It is recommended to lock the recovery unit / group in question to prevent damage to the system.
Additional information fields1. Name of the script that failed and caused the alarm
InstructionsIf the application fails or uses the incorrect configuration lock the application recovery group with the fshascli command. For example, the /TestAppl recovery group can be locked by issuing the following command:
$ fshascli --lock /TestAppl
The application configuration data in the LDAP must be corrected and the application re-activated by issuing the following fsconfigure commands:
$ fsconfigure --translate_config
$ fsconfigure --activate_config
The first command executes the configuration translation scripts that will take the cor-rected values into use. The second command executes activation scripts that will restart the application. Following these two commands, the corrected values should now be in use.
ClearingClear the alarm with an alarm management application after correcting the fault as described in the Instructions section.
Testing instructionsCreate a configuration translation script that will exit with error code in /opt/Nokia_BP/etc/configure/ and give it execution rights. If the

DN70397367 323
LTE iOMS Alarms 71059 INCORRECT CONFIGURATION DATA INLDAP
Id:0900d80580953a45Confidential
/opt/Nokia_BP/etc/configure directory does not exist it will have to be created first.
$ mkdir -p /opt/Nokia_BP/etc/configure$ echo -e '#!/bin/bash\nexit 1' > /opt/Nokia_BP/etc/configure/test_translate.sh$ chmod 755 /opt/Nokia_BP/etc/configure/test_translate.sh
Execute the configuration translation by using fsconfigure.sh script.
$ fsconfigure --translate_config
fsconfigure.sh script will execute all translation scripts in alphabetical order and will report a failure and raise an alarm once it executes the above created script.
Remove the created script once testing is complete and clear the alarm manually.
$rm -f /opt/Nokia_BP/etc/configure/test_translate.sh

324 DN70397367
LTE iOMS Alarms
Id:0900d805809539fcConfidential
71060 EXTERNAL ETHERNET SWITCH CONNEC-TION FAILURE
183 71060 EXTERNAL ETHERNET SWITCH CON-NECTION FAILUREProbable cause: 325
Event type: x1
Default severity: 5 Warning
MeaningThe LAN (Local Area Network) monitoring software has detected a fault in all the inter-faces connecting to the same external Ethernet switch.
This is a serious condition as the redundancy level of the system is lowered due to the failed switch. All traffic going through the external network can be disrupted. The user is required to check the state of the external network components immediately.
Additional information fields1. 0 - resets aren't enabled, 1 - resets are enabled.
InstructionsCheck the severity of the alarm. If the severity is WARNING, then: The system is trying to recover the interfaces connecting to the switch: no actions are needed at this point. If the severity is MAJOR, then: If the "are_resets_enabled" parameter is true in the alarm info, the system has already tried to reset the interfaces connecting to the switch and the method of repairing the fault is to replace the switch. If "are_resets_enabled" is off, however, it means that no automatic resets have been executed and manual reset could be beneficial as detailed in the hardware maintenance documentation. The name of the switch is included in the application additional info. As the switch is external, its 'location' cannot be specified. The interfaces connecting to the switch are configured into the LDAP beforehand as part of the deployment.
Refer to the hardware maintenance documentation for how to change a faulty switch. After replacing the switch and powering it on or restarting it, allow the system at least five (5) minutes to stabilise the fault information. During that time other alarms might appear and this alarm might be cancelled for a while but do not react to the other alarms.
ClearingThe system clears the alarm automatically when the fault has been corrected.
Testing instructions
1. Select an external Ethernet switch that can be disconnected. In practice the switch must be part of a redundant 'virtual router' set.
2. Disconnect all the Ethernet cables between the external switch and the Flexi cluster.3. Observe the alarm.4. Reconnect the Ethernet cables.5. Observe the cancelling of the alarm.

DN70397367 325
LTE iOMS Alarms 71061 INVALID IP CONFIGURATION
Id:0900d805809539cdConfidential
184 71061 INVALID IP CONFIGURATIONProbable cause: Configuration or Customizing Error
Event type: Processing error
Default severity: Major
MeaningThe system contains a daemon process that is responsible for creating the Internet Protocol (IP) related configuration - for example, interfaces, addresses and routes - based on the data stored in the system lightweight directory access protocol (LDAP) directories. Note that typically all or most of this configuration data is created during the system commissioning. The daemon reads the LDAP directories and creates the con-figuration typically during the start up phase of the system, for example, after the system reboot. However, the configuration may also be deliberately changed in a live network element as part of maintenance operations, for example, during an upgrade of the system. The daemon creating the configuration raises this alarm if it reads semantically illegal IP configuration data from the LDAP directories and cannot create such a config-uration. Examples of this kind of data would be a non-existing interface or a route to such an interface.
The daemon process ignores illegal data and attempts to continue the configuration using other valid data. The effect and severity of the encountered error condition depends on the actual unsuccessful configuration action.
Most likely these kinds of errors would be experienced when configuring the external connectivity (that is, external interfaces, addresses and routes) of the network element. Especially in these situations the network element would lack the required site connec-tivity and would not be able to fully provide the intended services.
InstructionsAs already indicated above, the number of potential errors in the configuration data is large. First, check carefully the additional information fields of the alarm; the daemon attempts to pinpoint the error it encountered. Try to identify whether the illegal data relates to the external connectivity configuration or some other "internal" configuration. The latter case is more difficult in the sense that it most likely requires re-commissioning of the entire system. Note that this situation would most likely occur during the first com-missioning of the system; if this error would be encountered spontaneously for example, after rebooting of an earlier commissioned network element, this would most likely indicate a corrupted LDAP directory. The distinguished name in the alarm identifies the invalid object in LDAP which caused the alarm. Try to fix the object (or delete it if fixing seems impossible) with fsip* tools. Once the problem is fixed inform NetworkManager to reload the configuration:
$ fsnetworkmanagerreload
ClearingThe system clears the alarm automatically when the fault has been corrected.
Testing instructionsCreate an invalid configuration with the fsipnet command, for example, add an IP address to a non-existing interface:
326 DN70397367
LTE iOMS Alarms
Id:0900d805809539cdConfidential
71061 INVALID IP CONFIGURATION
$ fsipnet address add 1.2.3.4/24 node CLA-0 iface NO-SUCH-IFACE addphasenwmgrstart delphase nwmgrstop owner SOME-OWNER
Inform NetworkManager to reload the configuration:
$ fsnetworkmanagerreload
NetworkManager will raise an alarm about the invalid IP address. Remove the invalid configuration once the testing is done:
$ fsipnet address delete 1.2.3.4/24 node CLA-0 iface NO-SUCH-IFACE$ fsnetworkmanagerreload

DN70397367 327
LTE iOMS Alarms 71062 IN-MEMORY DATABASE IS ERRONEOUSLYCONFIGURED
Id:0900d80580953a24Confidential
185 71062 IN-MEMORY DATABASE IS ERRONE-OUSLY CONFIGUREDProbable cause: 307
Event type: x2
Default severity: 2 Critical
MeaningConfiguration of an in-memory database is missing or invalid.
None of the in-memory databases of the node containing an instance of the erroneously configured database are available.
Additional information fields1. Reason, possible values: NoDatabase, InvalidParameter
2. Parameter name.
3. Parameter value.
InstructionsAttempt to restore the LDAP directory to the state where this problem did not exist. If the database configuration has recently been modified via the parameter management tool, undo the changes by using the parameter management tool or by restoring the LDAP Directory contents from a backup set. If the restoration did not help or cannot be done, contact your local Nokia Siemens Networks representative and provide the information you obtained from the alarm notification fields.
ClearingClear the alarm with alarm management application after correcting the fault as explained in the instructions.
Testing instructions1. Shut down the recovery group containing the in-memory database watchdog process. For example, if the recovery group is/InMemoryDBa , use the command fshascli -l -X /InMemoryDBa
2. Use the parameter management tool to modify the in-memory database configuration in the DB-fragment of the LDAP Directory. Change an attribute of the database to have an invalid value. For example, set fsdbRedundancyModel of the database to value 'errorneousRedundancyModel'.
3. Unlock the recovery group shut down in step 1: fshascli -u /InMemoryDBa

328 DN70397367
LTE iOMS Alarms
Id:0900d80580953a5aConfidential
71063 IN-MEMORY DATABASE IS FAULTY
186 71063 IN-MEMORY DATABASE IS FAULTY Probable cause: 302
Event type: x2
Default severity: 2 Critical
MeaningThe watchdog process of the in-memory database cannot perform certain operation for a database. From the watchdog process point of view the database is faulty.
The database at issue is most likely unavailable for applications. In the case of a repli-cated database, the replication is also most likely out of service and alarm 70205 is raised for this reason. If the database role is Active, the watchdog process attempts to force a switchover of configured application recovery groups by failing the recovery units running in the same node as the faulty database instance.
Additional information fields1. Reason, possible values:DBConnectFailed, StartMonitoringFailed, DBReconnectFailed, HeartbeatFailed, DBSlave.
2. Role, possible values: Active, Standby
InstructionsThis alarm is relatively general. The system logs (/var/log/master-syslog on the active CLA node) must be investigated for further details. Investigate the string "Data Manager" for error messages of the database server, and the string "TimesTenWD" for error messages of the watchdog process. The watchdog error messages are especially interesting because it contains the database ODBC-driver error messages. A typical error message is as follows:
Jun 19 08:55:57 info TA-A FSInMemoryDBaServer/TimesTenWD[16672]: DB_TestTT3 connect 1 S1000 9994 {[TimesTen][TimesTen 6.0.4 ODBC Driver][TimesTen]TT9994:
Loading data store from disk into RAM in progress -- file \"db.c\", lineno 8806, procedure \"sbDbConnect()\"}, pgrp=16629, tid=1084229984, uid=0, gid=0 SQLThread.cpp:2395 DBSlave Use the native error code (9994 in the example above) to search for additional information from documentation of the in-memory database. The error messages should be read in conjunction with the reason code: DBConnectFailed : The watchdog process is not able to connect to the data-base. The system log should contain an error ODBC-driver error message that explains the reason for the problem. StartMonitoringFailed: The watchdog process is not able to execute certain SQL statements in the database. The system log should contain an error ODBC-driver error message that explains the reason for the problem. DBReconnectFailed: The watchdog process is not able to re-connect to the database after a failed heartbeat check. The system log should contain an error ODBC-driver error message that explains the reason for the problem. HeartbeatFailed: The watchdog process is not able to execute a heartbeat check for the database. The system log should contain an error ODBC-driver error message that explains the reason for the problem. DBSlave: The heartbeat check or SQL statement execution has timed out. The system log may contain some additional information about the watchdog process. This reason is usually not so serious as others. If this alarm stays in the active alarm list and no obvious corrective actions can be derived from the system log error messages and in-memory database documentation, contact your local Nokia Siemens Networks
DN70397367 329
LTE iOMS Alarms 71063 IN-MEMORY DATABASE IS FAULTY
Id:0900d80580953a5aConfidential
representative and provide the information you obtained from the alarm notification fields and system log.
ClearingThe system clears the alarm automatically when the fault has been corrected.
Testing instructionsBy using the following steps one can corrupt both data files of a TimesTen database for testing purposes. We use standalone database DB_TestTT3 as an example database here. The storage resource name of the database is InMemoryDBa_TT_DB_TestTT3. The /InMemoryDBa is the recovery group that runs TimesTen watchdog and server for the database (and other TimesTen databases of the node).
1. Lock TimesTen recovery group with command:
# fshascli -ln /InMemoryDBa
2. Mount disc resources of the database with command:
# DBMount.sh DB_TestDB3
3. Save old data files and create corrupted ones with commands:
# pushd /var/mnt/local/ InMemoryDBa_TT_DB_TestTT3# mv DB_TestTT3.ds0 DB_TestTT3.ds0.ok# mv DB_TestTT3.ds1 DB_TestTT3.ds1.ok# echo "Rubbish" > DB_TestTT3.ds0# cp DB_TestTT3.ds0 DB_TestTT3.ds1# popd
4. Unmount disc resources of the database with the command
# DBMount.sh -unmount DB_TestTT3
5. Unlock TimesTen recovery group with the command:
# fshascli -u /InMemoryDBa
6. The alarm should be raised for the database DB_TestTT3. To correct the database, lock the recovery group again, mount the disk resources, copy the old database on top of the "corrupted" data files, unmount the disk resources and unlock the recovery group.

330 DN70397367
LTE iOMS Alarms
Id:0900d80580953a0aConfidential
71064 IN-MEMORY DATABASE SERVER IS FAULTY
187 71064 IN-MEMORY DATABASE SERVER IS FAULTY Probable cause: 302
Event type: x2
Default severity: 2 Critical
MeaningThe in-memory database server cannot be started (reason 'UnableToStart') or died unexpectedly (reason 'UnexpectedDeath').
None of the in-memory databases of the node running the failed server are available.
Additional information fields1. Reason, possible values: UnexpectedDeath, UnableToStart.
InstructionsCheck the system logs (/var/log/master-syslog on the active CLA node) for the errors issued by the database server (search for "Data Manager") and in-memory database watchdog (search for the managed object name or string "TimesTenWD"). You can alternatively or in addition look at events that occurred before this alarm was raised. Contact your local Nokia Siemens Networks representative and provide the information you obtained from the alarm notification fields and system logs.
ClearingThe system clears the alarm automatically when the fault has been corrected. When the in-memory database watchdog process also fails this alarm is cleared, but the alarm 70159 with the explanation "in-memory database server is faulty" is raised instead. The in-memory database watchdog tries a couple of times to start the server again couple of times before it, too, fails.
Testing instructions1. Log in as root user to a node running an in-memory database server.
2. Set environment variables with the command
# source /opt/Nokia/SS_TimesTen/srcipt/ttenv.sh
3. Stop TimesTen server with the command
# ttDaemonAdmin -stop

DN70397367 331
LTE iOMS Alarms 71065 IN-MEMORY DATABASE SWITCHED TOLESS RELIABLE REPLICATION PROTOCO
Id:0900d8058095390bConfidential
188 71065 IN-MEMORY DATABASE SWITCHED TO LESS RELIABLE REPLICATION PROTOCOProbable cause: 344
Event type: x4
Default severity: 5 Warning
MeaningThe replication agent of a TimesTen database turned off the return service of the repli-cation protocol used. The agent does this if the replication is stopped or a peer (replica) database does not acknowledge transactions within certain period of time. The root cause of the latter problem can be an overload situation or some other replication-related fault (alarm 70205 is raised for that). TimesTen replication is used to maintain a copy of the database for cold or hot active-standby redundancy.
The database can be used as normally but the replication protocol is less reliable and somewhat slower than normal. The slowness is caused by the fact that the database needs to write all updates to disc before it can take advantage of them. Normally it is enough to transmit the updates to the peer database; this is usually more efficient than writing to a disc. This alarm needs no immediate actions.
InstructionsCheck first if alarm 70205 is raised for the same database and if it is, follow the instruc-tions of that alarm. Otherwise, try to ascertain whether this alarm stays continuously raised or is raised and cancelled often. This alarm may be sign of performance problems in the node where the database is running, the node where the peer database is running or the local area network. Also, the timeouts related to the replication protocol may be too tight for the average workload. You may need to resolve the performance or replica-tion protocol configuration problems by co-operating with your local Nokia Siemens Networks Customer Service Center.
ClearingThe system clears the alarm automatically when the return service is turned on again.
Testing instructionsSee instructions for alarm 70205.
To raise this alarm without 70205 you must overload the instance node, peer node and/or local area network. Before overloading you should verify that the replication schema has the tightest possible timeouts and limits:
RETURN WAIT TIME 1 DISABLE RETURN ALL 1
To check current settings, use following command
ttIsql -e "repschemes; exit;"
database (see the 'Return Service Wait Time' and 'Return Service Failure Timeout Count'). If the replication schema needs to be altered, you must first request Times-TenWD to stop monitoring the database

332 DN70397367
LTE iOMS Alarms
Id:0900d8058095390bConfidential
71065 IN-MEMORY DATABASE SWITCHED TO LESS RELIABLE REPLICATION PROTOCO
/opt/Nokia/SS_DBHAforTT/bin/ttwdcli addr stop_monitoring database and stop the replication agent ttIsql -e "call ttRepStop; exit;" database The replication schema can be altered with the following command via ttIsql:
ALTER REPLICATION owner.name ALTER STORE database ON "node" SET DISABLE RETURN ALL 1 RETURN WAIT TIME 1;
DN70397367 333
LTE iOMS Alarms 71066 UNEXPECTED CONNECTIONS TO IN-MEMO-RY DATABASE HAVING STANDBY ROLE
Id:0900d80580953998Confidential
189 71066 UNEXPECTED CONNECTIONS TO IN-MEMORY DATABASE HAVING STANDBY ROLEProbable cause: 346
Event type: x2
Default severity: 4 Minor
MeaningOne or more connections exist to an in-memory database that has a standby role.
The Level of the database high availability is slightly reduced. In a case of serious rep-lication problems the in-memory database watchdog process is not able to attempt to fix the problem by duplicating the database. In this case the database is, in effect, a stand-alone database and a separate alarm (70171) is raised.
Additional information fields1. Number of unexpected connections.
2. List of process identifiers of the processes currently connected to the databases.
InstructionsWait for a while and check whether the alarm persists. If the alarm is not cleared auto-matically within minute, check the processes that are connected to the database as follows:
1. Connect to the node having the database instance as root.
2. Check identifiers of processes that are connected to the database by running thettStatus command. The command lists connections to each database in that node. Concentrate on the database of this alarm and look at connections of the type Process or Server.
3. For each type of Process connection look at the process identifier (pid) of the con-nected process and run the command ps p <pid> (<pid> is the process identifier) in same node where the database is located in order to see the connected process.
4. For each type of Server connection look at the client information below and pick process identifier (pid) and node name. Run the following command ssh <node> "ps p <pid>" (<node> is the node and <pid> process identifier you picked from the client infor-mation) to see the connected process. Contact your local Nokia Siemens Networks rep-resentative and provide the information you obtained from thettStatus and ps commands.
ClearingThe system clears the alarm automatically when the fault has been corrected.
Testing instructions1. Log in as root user to a node having an in-memory database with standby role.
2. Set environment variables with the command
# source /opt/Nokia/SS_TimesTen/srcipt/ttenv.sh

334 DN70397367
LTE iOMS Alarms
Id:0900d80580953998Confidential
71066 UNEXPECTED CONNECTIONS TO IN-MEMO-RY DATABASE HAVING STANDBY ROLE
3. Connect to the database with the command
# ttIsql <DB-name>

DN70397367 335
LTE iOMS Alarms 71067 IN-MEMORY DATABASE DISK PARTITIONPROBLEM DETECTED
Id:0900d80580953a25Confidential
190 71067 IN-MEMORY DATABASE DISK PARTI-TION PROBLEM DETECTED Probable cause: 356
Event type: x2
Default severity: 2 Critical
MeaningIn-memory database disk partition is mounted read-only or the mount point is missing.
In-memory database is not able to write to disk, checkpointing and transaction logging fail.
Additional information fields1. Reason, possible values: MountedRO, NotFound
2. Path: disk partition mount point
InstructionsIf the disk partition is mounted read-only, database high availability (HA) service for the in-memory database tries to correct the situation by restarting theInMemory recovery unit. If the mount point is missing,InMemoryDB RU restart may be tried to see if it clears the situation. IfInMemoryDB restart does not help and the alarm is raised again contact your local Nokia Siemens Networks representative and provide them with the informa-tion you obtained alarm notification's fields.
ClearingThe system clears the alarm automatically when InMemoryDB restarts or if the problem clears itself.
Testing instructions1. Use parameter management application to set suitable value for fsdbDiskStatusCheckInterval attribute of the database used for testing.
2. Remove hard disk having (non-mirrored) disk partition for in-memory database. Put HD back
3. Use mount command to check if database disk partition has been mounted read-only.
4. If the disk partition has been mounted read only, the alarm is raised after the next disk partition status check.

336 DN70397367
LTE iOMS Alarms
Id:0900d80580953a4aConfidential
71068 BLADESYSTEM FUSE OPEN
191 71068 BLADESYSTEM FUSE OPENProbable cause: 522
Event type: x5
Default severity: 3 Major
MeaningFuse open. The fuse has been tripped.
The server blade loses power and any activity on the server operating system will be lost.
Indentifying additional information fields
1. cpqRackName - customer changeable identifier used to identify the entire rack2. cpqRackCommonEnclosureName - name of the enclosure3. cpqRackCommonEnclosureFuseLocation - location description of the fuse within
the enclosure
Instructions
1. Check enclosure and/or blade power connections and reset the fuse. Check the HP BladeSystem p-Class 1U power enclosure technology brief for instructions in the manufacturer's WWW pages at http://www.hp.com.
2. If the problem persists, contact your local Nokia Siemens Networks representative.
ClearingThe system clears the alarm automatically when the fault has been corrected.
Testing instructionsDo not test this alarm as the hardware fault is not reproducible without a risk of causing permanent damage to the system.

DN70397367 337
LTE iOMS Alarms 71069 BLADESYSTEM CHASSIS POWER PROBLEM
Id:0900d8058095396bConfidential
192 71069 BLADESYSTEM CHASSIS POWER PROBLEMProbable cause: 522
Event type: x5
Default severity: 3 Major
MeaningEither the input power limit to the power subsystem AC facility has been exceeded for this enclosure, or there is a DC power problem.
The system is still usable, but the power enclosure should be checked as soon as possible to ensure fault tolerant operability.
Indentifying additional information fields
1. cpqRackName - customer changeable identifier used to identify the entire rack2. cpqRackCommonEnclosureName - name of the enclosure
Additional information fields3. Fault type (1 - Power subsystem AC facility input power exceeded, 2 - DC power problem)
Instructions
1. Check the power enclosure and power supplies. Replace any failed or degraded power supplies. Check the HP BladeSystem c3000 Enclosure Maintenance and Service Guide for instructions in the manufacturer's WWW pages at http://www.hp.com.
2. If the problem persists, contact your local Nokia Siemens Networks representative.
ClearingThe system clears the alarm automatically when the fault has been corrected.
Testing instructionsDo not test this alarm as the hardware fault is not reproducible without a risk of causing permanent damage to the system.

338 DN70397367
LTE iOMS Alarms
Id:0900d805809539a4Confidential
71070 BLADESYSTEM FAN FAILURE
193 71070 BLADESYSTEM FAN FAILUREProbable cause: 315
Event type: x5
Default severity: 2 Critical
MeaningThe enclosure fan status has been set to failed or degraded. If the status has been set to failed, then there are no other operating fans in the redundant fan group. If the status has been set to degraded, then an enclosure fan has failed but other fans in the redun-dant fan group are still operating.
This may result in overheating of the enclosure.
Indentifying additional information fields
1. cpqRackName - customer changeable identifier used to identify the entire rack2. cpqRackCommonEnclosureName - name of the enclosure3. cpqRackCommonEnclosureFanLocation - location description of the fan within the
enclosure
Additional information fields4. Enclosure fan status: Degraded/Failed
Instructions
1. Replace the fan as soon as possible. Check the HP BladeSystem c3000 Enclosure Maintenance and Service Guide for instructions in the manufacturer's WWW pages at http://www.hp.com.
2. If the problem persists, contact your local Nokia Siemens Networks representative.
ClearingThe system clears the alarm automatically when the fault has been corrected.
Testing instructionsDo not test this alarm as the hardware fault is not reproducible without a risk of causing permanent damage to the system.

DN70397367 339
LTE iOMS Alarms 71071 BLADESYSTEM INTERCONNECT FAILURE
Id:0900d80580953a5fConfidential
194 71071 BLADESYSTEM INTERCONNECT FAILUREProbable cause: 519
Event type: x5
Default severity: 3 Major
MeaningThe interconnect status has been set to 'failed' or 'degraded' or the interconnect has been removed.
The connectability of the system has been compromised.
Indentifying additional information fields
1. cpqRackName - customer changeable identifier used to identify the entire rack2. cpqRackNetConnectorEnclosureName - name of the enclosure3. cpqRackNetConnectorLocation - location of the network connector within the enclo-
sure
Additional information fields4. Interconnect status (1 - degraded, 2 - failed, 3 - removed)
Instructions
1. Replace the interconnect as soon as possible. Check the HP BladeSystem c3000 Enclosure Maintenance and Service Guide for instructions in the manufacturer's WWW pages at http://www.hp.com.
2. If the problem persists, contact your local Nokia Siemens Networks representative.
ClearingThe system clears the alarm automatically when the fault has been corrected.
Testing instructionsDo not test this alarm as the hardware fault is not reproducible without a risk of causing permanent damage to the system.

340 DN70397367
LTE iOMS Alarms
Id:0900d8058095397eConfidential
71072 BLADESYSTEM LINE VOLTAGE PROBLEM
195 71072 BLADESYSTEM LINE VOLTAGE PROBLEM Probable cause: 522
Event type: x5
Default severity: 2 Critical
MeaningThe rack power supply has detected an input line voltage problem.
If the alarm is set off constantly, there is a severe hardware problem and the server blade may behave unexpectedly.
Indentifying additional information fields
1. cpqRackName - customer changeable identifier used to identify the entire rack2. cpqRackPowerSupplyEnclosureName - name of the power supply enclosure in
which this power supply resides3. cpqRackPowerSupplyPosition - position of the power supply within the power enclo-
sure
Additional information fields4. cpqRackPowerSupplyInputLineStatus - status of line input power (1 - noError, 2 - lin-eOverVoltage, 3 - lineUnderVoltage, 4 - lineHit", 5 - brownout, 6 - linePowerLoss
Instructions
1. Check the power input for the power supply and replace any failed power supplies. Check the HP BladeSystem c3000 Enclosure Maintenance and Service Guide for instructions in the manufacturer's WWW pages at http://www.hp.com.
2. If the problem persists, contact your local Nokia Siemens Networks representative.
ClearingThe system clears the alarm automatically when the fault has been corrected.
Testing instructionsDo not test this alarm as the hardware fault is not reproducible without a risk of causing permanent damage to the system.

DN70397367 341
LTE iOMS Alarms 71073 BLADESYSTEM ONBOARD ADMINISTRA-TOR REDUNDANCY LOST
Id:0900d805809538d5Confidential
196 71073 BLADESYSTEM ONBOARD ADMINIS-TRATOR REDUNDANCY LOST Probable cause: 519
Event type: x5
Default severity: 3 Major
MeaningThe Onboard Administrator has been removed or its status has been set to 'degraded'.
This alarm signifies that an Onboard Administrator has been removed or it has failed but the other Onboard Administrator is still operating.
Indentifying additional information fields
1. cpqRackName - customer changeable identifier used to identify the entire rack2. cpqRackCommonEnclosureName - name of the enclosure3. cpqRackCommonEnclosureManagerLocation - location description of the manager
within the enclosure
Additional information fields4. Onboard Administrator status : (1 - degraded, 3 - removed)
Instructions
1. Replace the Onboard Administrator as soon as possible. Check the HP BladeSys-tem c3000 Enclosure Maintenance and Service Guide for instructions in the manu-facturer's WWW pages at http://www.hp.com.
2. If the problem persists, contact your local Nokia Siemens Networks representative.
ClearingThe system clears the alarm automatically when the fault has been corrected.
Testing instructionsDo not test this alarm as the hardware fault is not reproducible without a risk of causing permanent damage to the system.

342 DN70397367
LTE iOMS Alarms
Id:0900d80580953a0eConfidential
71074 BLADESYSTEM POWER CHASSIS NOT LOAD BALANCED
197 71074 BLADESYSTEM POWER CHASSIS NOT LOAD BALANCEDProbable cause: 522
Event type: x5
Default severity: 2 Critical
MeaningPower subsystem not load balanced.
The system is still usable, but the power enclosure should be checked as soon as possible to ensure fault tolerant operability.
Indentifying additional information fields
1. cpqRackName - customer changeable identifier used to identify the entire rack2. cpqRackCommonEnclosureName - name of the enclosure
Instructions
1. Check the power enclosure and power supplies. Replace any failed or degraded power supplies. Add additional power supplies if needed. Check the HP BladeSys-tem c3000 Enclosure Maintenance and Service Guide for instructions in the manu-facturer's WWW pages at http://www.hp.com.
2. If the problem persists, contact your local Nokia Siemens Networks representative.
ClearingThe system clears the alarm automatically when the fault has been corrected.
Testing instructionsDo not test this alarm as the hardware fault is not reproducible without a risk of causing permanent damage to the system.
DN70397367 343
LTE iOMS Alarms 71075 BLADESYSTEM POWER ON FAILED
Id:0900d80580953a08Confidential
198 71075 BLADESYSTEM POWER ON FAILEDProbable cause: 522
Event type: x5
Default severity: 2 Critical
MeaningInadequate power to turn on.
There is not enough power to power up the server blade, or not enough power to power it up while maintaining redundancy for the other blades in the enclosure.
Indentifying additional information fields
1. cpqRackName - customer changeable identifier used to identify the entire rack2. cpqRackServerBladeEnclosureName - name of the enclosure which contains the
blade3. cpqRackServerBladePosition - position or slot number of the server blade within the
server enclosure
Additional information fields4. Fault type (1 - not enough power for redundancy, 2 - not enough power to power on, 3 - server enclosure micro-controller not found, 4 - power enclosure micro-controller not found)
Instructions
1. Check power connections or add power supplies. Check the HP BladeSystem c3000 Enclosure Maintenance and Service Guide for instructions in the manufac-turer's WWW pages at http://www.hp.com.
2. If the problem persists, contact your local Nokia Siemens Networks representative.
ClearingThe system clears the alarm automatically when the fault has been corrected.
Testing instructionsDo not test this alarm as the hardware fault is not reproducible without a risk of causing permanent damage to the system.

344 DN70397367
LTE iOMS Alarms
Id:0900d80580953a59Confidential
71076 BLADESYSTEM POWER SHED AUTO SHUT-DOWN
199 71076 BLADESYSTEM POWER SHED AUTO SHUTDOWNProbable cause: 522
Event type: x5
Default severity: 3 Major
MeaningThe server blade was shutdown due to a lack of power.
The server blade is out of use.
Indentifying additional information fields
1. cpqRackName - customer changeable identifier used to identify the entire rack2. cpqRackServerBladeEnclosureName - name of the enclosure which contains the
blade3. cpqRackServerBladePosition - position or slot number of the server blade within the
server enclosure
Instructions
1. Check power connections or add power supplies. Check the HP BladeSystem c3000 Enclosure Maintenance and Service Guide for instructions in the manufac-turer's WWW pages at http://www.hp.com.
2. If the problem persists, contact your local Nokia Siemens Networks representative.
ClearingThe system clears the alarm automatically when the fault has been corrected.
Testing instructionsDo not test this alarm as the hardware fault is not reproducible without a risk of causing permanent damage to the system.

DN70397367 345
LTE iOMS Alarms 71077 BLADESYSTEM POWER SUBSYSTEM NOTREDUNDANT
Id:0900d805809539e0Confidential
200 71077 BLADESYSTEM POWER SUBSYSTEM NOT REDUNDANTProbable cause: 522
Event type: x5
Default severity: 2 Critical
MeaningRack power supply not redundant.
The rack power subsystem is no longer in a redundant state.
Indentifying additional information fields
1. cpqRackName - customer changeable identifier used to identify the entire rack2. cpqRackPowerEnclosureName - name of the power enclosure
Instructions
1. Replace any failed or degraded power supplies to return the system to a redundant state. Check the HP BladeSystem c3000 Enclosure Maintenance and Service Guide for instructions in the manufacturer's WWW pages at http://www.hp.com.
2. If the problem persists, contact your local Nokia Siemens Networks representative.
ClearingThe system clears the alarm automatically when the fault has been corrected.
Testing instructionsDo not test this alarm as the hardware fault is not reproducible without a risk of causing permanent damage to the system.

346 DN70397367
LTE iOMS Alarms
Id:0900d805809539ceConfidential
71078 BLADESYSTEM POWER SUBSYSTEM OVERLOAD CONDITION
201 71078 BLADESYSTEM POWER SUBSYSTEM OVERLOAD CONDITIONProbable cause: 522
Event type: x5
Default severity: 2 Critical
MeaningThe rack power subsystem has an overload condition.
The system is still usable, but in order to ensure full fault tolerant operability any failed power supplies should be replaced as soon as possible.
Indentifying additional information fields
1. cpqRackName - customer changeable identifier used to identify the entire rack2. cpqRackPowerEnclosureName - name of the power enclosure
Instructions
1. Replace any failed power supplies as soon as possible to return the system to a redundant state. Check the HP BladeSystem c3000 Enclosure Maintenance and Service Guide for instructions in the manufacturer's WWW pages at http://www.hp.com.
2. If the problem persists, contact your local Nokia Siemens Networks representative.
ClearingThe system clears the alarm automatically when the fault has been corrected.
Testing instructionsDo not test this alarm as the hardware fault is not reproducible without a risk of causing permanent damage to the system.

DN70397367 347
LTE iOMS Alarms 71079 BLADESYSTEM POWER SUPPLY FAILURE
Id:0900d805809539d3Confidential
202 71079 BLADESYSTEM POWER SUPPLY FAILURE Probable cause: 522
Event type: x5
Default severity: 2 Critical
MeaningA power supply has been removed or the power supply status has been set to 'failed' or 'degraded'.
Depending on the alarm severity, this alarm signifies that a power supply has been removed (WARNING severity), degraded (MAJOR) or failed (CRITICAL).
Indentifying additional information fields
1. cpqRackName - customer changeable identifier used to identify the entire rack2. cpqRackPowerSupplyEnclosureName - name of the power supply enclosure in
which this power supply resides3. cpqRackPowerSupplyPosition - position of the power supply within the power enclo-
sure
Additional information fields4. Power supply status (1 - degraded, 2 - failed, 3 - removed)
Instructions
1. Replace the power supply as soon as possible. Check the HP BladeSystem c3000 Enclosure Maintenance and Service Guide for instructions in the manufacturer's WWW pages at http://www.hp.com.
2. If the problem persists, contact your local Nokia Siemens Networks representative.
ClearingThe system clears the alarm automatically when the fault has been corrected.
Testing instructionsDo not test this alarm as the hardware fault is not reproducible without a risk of causing permanent damage to the system.
348 DN70397367
LTE iOMS Alarms
Id:0900d80580953a5eConfidential
71080 BLADESYSTEM REMOTE INSIGHT BATTERY FAILED
203 71080 BLADESYSTEM REMOTE INSIGHT BATTERY FAILED Probable cause: 315
Event type: x5
Default severity: 2 Critical
MeaningThe Remote Insight battery has failed.
iLO 2 remote control and management functionality may become unavailable.
Additional information fields1. Fault type (1 - unknown), 2 - degraded , 3 - failed)
Instructions
1. Replace the Remote Insight battery. Check the HP ProLiant BL465c Server Blade Maintenance and Service Guide for instructions in the manufacturer's WWW pages at http://www.hp.com.
2. If the problem persists, contact your local Nokia Siemens Networks representative.
ClearingThe system clears the alarm automatically when the fault has been corrected.
Testing instructionsDo not test this alarm as the hardware fault is not reproducible without a risk of causing permanent damage to the system.

DN70397367 349
LTE iOMS Alarms 71081 BLADESYSTEM REMOTE INSIGHT ERROR
Id:0900d80580953940Confidential
204 71081 BLADESYSTEM REMOTE INSIGHT ERROR Probable cause: 315
Event type: x5
Default severity: 3 Major
MeaningThe host operating system has detected an error in the Remote Insight/ Integrated Lights-Out interface or the Remote Insight/ Integrated Lights-Out firmware has detected a Remote Insight self test error.
The Remote Insight/ Integrated Lights-Out control and management functionality may not be completely available.
Indentifying additional information fields1. Fault type ( 1 - self test error detected by iLO2, 2 - interface error detected by the host operation system)
Additional information fields2. Interface condition ( 1- unknown, 2- degraded, 3 - failed, N/A for fault type 1)
3. Self test error flags - a collection of post error flags. N/A for fault type 2. Displayed in format 16:x-15:x-:14:x...... -1:x:0:x, where each bit (x) has the following meaning when it is on (1): Bit 16: I2C error Bit 15: EEPROM error Bit 14: SRAM error Bit 13: CPLD error. Bit 12: Mouse interface error. Bit 11: NIC Error Bit 10: PCMCIA Error Bit 9: Video Error Bit 8: NVRAM write / read / verify error. Bit 7: NVRAM interface error. Bit 6: Battery interface error. Bit 5: Keyboard interface error. Bit 4: Serial port UART error. Bit 3: Modem UART error. Bit 2: Modem firmware error. Bit 1: Memory test error. Bit 0: Busmaster I/O read error.
InstructionsContact your local Nokia Siemens Networks representative.
ClearingThe system clears the alarm automatically when the fault has been corrected.
Testing instructionsDo not test this alarm as the hardware fault is not reproducible without a risk of causing permanent damage to the system.

350 DN70397367
LTE iOMS Alarms
Id:0900d80580953983Confidential
71082 BLADESYSTEM REMOTE INSIGHT POWER OUTAGE
205 71082 BLADESYSTEM REMOTE INSIGHT POWER OUTAGEProbable cause: 315
Event type: x5
Default severity: 2 Critical
MeaningThe Remote Insight/ Integrated Lights-Out firmware has detected server power failure.
The server blade is out of power.
Instructions
1. Check that the blade has not been powered off and verify the power inputs and sup-plies.
2. If the problem persists, contact your local Nokia Siemens Networks representative.
ClearingClear the alarm with an alarm management application after correcting the fault as pre-sented in INSTRUCTIONS.
Testing instructionsDo not test this alarm as the hardware fault is not reproducible without a risk of causing permanent damage to the system.

DN70397367 351
LTE iOMS Alarms 71083 BLADESYSTEM TEMPERATURE OUT OFLIMIT
Id:0900d805809539e3Confidential
206 71083 BLADESYSTEM TEMPERATURE OUT OF LIMIT Probable cause: 315
Event type: x5
Default severity: 2 Critical
MeaningThe enclosure temperature status has been set to 'failed' or 'degraded'. If the status has been set to degraded, an enclosure temperature sensor has been tripped indicating a possible overheat condition. If the status has been set to failed, an enclosure tempera-ture sensor has been tripped indicating an overheat condition.
If the alarm is set off constantly, there is a severe temperature-related problem and the server blade may behave unexpectedly.
Indentifying additional information fields
1. cpqRackName - customer changeable identifier used to identify the entire rack2. cpqRackCommonEnclosureName - name of the enclosure3. cpqRackCommonEnclosureTempLocation - location description of the temperature
sensor within the enclosure
Additional information fields4. Enclosure temperature status (1- degraded, 2 failed)
Instructions
1. Shutdown the enclosure and possibly the rack as soon as possible. Ensure all fans are working properly and that air flow in the rack has not been blocked.
2. If the problem persists, contact your local Nokia Siemens Networks representative.
ClearingThe system clears the alarm automatically when the fault has been corrected.
Testing instructionsDo not test this alarm as the hardware fault is not reproducible without a risk of causing permanent damage to the system.

352 DN70397367
LTE iOMS Alarms
Id:0900d80580953a23Confidential
71084 BLADESYSTEM UNKNOWN POWER CON-SUMPTION
207 71084 BLADESYSTEM UNKNOWN POWER CONSUMPTION Probable cause: 522
Event type: x5
Default severity: 3 Major
MeaningThere is an unknown power consumer drawing power.
Unknown power consumption may result in degraded chassis power supply redundancy or total loss of power.
Indentifying additional information fields1. cpqRackName - customer changeable identifier used to identify the entire rack
Instructions
1. Check the power enclosure and power supplies. Replace any failed or degraded power supplies. Check the HP BladeSystem c3000 Enclosure Maintenance and Service Guide for instructions in the manufacturer's WWW pages at http://www.hp.com.
2. If the problem persists, contact your local Nokia Siemens Networks representative.
ClearingThe system clears the alarm automatically when the fault has been corrected.
Testing instructionsDo not test this alarm as the hardware fault is not reproducible without a risk of causing permanent damage to the system.
DN70397367 353
LTE iOMS Alarms 71086 MAJOR SW UPGRADE DATA IMPORT FAIL-URE
Id:0900d80580953933Confidential
208 71086 MAJOR SW UPGRADE DATA IMPORT FAILURE Probable cause: Invalid parameter
Event type: Processing error
Default severity: Critical
MeaningImporting configuration data to LDAP database has partly failed when performing major software upgrade.
The seriousness of the alarm varies depending on the data, which importing has failed. It may vary from serious problem(s) in cluster availability to loss of configuration data of single subsystem.
Identifying additional information fields
1. Import phase: pre / post.2. The name of failed import-utility (maps to subsystem).
Additional information fields-
Instructions
1. Log into the cluster.In worst case, you might need a console connection to do this.
2. Check from additional information field in which phase the import has failed. Usually pre-phase indicates a more serious problem.
3. Check the fp_import and postconfig logs in /var/log directory for more detailed information.
4. After fault analysis and corrective action(s), execute fsswcli --major --postconfigure again.
ClearingClear the alarm with an alarm management application after correcting the fault as pre-sented in instructions field.
Testing instructions
1. Bring dummy post-import script to the system. Script should return non-zero return value on its execution.
2. Perform the major software upgrade. Procedure details can be found from the upgrade customer documentation.
3. The alarm should be raised.after running the fsswcli --major --postconfigure command in the new system.
4. Remove the dummy script from respective directory and re-run the fsswcli --major --postconfigure command.

354 DN70397367
LTE iOMS Alarms
Id:0900d805809539d1Confidential
71087 NTP TIME SYNCHRONISATION LEADING TO LDAP REPLICATION FAILURE
209 71087 NTP TIME SYNCHRONISATION LEADING TO LDAP REPLICATION FAILUREProbable cause: Configuration or Customizing Error
Event type: Processing error
Default severity: Warning
MeaningIf the time of the cluster differs from the time of the NTP server (Network Time Protocol) the time of the cluster will be synchronised with the NTP server This causes the time of the cluster to shift either forwards or backwards and may lead to the failure in replication of the LDAP server. Alarm is generated at this point.
For example, if the cluster is commissioned with an NTP Server in UK (GMT) and with a FEWS (field engineering workstation) from a location with time zone GMT+2, the time will be shifted 2 hours backwards when the cluster boots first time and the cluster syn-chronises its time with the NTP Server.
Identifying additional information fields
1. Import phase: pre / post.2. The name of failed import-utility (maps to subsystem).
Additional information fields-
Instructions
1. Log into the cluster.2. Go to the node where the Directory recovery group is running:
$ ssh Directory
3. Take a backup from the primary LDAP server and store it to a file:$ fsLDAPBackupCreate -p -v > ldap.txt
4. Use the backup taken from the Primary LDAP server to restore the secondary LDAP server in the node where the Directory is running:
$ fsLDAPBackupRestore -s -v < ldap.txt
5. If there is another CLA node (non-Directory CLA node) in the deployment, restore the secondary LDAP server in that node with the backup taken from the Primary LDAP server.For example:
$ fsLDAPBackupRestore -s -n CLA-1 -v < ldap.txt
ClearingClear the alarm with an alarm management application after correcting the fault as pre-sented in Instructions.
DN70397367 355
LTE iOMS Alarms 71087 NTP TIME SYNCHRONISATION LEADING TOLDAP REPLICATION FAILURE
Id:0900d805809539d1Confidential
Testing instructions
1. Check the time of the cluster.For example: date
$ Thu Feb 21 08:03:47 EET 2008
2. Set the time of the cluster 2 hours ahead of the time of the NTP server.For example: date 02211000
3. Synchronise the cluster with the NTP serverFor example: fshascli -rn /ClusterNTPThis will raise the alarm.
4. Check the time of the cluster. It should be synchronised with the time of the NTP server.For example: date
$ Thu Feb 21 08:08:47 EET 2008
Note that the replication of the LDAP server can fail due to this. Thus, operator has to follow the instructions and clear the alarm after testing it.

356 DN70397367
LTE iOMS Alarms
Id:0900d80580953941Confidential
71089 FAILING SIMPLE EXECUTIVE CORES THRESHOLD EXCEEDED
210 71089 FAILING SIMPLE EXECUTIVE CORES THRESHOLD EXCEEDEDProbable cause: Underlying resource unavailable
Event type: Processing error
Default severity: Critical
MeaningThe number of faulty simple executive cores in the Octeon CPU has exceeded the value specified in the fshaMaxCoresFailedBeforeAlarm in FSHANodeType object.
The application images running in the faulty simple executive cores might be faulty or stuck; this means in practice that those cores might no longer be functioning. If the number of faulty cores exceeds the configured threshold for a time specified in the cluster-wide variable fshaCoreToNodeFaultDelaySeconds, which is overridable in a FSHANodeType object, then all the nodes in the CPU are reported as faulty by the light arbitrator process. The light arbitrator will also ask HAS to stop feeding the HW watchdog - which will result in the resetting of the CPU.
Additional information fields1. thresholdValue - contains the value configured in the fshaMaxCoresFailedBeforeAlarm attribute.
2. faultToNodeDelay - contains the value configured in the fshaCoreToNodeFaultDelaySeconds attribute.
3. numberOfFailingCores - contains the number of faulty SE-cores when the alarm was raised.
InstructionsThis alarm is raised to indicate a serious problem in the relevant CPU. When this alarm is raised the light arbitrator will set a timer with a value equal to fshaCoreToNodeFualtDelaySeconds. If the timer expires and the number of faulty cores is still above the maximum threshold, this will result in resetting the whole CPU. When the CPU is restarted the previously raised alarms are automatically cleared.
ClearingThe alarm is automatically cleared by the light arbitrator process when the number of faulty cores drops below the maximum threshold defined in the fshaMaxCoresFailedBeforeAlarm attribute.
Testing InstructionsTo generate the alarm, a simple-executive LISA-image is to be implemented. This image should be controllable so that it is possible to disable the sending of the I am alive message. The image should be deployed on multiple SE-cores.
Preconditions:
• Octeon FlexiPlatform cluster is commissioned and running. • LISA is installed and is running • A testing LISA-image is running in all of the SE-cores.
Execution scenario:

DN70397367 357
LTE iOMS Alarms 71089 FAILING SIMPLE EXECUTIVE CORESTHRESHOLD EXCEEDED
Id:0900d80580953941Confidential
1. Disable the sending of the I am alive message from the testing LISA-image which is running on a number of SE-cores (make sure that the number of SE-cores exceeds the value defined in the fshaMaxCoresFailedBeforeAlarm attribute).
2. Check that the alarm was raised with the correct data.

358 DN70397367
LTE iOMS Alarms
Id:0900d80580953943Confidential
71090 SIMPLE EXECUTIVE CORE FAILURE
211 71090 SIMPLE EXECUTIVE CORE FAILUREProbable cause: Underlying resource unavailable
Event type: Processing error
Default severity: Critical
MeaningThe simple executive core in the Octeon environment is found to be faulty because eithera) it did not send an I am alive message or b) it failed to update the counter corresponding to the core in the shared memory for a configurable length of time.
The application image which is running in the simple executive core might be faulty or stuck. In practice this means that the core might no longer be functioning. If the applica-tion image starts re-sending the I am alive messages with the correct counter updated, then this alarm is cleared. The time limit after which the alarm is raised if no I am alive messages are received or if the messages do not contain the correct count is determined by the value of the HAS cluster-wide variable fshaCoreFaultyDelaySeconds, which is overridable in a FSHANodeType object.
Additional information fields1. failureType.
Possible values for failure type: 1 - Light arbitrator did not receive I am alive message, 2 - Light arbitrator received the I am alive message but the core specific counter was not updated.
InstructionsDepending on the problem type, (see Application Additional Info) the cause for the problem can be:
• The light arbitrator process which is running in the Linux node did not receive the I am alive message within the configurable time limit.
• The light arbitrator process which is running in the Linux node has received the I am alive message but the message does not contain an updated core counter.
ClearingThe alarm is automatically cleared by the light arbitrator process when the core starts sending the "I am alive" message with correct core-specific counter.
Testing InstructionsTo generate the alarm, a simple-executive LISA-image is to be implemented. This image should be controllable so that it is possible to disable the sending of the I am alive message. The image should be deployed on multiple SE-cores.
Preconditions:
• Octeon FlexiPlatform cluster is commissioned and running. • LISA is installed and is running • A testing LISA-image is running in all of the SE-cores.
Execution scenario:

DN70397367 359
LTE iOMS Alarms 71090 SIMPLE EXECUTIVE CORE FAILURE
Id:0900d80580953943Confidential
1. Disable the sending of the I am alive message from the testing LISA-image which is running in SE-cores.
2. Wait till the timeout described in fshaCoreFaultyDelaySeconds has elapsed.
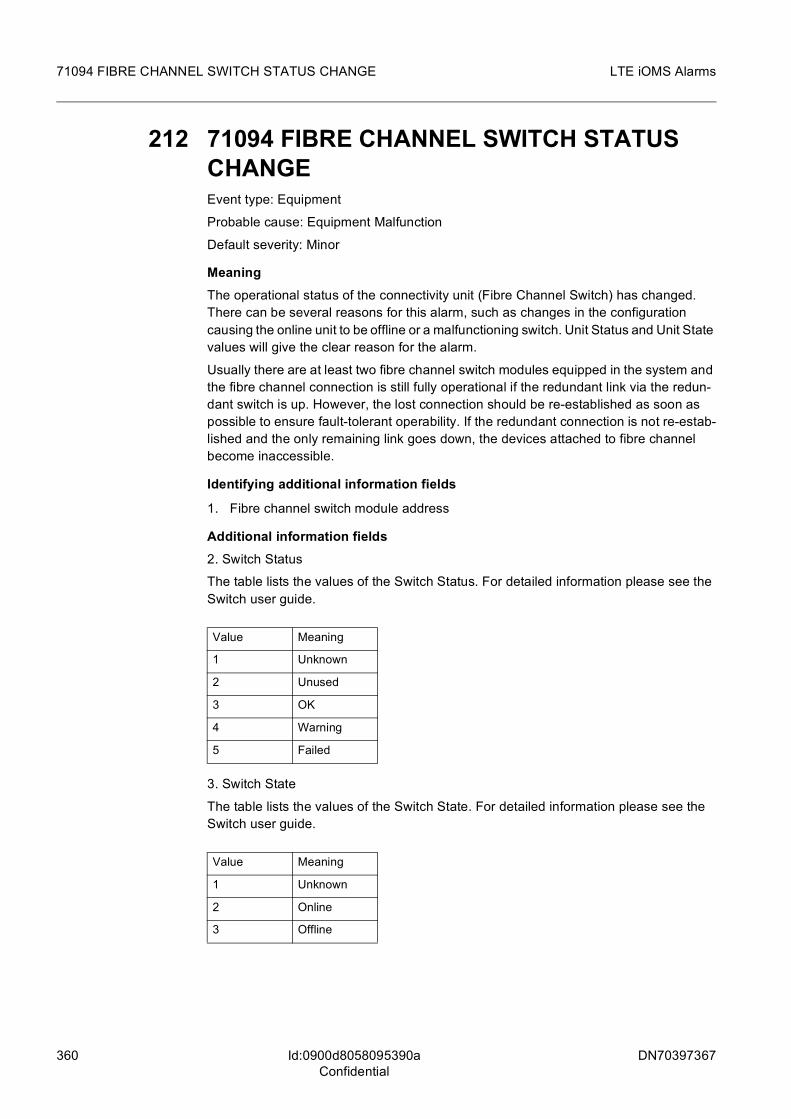
360 DN70397367
LTE iOMS Alarms
Id:0900d8058095390aConfidential
71094 FIBRE CHANNEL SWITCH STATUS CHANGE
212 71094 FIBRE CHANNEL SWITCH STATUS CHANGEEvent type: Equipment
Probable cause: Equipment Malfunction
Default severity: Minor
MeaningThe operational status of the connectivity unit (Fibre Channel Switch) has changed. There can be several reasons for this alarm, such as changes in the configuration causing the online unit to be offline or a malfunctioning switch. Unit Status and Unit State values will give the clear reason for the alarm.
Usually there are at least two fibre channel switch modules equipped in the system and the fibre channel connection is still fully operational if the redundant link via the redun-dant switch is up. However, the lost connection should be re-established as soon as possible to ensure fault-tolerant operability. If the redundant connection is not re-estab-lished and the only remaining link goes down, the devices attached to fibre channel become inaccessible.
Identifying additional information fields
1. Fibre channel switch module address
Additional information fields2. Switch Status
The table lists the values of the Switch Status. For detailed information please see the Switch user guide.
3. Switch State
The table lists the values of the Switch State. For detailed information please see the Switch user guide.
Value Meaning
1 Unknown
2 Unused
3 OK
4 Warning
5 Failed
Value Meaning
1 Unknown
2 Online
3 Offline

DN70397367 361
LTE iOMS Alarms 71094 FIBRE CHANNEL SWITCH STATUS CHANGE
Id:0900d8058095390aConfidential
Instructions
1. If the value of Switch Status is other than OK, check that all fibre channel cables at the back of the chassis are properly connected to their corresponding fibre channel switch modules.
2. If the problem still persists, replace the affected fibre channel switch module in the chassis.
3. If the previous steps have not solved the situation, contact your local Nokia Siemens Networks representative.
ClearingThe alarm is automatically cleared by the system if the fibre channel switch recovers from the malfunction. If the switch module needs to be replaced, the alarm has to be cleared manually.
Testing instructions
fDo not test this alarm in a live system. The changes in the status may cause permanent damage to the system.
1. Turn the whole switch offline (using the FC CLI provided by the Switch OS).2. See that the alarm is raised.3. Turn the switch online.4. Verify that the alarm is cleared after the clearing delay.

362 DN70397367
LTE iOMS Alarms
Id:0900d80580953a4cConfidential
71095 FIBRE CHANNEL SWITCH PORT STATUS CHANGE
213 71095 FIBRE CHANNEL SWITCH PORT STATUS CHANGEEvent type: Equipment
Probable cause: Equipment Malfunction
Default severity: Minor
MeaningThe protocol status for some of the switch ports has changed. There can be several reasons for this alarm, such as changes in the configuration that make the port unable to process the protocol, or manually/automatically isolating the port from loop or fabric. Port Status and Port State values will give the clear reason for raising this alarm.
Usually there are at least two fibre channel switch modules equipped, and the fibre channel connection is still fully operational if the redundant link via the redundant switch is up. However, the redundant connection should be re-established as soon as possible to ensure fault tolerant operability. If the redundant connection is not re-established and the only remaining link goes down, the devices attached to fibre channel become inac-cessible.
Identifying additional information fields
1. Fibre channel switch module address2. Fibre channel port ID
Additional information fields
1. Port StatusThe table lists the values of the Port Status. For detailed information please see the Switch user guide.
2. Port StateThe table lists the values of the Port State. For detailed information please see the Switch user guide.
Value Meaning
1 Unknown
2 Unused
3 OK
4 Warning
5 Failure
6 Notparticipat-ing
7 Initializing
8 Bypass
Value Meaning
1 Unknown

DN70397367 363
LTE iOMS Alarms 71095 FIBRE CHANNEL SWITCH PORT STATUSCHANGE
Id:0900d80580953a4cConfidential
Instructions
1. If the value of Port Status is other than OK, the reason for triggering this alarm has to be studied properly. If the cause of the alarm appears to be in the application software or configuration, it has to be corrected.
2. If the problem still persists, replace the affected fibre channel switch module in the chassis.
3. If the previous steps have not solved the situation, contact your local Nokia Siemens Networks representative.
ClearingThe alarm is automatically cleared by the system when the corresponding fibre channel port comes up. If the switch module needs to be replaced, the alarm has to be cleared manually.
Testing instructions
fDo not test this alarm in a live system. The changes in the port status may cause per-manent damage to the system.
1. Disable a single switch port in use (using the FC CLI provided by the Switch OS) 2. Observe that the alarm is raised.3. Enable the switch port that was disabled before.4. Verify that the alarm is cleared after the clearing delay.
2 Online
3 Offline
4 Bypassed

364 DN70397367
LTE iOMS Alarms
Id:0900d805809202a5Confidential
71101 OMS ALARM UPLOAD FROM NE FAILED
214 71101 OMS ALARM UPLOAD FROM NE FAILEDProbable cause: Communication Protocol Error
Event type: Communications
Default severity: Minor
MeaningAlarm upload from NE to OMS has failed.
Active alarm situation may be out of sync between NE and OMS.
Identifying additional information fields1. NE info
Additional information fields1. Explanation of the fault observed in alarm upload scenario between NE and OMS.
Possible values are:
- No response from NE
- NE disconnected before upload finished
- NE sent AckNack(<NackReasonCode>) NackReason=<NackReasonText>
Instructions1. Check the cause of failure from Application Additional Information field.2. If the cause of failure indicates BTS O&M connection problem, then perhaps some-thing can be checked from BTS Site Manager.
ClearingManual clearing is not necessary.Alarm is cleared automatically when alarm upload from NE to OMS next time succeeds or when Time-to-Live has passed.

DN70397367 365
LTE iOMS Alarms 71102 ALARM FROM NE CORRUPTED
Id:0900d80580829117Confidential
215 71102 ALARM FROM NE CORRUPTEDProbable cause: Communication Protocol Error
Event type: Quality of service
Default severity: Warning
MeaningOMS could not decode alarm message from NE.
OMS does not have working alarm interface to that NE.
Identifying additional information fieldsNE moid, for example: "RNC-23"
Additional information fields-
InstructionsPossible reason is false BTSOM interface version. Contact Nokia Siemens Networks representative.
ClearingDo not clear the alarm. OMS will clear the alarm automatically.

366 DN70397367
LTE iOMS Alarms
Id:0900d805807f6c7aConfidential
71103 ID CONFLICT IN BTS O&M CONNECTION
216 71103 ID CONFLICT IN BTS O&M CONNEC-TIONProbable cause: Communication Protocol Error
Event type: Communications
Default severity: Major
MeaningTwo or more network elements, that try to communicate to OMS, have the same network element id.
OMS can not communicate with the network elements that have the same id.
Identifying additional information fields1. Conflicting network element ID
Additional information fieldsIP address of the network element.
InstructionsGive unique id for the network elements.
ClearingClear the alarm when ID CONFLICT problem has been solved.
DN70397367 367
LTE iOMS Alarms 71104 NE CONNECTION REJECTED
Id:0900d805808c787bConfidential
217 71104 NE CONNECTION REJECTEDProbable cause: Configuration or Customizing Error
Event type: Processing error
Default severity: Major
MeaningOMS has rejected connection establishment from NE. Reason for rejection is either that OMS capacity has been exceeded or that NE tried to open connection to a secondary OMS.
Network element connection was rejected.
Identifying additional information fields-
Additional information fieldsReason for rejecting NE connection opening.
Instructions-
ClearingDo not clear the alarm. The system cancels the alarm automatically afterits lifetime has elapsed.

368 DN70397367
LTE iOMS Alarms
Id:0900d8058094d83dConfidential
71105 BTS O&M TOTAL CONNECTION LIMIT EX-CEEDED
218 71105 BTS O&M TOTAL CONNECTION LIMIT EXCEEDEDProbable cause: Configuration or Customizing Error
Event type: Processing error
Default severity: Major
MeaningNumber of connected network elements has exceeded the maximum allowed value.
Further connection attempts to the OMS are rejected.
Identifying additional information fields-
Additional information fields-
InstructionsDisconnect the network elements which exceeded the maximum allowed connection limit.
ClearingDo not clear the alarm. The system cancels the alarm automatically after its lifetime has elapsed or the problem has been solved.
DN70397367 369
LTE iOMS Alarms 71107 INSECURE O&M CONNECTION
Id:0900d805808f0fc0Confidential
219 71107 INSECURE O&M CONNECTIONProbable cause: UNSPECIFIED_REASON
Event type: Communications
Default severity: Minor
MeaningNetwork element has established a connection with insecure protocol, while the mediator is configured in "probing" security mode. In "probing" mode the security con-nections are preferred, i.e. the alarm may be an indication of a failure in setting up a secure connection.
The O&M mediator detects an unsecure connection from a network element, while the mediator is configured in "probing" security mode
Identifying additional information fields-
Additional information fields-
InstructionsThe alarm may be an indication of a failure in setting up a secure connection. Check the configuration of the secure mode in the OMS and the RNC/ADA/MRBTS. The RNC/ADA/MRBTS secure mode might be in the "off" state.
ClearingThe alarm shall be cancelled when connection becomes secured, or the security mode is changed to "off" or "forced"

370 DN70397367
LTE iOMS Alarms
Id:0900d805808e03bfConfidential
71108 TRACE CONNECTION TO NE IS LOST
220 71108 TRACE CONNECTION TO NE IS LOSTProbable cause: Indeterminate
Event type: Communications
Default severity: Major
MeaningTrace connection to NE is lost. This might happen when synchronization with NE to OMS is lost, connection is interrupted or there is overload situation.
Identifying additional information fields-
Additional information fields-
Instructions-
ClearingAlarm is cancelled automatically after time to live for the alarm has elapsed.

DN70397367 371
LTE iOMS Alarms 71110 STAGING AREA IN INCONSISTENT STATE
Id:0900d80580826247Confidential
221 71110 STAGING AREA IN INCONSISTENT STATEProbable cause: Indeterminate
Event type: Environmental
Default severity: Major
MeaningInstallation of Incremental Delivery failed, recovery was not performed. Staging Area may be in inconsistent state.
Operator action is needed to perform manual recovery.
Identifying additional information fieldsOMS moid, example: "OMS-12"
InstructionsOperator shall check Nwi3SWAgent logs to determine what caused installation failure. Operator shall use FlexiPlatform Software Management tools or OMS CLI Software Management tools to perform manual recovery.
ClearingOperator shall clear alarm manually after performing manual recovery.

372 DN70397367
LTE iOMS Alarms
Id:0900d80580826248Confidential
71111 SW SET ACTIVATION FAILED
222 71111 SW SET ACTIVATION FAILEDProbable cause: Indeterminate
Event type: Environmental
Default severity: Major
MeaningSoftware Set activation has failed.
OMS will not be restarted with the new SW Set. Old SW Set will be still active. No SW Set status (active/passive) will change.
Identifying additional information fieldsOMS moid, example: "OMS-12"
InstructionsOperator shall check Nwi3SWAgent logs to determine what caused activation failure.
ClearingAlarm shall be cleared automatically after OMS restart or when new request for activa-tion was received or manually by the Operator.

DN70397367 373
LTE iOMS Alarms 71112 SW SET POSTACTIVATION SCRIPT EXECU-TION ERROR
Id:0900d8058089af2bConfidential
223 71112 SW SET POSTACTIVATION SCRIPT EXECUTION ERRORProbable cause: Indeterminate
Event type: Environmental
Default severity: Critical
MeaningError occurred during Postactivation Scripts execution.
Newly activated Software Set may not be fully functional as postactivation commands were not performed.
Identifying additional information fieldsOMS moid, example: "OMS-12"
Additional information fields-
InstructionsThe user should check Nwi3SWAgent and Postactivation Scripts logs to determinewhat caused failure. The user should execute the remaining part of the scripts manually.
ClearingThe user should clear the alarm manually.

374 DN70397367
LTE iOMS Alarms
Id:0900d80580932fa4Confidential
71124 CMP CERT RETRIEVAL FAILURE
224 71124 CMP CERT RETRIEVAL FAILUREProbable cause: TRANSMISSION ERROR
Event type: Communications
Default severity: Major
MeaningThe alarm means that the End Entity (EE) certificate was not received from Certificate Authority server, and old EE certificate is used.
Not-trusted certificate might be used.
Identifying additional information fields-
Additional information fieldsCA server IP address or name.
InstructionsUser should check CMP server parameters in OMS LDAP. If parameters stored in LDAP are correct, the connectivity to CMP server should be also checked. If the above men-tioned steps have been done the CMP initialize operation can be repeated.
ClearingThe alarm is cleared if OMS has retrieved certificates successfully.

DN70397367 375
LTE iOMS Alarms 71125 CERTIFICATE EXPIRING
Id:0900d80580932fa5Confidential
225 71125 CERTIFICATE EXPIRINGProbable cause: TIMEOUT EXPIRED
Event type: Processing error
Default severity: Major
MeaningThe alarm means that End Entity (EE) or Certificate Authority (CA) certificate expiry is close.
It will not be possible to use expired certificate. Secure connection will not be working. At the worst case the whole OMS will not be functioning.
Identifying additional information fieldsCertificate subject name CA-id.
Additional information fields-
InstructionsThe operator should install a new certificate with proper lifetime as soon as possible.
ClearingAlarm will be cleared automatically by the alarm system after a new certificate with proper lifetime is installed to the system.