AIRA - 150324 - A Beating Unduly Severe - ADBS
17
Refer to important disclosures at the end of this report BUY BUY BUY BUY RM RM RM RM2.18 2.18 2.18 2.18 KLCI KLCI KLCI KLCI : : : : 1,795.8 1,795.8 1,795.8 1,795.85 (Upgrade from HOLD) Price Target : Price Target : Price Target : Price Target : 12-Month RM 2.60 (Prev RM 2.60) Shariah Compliant: Shariah Compliant: Shariah Compliant: Shariah Compliant: No Reason for Report : Reason for Report : Reason for Report : Reason for Report : Earnings revision and rating upgrade Potential Catalyst: Potential Catalyst: Potential Catalyst: Potential Catalyst: Recovery in yields, cheaper fuel costs, further milestone in the leasing house AllianceDBS AllianceDBS AllianceDBS AllianceDBS vs vs vs vs Consensus: Consensus: Consensus: Consensus: Below consensus for FY16/17F Analyst TAN Kee Hoong +603 2604 3913 [email protected] Price Relative Forecasts and Valuation FY FY FY FY Dec Dec Dec Dec ( RM RM RM RM m) m) m) m) 2014 2014 2014 2014A 2015 2015 2015 2015F 2016 2016 2016 2016F 2017 2017 2017 2017F Revenue 5,416 5,674 5,869 6,124 EBITDA 1,573 2,078 2,132 2,274 Pre-tax Profit 23 286 863 909 Net Profit 83 256 835 884 Net Pft (Pre Ex.) 416 854 835 884 EPS (sen) 15.0 30.7 30.0 31.8 EPS Pre Ex. (sen) 15.0 30.7 30.0 31.8 EPS Gth (%) (29) 105 (2) 6 EPS Gth Pre Ex (%) (29) 105 (2) 6 Diluted EPS (sen) 3.0 9.2 30.0 31.8 Net DPS (sen) 0.6 1.8 6.0 6.4 BV Per Share (sen) 163.9 172.5 200.6 226.4 PE (X) 14.6 7.1 7.3 6.9 PE Pre Ex. (X) 14.6 7.1 7.3 6.9 P/Cash Flow (X) 31.0 4.8 4.0 3.6 EV/EBITDA (X) 10.9 8.4 8.2 8.0 Net Div Yield (%) 0.3 0.8 2.8 2.9 P/Book Value (X) 1.3 1.3 1.1 1.0 Net Debt/Equity (X) 2.4 2.4 2.1 1.9 ROAE (%) 1.7 5.5 16.1 14.9 Earnings Rev (%): Earnings Rev (%): Earnings Rev (%): Earnings Rev (%): (10) (22) (29) Consensus EPS Consensus EPS Consensus EPS Consensus EPS (sen sen sen sen): 30.7 34.6 36.3 Other Broker Recs: Other Broker Recs: Other Broker Recs: Other Broker Recs: B: 18 S: 1 H: 7 ICB Industry ICB Industry ICB Industry ICB Industry : Consumer Services ICB Sector: ICB Sector: ICB Sector: ICB Sector: Travel & Leisure Principal Business: Principal Business: Principal Business: Principal Business: Low cost carrier Source of all data: Company, AllianceDBS, Bloomberg Finance L.P. At A Glance Issued Capital (m shrs) 2,783 Mkt. Cap (RMm/US$m) 6,067 / 1,635 Major Shareholders Tune Air (%) 19.0 Wellington Management LLP (%) 14.0 Employees Provident Fund (%) 7.4 Free Float (%) 59.6 Avg. Daily Vol.(‘000) 11,445 Malaysia Equity Research 24 Mar 2015 Company Focus AirAsia Bloomberg: AIRA MK | Reuters: AIRA.KL Refer to important disclosures at the end of this report A beating unduly severe • Recent share price correction overdone • Expect fuel cost savings to be more apparent in FY15F, given the lower average hedged costs • Monetisation of non-core assets underway • Upgrade to BUY, RM2.60 TP (35% discount to SOP) Share price correction too steep. AirAsia's share price has fallen by 26% from the peak in Dec 2014, due to the QZ8501 accident, stronger USD, and the launch of flymojo. While these concerns are valid, we think the market may have overly punished the stock, as its valuation remains decent at 7.1x FY15F PE. Fuel cost savings to be more apparent in FY15F. Investors were generally disappointed with AirAsia’s 4Q14 results, as fuel cost savings were not apparent in the quarter (-4% y-o-y). But this was due to: (1) previous fuel hedges that were made at higher price (USD115/bbl), and (2) the stronger USD. We expect fuel cost savings to be more apparent starting 1Q15, given the cheaper average hedged cost of USD98/bbl. This is expected to further fall to USD88/84/84 per bbl in 2Q/3Q/4Q. We believe investors will re-focus on this theme, once they begun to see the earnings impact from the cheap fuel in 1Q15. Cashing out non-core assets. The recent divestment of a 25% stake in AAE Travel was a pleasant surprise, as the USD86.25m price tag beat market expectations. Next, the group plans to sell a stake in its leasing arm (AAC) to strategic investors, in order to realise the value from its fleet of aircraft. We think AAC could fetch a valuation of USD300m, assuming only 45 aircraft are injected into it. Upgrade to BUY, RM2.60 TP. Our TP is derived by applying a 35% discount to our SOP value. There are concerns that IAA's woes may be a drag on the group, but we think the current share price has provided a sufficient margin of safety, as our TP implies a complete write-off of IAA’s related assets (receivables due, equity, etc). 62 82 102 122 142 162 182 202 222 2.0 2.5 3.0 3.5 4.0 4.5 Mar-11 Mar-12 Mar-13 Mar-14 Mar-15 Relative Index RM AirAsia (LHS) Relative KLCI INDEX (RHS)
-
Upload
yvette-ong -
Category
Documents
-
view
226 -
download
2
description
Share market
Transcript of AIRA - 150324 - A Beating Unduly Severe - ADBS

Refer to important disclosures at the end of this report
BUYBUYBUYBUY RMRMRMRM2.182.182.182.18 KLCIKLCIKLCIKLCI : : : : 1,795.81,795.81,795.81,795.85555
(Upgrade from HOLD)
Price Target :Price Target :Price Target :Price Target : 12-Month RM 2.60 (Prev RM 2.60)
Shariah Compliant:Shariah Compliant:Shariah Compliant:Shariah Compliant: No
Reason for Report :Reason for Report :Reason for Report :Reason for Report : Earnings revision and rating upgrade
Potential Catalyst: Potential Catalyst: Potential Catalyst: Potential Catalyst: Recovery in yields, cheaper fuel costs, further
milestone in the leasing house
AllianceDBSAllianceDBSAllianceDBSAllianceDBS vs vs vs vs Consensus:Consensus:Consensus:Consensus: Below consensus for FY16/17F Analyst TAN Kee Hoong +603 2604 3913 [email protected]
Price Relative
Forecasts and Valuation FY FY FY FY DecDecDecDec ((((RMRMRMRM m) m) m) m) 2014201420142014AAAA 2015201520152015FFFF 2016201620162016FFFF 2017201720172017FFFF
Revenue 5,416 5,674 5,869 6,124 EBITDA 1,573 2,078 2,132 2,274 Pre-tax Profit 23 286 863 909 Net Profit 83 256 835 884 Net Pft (Pre Ex.) 416 854 835 884 EPS (sen) 15.0 30.7 30.0 31.8 EPS Pre Ex. (sen) 15.0 30.7 30.0 31.8 EPS Gth (%) (29) 105 (2) 6 EPS Gth Pre Ex (%) (29) 105 (2) 6 Diluted EPS (sen) 3.0 9.2 30.0 31.8 Net DPS (sen) 0.6 1.8 6.0 6.4 BV Per Share (sen) 163.9 172.5 200.6 226.4 PE (X) 14.6 7.1 7.3 6.9 PE Pre Ex. (X) 14.6 7.1 7.3 6.9 P/Cash Flow (X) 31.0 4.8 4.0 3.6 EV/EBITDA (X) 10.9 8.4 8.2 8.0 Net Div Yield (%) 0.3 0.8 2.8 2.9 P/Book Value (X) 1.3 1.3 1.1 1.0 Net Debt/Equity (X) 2.4 2.4 2.1 1.9 ROAE (%) 1.7 5.5 16.1 14.9 Earnings Rev (%):Earnings Rev (%):Earnings Rev (%):Earnings Rev (%): (10) (22) (29) Consensus EPS Consensus EPS Consensus EPS Consensus EPS (sensensensen):::: 30.7 34.6 36.3 Other Broker Recs:Other Broker Recs:Other Broker Recs:Other Broker Recs: B: 18 S: 1 H: 7
ICB IndustryICB IndustryICB IndustryICB Industry : Consumer Services ICB Sector: ICB Sector: ICB Sector: ICB Sector: Travel & Leisure Principal Business:Principal Business:Principal Business:Principal Business: Low cost carrier
Source of all data: Company, AllianceDBS, Bloomberg Finance L.P.
At A Glance Issued Capital (m shrs) 2,783 Mkt. Cap (RMm/US$m) 6,067 / 1,635 Major Shareholders Tune Air (%) 19.0 Wellington Management LLP (%) 14.0 Employees Provident Fund (%) 7.4 Free Float (%) 59.6 Avg. Daily Vol.(‘000) 11,445
Malaysia Equity Research
24 Mar 2015
Company Focus
AirAsia Bloomberg: AIRA MK | Reuters: AIRA.KL Refer to important disclosures at the end of this report
A beating unduly severe • Recent share price correction overdone
• Expect fuel cost savings to be more apparent in FY15F, given the lower average hedged costs
• Monetisation of non-core assets underway
• Upgrade to BUY, RM2.60 TP (35% discount to SOP)
Share price correction too steep. AirAsia's share price has fallen by 26% from the peak in Dec 2014, due to the QZ8501 accident, stronger USD, and the launch of flymojo. While these concerns are valid, we think the market may have overly punished the stock, as its valuation remains decent at 7.1x FY15F PE.
Fuel cost savings to be more apparent in FY15F. Investors were generally disappointed with AirAsia’s 4Q14 results, as fuel cost savings were not apparent in the quarter (-4% y-o-y). But this was due to: (1) previous fuel hedges that were made at higher price (USD115/bbl), and (2) the stronger USD. We expect fuel cost savings to be more apparent starting 1Q15, given the cheaper average hedged cost of USD98/bbl. This is expected to further fall to USD88/84/84 per bbl in 2Q/3Q/4Q. We believe investors will re-focus on this theme, once they begun to see the earnings impact from the cheap fuel in 1Q15.
Cashing out non-core assets. The recent divestment of a 25% stake in AAE Travel was a pleasant surprise, as the USD86.25m price tag beat market expectations. Next, the group plans to sell a stake in its leasing arm (AAC) to strategic investors, in order to realise the value from its fleet of aircraft. We think AAC could fetch a valuation of USD300m, assuming only 45 aircraft are injected into it.
Upgrade to BUY, RM2.60 TP. Our TP is derived by applying a 35% discount to our SOP value. There are concerns that IAA's woes may be a drag on the group, but we think the current share price has provided a sufficient margin of safety, as our TP implies a complete write-off of IAA’s related assets (receivables due, equity, etc).
62
82
102
122
142
162
182
202
222
2.0
2.5
3.0
3.5
4.0
4.5
Mar-11 Mar-12 Mar-13 Mar-14 Mar-15
Relative IndexRM
AirAsia (LHS) Relative KLCI INDEX (RHS)

Page 2
Company Focus
AirAsia
INVESTMENT THESIS
Profile Rationale
AirAsia is a low-cost airline flying short-haul, point-to-point
domestic and international routes. AirAsia operates from
hubs in Malaysia, Thailand, Indonesia and Philippines.
Share price correction overdoneShare price correction overdoneShare price correction overdoneShare price correction overdone
• Share price has corrected substantially due to the QZ8501
accident, stronger USD and the launch of flymojo. But, we
think this is overdone, as its valuation remains decent
even as we impute a weaker RM into our earnings
forecasts.
Unit costUnit costUnit costUnit cost to ease on cheaper oil prices to ease on cheaper oil prices to ease on cheaper oil prices to ease on cheaper oil prices
• We expect AirAsia’s unit cost to fall in the coming
quarters, following the substantial decline in jet fuel price
to USD65/bbl. While fuel cost savings will be fettered by
intense competition (which lead airlines to pass on the
savings) and stronger USD, we think the net impact would
still be positive for AirAsia. Our earnings forecasts are
conservative as it implies 86% of the cost savings will be
passed on to the consumers.
Harvesting its portfolio of nonHarvesting its portfolio of nonHarvesting its portfolio of nonHarvesting its portfolio of non----core ascore ascore ascore assetssetssetssets
• The recent divestment of a 25% stake in AAE Travel at
USD86.25m was a pleasant surprise to the market, given
the hefty valuation. Next, the group plans to monetise its
aircraft fleet by setting up a leasing house, and disposing
a stake in it to strategic investors. We think the leasing
house could fetch a valuation of USD300m.
IAA woes adequately accounted for at current share priceIAA woes adequately accounted for at current share priceIAA woes adequately accounted for at current share priceIAA woes adequately accounted for at current share price
• IAA’s turnaround efforts could be hampered by the recent
QZ8501 accident. This could put further pressure on the
group’s balance sheet, as it may require further working
capital support, if the turnaround fails to materialise.
However, we think the current share price has adequately
priced in this risk.
Valuation Risks
Our RM2.60 TP is derived by applying a 35% discount to our
SOP valuation, mainly to reflect the operating challenges
surrounding IAA. We think the SOP discount is sufficient to
withstand a full write-off of the amounts due from related
parties (i.e. associates and JV), IAA’s equity value, and 32%
impairment of aircraft leasing business (24 aircraft from the
75-aircraft fleet are deployed for IAA).
Further depreciaFurther depreciaFurther depreciaFurther depreciattttion in RM against USDion in RM against USDion in RM against USDion in RM against USD
• A stronger USD will pressure AirAsia’s profitability as
c.57% of its cost base is in USD. Debt repayments will
also be a concern as most of its borrowings are in USD.
Irrational competition Irrational competition Irrational competition Irrational competition
• Irrational competition could persist if MAS decides to
change track, and refocus on market share gains. If so,
yield compression will continue to plague the industry.
Source: AllianceDBS

Page 3
Company Focus
AirAsia
AirAsia’s share price declined mainly due to a stronger
USD; but the launch of flymojo exacerbated the
situation
1) 1) 1) 1) Share price Share price Share price Share price has has has has corrected by corrected by corrected by corrected by 26262626% since the peak in Dec % since the peak in Dec % since the peak in Dec % since the peak in Dec
2014201420142014
AirAsia’s share price has fallen by 26% from its recent peak
on 26 Dec 2014, as investors have been concerned about the
potential impact from the QZ8501 incident, the stronger USD
and the announcement of a new airline entering the crowded
Malaysian market (i.e. flymojo). Conversations with
institutional investors suggest that the stronger USD and the
launch of flymojo were the bigger concerns for them, and
were the key factors behind the recent decline in AirAsia’s
share price.
We had previously warned of the negative impacts from a
stronger USD (i.e. higher OPEX, higher borrowing costs, and
translation losses), and downgraded our rating on the stock
to HOLD (from BUY) in our report titled “AirAsia – Forex
headache” that was published on 29 Dec 2014. However, we
think the recent share price correction has excessively priced
in this risk.
AirAsia: Share price has corrected by c.26% due to the QZ8501 incident, stronger USD and flymojo
Sources: Bloomberg Finance L.P.
2) 2) 2) 2) Cut earnings on revised forex assumptions; but Cut earnings on revised forex assumptions; but Cut earnings on revised forex assumptions; but Cut earnings on revised forex assumptions; but current current current current
valuation remains decentvaluation remains decentvaluation remains decentvaluation remains decent as share price has corrected as share price has corrected as share price has corrected as share price has corrected
substantiallysubstantiallysubstantiallysubstantially
We are revising our forex assumptions to RM3.69/3.75/3.75
per USD in FY15/16/17F (previous: RM3.41/3.41/3.41 per
USD), to bring it in line with the revised forex forecasts
provided by the DBS economics team. As a result, we cut our
FY15/16/17F core earnings by 10%/22%/29%. We also
imputed a RM597.3m translation loss on its USD-
denominated borrowings in FY15F, which we think will
chiefly be recognised in 1Q15. For a more detailed discussion
on the earnings revision, please refer to the “Financial
Forecasts” section in the subsequent pages of our report.
However, AirAsia’s valuations remain decent even after the
earnings cut. Current share price implies 7.1x FY15F P/E, 1.3x
F1Y5F P/BV and 8.6x FY15F adjusted EV/EBITDAR; all of these
multiples are close to -1 standard deviation to the stock’s 5-
year average valuation. We think this is unjustified as the
group’s earnings momentum is at the cusp of an inflection
point, buoyed by: (1) MAS’s restructuring, (2) cheaper oil
prices, and (3) the potential recovery of its key associates (i.e.
TAA and IAA).
Also, the group’s solvency and liquidity is not yet a concern
for us, as our forecasts suggest that interest coverage and
gearing ratio would remain healthy at 2.4x-2.7x and 1.8x-
2.4x respectively in FY15-17F. These have already taken into
account the impact of the stronger USD on the group’s
finance cost and borrowings.
AirAsia: Liquidity and gearing ratios expected to remain manageable in FY15-17F
Sources: AirAsia, AllianceDBS
A new entrant to the crowded Malaysian aviation
sector - flymojo
1) Announcement of new airline during LIMA exhibition 1) Announcement of new airline during LIMA exhibition 1) Announcement of new airline during LIMA exhibition 1) Announcement of new airline during LIMA exhibition
surprisesurprisesurprisesurprisessss investment communityinvestment communityinvestment communityinvestment community
Fly Mojo Sdn Bhd (Fly Mojo) announced the setting-up of a
new airline dubbed “flymojo” during the Langkawi
International Maritime and Aerospace (LIMA) exhibition on 17
Mar 2015. In conjunction with that, it also signed a letter of
intent with Bombardier Commercial Aircraft to acquire 20
CS100 aircraft which comes together with an option for
another 20 more.
Investors were understandably concerned on this latest
development. The launch of a new airline could increase the
competition risks in the crowded Malaysian aviation sector,
which has seen two years of yield compression in 2013-14.
Reflecting this risk, AirAsia’s share price has fallen by 5%
since the announcement of flymojo.
2.00
2.10
2.20
2.30
2.40
2.50
2.60
2.70
2.80
2.90
3.00
Jan
-14
Jan
-14
Fe
b-1
4
Ma
r-1
4
Ma
r-1
4
Ap
r-1
4
Ma
y-1
4
Ma
y-1
4
Jun
-14
Jul-
14
Jul-
14
Au
g-1
4
Se
p-1
4
Oct
-14
Oct
-14
No
v-1
4
De
c-1
4
De
c-1
4
Jan
-15
Fe
b-1
5
Fe
b-1
5
Ma
r-1
5
RM
AirAsia's Share Price
-
0.5
1.0
1.5
2.0
2.5
3.0
3.5
4.0
4.5
2008A 2009A 2010A 2011A 2012A 2013A 2014A 2015F 2016F 2017F
x
Net Gearing Interest Coverage Ratio

Page 4
Company Focus
AirAsia
2) 2) 2) 2) Details of the new airline Details of the new airline Details of the new airline Details of the new airline
Flymojo will operate out of Senai International Airport, Johor
as its primary hub with Kota Kinabalu International Airport
(BKI) as its secondary hub. The airline is reportedly targeting
to operate domestic and regional flights (i.e. ASEAN). Media
reports suggest that flymojo will be a hybrid carrier (akin to
Malindo).
It is unclear whether Fly Mojo has the necessary regulatory
approval to operate an airline in Malaysia. FlightGlobal
reported that the airline has already obtained its air operator’s
certificate (AOC), but certain industry sources suggest the
new airline could not have obtained the AOC without any
aircraft on hand.
Also, media reports indicate that Fly Mojo is fully Malaysian-
owned, with 81% of the shares being held by Azharuddin
Satyapal Das Abdullah. The other shareholders are Ismail Hue
Kor Ming (10%), and Janardhanan Gopala Krishnan (9%).The
company is currently helmed by its managing director, Datuk
Janardhanan Gopala Krishan. Datuk Seri Alies Anor Abdul is
the chairman of the airline.
3) 3) 3) 3) Regulatory challenges and financial support should not be Regulatory challenges and financial support should not be Regulatory challenges and financial support should not be Regulatory challenges and financial support should not be
an issue, considering the political supportan issue, considering the political supportan issue, considering the political supportan issue, considering the political support
It would seem that Fly Mojo has strong political support and
backing, going by the various government officials (Prime
Minister, Datuk Seri Najib Razak amongst many others) who
graced the launching ceremony of flymojo. In addition,
government officials from both Malaysia and Canada had
made encouraging comments about the airline. As such, we
do not think the company will encounter much difficulty in
securing the necessary regulatory approvals and financial
backing to begin operations in Oct 2015.
Various government dignitaries were present during the launch of flymojo
Left to right: (1) flymojo MD, Datuk Janardhanan Gopala Krishnan; (2) VP, Sales, China and Asia-Pacific, Bombardier Commercial Aircraft, Andy Solem; (3) Canada’s High Commissioner to Malaysia, Her Excellency Judith St. George; (4) Minister of Transport, Datuk Seri Liow Tiong Lai; (5) Prime Minister of Malaysia, Datuk Seri Najib Razak; (6) flymojo Chairman, Datuk Seri Alies Anor Abdul; (7) Chief Minister of Kedah, Datuk Seri Mukhriz Mahathir; (8) Deputy Minister of Transport, Datuk Aziz Kaprawi; and (9) Regional Vice President, Sales, Asia-Pacific, Frank Baistrocchi.
Sources: New Straits Times
Page 5
Company Focus
AirAsia
4) 4) 4) 4) Flymojo could lead to Flymojo could lead to Flymojo could lead to Flymojo could lead to heightened competitiheightened competitiheightened competitiheightened competitive risksve risksve risksve risks at BKat BKat BKat BKIIII; ; ; ;
a negative for AirAsiaa negative for AirAsiaa negative for AirAsiaa negative for AirAsia
While flymojo’s business model is yet uproven amid limited
operational details and history, we think the entry of flymojo
would be negative for established domestic airlines such as
AirAsia and Malaysian Airlines (MAS), due the already
crowded market. Including flymojo, we estimate that there
would be a total of seven airlines plying the domestic routes
in Malaysia.
Flymojo’s plan to locate its secondary hub at BKI would also
give rise to increase competitive pressure there, which is the
second largest hub for AirAsia. We are concerned that
flymojo would initially offers rock bottom fares, in order to
garner the requisite critical mass and market share.
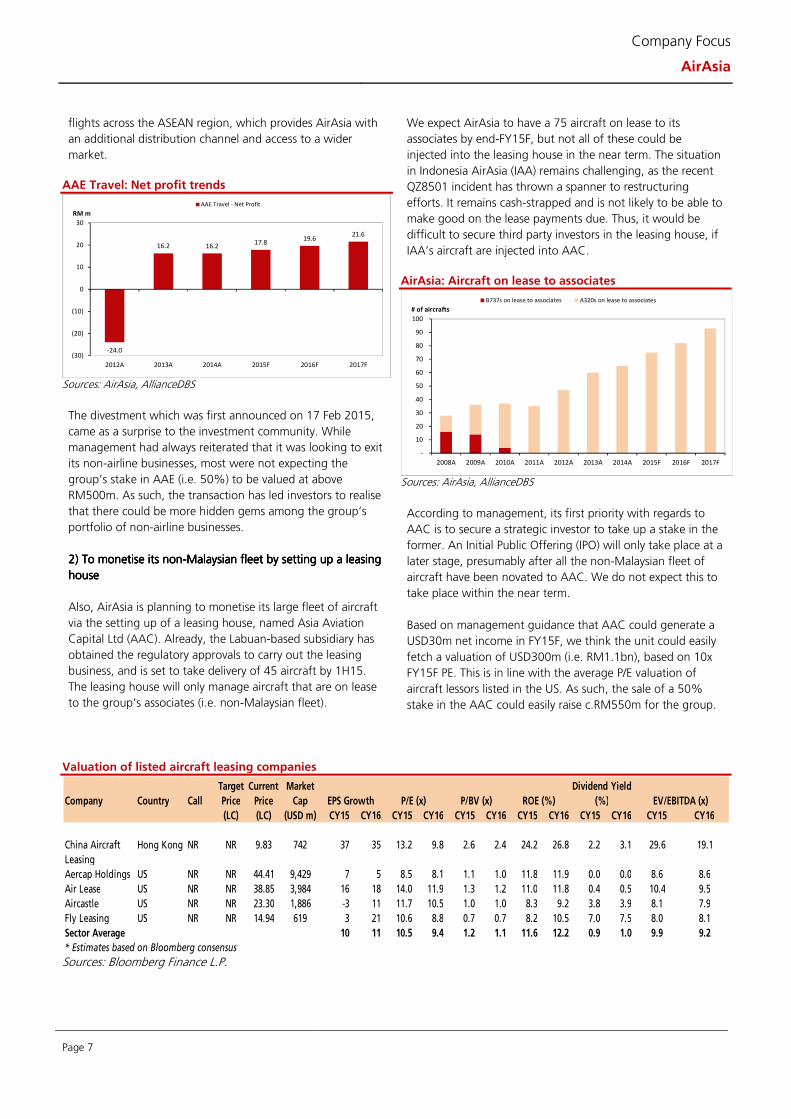
AirAsia: Top 10 hubs in Malaysia
Sources: CAPA
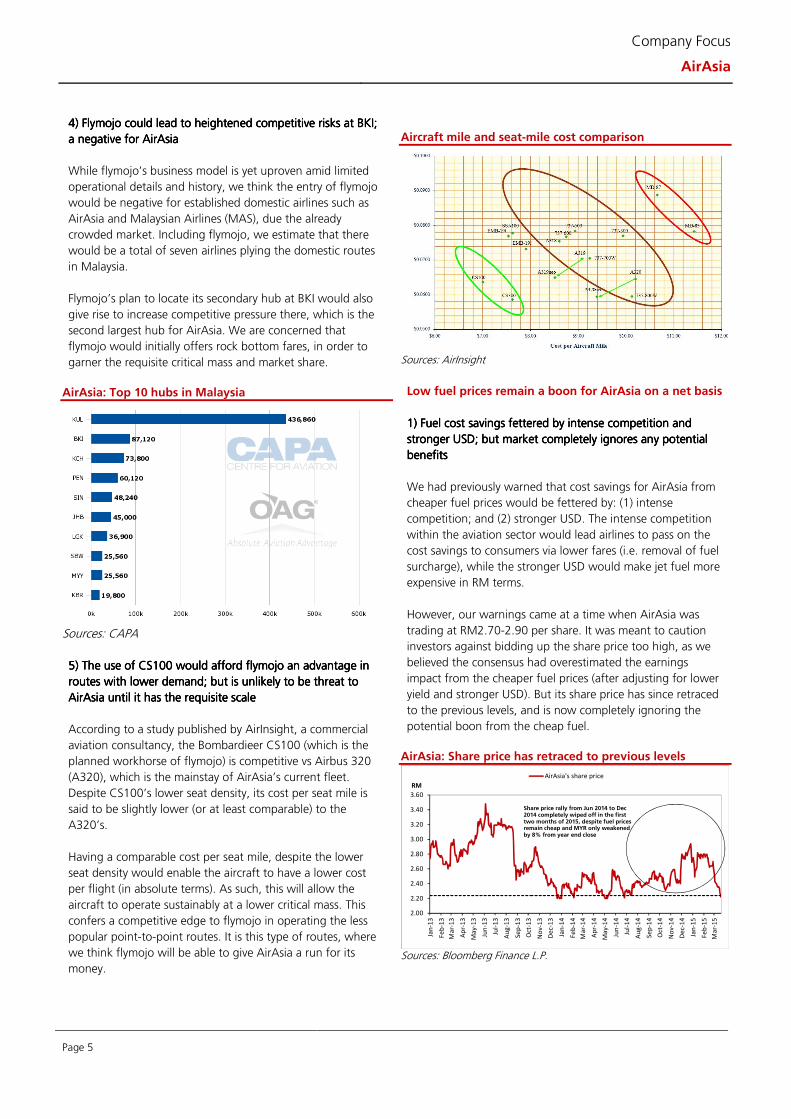
5) The use of CS100 would afford flymojo an advantage in 5) The use of CS100 would afford flymojo an advantage in 5) The use of CS100 would afford flymojo an advantage in 5) The use of CS100 would afford flymojo an advantage in
routes with lower demand; but routes with lower demand; but routes with lower demand; but routes with lower demand; but is is is is unlikely to be threat to unlikely to be threat to unlikely to be threat to unlikely to be threat to
AirAsia until it has the requisite scale AirAsia until it has the requisite scale AirAsia until it has the requisite scale AirAsia until it has the requisite scale
According to a study published by AirInsight, a commercial
aviation consultancy, the Bombardieer CS100 (which is the
planned workhorse of flymojo) is competitive vs Airbus 320
(A320), which is the mainstay of AirAsia’s current fleet.
Despite CS100’s lower seat density, its cost per seat mile is
said to be slightly lower (or at least comparable) to the
A320’s.
Having a comparable cost per seat mile, despite the lower
seat density would enable the aircraft to have a lower cost
per flight (in absolute terms). As such, this will allow the
aircraft to operate sustainably at a lower critical mass. This
confers a competitive edge to flymojo in operating the less
popular point-to-point routes. It is this type of routes, where
we think flymojo will be able to give AirAsia a run for its
money.
Aircraft mile and seat-mile cost comparison
Sources: AirInsight
Low fuel prices remain a boon for AirAsia on a net basis
1) 1) 1) 1) Fuel cFuel cFuel cFuel cost savings fettered byost savings fettered byost savings fettered byost savings fettered by intense competition and intense competition and intense competition and intense competition and
stronger USD; but market completely ignores any potential stronger USD; but market completely ignores any potential stronger USD; but market completely ignores any potential stronger USD; but market completely ignores any potential
benefitsbenefitsbenefitsbenefits
We had previously warned that cost savings for AirAsia from
cheaper fuel prices would be fettered by: (1) intense
competition; and (2) stronger USD. The intense competition
within the aviation sector would lead airlines to pass on the
cost savings to consumers via lower fares (i.e. removal of fuel
surcharge), while the stronger USD would make jet fuel more
expensive in RM terms.
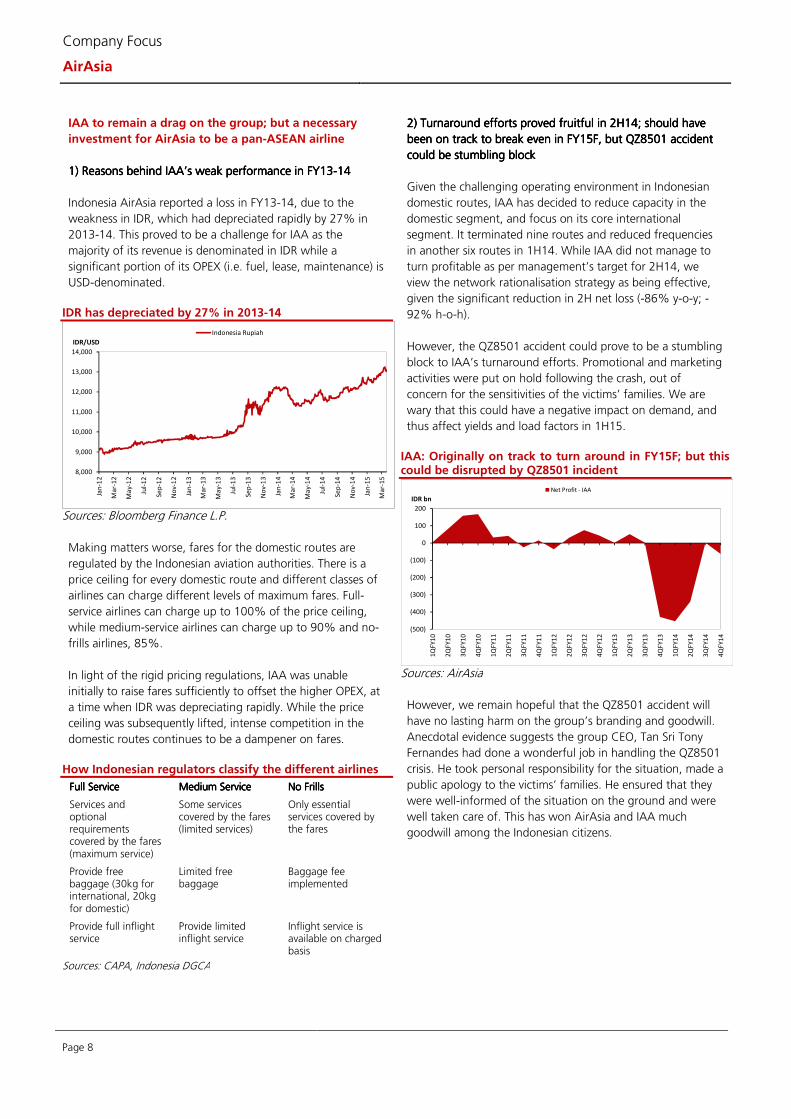
However, our warnings came at a time when AirAsia was
trading at RM2.70-2.90 per share. It was meant to caution
investors against bidding up the share price too high, as we
believed the consensus had overestimated the earnings
impact from the cheaper fuel prices (after adjusting for lower
yield and stronger USD). But its share price has since retraced
to the previous levels, and is now completely ignoring the
potential boon from the cheap fuel.
AirAsia: Share price has retraced to previous levels
Sources: Bloomberg Finance L.P.
2.00
2.20
2.40
2.60
2.80
3.00
3.20
3.40
3.60
Jan
-13
Fe
b-1
3
Ma
r-1
3
Ap
r-1
3
Ma
y-1
3
Jun
-13
Jul-
13
Au
g-1
3
Se
p-1
3
Oct
-13
No
v-1
3
De
c-1
3
Jan
-14
Fe
b-1
4
Ma
r-1
4
Ap
r-1
4
Ma
y-1
4
Jun
-14
Jul-
14
Au
g-1
4
Se
p-1
4
Oct
-14
No
v-1
4
De
c-1
4
Jan
-15
Fe
b-1
5
Ma
r-1
5
RM
AirAsia's share price
Share price rally from Jun 2014 to Dec 2014 completely wiped off in the first two months of 2015, despite fuel prices remain cheap and MYR only weakened by 8% from year end close

Page 6
Company Focus
AirAsia
2) 2) 2) 2) Fuel cost savings not apparent in 4Q14 due to previous Fuel cost savings not apparent in 4Q14 due to previous Fuel cost savings not apparent in 4Q14 due to previous Fuel cost savings not apparent in 4Q14 due to previous
hedges; but cost savings is expected to be more apparent in hedges; but cost savings is expected to be more apparent in hedges; but cost savings is expected to be more apparent in hedges; but cost savings is expected to be more apparent in
FY15FFY15FFY15FFY15F
At present, we think investors have downplayed the potential
boon from cheaper fuel prices, as the fuel cost savings were
not apparent in 4Q14 (fuel cost fell by only 4% y-o-y to
RM620.9m). Fuel cost/ASK stood at 6.7 sen in 4Q14 (-16% y-
o-y; +10% q-o-q), despite jet fuel prices falling by 26% y-o-y
and 21% q-o-q in the quarter. This was mainly due to: (1)
50% of the fuel requirements in 4Q had been hedged at a
higher price, and (2) strengthening of USD had made fuel
cost more expensive in RM terms
Jet fuel prices have fallen by 48% since the recent peak on 20 Jun 2014
Sources: Bloomberg Finance L.P.
We expect the fuel cost savings to be more apparent starting
1Q15, given the cheaper average hedged cost of USD98/bbl.
This is expected to further fall to USD88/84/84 per bbl in
2Q/3Q/4Q. Average hedged cost for 2015 currently stands at
USD88/bbl (vs USD115/bbl in 4Q14). We expect the fuel cost
savings to be a key earnings driver in FY15F, and investors
would once again pay attention to this theme after the 1Q15
results.
AirAsia: Group hedging profile
Sources: AirAsia
3) Our FY15F earnings forecast implies 86% of the fuel cost 3) Our FY15F earnings forecast implies 86% of the fuel cost 3) Our FY15F earnings forecast implies 86% of the fuel cost 3) Our FY15F earnings forecast implies 86% of the fuel cost
savings savings savings savings would be passed on to consumerswould be passed on to consumerswould be passed on to consumerswould be passed on to consumers
Our earnings forecasts currently assume jet fuel cost per
barrel of USD96/107/107 in FY15/16/17F respectively.
Additionally, we assume that fare/RPK will decline by 6.9% in
FY15F (removal of fuel surcharge, but raise base fare/RPK by
14%), increase by 5% in FY16F, and remain flattish in FY17F.
These assumptions imply AirAsia would pass on 86% of the
fuel cost savings to consumers, a scenario which we think is
likely to take place, given the intense competition and the
need to stimulate demand in the face of a potential
slowdown in private consumption. Our earnings forecasts
also imply MAA’s FY15/16/17F unit profitability will remain
below FY12F levels, which is prudent considering the
competitive landscape within the domestic aviation sector.
MAA: Jet fuel cost assumptions FY15F FY16F FY17F Remarks Hedged ratio 50% 0% 0% Hedged price (USD/bbl)
88.00 N/A N/A
Spot ratio 50% 100% 100% Spot price (USD/bbl)
85.00 97.00 97.00 Assume USD15 crack spread to Brent
USD / bblUSD / bblUSD / bblUSD / bbl Jet Fuel Price 86.50 97.00 97.00 (+) D-Factor 9.72 9.72 9.72 Based on FY14 Jet Fuel Cost 96.22 106.72 106.72
* DBS’ Brent price forecasts is USD70/82/82 per bbl for FY15/16/17F
Sources: AirAsia, AllianceDBS
MAA: Implied unit profitability for FY15-17F remains below FY12 levels; this suggest our forecasts remain conservative
Sources: AirAsia, AllianceDBS
Investments in non-core businesses ripe for harvesting
1) 1) 1) 1) DDDDivestment of 25% stake in AAE ivestment of 25% stake in AAE ivestment of 25% stake in AAE ivestment of 25% stake in AAE Travel Travel Travel Travel suggest there may suggest there may suggest there may suggest there may
be other hidden gems within the group’s balance sheetbe other hidden gems within the group’s balance sheetbe other hidden gems within the group’s balance sheetbe other hidden gems within the group’s balance sheet
AirAsia has recently completed the divestment of a 25%
stake in AAE Travel Pte. Ltd. (AAE) to its JV-partner, Expedia
Inc. group for USD86.25m. Post-divestment, AirAsia would
have a remaining stake of 25% in AAE. To recap, AAE was
originally set up as 50:50 JV between AirAsia and Expedia Inc.
in 2011, to operate an online travel agent based in
Singapore. The unit sells both hotel accommodation and
50
60
70
80
90
100
110
120
130
140
150
Jul-
11
Se
p-1
1
No
v-1
1
Jan
-12
Ma
r-1
2
Ma
y-1
2
Jul-
12
Se
p-1
2
No
v-1
2
Jan
-13
Ma
r-1
3
Ma
y-1
3
Jul-
13
Se
p-1
3
No
v-1
3
Jan
-14
Ma
r-1
4
Ma
y-1
4
Jul-
14
Se
p-1
4
No
v-1
4
Jan
-15
USD/bbl
Singapore Jet Kerosene
3.39
1.49
1.96
1.57
1.19
1.73 1.74 1.89
0.0
0.5
1.0
1.5
2.0
2.5
3.0
3.5
4.0
2010A 2011A 2012A 2013A 2014A 2015F 2016F 2017F
sen/RPK
Unit Profitability - Malaysia AirAsia excluding leasing operations
Page 7
Company Focus
AirAsia
flights across the ASEAN region, which provides AirAsia with
an additional distribution channel and access to a wider
market.
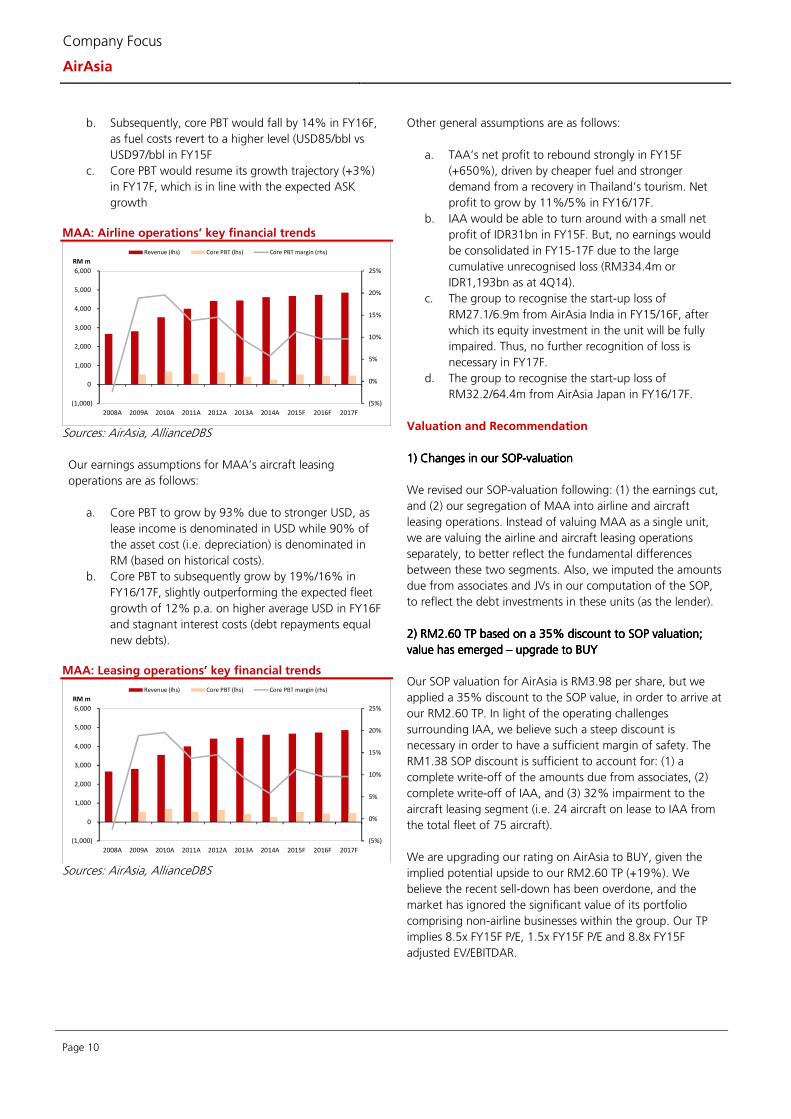
AAE Travel: Net profit trends
Sources: AirAsia, AllianceDBS
The divestment which was first announced on 17 Feb 2015,
came as a surprise to the investment community. While
management had always reiterated that it was looking to exit
its non-airline businesses, most were not expecting the
group’s stake in AAE (i.e. 50%) to be valued at above
RM500m. As such, the transaction has led investors to realise
that there could be more hidden gems among the group’s
portfolio of non-airline businesses.
2) 2) 2) 2) To monetise its nonTo monetise its nonTo monetise its nonTo monetise its non----Malaysian fleet Malaysian fleet Malaysian fleet Malaysian fleet bybybyby setting up a leasing setting up a leasing setting up a leasing setting up a leasing
househousehousehouse
Also, AirAsia is planning to monetise its large fleet of aircraft
via the setting up of a leasing house, named Asia Aviation
Capital Ltd (AAC). Already, the Labuan-based subsidiary has
obtained the regulatory approvals to carry out the leasing
business, and is set to take delivery of 45 aircraft by 1H15.
The leasing house will only manage aircraft that are on lease
to the group’s associates (i.e. non-Malaysian fleet).
We expect AirAsia to have a 75 aircraft on lease to its
associates by end-FY15F, but not all of these could be
injected into the leasing house in the near term. The situation
in Indonesia AirAsia (IAA) remains challenging, as the recent
QZ8501 incident has thrown a spanner to restructuring
efforts. It remains cash-strapped and is not likely to be able to
make good on the lease payments due. Thus, it would be
difficult to secure third party investors in the leasing house, if
IAA’s aircraft are injected into AAC.
AirAsia: Aircraft on lease to associates
Sources: AirAsia, AllianceDBS
According to management, its first priority with regards to
AAC is to secure a strategic investor to take up a stake in the
former. An Initial Public Offering (IPO) will only take place at a
later stage, presumably after all the non-Malaysian fleet of
aircraft have been novated to AAC. We do not expect this to
take place within the near term.
Based on management guidance that AAC could generate a
USD30m net income in FY15F, we think the unit could easily
fetch a valuation of USD300m (i.e. RM1.1bn), based on 10x
FY15F PE. This is in line with the average P/E valuation of
aircraft lessors listed in the US. As such, the sale of a 50%
stake in the AAC could easily raise c.RM550m for the group.
Valuation of listed aircraft leasing companies
Sources: Bloomberg Finance L.P.
-24.0
16.2 16.2 17.8
19.6 21.6
(30)
(20)
(10)
0
10
20
30
2012A 2013A 2014A 2015F 2016F 2017F
RM m
AAE Travel - Net Profit
-
10
20
30
40
50
60
70
80
90
100
2008A 2009A 2010A 2011A 2012A 2013A 2014A 2015F 2016F 2017F
# of aircrafts
B737s on lease to associates A320s on lease to associates
Company Country Call
Target
Price
Current
Price
Market
Cap
(LC) (LC) (USD m) CY15 CY16 CY15 CY16 CY15 CY16 CY15 CY16 CY15 CY16 CY15 CY16
China Aircraft
Leasing
Hong Kong NR NR 9.83 742 37 35 13.2 9.8 2.6 2.4 24.2 26.8 2.2 3.1 29.6 19.1
Aercap Holdings US NR NR 44.41 9,429 7 5 8.5 8.1 1.1 1.0 11.8 11.9 0.0 0.0 8.6 8.6
Air Lease US NR NR 38.85 3,984 16 18 14.0 11.9 1.3 1.2 11.0 11.8 0.4 0.5 10.4 9.5
Aircastle US NR NR 23.30 1,886 -3 11 11.7 10.5 1.0 1.0 8.3 9.2 3.8 3.9 8.1 7.9
Fly Leasing US NR NR 14.94 619 3 21 10.6 8.8 0.7 0.7 8.2 10.5 7.0 7.5 8.0 8.1
Sector Average 10 11 10.5 9.4 1.2 1.1 11.6 12.2 0.9 1.0 9.9 9.2
* Estimates based on Bloomberg consensus
EPS Growth P/E (x) P/BV (x) ROE (%)
Dividend Yield
(%) EV/EBITDA (x)
Page 8
Company Focus
AirAsia
IAA to remain a drag on the group; but a necessary
investment for AirAsia to be a pan-ASEAN airline
1) 1) 1) 1) Reasons behind IAA’s weak performance in FY13Reasons behind IAA’s weak performance in FY13Reasons behind IAA’s weak performance in FY13Reasons behind IAA’s weak performance in FY13----14141414
Indonesia AirAsia reported a loss in FY13-14, due to the
weakness in IDR, which had depreciated rapidly by 27% in
2013-14. This proved to be a challenge for IAA as the
majority of its revenue is denominated in IDR while a
significant portion of its OPEX (i.e. fuel, lease, maintenance) is
USD-denominated.
IDR has depreciated by 27% in 2013-14
Sources: Bloomberg Finance L.P.
Making matters worse, fares for the domestic routes are
regulated by the Indonesian aviation authorities. There is a
price ceiling for every domestic route and different classes of
airlines can charge different levels of maximum fares. Full-
service airlines can charge up to 100% of the price ceiling,
while medium-service airlines can charge up to 90% and no-
frills airlines, 85%.
In light of the rigid pricing regulations, IAA was unable
initially to raise fares sufficiently to offset the higher OPEX, at
a time when IDR was depreciating rapidly. While the price
ceiling was subsequently lifted, intense competition in the
domestic routes continues to be a dampener on fares.
How Indonesian regulators classify the different airlines
Full ServiceFull ServiceFull ServiceFull Service Medium ServiceMedium ServiceMedium ServiceMedium Service No FrillsNo FrillsNo FrillsNo Frills
Services and optional requirements covered by the fares (maximum service)
Some services covered by the fares (Iimited services)
Only essential services covered by the fares
Provide free baggage (30kg for international, 20kg for domestic)
Limited free baggage
Baggage fee implemented
Provide full inflight service
Provide limited inflight service
Inflight service is available on charged basis
Sources: CAPA, Indonesia DGCA
2) 2) 2) 2) TurnaroundTurnaroundTurnaroundTurnaround efforts proved fruitful in 2H14; should have efforts proved fruitful in 2H14; should have efforts proved fruitful in 2H14; should have efforts proved fruitful in 2H14; should have
been on track to breakbeen on track to breakbeen on track to breakbeen on track to break even in FY15F, but QZ8501 even in FY15F, but QZ8501 even in FY15F, but QZ8501 even in FY15F, but QZ8501 accidentaccidentaccidentaccident
could be stumbling blockcould be stumbling blockcould be stumbling blockcould be stumbling block
Given the challenging operating environment in Indonesian
domestic routes, IAA has decided to reduce capacity in the
domestic segment, and focus on its core international
segment. It terminated nine routes and reduced frequencies
in another six routes in 1H14. While IAA did not manage to
turn profitable as per management’s target for 2H14, we
view the network rationalisation strategy as being effective,
given the significant reduction in 2H net loss (-86% y-o-y; -
92% h-o-h).
However, the QZ8501 accident could prove to be a stumbling
block to IAA’s turnaround efforts. Promotional and marketing
activities were put on hold following the crash, out of
concern for the sensitivities of the victims’ families. We are
wary that this could have a negative impact on demand, and
thus affect yields and load factors in 1H15.
IAA: Originally on track to turn around in FY15F; but this could be disrupted by QZ8501 incident
Sources: AirAsia
However, we remain hopeful that the QZ8501 accident will
have no lasting harm on the group’s branding and goodwill.
Anecdotal evidence suggests the group CEO, Tan Sri Tony
Fernandes had done a wonderful job in handling the QZ8501
crisis. He took personal responsibility for the situation, made a
public apology to the victims’ families. He ensured that they
were well-informed of the situation on the ground and were
well taken care of. This has won AirAsia and IAA much
goodwill among the Indonesian citizens.
8,000
9,000
10,000
11,000
12,000
13,000
14,000
Jan
-12
Ma
r-1
2
Ma
y-1
2
Jul-
12
Se
p-1
2
No
v-1
2
Jan
-13
Ma
r-1
3
Ma
y-1
3
Jul-
13
Se
p-1
3
No
v-1
3
Jan
-14
Ma
r-1
4
Ma
y-1
4
Jul-
14
Se
p-1
4
No
v-1
4
Jan
-15
Ma
r-1
5
IDR/USD
Indonesia Rupiah
(500)
(400)
(300)
(200)
(100)
0
100
200
1Q
FY
10
2Q
FY
10
3Q
FY
10
4Q
FY
10
1Q
FY
11
2Q
FY
11
3Q
FY
11
4Q
FY
11
1Q
FY
12
2Q
FY
12
3Q
FY
12
4Q
FY
12
1Q
FY
13
2Q
FY
13
3Q
FY
13
4Q
FY
13
1Q
FY
14
2Q
FY
14
3Q
FY
14
4Q
FY
14
IDR bn
Net Profit - IAA

Page 9
Company Focus
AirAsia
3333) ) ) ) Delays in IAA’s turnaround could put further stress on Delays in IAA’s turnaround could put further stress on Delays in IAA’s turnaround could put further stress on Delays in IAA’s turnaround could put further stress on
AirAsia’s balance sheet; but we think this will not be too AirAsia’s balance sheet; but we think this will not be too AirAsia’s balance sheet; but we think this will not be too AirAsia’s balance sheet; but we think this will not be too
much of a problemmuch of a problemmuch of a problemmuch of a problem
AirAsia has seen the amount due from related parties (i.e.
associates and JV) surge from RM921m in 3Q13 to RM2.4bn
in 4Q14, mainly due to IAA. Faced with the difficult operating
environment in Indonesia, IAA was forced to defer payments
to AirAsia, and the latter had to step in to provide working
capital funding to the former.
AirAsia: Amounts due from related parties have surged since 3Q13, mainly due to IAA
Sources: IAA
The reclassification of RM1.8bn worth of these receivables
from current assets to non-current assets indicate that
management no longer expects that IAA would be able to
repay these dues within the near term. However,
management assured us that there would be no impairments
on any of these receivables from IAA, as there is sufficient
evidence to indicate that IAA would be able to repay these in
due time.
The potential delay in the turnaround of IAA could put
further stress on AirAsia’s balance sheet, as the latter may
have to continue to provide working capital support for the
former. However, we are not overly concern on this as: (1)
any setback to the turnaround due to the QZ8501 accident
would likely be temporary, (2) the monetisation of AirAsia’s
various non-core businesses would provide sufficient cash
inflow for the group, and (3) management’s decision to stop
adding aircraft to IAA’s network until it turns around, will
help to limit the size of the latter’s losses and cash needs.
4) 4) 4) 4) Launch of Launch of Launch of Launch of IAAXIAAXIAAXIAAX could drive some traffic to IAAcould drive some traffic to IAAcould drive some traffic to IAAcould drive some traffic to IAA
The upcoming launch of Indonesia AirAsia X (IAAX) with its
first hub at Denpasar International Airport, Bali could help to
feed more traffic into IAA’s network. IAAX has launched its
inaugural service to Taipei, Taiwan on 19 Jan 2015. Also, the
airline has launched its service to Melbourne, Australia on 18
Mar 2015, after it managed to overcome the Australian
regulatory hurdles. With Denpansar being the second largest
hub for IAA, we think there could potentially be spill-over
effects to IAA as IAAX launches more services in the future.
IAA: Depansar International Airport is the airline’s second largest hub
Sources: CAPA
Financial forecasts
1) 1) 1) 1) Split MAA Split MAA Split MAA Split MAA intointointointo airline airline airline airline operations and operations and operations and operations and aircraft aircraft aircraft aircraft leasing leasing leasing leasing
operations; operations; operations; operations; cut earnings on weaker RM and lower TAA cut earnings on weaker RM and lower TAA cut earnings on weaker RM and lower TAA cut earnings on weaker RM and lower TAA
earningsearningsearningsearnings
We have decided to review the presentation of our earnings
forecasts, and split Malaysia AirAsia’s (MAA) into two
different earnings stream: (1) airline operations, and (2)
aircraft leasing operations.
In doing this, we assume the group’s asset cost (i.e.
depreciation and lease expense) and finance costs are pro-
rated based on the respective segment’s fleet size. The
purpose of this exercise is to better reflect the inherent
differences of the two key earnings streams in our earnings
forecasts, and to facilitate the valuation of the leasing arm.
We have cut our FY15/16/17F earnings forecasts by
10%/21%/22%, to reflect: (1) the weaker MYR, and (2)
lower earnings of Thai AirAsia (TAA), which is the key reason
behind the steeper earnings cut in FY16/17F.
2) Key assumptions for our earnings forecasts2) Key assumptions for our earnings forecasts2) Key assumptions for our earnings forecasts2) Key assumptions for our earnings forecasts
Our earnings assumptions for MAA’s airline operations are as
follows:
a. Core PBT to double in FY15F, driven by higher load
factor of 82% (vs 79% in FY14, due to active
capacity management) and cheaper fuel.
600 602 473
380 263 239 265
808 791 760 727 818 812
917 921
1,338 1,434
1,816
2,323 2,445
0
500
1,000
1,500
2,000
2,500
3,000
1Q
10
2Q
10
3Q
10
4Q
10
1Q
11
2Q
11
3Q
11
4Q
11
1Q
12
2Q
12
3Q
12
4Q
12
1Q
13
2Q
13
3Q
13
4Q
13
1Q
14
2Q
14
3Q
14
4Q
14
RM m
Amount due from associates and JV
Page 10
Company Focus
AirAsia
b. Subsequently, core PBT would fall by 14% in FY16F,
as fuel costs revert to a higher level (USD85/bbl vs
USD97/bbl in FY15F
c. Core PBT would resume its growth trajectory (+3%)
in FY17F, which is in line with the expected ASK
growth
MAA: Airline operations’ key financial trends
Sources: AirAsia, AllianceDBS
Our earnings assumptions for MAA’s aircraft leasing
operations are as follows:
a. Core PBT to grow by 93% due to stronger USD, as
lease income is denominated in USD while 90% of
the asset cost (i.e. depreciation) is denominated in
RM (based on historical costs).
b. Core PBT to subsequently grow by 19%/16% in
FY16/17F, slightly outperforming the expected fleet
growth of 12% p.a. on higher average USD in FY16F
and stagnant interest costs (debt repayments equal
new debts).
MAA: Leasing operations’ key financial trends
Sources: AirAsia, AllianceDBS
Other general assumptions are as follows:
a. TAA’s net profit to rebound strongly in FY15F
(+650%), driven by cheaper fuel and stronger
demand from a recovery in Thailand’s tourism. Net
profit to grow by 11%/5% in FY16/17F.
b. IAA would be able to turn around with a small net
profit of IDR31bn in FY15F. But, no earnings would
be consolidated in FY15-17F due to the large
cumulative unrecognised loss (RM334.4m or
IDR1,193bn as at 4Q14).
c. The group to recognise the start-up loss of
RM27.1/6.9m from AirAsia India in FY15/16F, after
which its equity investment in the unit will be fully
impaired. Thus, no further recognition of loss is
necessary in FY17F.
d. The group to recognise the start-up loss of
RM32.2/64.4m from AirAsia Japan in FY16/17F.
Valuation and Recommendation
1) 1) 1) 1) Changes in our SOPChanges in our SOPChanges in our SOPChanges in our SOP----valuationvaluationvaluationvaluation
We revised our SOP-valuation following: (1) the earnings cut,
and (2) our segregation of MAA into airline and aircraft
leasing operations. Instead of valuing MAA as a single unit,
we are valuing the airline and aircraft leasing operations
separately, to better reflect the fundamental differences
between these two segments. Also, we imputed the amounts
due from associates and JVs in our computation of the SOP,
to reflect the debt investments in these units (as the lender).
2) RM2.60 TP based on 2) RM2.60 TP based on 2) RM2.60 TP based on 2) RM2.60 TP based on a a a a 35%35%35%35% discount to SOPdiscount to SOPdiscount to SOPdiscount to SOP valuation; valuation; valuation; valuation;
value has emerged value has emerged value has emerged value has emerged –––– uuuupgrade to BUYpgrade to BUYpgrade to BUYpgrade to BUY
Our SOP valuation for AirAsia is RM3.98 per share, but we
applied a 35% discount to the SOP value, in order to arrive at
our RM2.60 TP. In light of the operating challenges
surrounding IAA, we believe such a steep discount is
necessary in order to have a sufficient margin of safety. The
RM1.38 SOP discount is sufficient to account for: (1) a
complete write-off of the amounts due from associates, (2)
complete write-off of IAA, and (3) 32% impairment to the
aircraft leasing segment (i.e. 24 aircraft on lease to IAA from
the total fleet of 75 aircraft).
We are upgrading our rating on AirAsia to BUY, given the
implied potential upside to our RM2.60 TP (+19%). We
believe the recent sell-down has been overdone, and the
market has ignored the significant value of its portfolio
comprising non-airline businesses within the group. Our TP
implies 8.5x FY15F P/E, 1.5x FY15F P/E and 8.8x FY15F
adjusted EV/EBITDAR.
(5%)
0%
5%
10%
15%
20%
25%
(1,000)
0
1,000
2,000
3,000
4,000
5,000
6,000
2008A 2009A 2010A 2011A 2012A 2013A 2014A 2015F 2016F 2017F
RM m
Revenue (lhs) Core PBT (lhs) Core PBT margin (rhs)
(5%)
0%
5%
10%
15%
20%
25%
(1,000)
0
1,000
2,000
3,000
4,000
5,000
6,000
2008A 2009A 2010A 2011A 2012A 2013A 2014A 2015F 2016F 2017F
RM m
Revenue (lhs) Core PBT (lhs) Core PBT margin (rhs)

Page 11
Company Focus
AirAsia
AirAsia: SOP valuation
SegmentSegmentSegmentSegment StakeStakeStakeStake Value Value Value Value
(RM m)(RM m)(RM m)(RM m)
Per Per Per Per share share share share (RM)(RM)(RM)(RM)
CommentsCommentsCommentsComments
Malaysian AirAsia 100.0% 8,514 3.06
- Airline operations 100.0% 3,344 1.20 8x FY15F Adjusted EV/EBITDAR (less debt + capitalised lease)
- Aircraft leasing business 100.0% 2,664 0.96 10x FY15F P/E (less debt + capitalised lease)
- Net amount due from related parties 100.0% 2,506 0.90 As at 4Q14
Thai AirAsia 45.0% 1,441 0.52 9x FY15F Adjusted EV/EBITDAR (less debt + capitalised lease)
Indonesia AirAsia 48.9% 219 0.08 7x FY15F Adjusted EV/EBITDAR (less debt + capitalised lease)
AirAsia Philippines 40.0% 76 0.03 Cost of investment
AirAsia India 40.0% 47 0.02 Cost of investment
AirAsia X 13.8% 153 0.06 Based on our TP of RM0.47
Tune Ins 13.7% 199 0.07 Current market capitalisation
AAE Travel 25.0% 318 0.11 USD86.25m in line with latest transacted value
Asia Aviation Centre of Excellence 50.0% 103 0.04 1x FY13 P/BV, in line with APFT's valuation
SumsSumsSumsSums----OfOfOfOf----Parts ValueParts ValueParts ValueParts Value 11,069.5 11,069.5 11,069.5 11,069.5 3.98 3.98 3.98 3.98
Less: 35% SOP discount (3,874.3) (1.39) To reflect the challenges surrounding IAA
Target Equity ValueTarget Equity ValueTarget Equity ValueTarget Equity Value 7,195.2 7,195.2 7,195.2 7,195.2 2.602.602.602.60 Rounded to the nearest 5 sen
Sources: AirAsia, AllianceDBS
Peer comparison of regional LCCs
Sources: Bloomberg Finance L.P., AllianceDBS, DBS Vickers
Company Country Call
Target
Price
Current
Price
Market
Cap
(LC) (LC)
(USD
m) CY15 CY16 CY15 CY16 CY15 CY16 CY15 CY16 CY15 CY16 CY15 CY16
AirAsia Malaysia Buy 2.60 2.18 1,655 105 -2 7.1 7.3 1.3 1.1 5.5 16.1 0.8 2.8 8.6 8.1
AirAsia X Bhd Malaysia Fully
Valued
0.47 0.47 304 N/M 32 N/M N/M 2.3 3.1 -34.2 -32.4 0.0 0.0 10.1 8.2
Tiger Airways
Holdings
Singapore Buy 0.39 0.33 221 -104 775 124.2 14.2 3.2 2.6 -11.9 20.5 0.0 0.0 15.4 10.2
Cebu Air* Philippines NR NR 86.85 1,177 84 6 9.5 8.9 1.9 1.6 21.8 19.7 2.0 1.8 7.0 6.6
Asia Aviation PCL* Thailand NR NR 5.75 858 903 13 15.1 13.3 1.3 1.2 8.4 8.8 1.0 1.8 7.7 7.2
Nok Air* Thailand NR NR 13.00 250 288 19 9.2 7.7 1.7 1.5 19.3 21.1 5.4 6.8 7.2 6.8
Virgin Australia* Australia NR NR 0.51 1,414 148 46 22.4 15.4 1.6 1.4 2.1 9.9 0.0 0.2 6.4 6.0
Air Arabia PJSC* UAE NR NR 1.44 1,830 19 8 10.0 9.3 1.2 1.1 13.0 13.3 6.2 6.8 8.4 7.8
Southwest Airlines* US NR NR 45.44 30,717 75 6 12.9 12.1 3.3 2.7 29.7 24.9 0.6 0.7 5.9 5.4
JetBlue Airways* US NR NR 19.44 6,043 141 7 11.5 10.8 2.0 1.7 21.0 18.9 N/A N/A 5.7 5.2
Westjet Airlines* Canada NR NR 30.08 3,069 39 0 8.8 8.8 1.8 1.6 21.9 17.2 1.8 2.1 5.8 5.8
EasyJet Plc* UK NR NR 1868.00 11,086 28 6 12.6 11.9 2.9 2.5 21.9 21.7 3.3 3.6 8.2 7.4
Ryanair Holdings* Ireland NR NR 10.58 15,934 37 1 13.3 13.1 3.5 2.9 23.7 24.6 1.0 1.6 9.1 7.7
Sector Average 74 8 12.9 11.9 2.9 2.5 24.0 22.2 1.4 1.7 7.1 6.4
* Estimates based on Bloomberg consensus
Adjusted EV/
EBITDAR (x)EPS Growth P/E (x) P/BV (x) ROE (%)
Dividend Yield
(%)

Page 12
Company Focus
AirAsia
Key Investment Risks
1) 1) 1) 1) Further weakness in Further weakness in Further weakness in Further weakness in RMRMRMRM
RM has depreciated significantly (-15%) against the USD
since Jun 2014. This was mainly due to a myriad of factors:
(1) weaker fiscal outlook following the recent plunge in oil
prices, (2) negative publicity surrounding 1MDB, and (3) fund
outflow in anticipation of the interest rate hike by the US
Federal Reserve. If the trend continues, this could have grave
repercussions for AirAsia, as it will result in higher OPEX (55%
is USD-denominated) and finance cost (87% of borrowings is
in USD). However, we think AirAsia’s current share price has
sufficiently priced in this risk.
2) Perceived relationsh2) Perceived relationsh2) Perceived relationsh2) Perceived relationship with AAXip with AAXip with AAXip with AAX
The perceived relationship between AirAsia and AirAsia X
(AAX) has been a drag on the former’s share price
performance. Faced with mounting losses amid the difficult
operating environment, AAX was forced to seek fresh capital
and is currently in the midst of undertaking a rights issue.
Given the operating challenges faced by AAX, investors may
be concerned that AirAsia may have to underwrite the rights
issue. There are also worries that AirAsia may have to bail out
AAX, if the latter’s financial performance continues to
deteriorate in the future. The appointment of AirAsia
stalwarts Datuk Kamaruddin bin Meranun and Mr. Benyamen
bin Ismail to the executive positions at AAX further
accentuates this perception.
However, management has reiterated that AirAsia and AAX
are two separate legal entities, and it will not allow AAX's
problems to affect AirAsia. We understand that AirAsia would
only subscribe to a portion of the rights issue, even if AAX’s
rights issue fails to garner sufficient interest. Instead, the
rights issue will likely be underwritten by the other major
shareholders (i.e. Tune Group and Datuk Kamaruddin bin
Meranun).

Page 13
Company Focus
AirAsia
Key Assumptions
FY FY FY FY DecDecDecDec 2013201320132013AAAA 2014201420142014AAAA 2015201520152015FFFF 2016201620162016FFFF 2017201720172017FFFF
ASK growth (%) 12.2 3.6 2.0 (2.6) 2.6
Load Factor (%) 79.7 78.8 82.0 82.0 82.0
Fare / RPK (sen) 13.5 13.4 12.5 13.1 13.1
Ancillary income / pax (RM) 39.0 43.2 45.4 45.4 45.4
Cost / ASK (sen) 13.3 13.8 13.0 13.9 14.1 Segmental Breakdown
FY FY FY FY DecDecDecDec 2013201320132013AAAA 2014201420142014AAAA 2015201520152015FFFF 2016201620162016FFFF 2017201720172017FFFF Revenues (RM m)
MAA - Airline Operations 4,446 4,618 4,678 4,734 4,859
MAA - Aircraft leasing 666 791 996 1,135 1,265
Associates and JV N/A N/A N/A N/A N/A TotalTotalTotalTotal 5,1125,1125,1125,112 5,4085,4085,4085,408 5,6745,6745,6745,674 5,8695,8695,8695,869 6,1246,1246,1246,124
Core PBT (RM m) MAA - Airline Operations 416 266 528 454 466
MAA - Aircraft leasing 131 138 266 316 367
Associates and JV 55 38 90 93 76
TotalTotalTotalTotal 602602602602 442442442442 884884884884 863863863863 909909909909
Core PBT Margins (%) MAA - Airline Operations 9.3 5.8 11.3 9.6 9.6
MAA - Aircraft leasing 19.7 17.4 26.7 27.8 29.0
Associates and JV N/A N/A N/A N/A N/A
TotalTotalTotalTotal 11.811.811.811.8 8.28.28.28.2 15.615.615.615.6 14.714.714.714.7 14.814.814.814.8
Income Statement (RM m)
FY FY FY FY DecDecDecDec 2013201320132013AAAA 2014201420142014AAAA 2015201520152015FFFF 2016201620162016FFFF 2017201720172017FFFF
Revenue 5,112 5,416 5,674 5,869 6,124
Other Opng (Exp)/Inc (4,249) (4,600) (4,393) (4,596) (4,773)
Operating ProfitOperating ProfitOperating ProfitOperating Profit 863863863863 815815815815 1,2811,2811,2811,281 1,2741,2741,2741,274 1,3511,3511,3511,351 Other Non Opg (Exp)/Inc 0 0 0 0 0
Associates & JV Inc 55 38 90 93 76
Net Interest (Exp)/Inc (316) (412) (487) (504) (518)
Exceptional Gain/(Loss) (241) (419) (597) 0 0
PrePrePrePre----tax Profittax Profittax Profittax Profit 361361361361 23232323 286286286286 863863863863 909909909909 Tax 1 60 (30) (28) (25)
Minority Interest 0 0 0 0 0
Preference Dividend 0 0 0 0 0
Net ProfitNet ProfitNet ProfitNet Profit 362362362362 83838383 256256256256 835835835835 884884884884 Net Profit before Except. 583 416 854 835 884
EBITDA 1,515 1,573 2,078 2,132 2,274
Growth
Revenue Gth (%) 3.4 5.9 4.8 3.4 4.3
EBITDA Gth (%) (4.9) 3.8 32.1 2.6 6.7
Opg Profit Gth (%) (16.1) (5.5) 57.1 (0.6) 6.0
Net Profit Gth (%) (54.1) (77.1) 209.8 225.6 6.0
Margins & Ratio
Opg Profit Margin (%) 16.9 15.1 22.6 21.7 22.1
Net Profit Margin (%) 7.1 1.5 4.5 14.2 14.4
ROAE (%) 7.3 1.7 5.5 16.1 14.9
ROA (%) 2.2 0.4 1.2 3.9 4.0
ROCE (%) 5.6 4.6 6.0 6.1 6.3
Div Payout Ratio (%) 30.7 20.0 20.0 20.0 20.0
Net Interest Cover (x) 2.7 2.0 2.6 2.5 2.6
Source: Company, AllianceDBS
Sensitivity Analysis 2015201520152015
Fare RPK +/- 1% Net Profit +/- 4% Load factor +/- 1% Net Profit +/- 7%
Margins Trend
1.0%
6.0%
11.0%
16.0%
21.0%
2013A 2014A 2015F 2016F 2017F
Operating Margin % Net Income Margin %
Mainly due to higher jet fuel cost assumption in FY16F
Expected unrealised translation loss on borrowings due to weaker RM

Page 14
Company Focus
AirAsia
Quarterly / Interim Income Statement (RM m)
FY FY FY FY DecDecDecDec 4Q4Q4Q4Q2013201320132013 1Q1Q1Q1Q2014201420142014 2Q2Q2Q2Q2014201420142014 3Q3Q3Q3Q2014201420142014 4Q4Q4Q4Q2014201420142014
Revenue 1,277 1,302 1,311 1,317 1,478
Other Oper. (Exp)/Inc (1,096) (1,095) (1,170) (1,117) (1,102)
Operating ProfitOperating ProfitOperating ProfitOperating Profit 181181181181 208208208208 141141141141 200200200200 376376376376 Other Non Opg (Exp)/Inc 0 0 0 0 0
Associates & JV Inc 22 16 (9) 27 13
Net Interest (Exp)/Inc (82) (97) (103) (98) (116)
Exceptional Gain/(Loss) (24) 7 226 (103) (502)
PrePrePrePre----tax Profittax Profittax Profittax Profit 97979797 134134134134 255255255255 26262626 (229)(229)(229)(229) Tax 72 6 112 (21) (37)
Minority Interest 0 0 0 0 0
Net ProfitNet ProfitNet ProfitNet Profit 169169169169 140140140140 367367367367 5555 (265)(265)(265)(265) Net profit bef Except. 115 124 26 119 265
EBITDA 326 388 322 407 575
Growth
Revenue Gth (%) (0.3) 2.0 0.7 0.5 12.2
EBITDA Gth (%) (28.5) 19.0 (16.9) 26.4 41.0
Opg Profit Gth (%) (32.4) 14.9 (32.1) 42.2 87.8
Net Profit Gth (%) 374.9 (17.1) 162.8 (98.5) nm
Margins Opg Profit Margins (%) 14.2 15.9 10.7 15.2 25.5
Net Profit Margins (%) 13.2 10.7 28.0 0.4 (17.9)
Balance Sheet (RM m)
FY FY FY FY DecDecDecDec 2013201320132013AAAA 2014201420142014AAAA 2015201520152015FFFF 2016201620162016FFFF 2017201720172017FFFF Net Fixed Assets 11,935 13,036 13,129 13,925 15,239
Invts in Associates & JVs 954 422 320 412 489
Other LT Assets 2,044 4,676 4,676 4,676 4,676
Cash & ST Invts 1,384 1,623 1,963 1,880 1,224
Inventory 30 18 18 18 18
Debtors 1,510 668 699 724 755
Other Current Assets 0 0 0 0 0
Total AssetsTotal AssetsTotal AssetsTotal Assets 17,85617,85617,85617,856 20,44320,44320,44320,443 20,80620,80620,80620,806 21,63521,63521,63521,635 22,40122,40122,40122,401
ST Debt
1,119 2,275 2,275 2,275 2,275
Creditor 761 626 600 628 652
Other Current Liab 692 984 536 554 578
LT Debt 9,970 10,453 11,050 11,050 11,050
Other LT Liabilities 313 1,548 1,548 1,548 1,548
Shareholder’s Equity 5,001 4,557 4,797 5,580 6,298
Minority Interests 0 0 0 0 0
Total Cap. & Liab.Total Cap. & Liab.Total Cap. & Liab.Total Cap. & Liab. 17,85617,85617,85617,856 20,44320,44320,44320,443 20,80620,80620,80620,806 21,63521,63521,63521,635 22,40122,40122,40122,401
Non-Cash Wkg. Capital 87 (924) (418) (440) (457)
Net Cash/(Debt) (9,706) (11,105) (11,362) (11,445) (12,101)
Debtors Turn (avg days) 94.6 73.4 44.0 44.2 44.1
Creditors Turn (avg days) (439.8) (351.7) (316.1) (292.6) (275.7)
Inventory Turn (avg days) (16.3) (12.1) (9.4) (8.7) (7.8)
Asset Turnover (x) 0.3 0.3 0.3 0.3 0.3
Current Ratio (x) 1.1 0.6 0.8 0.8 0.6
Quick Ratio (x) 1.1 0.6 0.8 0.8 0.6
Net Debt/Equity (X) 1.9 2.4 2.4 2.1 1.9
Net Debt/Equity ex MI (X) 1.9 2.4 2.4 2.1 1.9
Capex to Debt (%) 20.3 14.3 6.0 11.7 16.2
Z-Score (X) 1.0 0.8 1.0 1.0 1.1
Source: Company, AllianceDBS
Revenue Trend
Asset Breakdown (2015)
-8%
-6%
-4%
-2%
0%
2%
4%
6%
8%
10%
12%
14%
1,100
1,150
1,200
1,250
1,300
1,350
1,400
1,450
1,500
3Q
201
2
4Q
201
2
1Q
201
3
2Q
201
3
3Q
201
3
4Q
201
3
1Q
201
4
2Q
201
4
3Q
201
4
4Q
201
4
Revenue Revenue Growth % (QoQ)
OPEX remain high in 4Q14, as fuel cost were hedged at higher costs

Page 15
Company Focus
AirAsia
Cash Flow Statement (RM m)
FY FY FY FY DecDecDecDec 2013201320132013AAAA 2014201420142014AAAA 2015201520152015FFFF 2016201620162016FFFF 2017201720172017FFFF
Pre-Tax Profit 361 23 286 863 909
Dep. & Amort. 597 719 708 766 847
Tax Paid (29) (15) (30) (28) (25)
Assoc. & JV Inc/(loss) (55) (38) (90) (93) (76)
Chg in Wkg.Cap. (108) (917) (221) 22 17
Other Operating CF 276 424 597 0 0
Net Operating CFNet Operating CFNet Operating CFNet Operating CF 961961961961 196196196196 1,2501,2501,2501,250 1,5291,5291,5291,529 1,6721,6721,6721,672 Capital Exp.(net) (2,254) (1,825) (801) (1,561) (2,161)
Other Invts.(net) 0 49 0 0 0
Invts in Assoc. & JV (93) (270) 192 0 0
Div from Assoc & JV 0 0 0 0 0
Other Investing CF 0 0 0 0 0
Net Investing CFNet Investing CFNet Investing CFNet Investing CF (2,346)(2,346)(2,346)(2,346) (2,045)(2,045)(2,045)(2,045) (609)(609)(609)(609) (1,561)(1,561)(1,561)(1,561) (2,161)(2,161)(2,161)(2,161) Div Paid (667) (111) (17) (51) (167)
Chg in Gross Debt 1,175 1,886 0 0 0
Capital Issues 1 2 0 0 0
Other Financing CF (1) (1) 0 0 0
Net Financing CFNet Financing CFNet Financing CFNet Financing CF 508508508508 1,7751,7751,7751,775 (17)(17)(17)(17) (51)(51)(51)(51) (167)(167)(167)(167)
Currency Adjustments 24 30 0 0 0
Chg in Cash (853) (44) 625 (83) (656)
Opg CFPS (sen) 38.4 40.0 52.9 54.2 59.5
Free CFPS (sen) (46.5) (58.6) 16.2 (1.1) (17.6)
Source: Company, AllianceDBS
Capital Expenditure
Target Price & Ratings History
Source: AllianceDBS
0
500
1000
1500
2000
2500
2013A 2014A 2015F 2016F 2017F
Capital Expenditure (-)
S.No.S.No.S.No.S.No. Da teDa teDa teDa teClos ing Clos ing Clos ing Clos ing
Pri cePri cePri cePri ce
Ta rge t Ta rge t Ta rge t Ta rge t
Pric ePric ePric ePric eRa ting Ra ting Ra ting Ra ting
1: 09 May 14 2.21 2.40 Hold
2: 21 May 14 2.45 2.80 Buy
3: 02 Jul 14 2.30 2.80 Buy
4: 15 Aug 14 2.37 3.20 Buy
5: 21 Aug 14 2.40 3.20 Buy
6: 02 Sep 14 2.47 3.20 Buy
7: 28 Oct 14 2.39 3.20 Buy
8: 11 Nov 14 2.59 3.20 Buy
9: 20 Nov 14 2.42 3.20 Buy
10: 29 Dec 14 2.69 2.80 Hold
11: 27 Jan 15 2.77 2.80 Hold
12: 27 Feb 15 2.62 2.60 Hold
Note Note Note Note : Share price and Target price are adjusted for corporate actions.
1
2
3
4
5
6
7
8
9
10
11 12
2.07
2.27
2.47
2.67
2.87
3.07
Mar-14 Jul-14 Nov-14 Mar-15
RMRMRMRM

Page 16
Company Focus
AirAsia
DISCLOSURE
Stock rating definitions STRONG BUY - > 20% total return over the next 3 months, with identifiable share price catalysts within this time frame BUY - > 15% total return over the next 12 months for small caps, >10% for large caps HOLD - -10% to +15% total return over the next 12 months for small caps, -10% to +10% for large caps FULLY VALUED - negative total return > -10% over the next 12 months SELL - negative total return of > -20% over the next 3 months, with identifiable catalysts within this time frame Commonly used abbreviations Adex = advertising expenditure EPS = earnings per share PBT = profit before tax bn = billion EV = enterprise value P/B = price / book ratio BV = book value FCF = free cash flow P/E = price / earnings ratio CF = cash flow FV = fair value PEG = P/E ratio to growth ratio CAGR = compounded annual growth rate FY = financial year q-o-q = quarter-on-quarter Capex = capital expenditure m = million RM = Ringgit CY = calendar year M-o-m = month-on-month ROA = return on assets Div yld = dividend yield NAV = net assets value ROE = return on equity DCF = discounted cash flow NM = not meaningful TP = target price DDM = dividend discount model NTA = net tangible assets trn = trillion DPS = dividend per share NR = not rated WACC = weighted average cost of capital EBIT = earnings before interest & tax p.a. = per annum y-o-y = year-on-year EBITDA = EBIT before depreciation and amortisation PAT = profit after tax YTD = year-to-date

Page 17
Company Focus
AirAsia
DISCLAIMER
This report has been prepared for information purposes only by AllianceDBS Research Sdn Bhd (“ADBSR”) (formerly known as HwangDBS Vickers Research Sdn Bhd), a subsidiary of Alliance Investment Bank Berhad (“AIBB”) and an associate of DBS Vickers Securities Holdings Pte Ltd (“DBSVH”). DBSVH is a wholly-owned subsidiary of DBS Bank Ltd. This report is strictly confidential and is meant for circulation to clients of ADBSR, AIBB and DBSVH only or such persons as may be deemed eligible to receive such research report, information or opinion contained herein. Receipt and review of this report indicate your agreement not to distribute, reproduce or disclose in any other form or medium (whether electronic or otherwise) the contents, views, information or opinions contained herein without the prior written consent of ADBSR. This report is based on data and information obtained from various sources believed to be reliable at the time of issuance of this report and any opinion expressed herein is subject to change without prior notice and may differ or be contrary to opinions expressed by ADBSR’s affiliates and/or related parties. ADBSR does not make any guarantee, representation or warranty (whether express or implied) as to the accuracy, completeness, reliability or fairness of the data and information obtained from such sources as may be contained in this report. As such, neither ADBSR nor its affiliates and/or related parties shall be held liable or responsible in any manner whatsoever arising out of or in connection with the reliance and usage of such data and information or third party references as may be made in this report (including, but not limited to any direct, indirect or consequential losses, loss of profits and damages). The views expressed in this report reflect the personal views of the analyst(s) about the subject securities or issuers and no part of the compensation of the analyst(s) was, is, or will be directly or indirectly related to the inclusion of specific recommendation(s) or view(s) in this report. ADBSR prohibits the analyst(s) who prepared this report from receiving any compensation, incentive or bonus based on specific investment banking transactions or providing a specific recommendation for, or view of, a particular company. This research report provides general information only and is not to be construed as an offer to sell or a solicitation to buy or sell any securities or other investments or any options, futures, derivatives or other instruments related to such securities or investments. In particular, it is highlighted that this report is not intended for nor does it have regard to the specific investment objectives, financial situation and particular needs of any specific person who may receive this report. Investors are therefore advised to make their own independent evaluation of the information contained in this report, consider their own individual investment objectives, financial situations and particular needs and consult their own professional advisers (including but not limited to financial, legal and tax advisers) regarding the appropriateness of investing in any securities or investments that may be featured in this report. ADBSR, AIBB, DBSVH and DBS Bank Ltd, their directors, representatives and employees or any of their affiliates or their related parties may, from time to time, have an interest in the securities mentioned in this report. AIBB, DBSVH and DBS Bank Ltd, their affiliates and/or their related persons may do and/or seek to do business with the company(ies) covered in this report and may from time to time act as market maker or have assumed an underwriting commitment in securities of such company(ies), may sell or buy such securities from customers on a principal basis and may also perform or seek to perform significant investment banking, advisory or underwriting services for or relating to such company(ies) as well as solicit such investment, advisory or other services from any entity mentioned in this report. AIBB, DBSVH, DBS Bank Ltd (which carries on, inter alia, corporate finance activities) and their activities are separate from ADBSR. AIBB, DBSVH and DBS Bank Ltd may have no input into company-specific coverage decisions (i.e. whether or not to initiate or terminate coverage of a particular company or securities in reports produced by ADBSR) and ADBSR does not take into account investment banking revenues or potential revenues when making company-specific coverage decisions. ADBSR, AIBB, DBSVH, DBS Bank Ltd and/or other affiliates of DBS Vickers Securities (USA) Inc (“DBSVUSA”), a U.S.-registered broker-dealer, may beneficially own a total of 1% or more of any class of common equity securities of the subject company mentioned in this report. ADBSR, AIBB, DBSVH, DBS Bank Ltd and/or other affiliates of DBSVUSA may, within the past 12 months, have received compensation and/or within the next 3 months seek to obtain compensation for investment banking services from the subject company. DBSVUSA does not have its own investment banking or research department, nor has it participated in any investment banking transaction as a manager or co-manager in the past twelve months. Any US persons wishing to obtain further information, including any clarification on disclosures in this disclaimer, or to effect a transaction in any security discussed in this report should contact DBSVUSA exclusively. DBS Vickers Securities (UK) Ltd is an authorised person in the meaning of the Financial Services and Markets Act and is regulated by The Financial Services Authority. Research distributed in the UK is intended only for institutional clients. In reviewing this report, an investor should be aware that any or all of the foregoing, among other things, may give rise to real or potential conflicts of interest. Additional information is, subject to the overriding issue of confidentiality, available upon request to enable an investor to make their own independent evaluation of the information contained herein.
Wong Ming Tek, Executive Director
Published and Printed by
AllianceDBS Research Sdn Bhd AllianceDBS Research Sdn Bhd AllianceDBS Research Sdn Bhd AllianceDBS Research Sdn Bhd (128540 U)
(formerly known as HWANGDBS Vickers Research Sdn Bhd)
19th Floor, Menara Multi-Purpose, Capital Square, 8 Jalan Munshi Abdullah, 50100 Kuala Lumpur, Malaysia.
Tel.: +603 2604 3333 Fax: +603 2604 3921 email : [email protected]


![150324 jeans[1]](https://static.fdocuments.net/doc/165x107/568cadce1a28ab186dad4136/150324-jeans1.jpg)