Agronomic, Economic an Environmental Benefits of Nitrogen...
30
Agronomic, Economic and Environmental Benefits of Nitrogen Fertilizer Management Len Kryzanowski, P.Ag. Section Lead, Land Use Section Alberta Agriculture and Rural Development
Transcript of Agronomic, Economic an Environmental Benefits of Nitrogen...
Agronomic, Economic and Environmental Benefits of
Nitrogen Fertilizer Management
Len Kryzanowski, P.Ag.
Section Lead, Land Use Section Alberta Agriculture and Rural Development

Acknowledgements • R. McKenzie, J. O’Donovan, E. Smith, R. Dunn,
T. Goddard, A. Akbar
Field and Lab Technical Support • C. Sprout, A.B. Middleton, B. Henriquez,
P. Pfiffer, D. Thiessen, C. Hietamaa, S. Jess, D. Werk, L. Powers, G. Lohstraeter
• L. Michelsen, P. Reid, J. Zuidof, G. Semech
Funding • Alberta Crop Industry Development Fund
(ACIDF)

ESN Fertilizer Technology Development
Collaborative 4 year study 2008-2012: ARD
• ESD (Land Use) • RIAD (Food & Bio-Industrial Crops)
AAFC – Lacombe, Beaverlodge Agrium ACIDF
Objectives
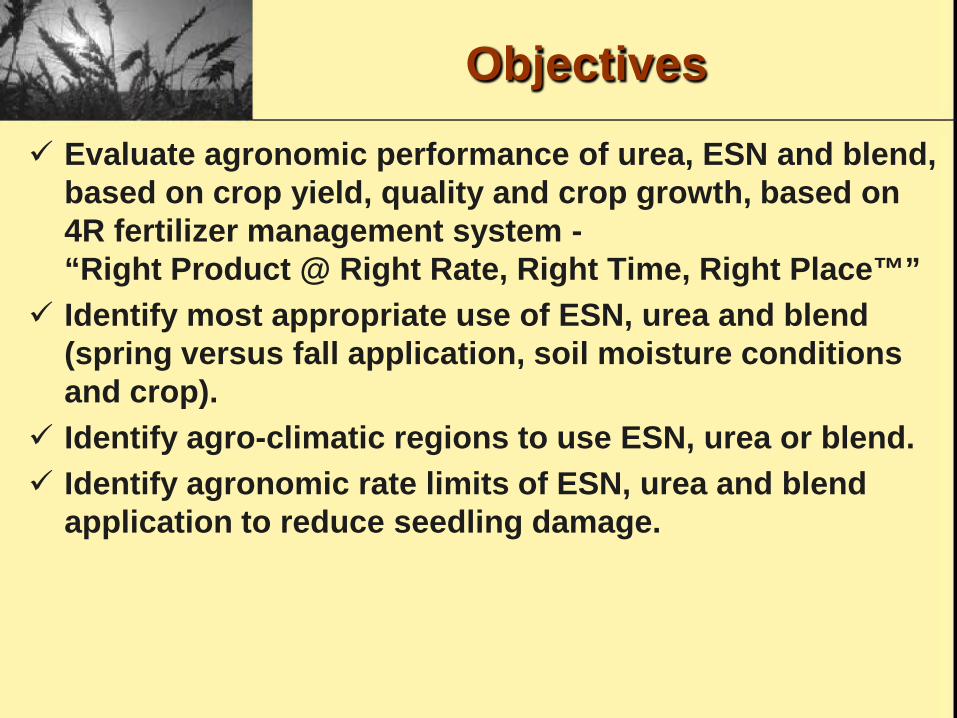
Evaluate agronomic performance of urea, ESN and blend, based on crop yield, quality and crop growth, based on 4R fertilizer management system - “Right Product @ Right Rate, Right Time, Right Place™”
Identify most appropriate use of ESN, urea and blend (spring versus fall application, soil moisture conditions and crop).
Identify agro-climatic regions to use ESN, urea or blend. Identify agronomic rate limits of ESN, urea and blend
application to reduce seedling damage.
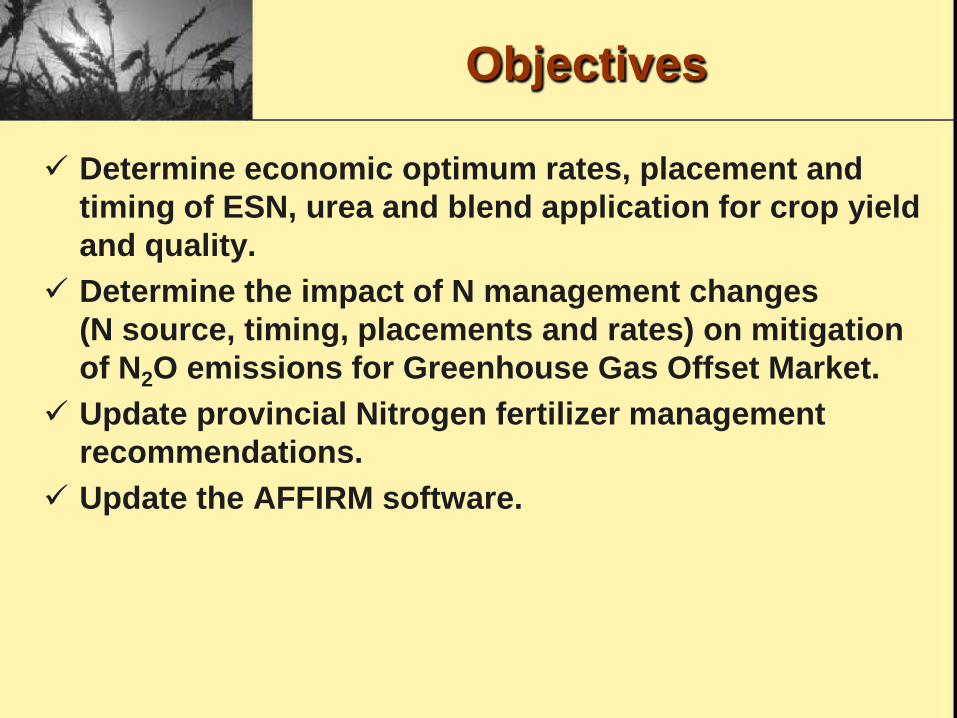
Objectives
Determine economic optimum rates, placement and timing of ESN, urea and blend application for crop yield and quality.
Determine the impact of N management changes (N source, timing, placements and rates) on mitigation of N2O emissions for Greenhouse Gas Offset Market.
Update provincial Nitrogen fertilizer management recommendations.
Update the AFFIRM software.
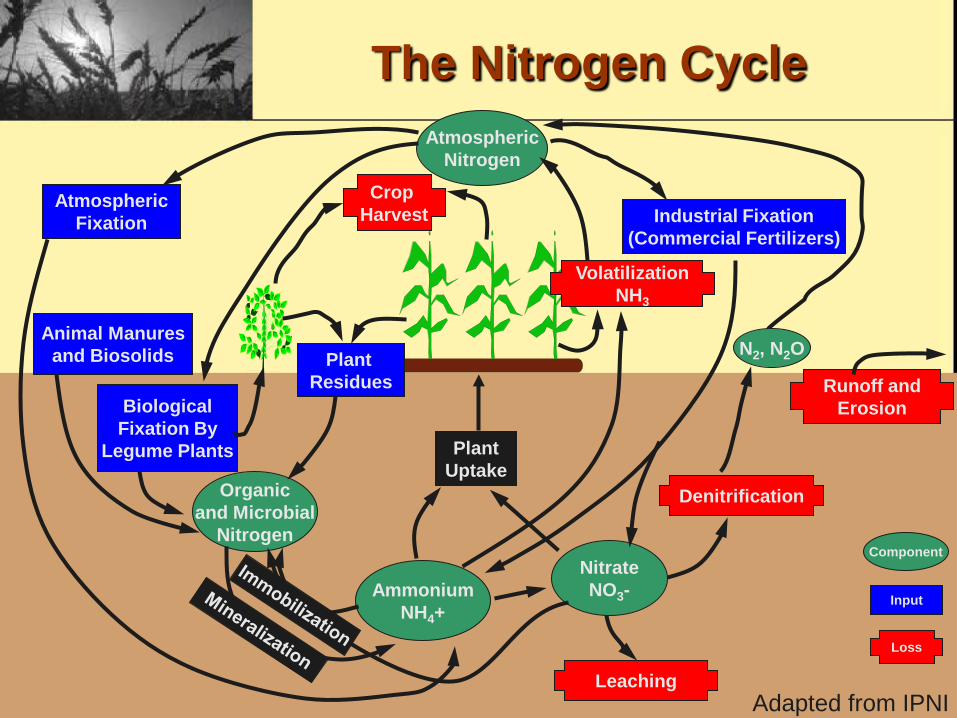
The Nitrogen Cycle Atmospheric
Nitrogen
Atmospheric Fixation
Animal Manures and Biosolids
Industrial Fixation (Commercial Fertilizers)
Crop Harvest
Volatilization NH3
Denitrification
Runoff and Erosion
Leaching
Organic and Microbial
Nitrogen
Ammonium NH4+
Nitrate NO3-
Plant Residues
Biological Fixation By
Legume Plants Plant Uptake
Input
Component
Loss
N2, N2O
Adapted from IPNI
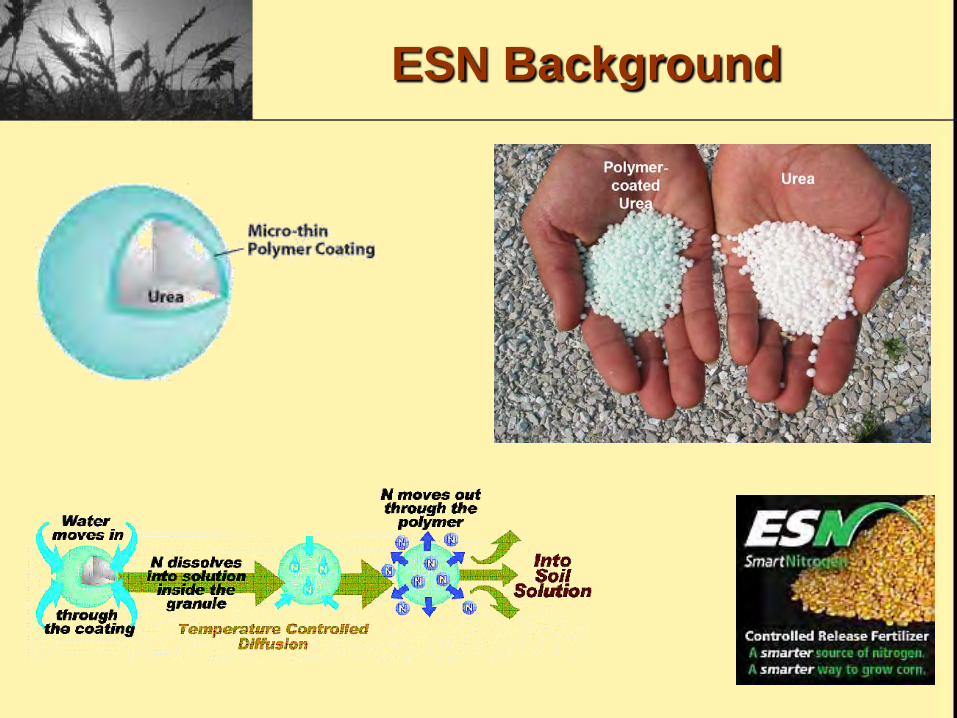
ESN Background
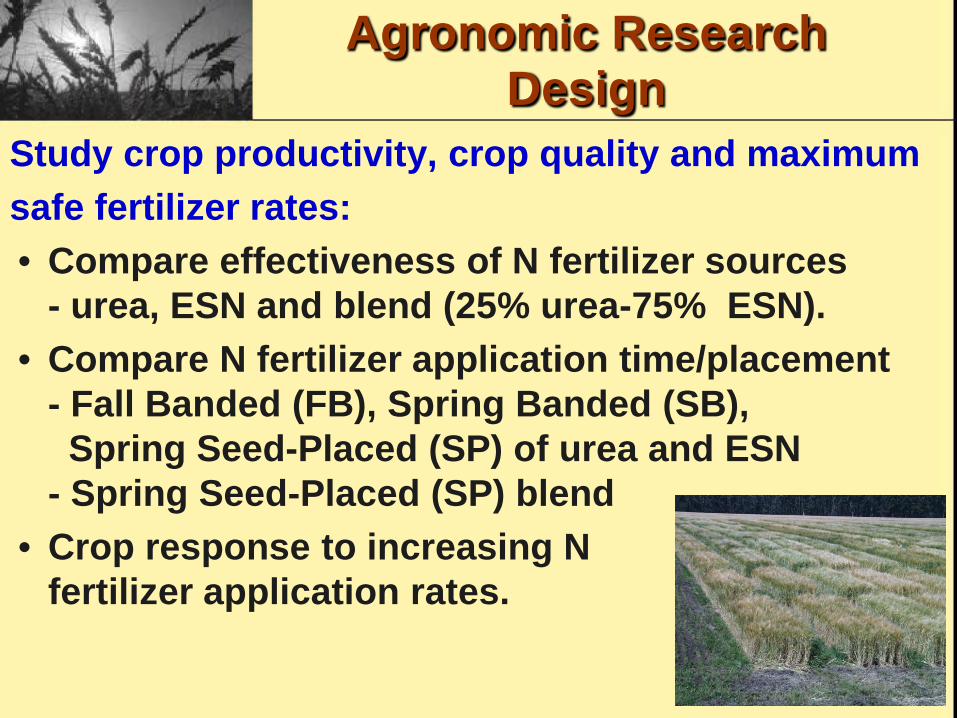
Agronomic Research Design
Study crop productivity, crop quality and maximum safe fertilizer rates: • Compare effectiveness of N fertilizer sources
- urea, ESN and blend (25% urea-75% ESN). • Compare N fertilizer application time/placement
- Fall Banded (FB), Spring Banded (SB), Spring Seed-Placed (SP) of urea and ESN - Spring Seed-Placed (SP) blend
• Crop response to increasing N fertilizer application rates.
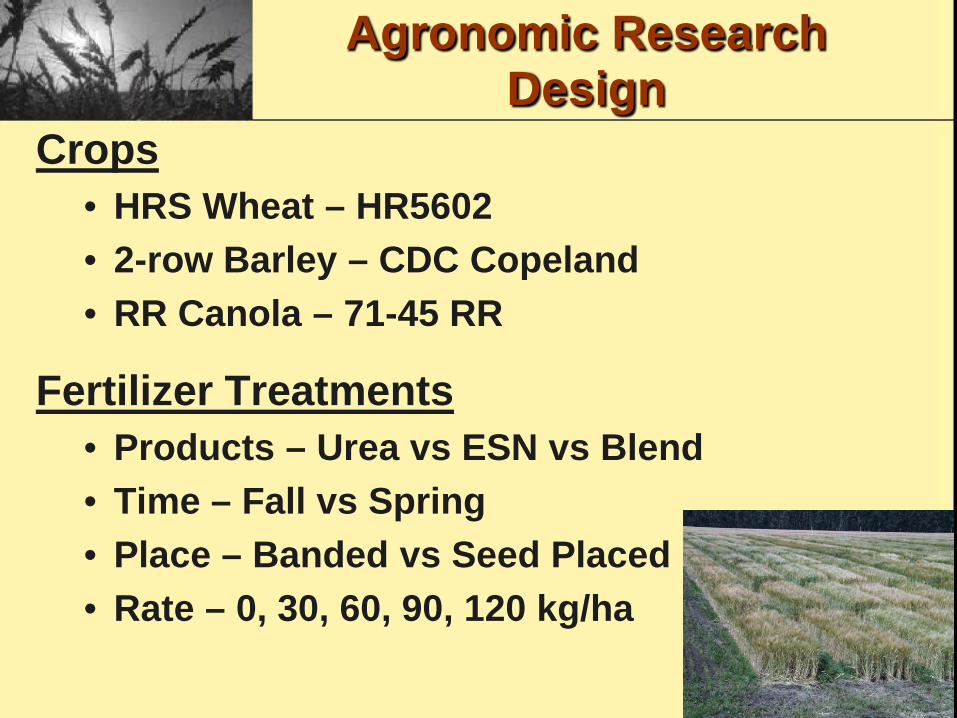
Agronomic Research Design
Crops • HRS Wheat – HR5602 • 2-row Barley – CDC Copeland • RR Canola – 71-45 RR
Fertilizer Treatments • Products – Urea vs ESN vs Blend • Time – Fall vs Spring • Place – Banded vs Seed Placed • Rate – 0, 30, 60, 90, 120 kg/ha
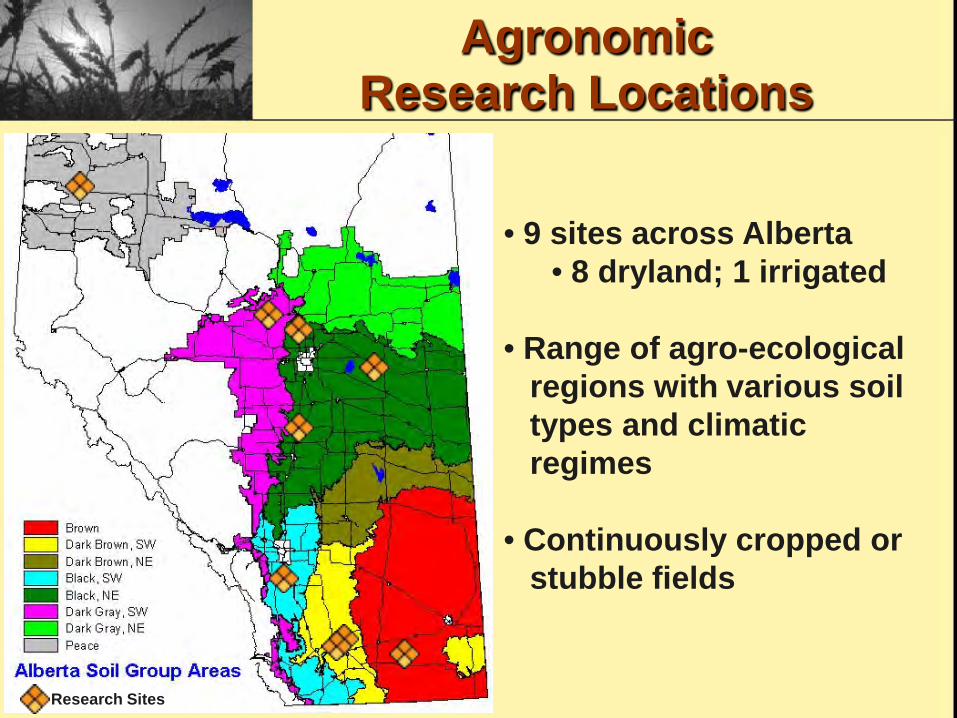
Agronomic Research Locations
Research Sites
• 9 sites across Alberta • 8 dryland; 1 irrigated
• Range of agro-ecological regions with various soil types and climatic regimes • Continuously cropped or stubble fields

Crop Data
• Emergence, heading and maturity dates, • Plant counts at about the 2-3 leaf stage, • After harvest
• percent grain moisture content, • grain yield, • test weight, • 1000 kernel weight, • grain protein • kernel plumpness and thins (barley) • percent oil (canola)
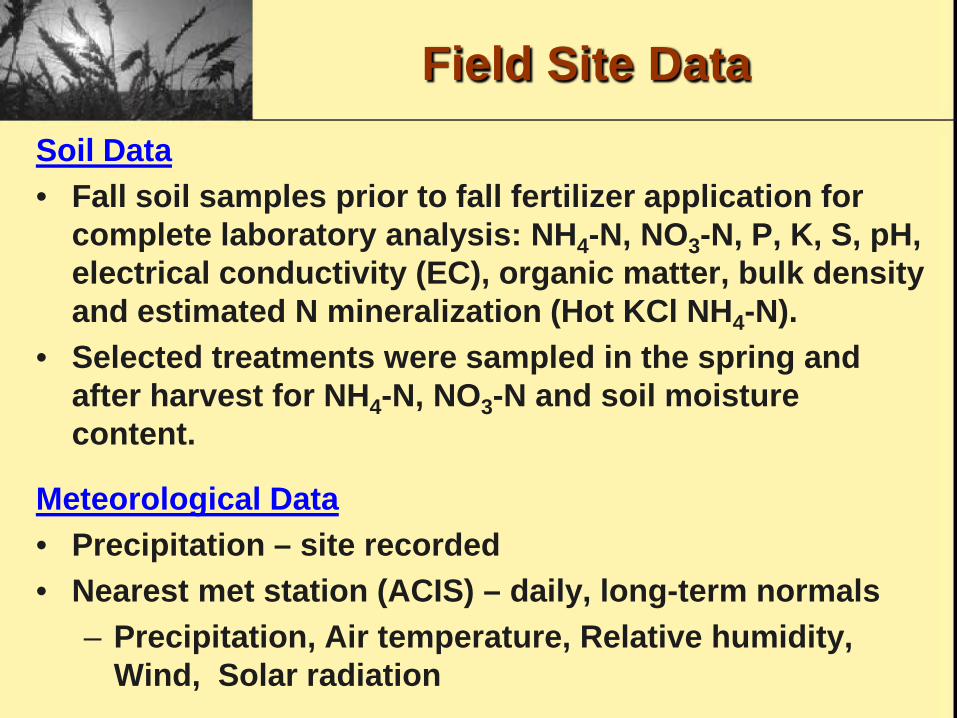
Field Site Data Soil Data • Fall soil samples prior to fall fertilizer application for
complete laboratory analysis: NH4-N, NO3-N, P, K, S, pH, electrical conductivity (EC), organic matter, bulk density and estimated N mineralization (Hot KCl NH4-N).
• Selected treatments were sampled in the spring and after harvest for NH4-N, NO3-N and soil moisture content.
Meteorological Data • Precipitation – site recorded • Nearest met station (ACIS) – daily, long-term normals
– Precipitation, Air temperature, Relative humidity, Wind, Solar radiation

Meteorological Summary
Site 2008 2009 2010 Bow Island 286.6 (136) 176.3 (84) 361.3 (169) Lethbridge (Dryland) 342.6 (136) 215.5 (85) 393.2 (156) Lethbridge (Irrigated) 342.6 (136) 215.5 (85) 393.2 (156) High River 372.9 (114) 242.1 (74) 323.0 (96) Vegreville 238.6 (86) 100.5 (36) Willingdon 365.1 (121) Lacombe 297.2 (92) 208.3 (65) 457.6 (135) Gibbons 211.5 (68) 167.5 (54) 317.5 (101) Barrhead 220.4 (67) 157.7 (48) 293.1 (88) Beaverlodge 197.5 (72) 186.2 (68) 195.1 (67)
( ) precipitation as % of long-term normal
Total Growing Season (May-September) Precipitation (mm)
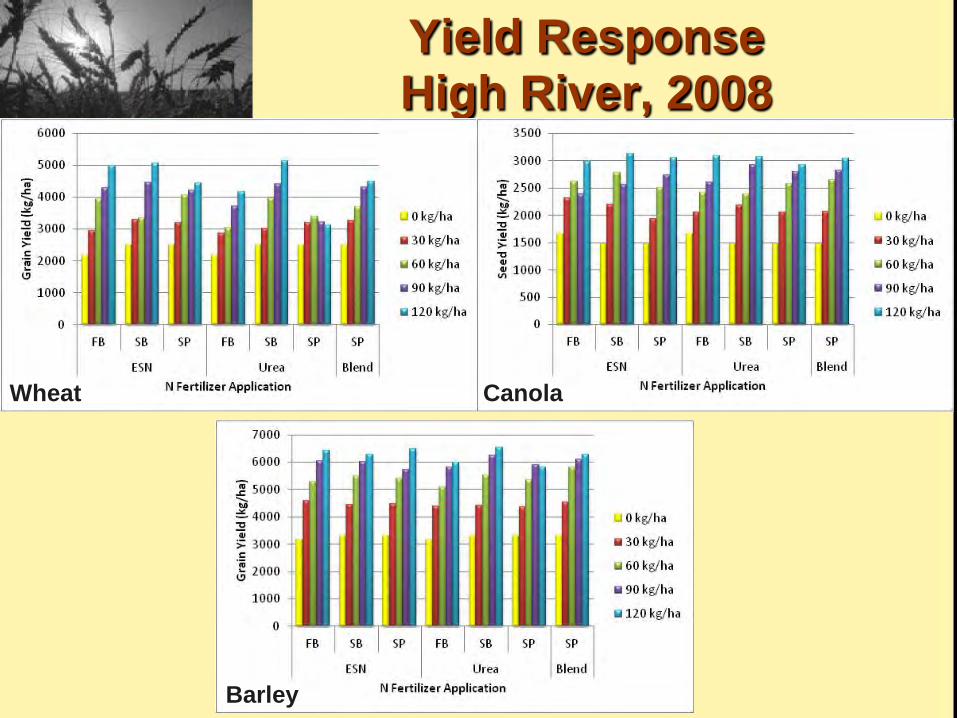
Yield Response High River, 2008
Wheat Canola
Barley
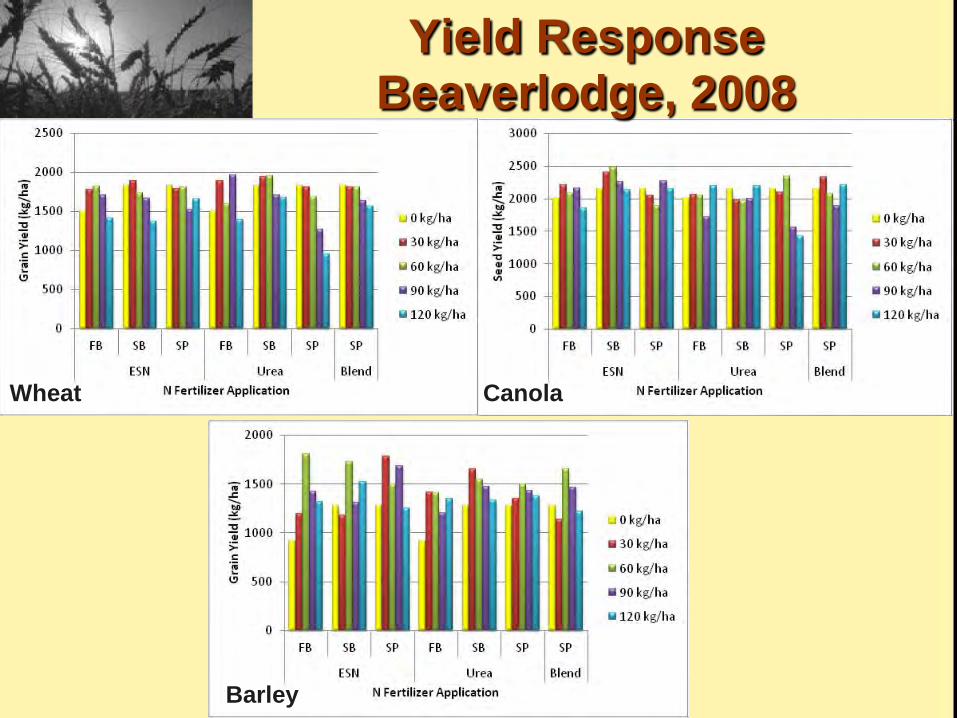
Yield Response Beaverlodge, 2008
Wheat Canola
Barley
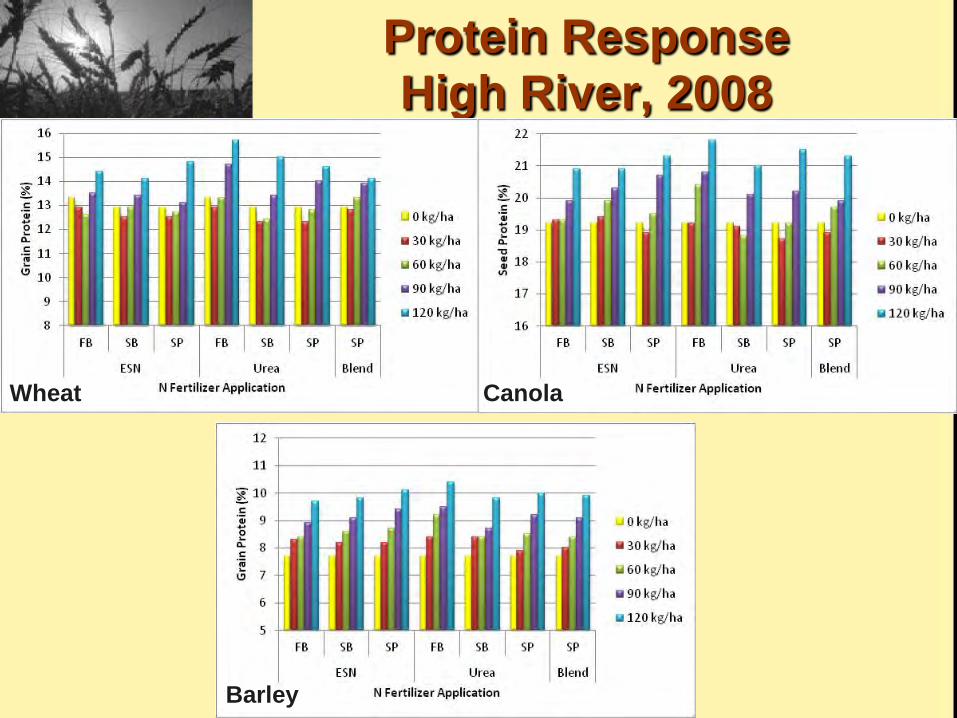
Protein Response High River, 2008
Wheat Canola
Barley
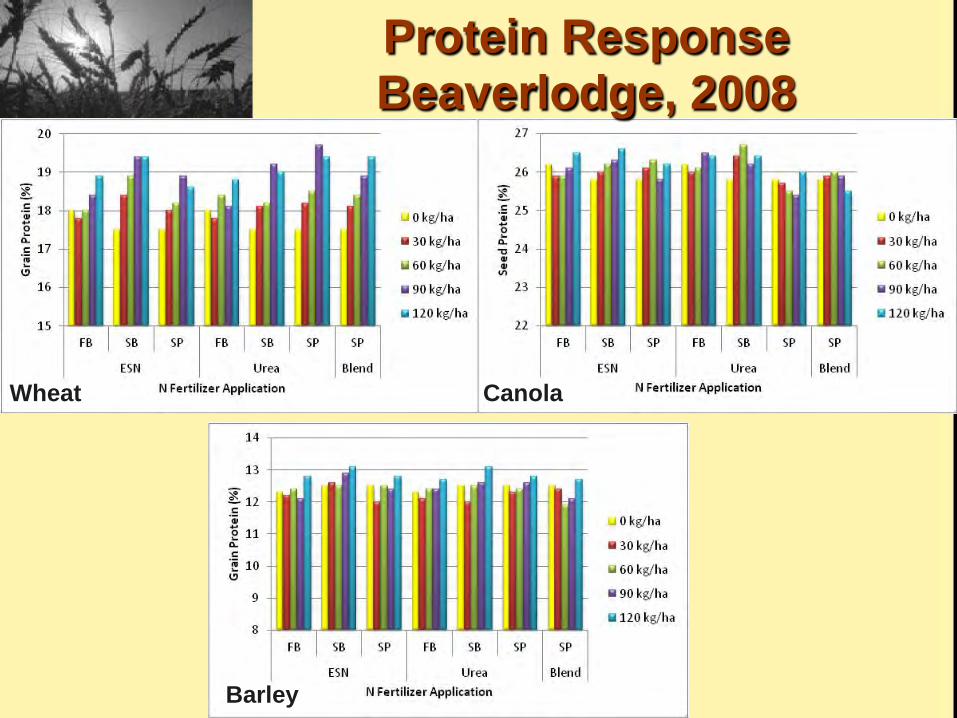
Protein Response Beaverlodge, 2008
Wheat Canola
Barley
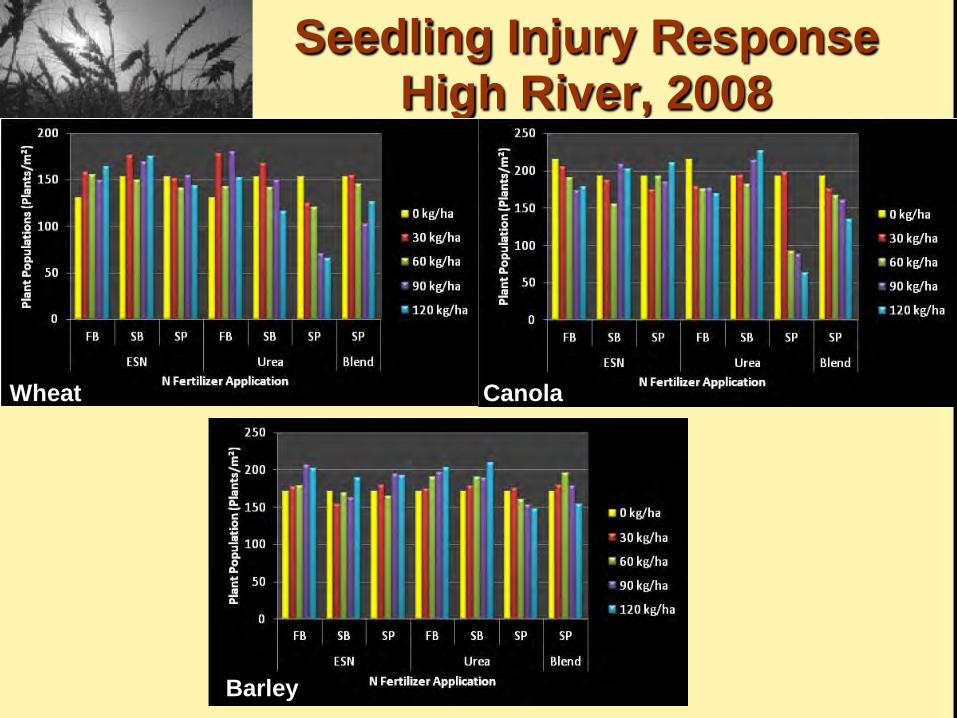
Seedling Injury Response High River, 2008
Wheat Canola
Barley
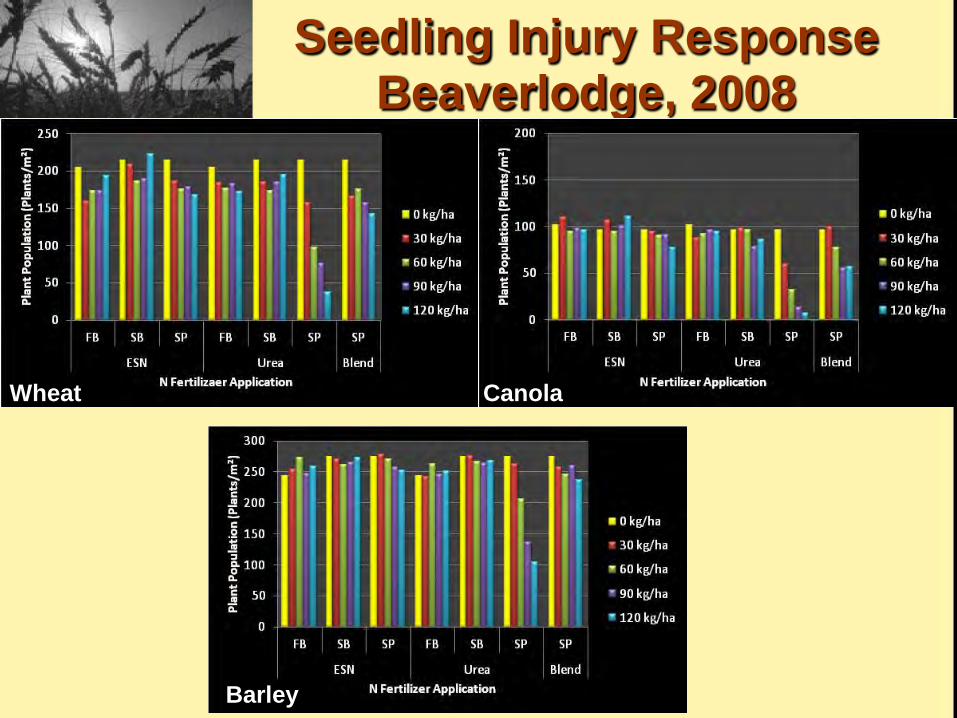
Seedling Injury Response Beaverlodge, 2008
Wheat Canola
Barley
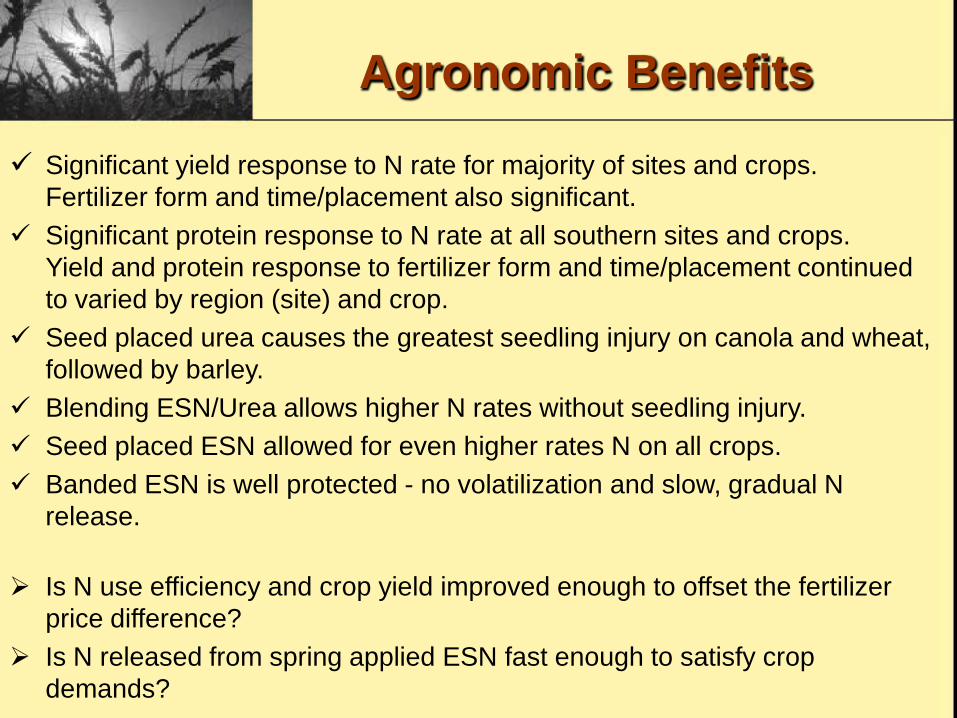
Agronomic Benefits
Significant yield response to N rate for majority of sites and crops. Fertilizer form and time/placement also significant.
Significant protein response to N rate at all southern sites and crops. Yield and protein response to fertilizer form and time/placement continued to varied by region (site) and crop.
Seed placed urea causes the greatest seedling injury on canola and wheat, followed by barley.
Blending ESN/Urea allows higher N rates without seedling injury. Seed placed ESN allowed for even higher rates N on all crops. Banded ESN is well protected - no volatilization and slow, gradual N
release.
Is N use efficiency and crop yield improved enough to offset the fertilizer price difference?
Is N released from spring applied ESN fast enough to satisfy crop demands?
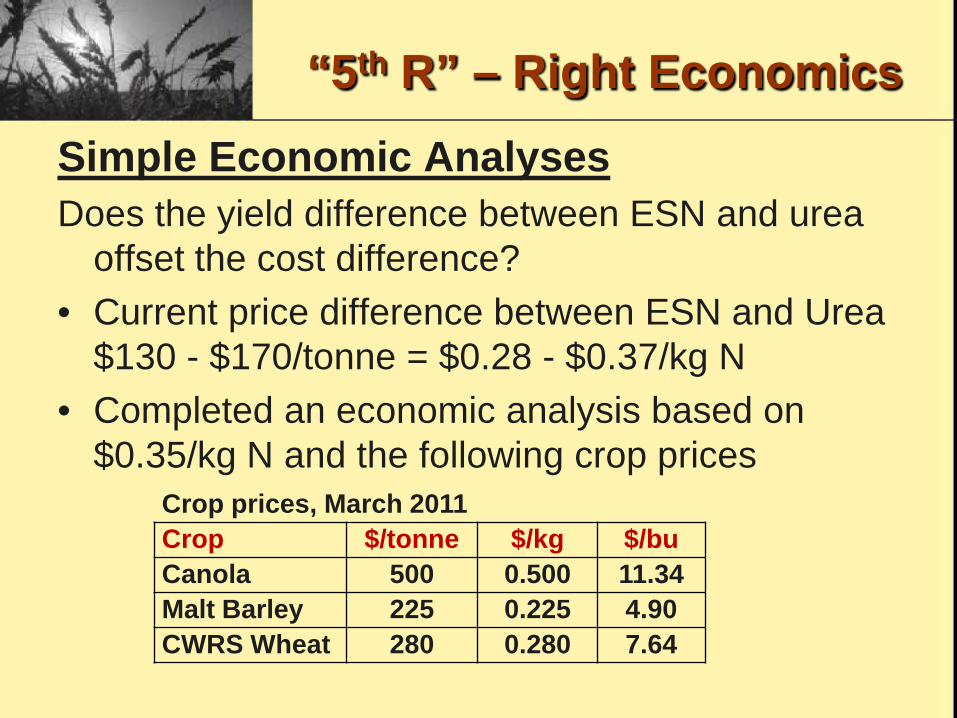
“5th R” – Right Economics
Simple Economic Analyses Does the yield difference between ESN and urea
offset the cost difference? • Current price difference between ESN and Urea
$130 - $170/tonne = $0.28 - $0.37/kg N • Completed an economic analysis based on
$0.35/kg N and the following crop prices Crop prices, March 2011
Crop $/tonne $/kg $/bu Canola 500 0.500 11.34 Malt Barley 225 0.225 4.90 CWRS Wheat 280 0.280 7.64

“5th R” – Right Economics Yield and economic response of the ESN treatments (2008 – 2010) Crop Year Yield Response Economic Response
Positive
Percent Positive Negative
Number of Treatments
Percent Economic
Barley 2008 87 60.4% 59 70 48.6% 2009 73 50.7% 71 66 45.8% 2010 72 56.3% 56 61 47.7% Total 232 55.8% 186 197 47.4%
Canola 2008 98 68.1% 46 90 62.5% 2009 93 64.6% 51 87 60.4% 2010 73 65.2% 38 67 59.8% Total 264 65.9% 135 244 60.9%
Wheat 2008 76 52.8% 68 64 44.4% 2009 88 61.1% 56 67 46.5% 2010 70 54.7% 57 61 47.7% Total 234 56.2% 181 192 46.2%
Economic response proportion of ESN application (2008 – 2010) Crop Fall Banded ESN Spring Banded ESN Seed placed ESN Seed placed Blend Barley 38.0% 39.8% 48.1% 56.5% Canola 44.4% 46.3% 65.7% 72.2% Wheat 35.2% 35.2% 54.6% 58.3%
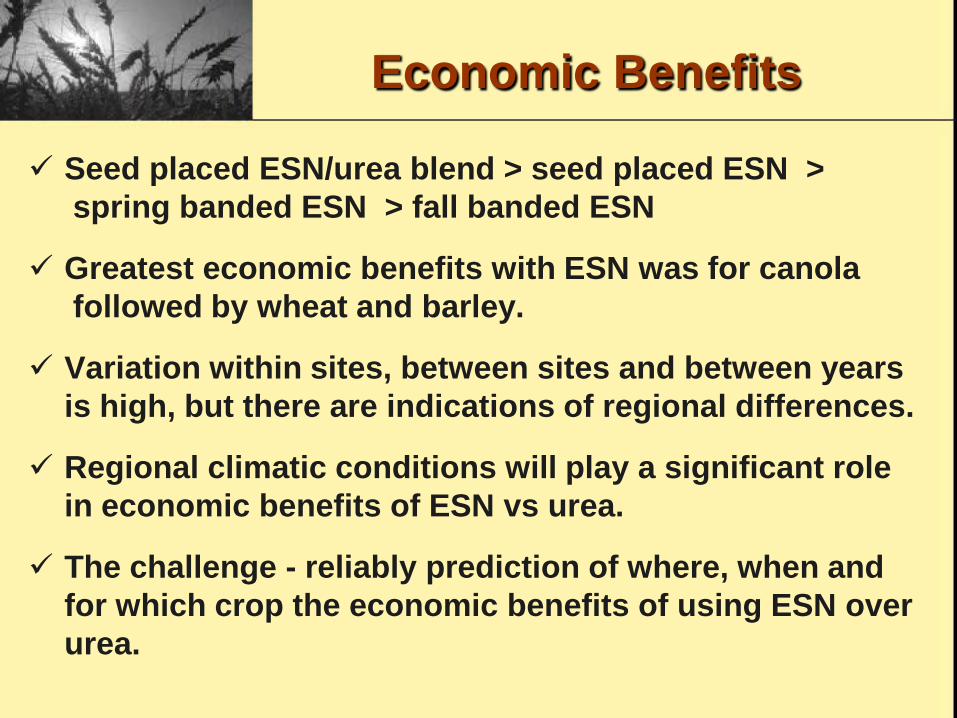
Economic Benefits
Seed placed ESN/urea blend > seed placed ESN > spring banded ESN > fall banded ESN
Greatest economic benefits with ESN was for canola followed by wheat and barley.
Variation within sites, between sites and between years is high, but there are indications of regional differences.
Regional climatic conditions will play a significant role in economic benefits of ESN vs urea.
The challenge - reliably prediction of where, when and for which crop the economic benefits of using ESN over urea.
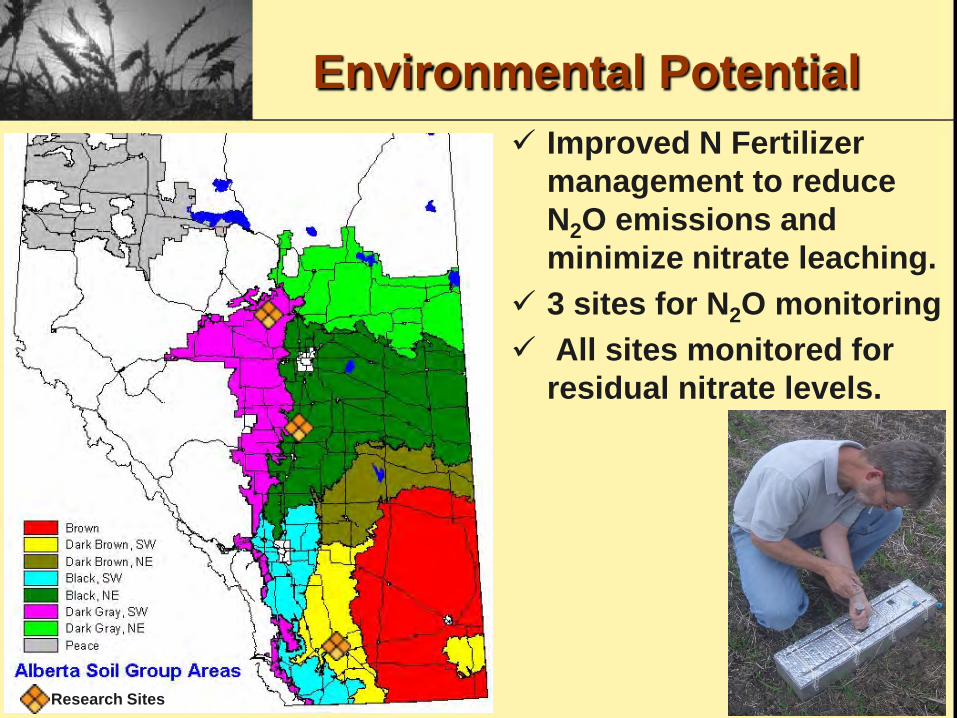
Environmental Potential Improved N Fertilizer
management to reduce N2O emissions and minimize nitrate leaching.
3 sites for N2O monitoring All sites monitored for
residual nitrate levels.
Research Sites
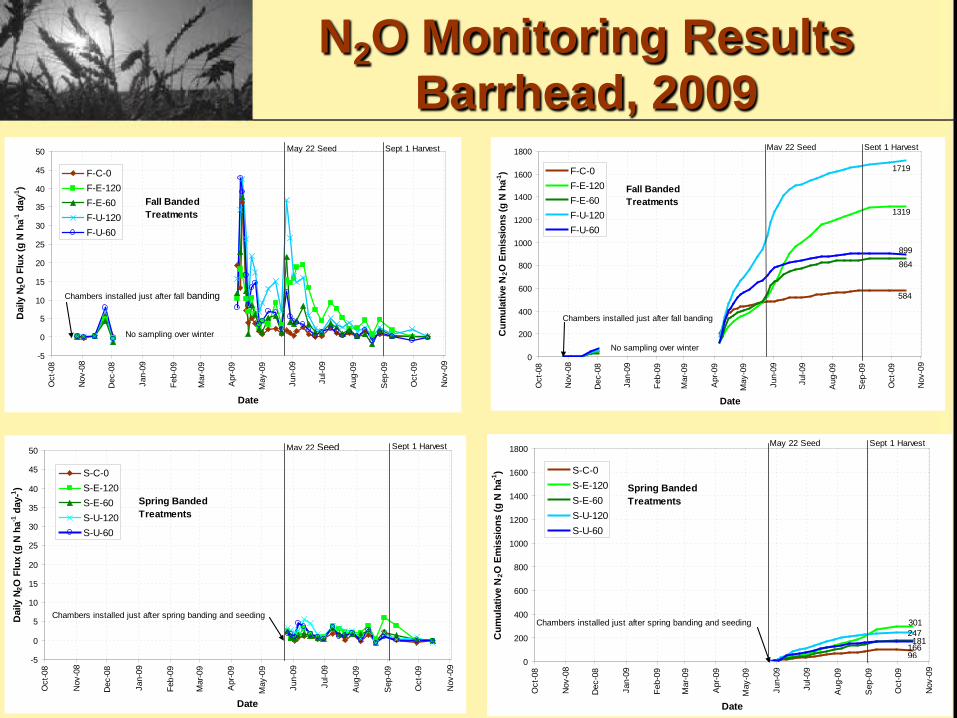
N2O Monitoring Results Barrhead, 2009
-5
0
5
10
15
20
25
30
35
40
45
50
Oct
-08
Nov
-08
Dec
-08
Jan-
09
Feb-
09
Mar
-09
Apr
-09
May
-09
Jun-
09
Jul-0
9
Aug
-09
Sep
-09
Oct
-09
Nov
-09
Date
Dai
ly N
2O F
lux
(g N
ha-1
day
-1)
F-C-0F-E-120F-E-60F-U-120F-U-60
Fall Banded Treatments
May 22 Seed Sept 1 Harvest
Chambers installed just after fall banding
No sampling over winter
-5
0
5
10
15
20
25
30
35
40
45
50
Oct
-08
Nov
-08
Dec
-08
Jan-
09
Feb-
09
Mar
-09
Apr
-09
May
-09
Jun-
09
Jul-0
9
Aug
-09
Sep
-09
Oct
-09
Nov
-09
Date
Dai
ly N
2O F
lux
(g N
ha-1
day
-1 )
S-C-0S-E-120S-E-60S-U-120S-U-60
Spring Banded Treatments
May 22 Seed Sept 1 Harvest
Chambers installed just after spring banding and seeding
0
200
400
600
800
1000
1200
1400
1600
1800
Oct
-08
Nov
-08
Dec
-08
Jan-
09
Feb-
09
Mar
-09
Apr
-09
May
-09
Jun-
09
Jul-0
9
Aug
-09
Sep
-09
Oct
-09
Nov
-09
Date
Cum
ulat
ive
N2O
Em
issi
ons
(g N
ha-1
) F-C-0F-E-120F-E-60F-U-120F-U-60
Fall Banded Treatments
584
864
899
1319
1719
May 22 Seed Sept 1 Harvest
Chambers installed just after fall banding
No sampling over winter
0
200
400
600
800
1000
1200
1400
1600
1800
Oct
-08
Nov
-08
Dec
-08
Jan-
09
Feb-
09
Mar
-09
Apr
-09
May
-09
Jun-
09
Jul-0
9
Aug
-09
Sep
-09
Oct
-09
Nov
-09
Date
Cum
ulat
ive
N2O
Em
issi
ons
(g N
ha-1
) S-C-0S-E-120S-E-60S-U-120S-U-60
Spring Banded Treatments
301247
96
181166
May 22 Seed Sept 1 Harvest
Chambers installed just after spring banding and seeding
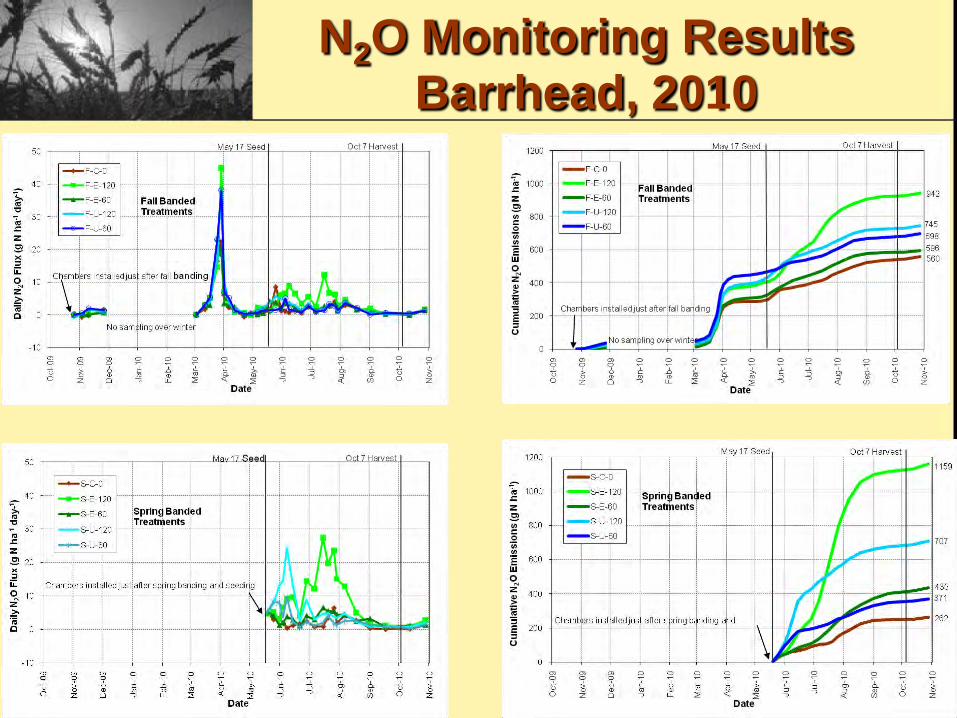
N2O Monitoring Results Barrhead, 2010
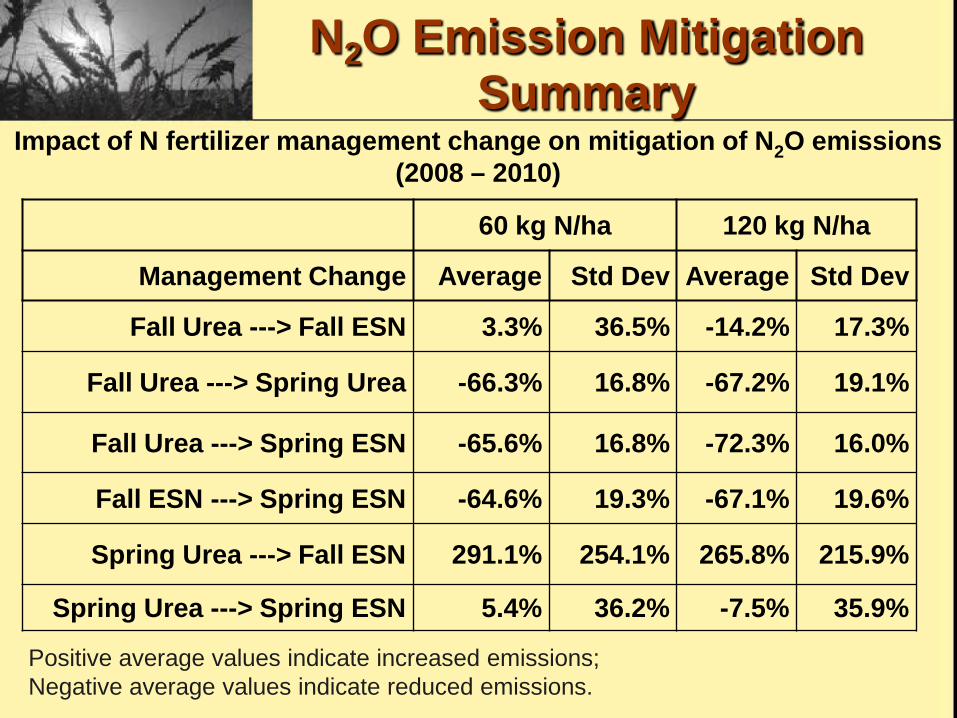
N2O Emission Mitigation Summary
Impact of N fertilizer management change on mitigation of N2O emissions (2008 – 2010)
60 kg N/ha 120 kg N/ha
Management Change Average Std Dev Average Std Dev
Fall Urea ---> Fall ESN 3.3% 36.5% -14.2% 17.3%
Fall Urea ---> Spring Urea -66.3% 16.8% -67.2% 19.1%
Fall Urea ---> Spring ESN -65.6% 16.8% -72.3% 16.0%
Fall ESN ---> Spring ESN -64.6% 19.3% -67.1% 19.6%
Spring Urea ---> Fall ESN 291.1% 254.1% 265.8% 215.9%
Spring Urea ---> Spring ESN 5.4% 36.2% -7.5% 35.9%
Positive average values indicate increased emissions; Negative average values indicate reduced emissions.

Expected Outcomes Agronomic, Economic & Environmental Benefits
Increase Nitrogen use efficiency: Increase crop productivity Reduce fertilizer use and cost Reduce seedling damage
Reduce N Losses: NH3 volatilization N2O mitigation Carbon-offset market (NERP)
Reduce risks to surface & ground water: Matching agronomic requirements Reduce residual nitrogen in soil
Next Steps
• Project extened for one more field season to replace lost sites
• Continue data analysis • Soil N mineralization estimation • Yield response model • Economic analysis • Update AFFIRM software to 5R level

Len Kryzanowski, P.Ag. Section Lead, Land Use Section Alberta Agriculture and Rural Development Edmonton, AB Phone: (780) 422-1252 [email protected]
Thank You