Agritourism in Colorado: The Visitors, the Economics and the Opportunities Dawn Thilmany & Martha...
26
Agritourism in Colorado: The Visitors, the Economics and the Opportunities Dawn Thilmany & Martha Sullins Colorado State University Extension Department of Ag & Resource Economics March 2007 Photo: Pat Martin Photo: Tammy Mattics Photo: Randy Mills Photo: Joel Boymel
-
Upload
robyn-mcdaniel -
Category
Documents
-
view
215 -
download
1
Transcript of Agritourism in Colorado: The Visitors, the Economics and the Opportunities Dawn Thilmany & Martha...
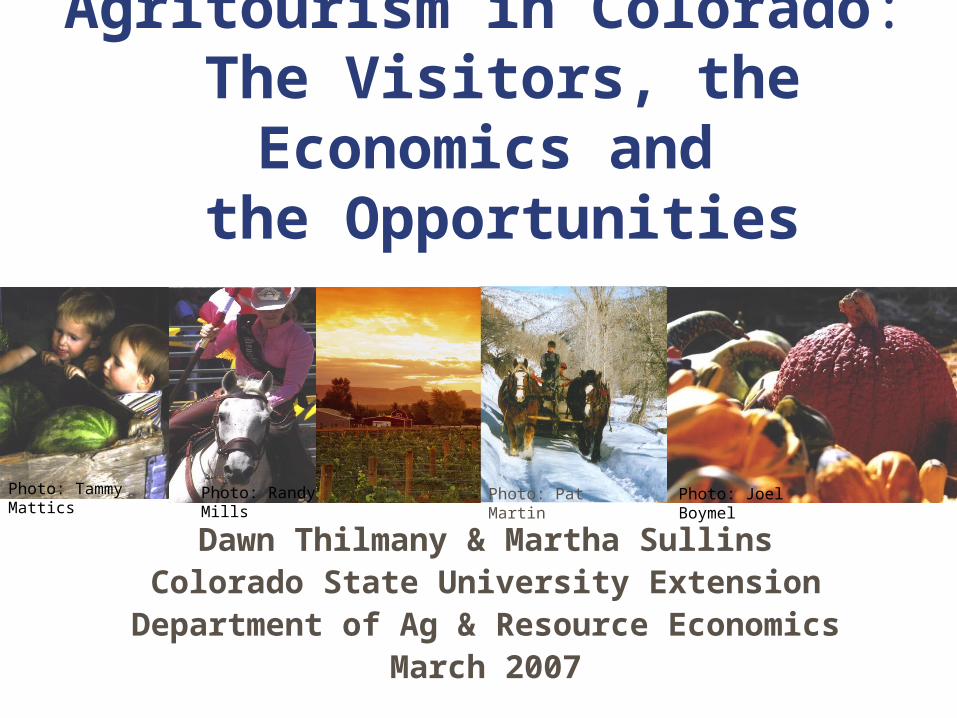
Agritourism in Colorado: The Visitors, the Economics and
the Opportunities
Dawn Thilmany & Martha SullinsColorado State University Extension
Department of Ag & Resource EconomicsMarch 2007
Photo: Pat MartinPhoto: Tammy Mattics Photo: Randy Mills
Photo: Joel Boymel
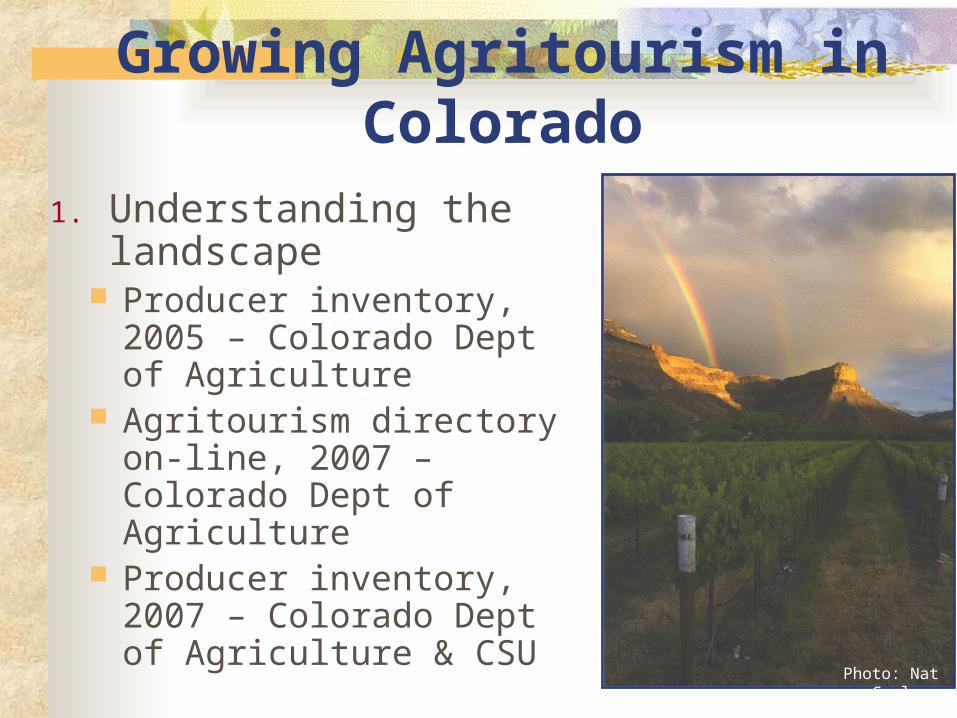
Growing Agritourism in Colorado
1. Understanding the landscape
Producer inventory, 2005 – Colorado Dept of Agriculture
Agritourism directory on-line, 2007 – Colorado Dept of Agriculture
Producer inventory, 2007 – Colorado Dept of Agriculture & CSU
Photo: Nat Coalson
Growing Agritourism in Colorado
2. Understanding Colorado’s agritourists” Consumer survey, 2007
– Colorado Dept of Agriculture & CSU
Photo: Karen Seim
3. Supporting businesses & communities 3 producer workshops (Steamboat, Akron) 2 scheduled workshops (La Junta, Cortez, Delta) Numerous community outreach presentations 4 fact sheets and more to come for tech. asst.
Growing Agritourism in Colorado
Photo: Mary Erlenborn
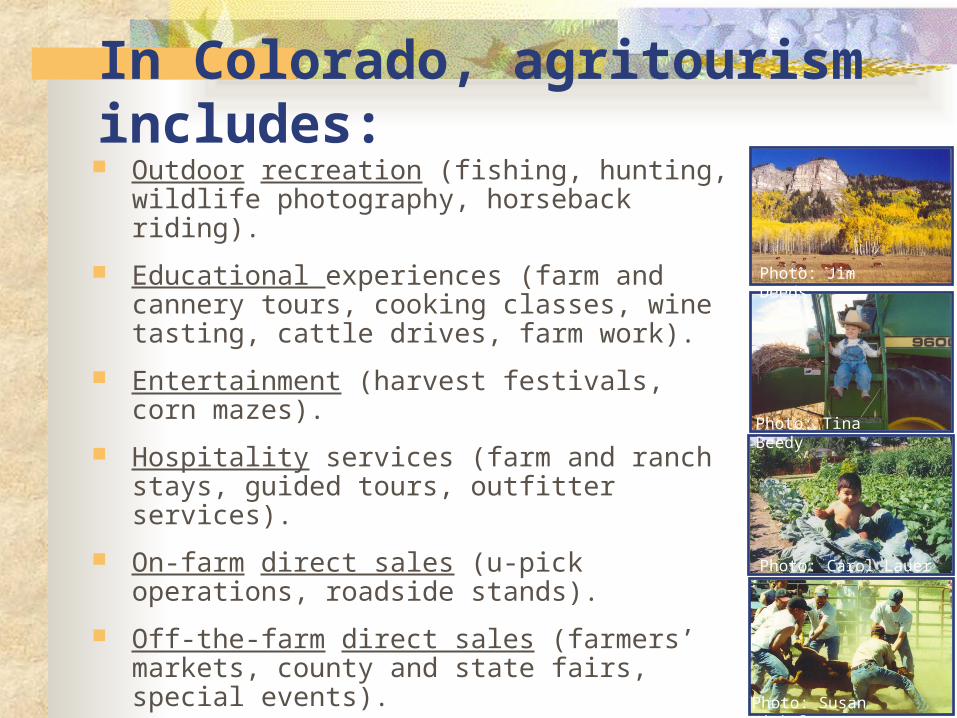
In Colorado, agritourism includes: Outdoor recreation (fishing, hunting, wildlife
photography, horseback riding).
Educational experiences (farm and cannery tours, cooking classes, wine tasting, cattle drives, farm work).
Entertainment (harvest festivals, corn mazes).
Hospitality services (farm and ranch stays, guided tours, outfitter services).
On-farm direct sales (u-pick operations, roadside stands).
Off-the-farm direct sales (farmers’ markets, county and state fairs, special events).
Photo: Carol Lauer
Photo: Tina Beedy
Photo: Susan Hickel
Photo: Jim Deeds
Why is agritourism important?
The travel and tourism industry has become increasingly important in the Intermountain West: 90% of total employment in some counties is in the
industry A total of 106 Western rural counties had more than
1,000 travel and tourism jobs in 2000 Ag income & diversification:
$10.1 million in recreational services in 2002 Moffat had highest recreational income at $1.3
million (63% of total farm income) Tourism as Ag Industry Education/Promotion
Tool!!Source: Federal Reserve Bank of Kansas City, Economic Review, 2003; USDA Census of Ag., 2002.
Targeting traveler segments
“Cluster” visitors by like characteristics Planning Mode of travel Activities chosen Expenditures, etc.
Easier to develop cohesive marketing strategies than for “average” traveler
We can define them…
….target those with greatest potential
…..and create recommendations
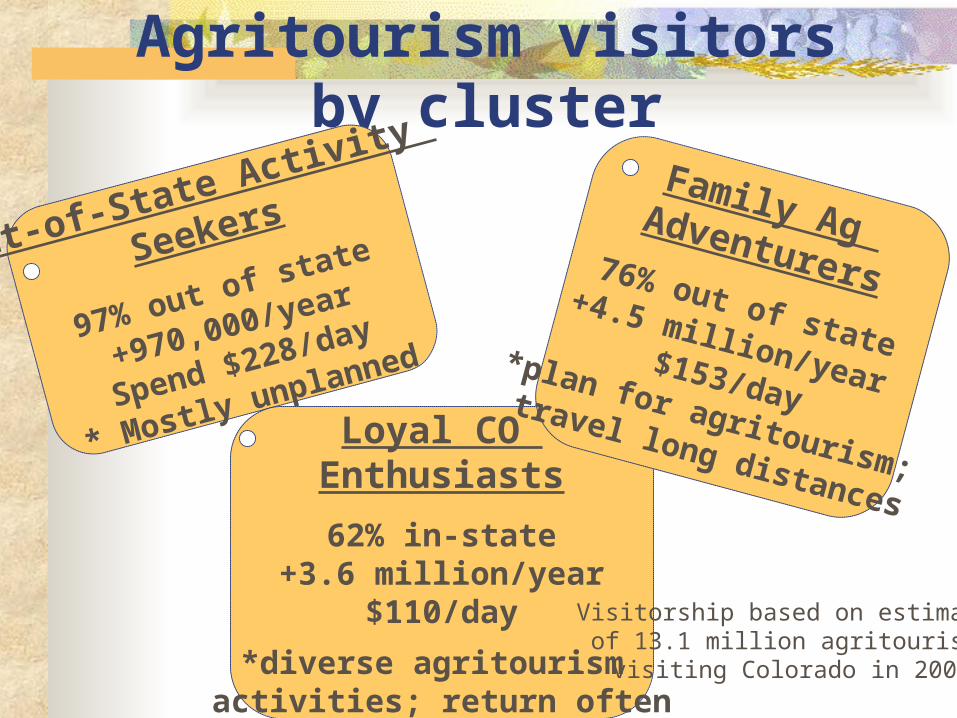
Agritourism visitors by cluster
Out-of-State Activity
Seekers
97% out of state
+970,000/year
Spend $228/day
* Mostly unplanned
Loyal CO Enthusiasts
62% in-state+3.6 million/year
$110/day
*diverse agritourism activities; return often
Family Ag Adventurers76% out of state+4.5 million/year $153/day*plan for agritourism;
travel long distances
Visitorship based on estimates of 13.1 million agritourists visiting Colorado in 2006.
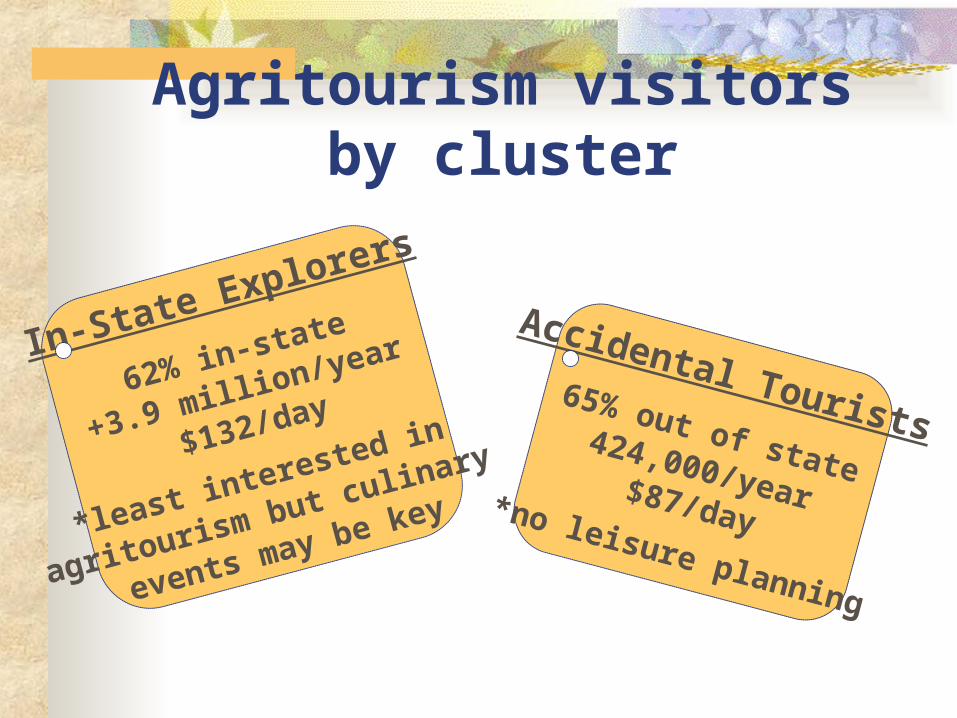
Agritourism visitors by cluster
Accidental Tourists65% out of state424,000/year$87/day*no leisure planning
In-State Explorers
62% in-state
+3.9 million/year
$132/day
*least interested in
agritourism but culinary
events may be key
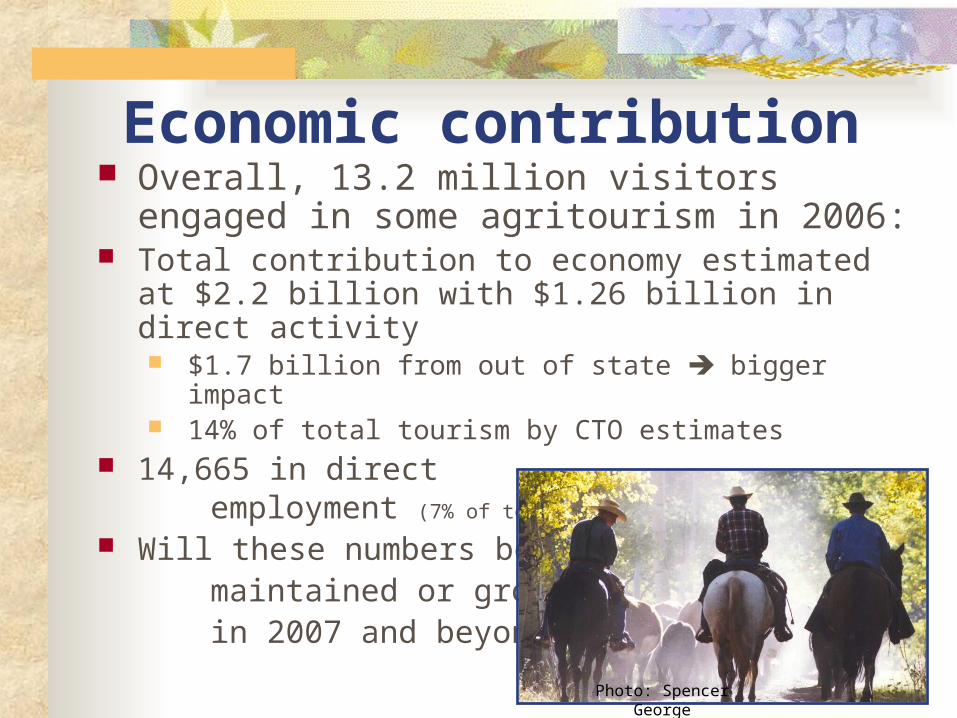
Economic contribution Overall, 13.2 million visitors engaged in
some agritourism in 2006: Total contribution to economy estimated at $2.2
billion with $1.26 billion in direct activity $1.7 billion from out of state bigger impact 14% of total tourism by CTO estimates
14,665 in direct employment (7% of tourism)
Will these numbers be maintained or grow in 2007 and beyond?
Photo: Spencer George
0%
10%
20%
30%
40%
50%
Past experience
Recommendation
Personal Web /m
edia search
National travel w
eb sites
Travel associatio
n
Colorado Tourism Offic
e
None of the above
Park brochures/website
s
Visitor /
Welcome Center
Travel arranged by employer
Regional / community W
eb site
Travel-based magazin
es and books
All Other
In-state
Out-of-state
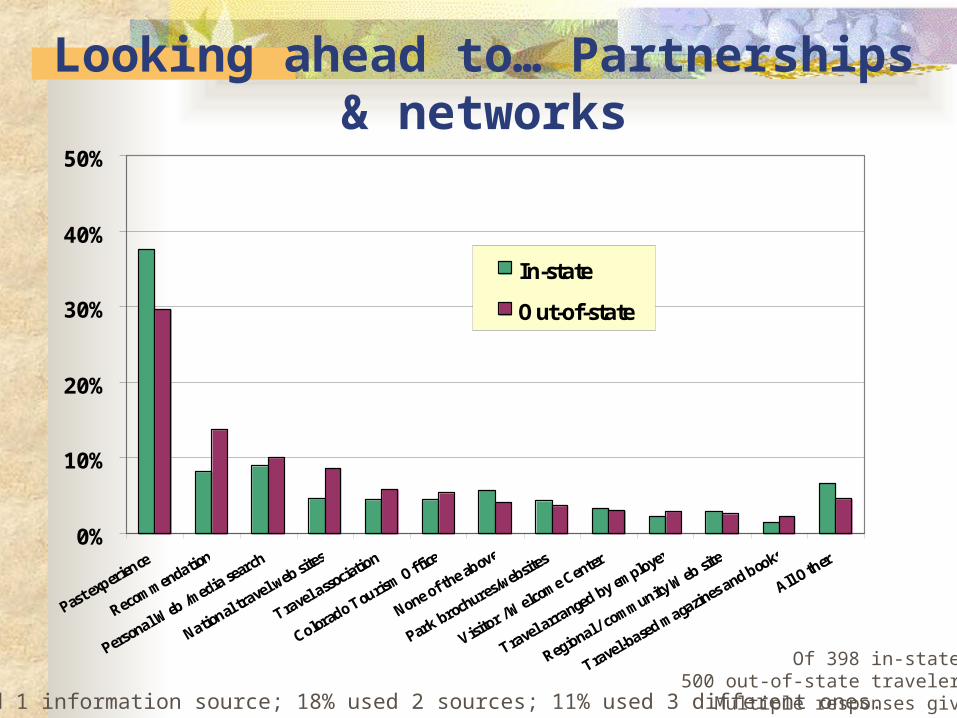
Looking ahead to… Partnerships & networks
Of 398 in-state; 500 out-of-state travelers.Multiple responses given54% used 1 information source; 18% used 2 sources; 11% used 3 different ones.
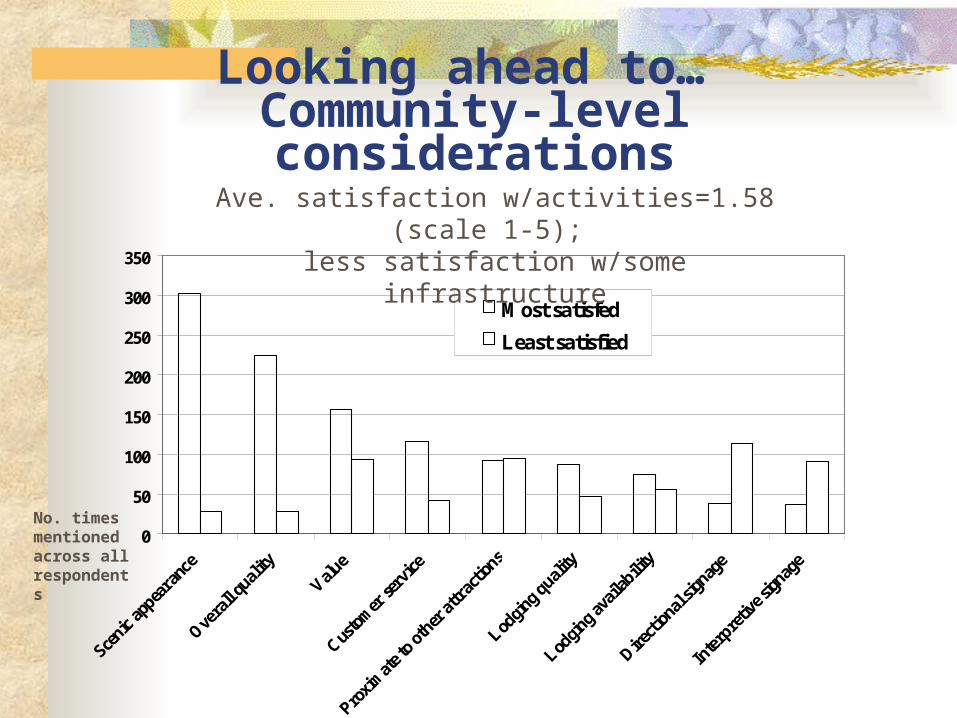
Looking ahead to… Community-level considerations
0
50
100
150
200
250
300
350
Scenic
appea
ranc
e
Overa
ll qu
ality
Value
Custo
mer
serv
ice
Proxim
ate t
o oth
er at
trac
tions
Lodgin
g quali
ty
Lodgin
g ava
ilabili
ty
Direct
ional
signag
e
Inte
rpre
tive s
ignag
e
Most satisfed
Least satisfied
No. timesmentioned across all respondents
Ave. satisfaction w/activities=1.58 (scale 1-5); less satisfaction w/some infrastructure
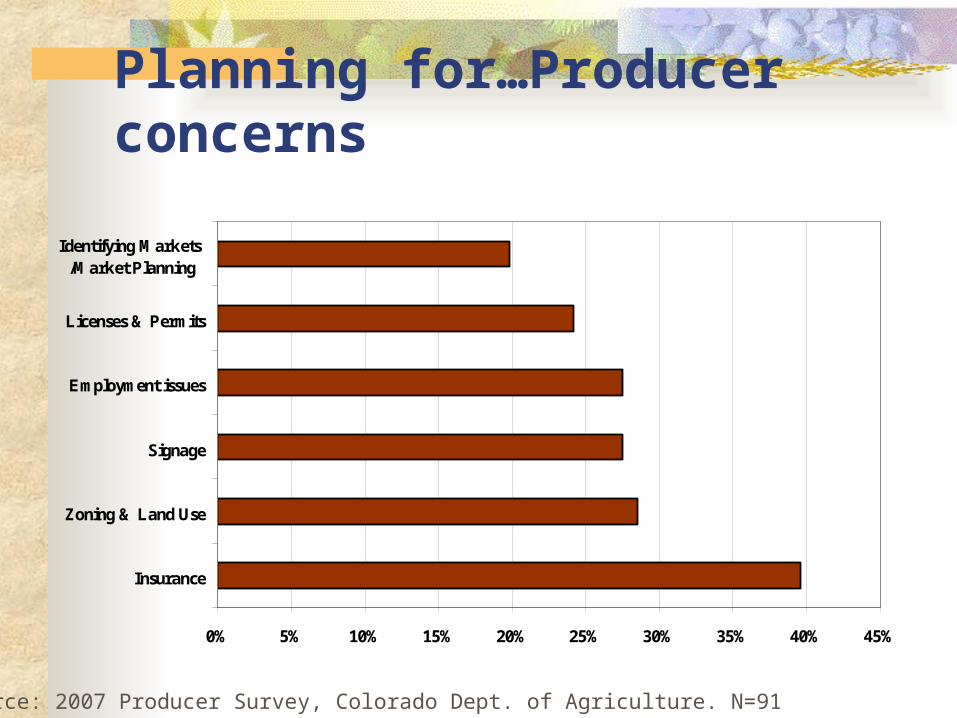
Planning for…Producer concerns
Source: 2007 Producer Survey, Colorado Dept. of Agriculture. N=91
0% 5% 10% 15% 20% 25% 30% 35% 40% 45%
Insurance
Zoning & Land Use
Signage
Employment issues
Licenses & Permits
Identifying Markets /Market Planning
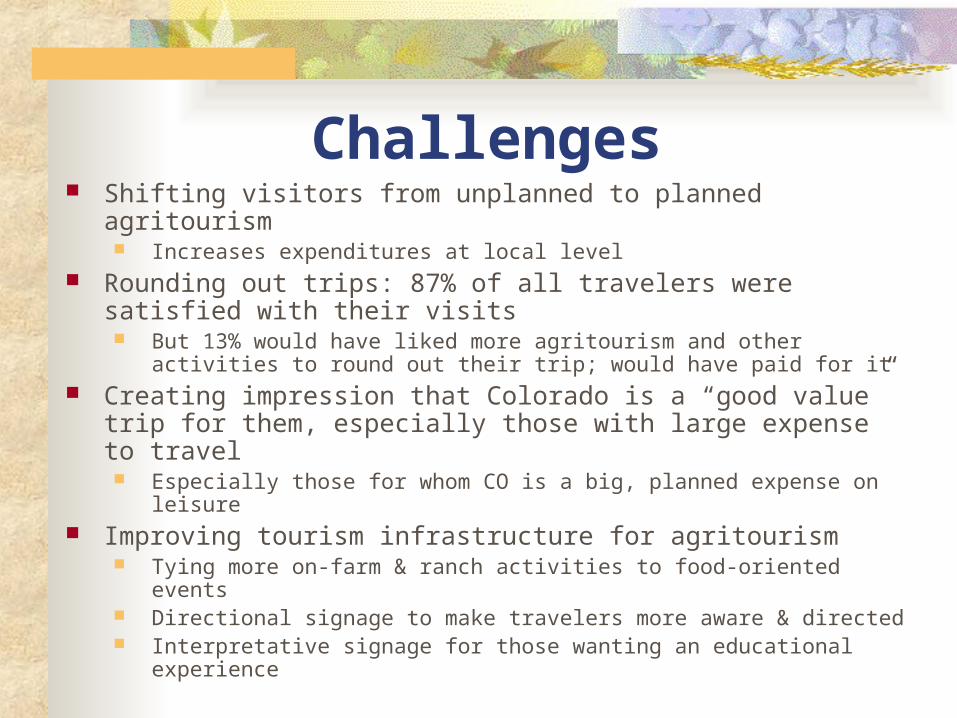
Challenges Shifting visitors from unplanned to planned agritourism
Increases expenditures at local level Rounding out trips: 87% of all travelers were satisfied with
their visits But 13% would have liked more agritourism and other activities to
round out their trip; would have paid for it Creating impression that Colorado is a “good value” trip for
them, especially those with large expense to travel Especially those for whom CO is a big, planned expense on leisure
Improving tourism infrastructure for agritourism Tying more on-farm & ranch activities to food-oriented events Directional signage to make travelers more aware & directed Interpretative signage for those wanting an educational experience
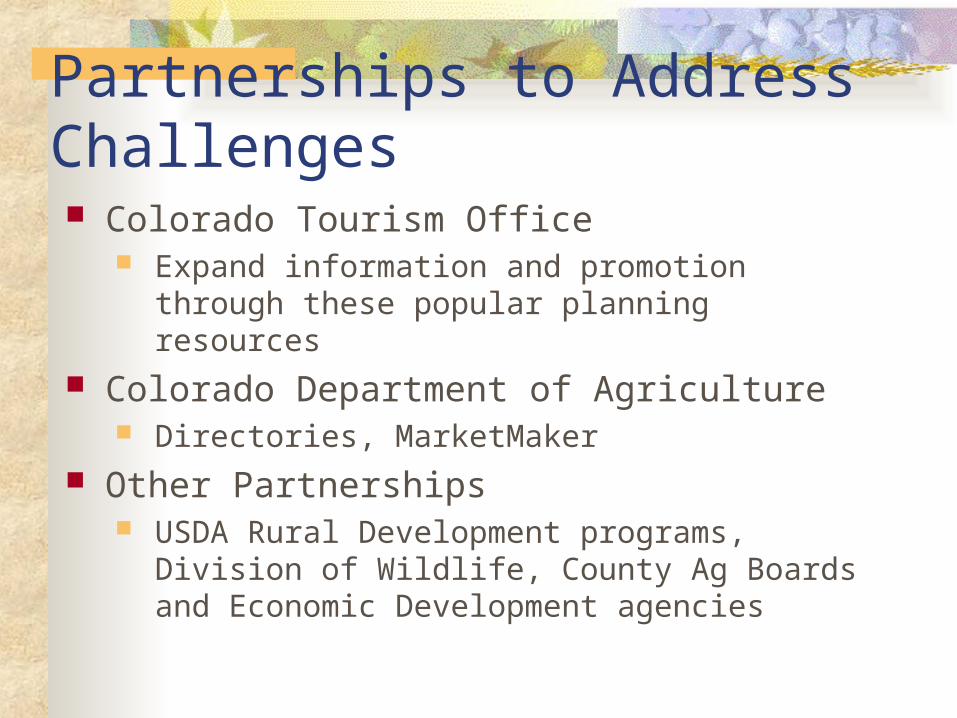
Partnerships to Address Challenges Colorado Tourism Office
Expand information and promotion through these popular planning resources
Colorado Department of Agriculture Directories, MarketMaker
Other Partnerships USDA Rural Development programs,
Division of Wildlife, County Ag Boards and Economic Development agencies
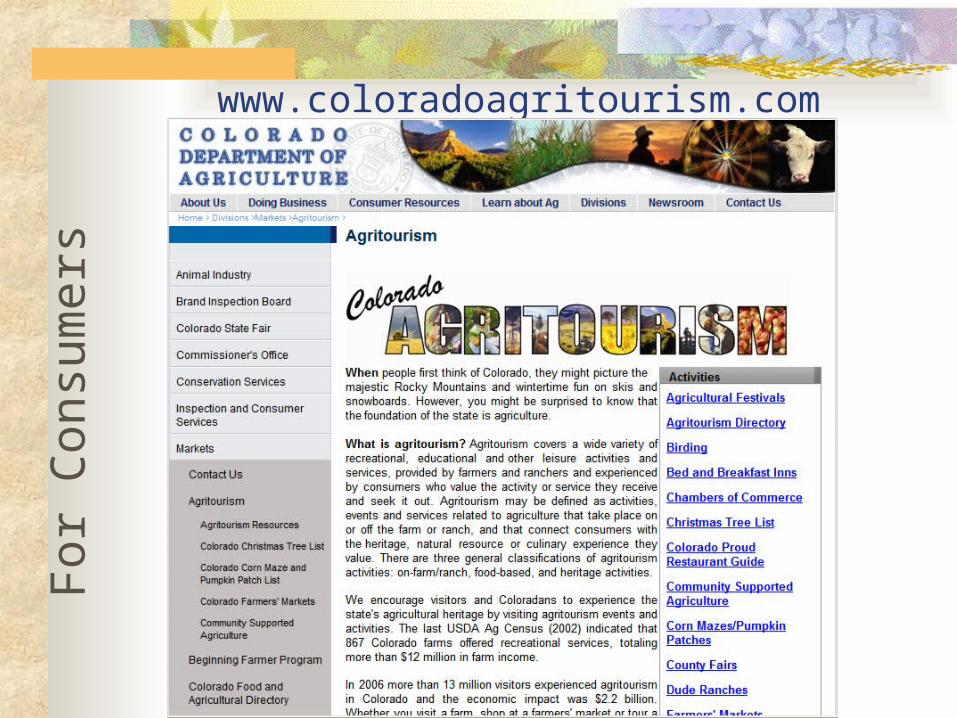
www.coloradoagritourism.comFo
r C
onsu
mers
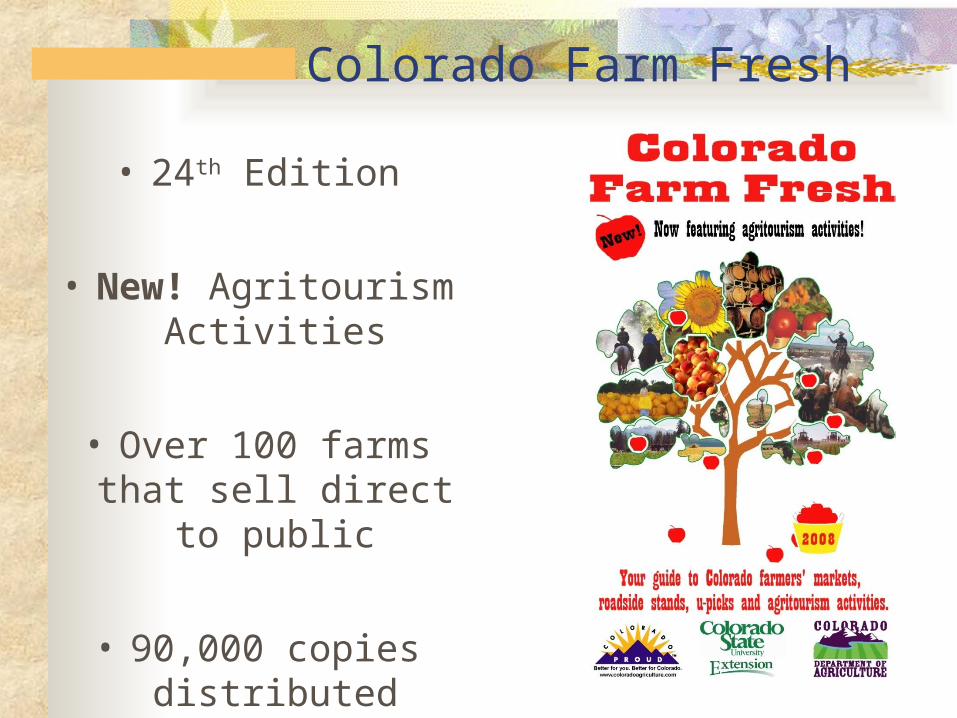
Colorado Farm Fresh
• 24th Edition
• New! Agritourism Activities
• Over 100 farms that sell direct to
public
• 90,000 copies distributed statewide
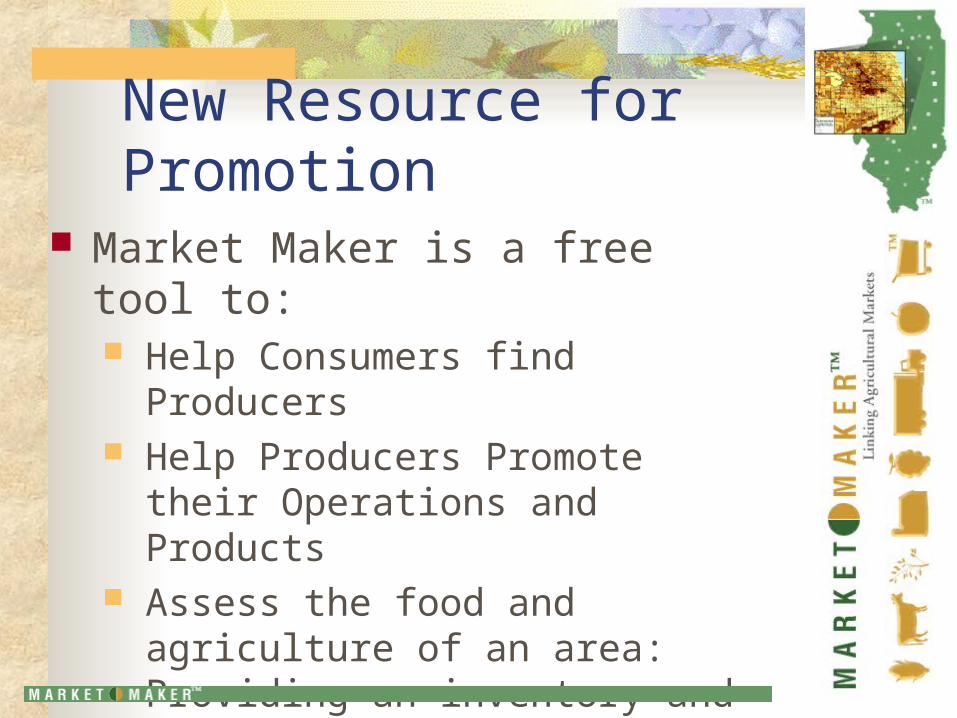
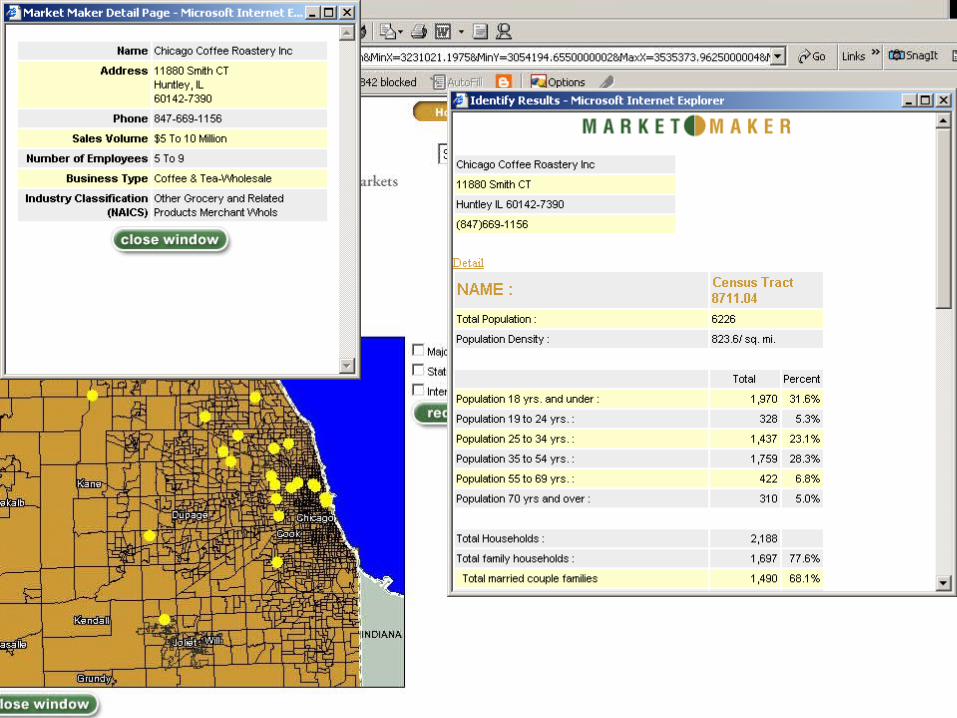
New Resource for Promotion Market Maker is a free tool to:
Help Consumers find Producers Help Producers Promote their
Operations and Products Assess the food and agriculture of
an area: Providing an inventory and great networking resource
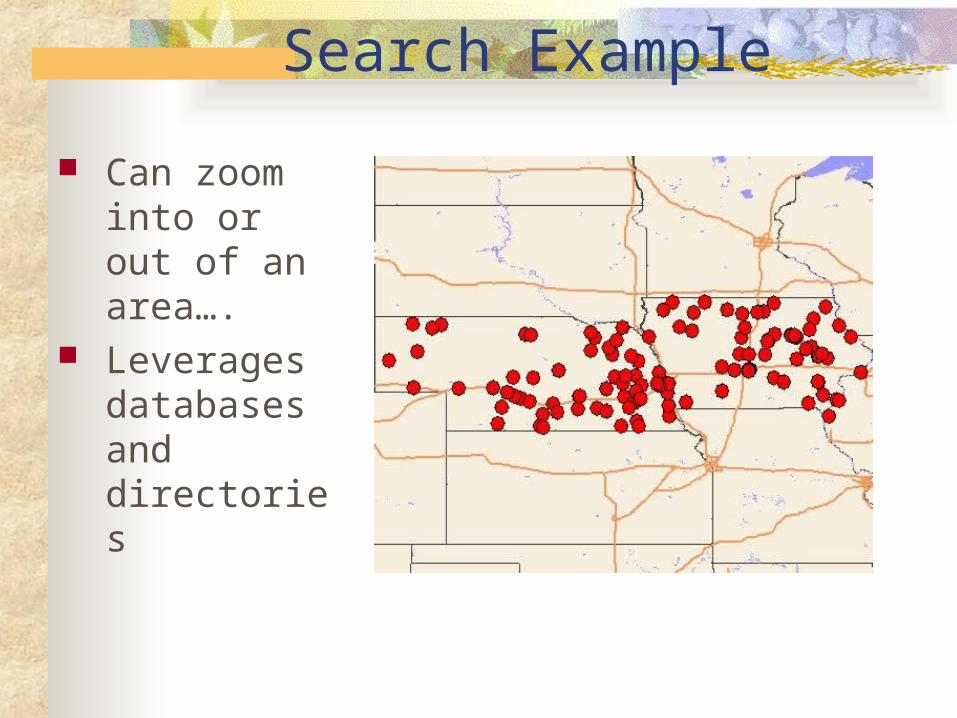
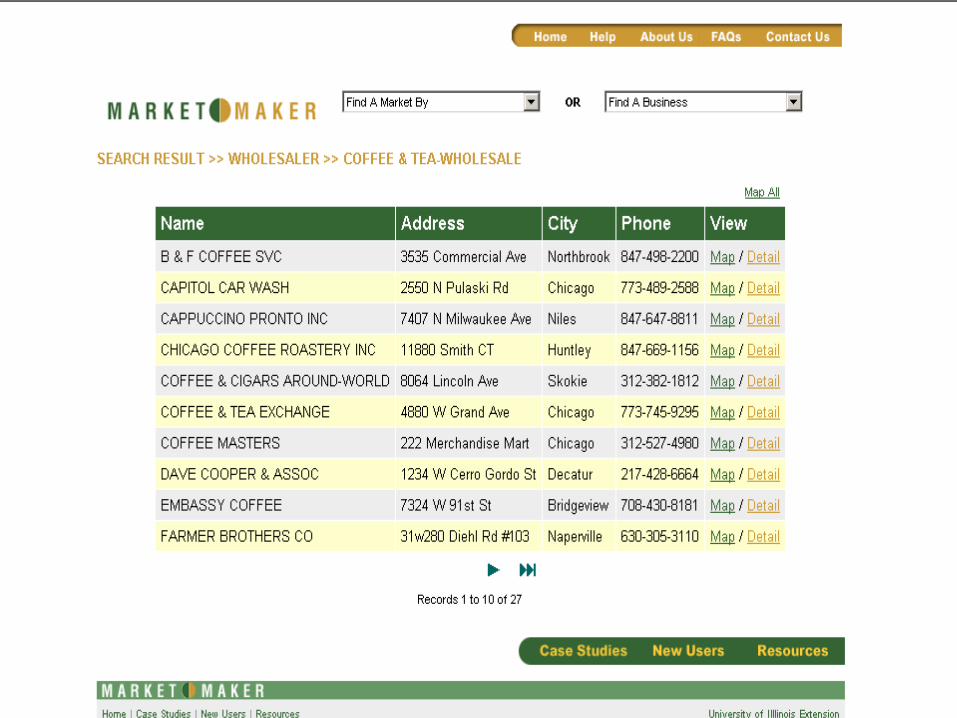
Search Example
Can zoom into or out of an area….
Leverages databases and directories
Promotion Possibilities MarketMaker is coming to Colorado!!
Collaboration of CDA and CSU Extension We will add the agritourism directory
Important to get everyone’s information Develop your Web presence now
Other Features Buyers/sellers forum More search capabilities

More Details
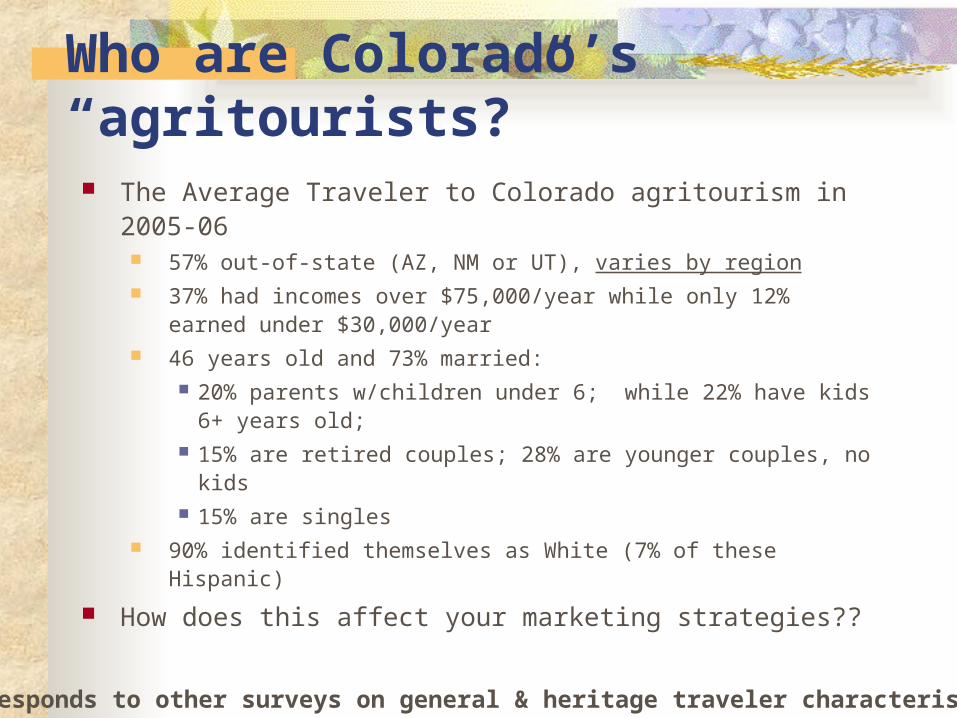
Who are Colorado’s “agritourists?” The Average Traveler to Colorado agritourism in 2005-06
57% out-of-state (AZ, NM or UT), varies by region 37% had incomes over $75,000/year while only 12% earned
under $30,000/year 46 years old and 73% married:
20% parents w/children under 6; while 22% have kids 6+ years old;
15% are retired couples; 28% are younger couples, no kids 15% are singles
90% identified themselves as White (7% of these Hispanic)
How does this affect your marketing strategies??
Corresponds to other surveys on general & heritage traveler characteristics
Resources
Fact sheets at http://dare.agsci.colostate.edu/csuagecon/extension/pubstools.htm Of Wine and Wildlife: Assessing Market Potential for Colorado
Agritourism Colorado’s Agritourists: Who are the Adventurers, the Seekers
and the Explorers? Agritourism in Colorado: A Closer Look at Regional Trends
Web site www.coloradoagritourism.com
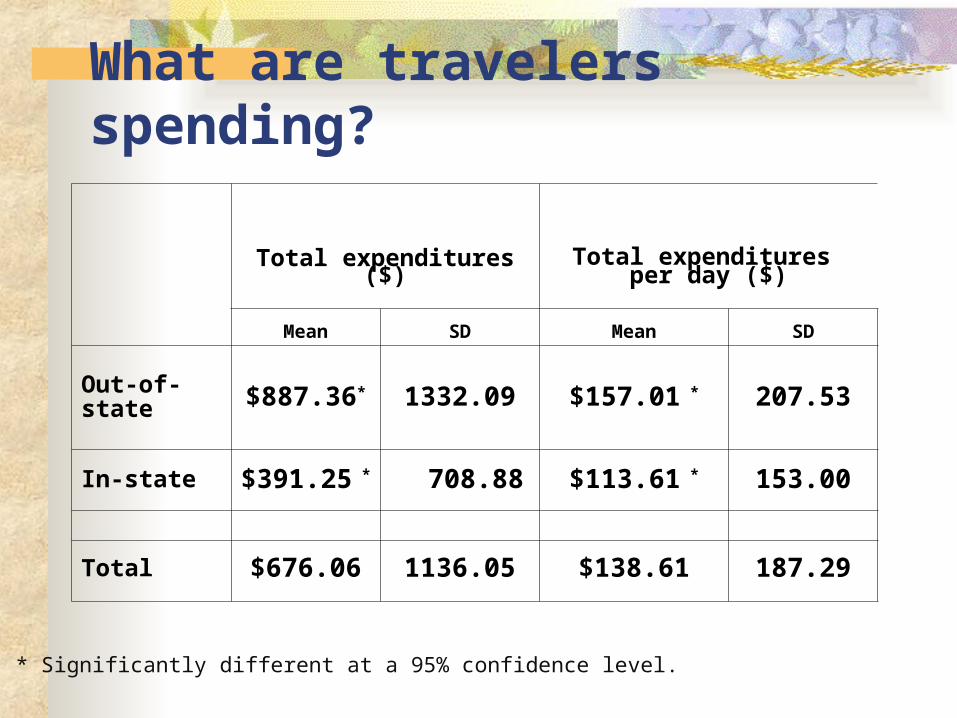
What are travelers spending?
Total expenditures ($)Total expenditures
per day ($)
Mean SD Mean SD
Out-of-state $887.36* 1332.09 $157.01 * 207.53
In-state $391.25 * 708.88 $113.61 * 153.00
Total $676.06 1136.05 $138.61 187.29
* Significantly different at a 95% confidence level.