TYPES OF ECOSYSTEMS LAND ECOSYSTEMS: BIOMES AQUATIC ECOSYSTEMS: MARINE AND LAKES.

To
MAWTa
b
c
d
e
f
g
h
i
j
k
a
ARRAA
KCCECCM
1
bKCpi
MT
0d
Agriculture, Ecosystems and Environment 139 (2010) 419–453
Contents lists available at ScienceDirect
Agriculture, Ecosystems and Environment
journa l homepage: www.e lsev ier .com/ locate /agee
he carbon balance of European croplands: A cross-site comparisonf simulation models
artin Wattenbacha,∗, Oliver Susb, Nicolas Vuichardc, Simon Lehugerd, Pia Gottschalka, Longhui Li c,drian Leipe, Mathew Williamsb, Enrico Tomelleri f, Werner Leo Kutschf, Nina Buchmanng,erner Eugsterg, Dominique Dietikerg, Marc Aubinetk, Eric Ceschiah, Pierre Béziath,
homas Grünwald i, Astley Hastingsa, Bruce Osbornej, Philippe Ciaisc, Pierre Cellierd, Pete Smitha
University of Aberdeen, Institute of Biological and Environmental Sciences 23 St. Machar Drive, Aberdeen AB24 3UU, UKThe University of Edinburgh, School of GeoSciences and SAGES, The King’s Buildings, West Mains Road, Edinburgh EH9 3JN, UKLaboratoire des Sciences du Climat et de l’Environnement (LSCE/IPSL) CEA-CNRS-UVSQ (UMR 1572) CE Saclay L’Orme des merisiers, Bât 712 91191 Gif sur Yvette Cedex, FranceAgroscope Reckenholz-Tänikon Research Station ART, Air Pollution/Climate Group, Reckenholzstrasse, 8046 Zurich, SwitzerlandJoint Research Centre, Institute for Environment and Sustainability, Climate Change Unit (TP 050), I-21020 Ispra (VA), ItalyJohann Heinrich von Thünen-Institut (vTI), Federal Research Institute for Rural Areas, Forestry and Fisheries, Bundesallee 50, 38116 Braunschweig, GermanyETH Zurich, Institute of Plant, Animal and Agroecosystem, Universitaetsstrasse 2, 8092 Zurich, SwitzerlandCESBIO - Université de Toulouse; UPS, CNES, CNRS, IRD; UMR 5126, 18 Avenue Edouard Belin, 31401 Toulouse Cedex 9, FranceTechnical University Dresden, Institute of Hydrology and Meteorology, Department of Meteorology, Pienner Strasse 23, D-01737 Tharandt, GermanyUCD School of Biology and Environmental Science, University College Dublin, Belfield, Dublin 4, IrelandUniversité de Liège, Physique des bio-systèmes, Avenue de la Faculté 8, 5030 Gembloux, Belgique, UK
r t i c l e i n f o
rticle history:eceived 4 August 2009eceived in revised form 4 August 2010ccepted 4 August 2010vailable online 25 September 2010
eywords:ropland
a b s t r a c t
Croplands cover approximately 45% of Europe and play an important role in the overall carbon budgetof the continent. However, the estimation of their carbon balance remains uncertain due to the diversityof crops and cropping systems together with the strong influence of human management. Here, wepresent a multi-site model comparison for four cropland ecosystem models namely the DNDC, ORCHIDEE-STICS, CERES-EGC and SPA models. We compare the accuracy of the models in predicting net ecosystemexchange (NEE), gross primary production (GPP), ecosystem respiration (Reco) as well as actual evapo-transpiration (ETa) for winter wheat (Triticum aestivum L.) and maize (Zea mays L.) derived from eddy
ropddy fluxarbonO2
odelling
covariance measurements on five sites along a gradient of climatic conditions from eastern to south-westerly Europe. The models are all able to simulate daily GPP. The simulation results for daily ETa andReco are, however, less accurate. The resulting simulation of daily NEE is adequate except in some caseswhere models fail due to a lack in phase and amplitude alignment. ORCHIDEE-STICS and SPA show the bestperformance. Nevertheless, they are not able to simulate full crop rotations or the multiple managementpractices used. CERES-EGC, and especially DNDC, although exhibiting a lower level of model accuracy,
cond
are able to simulate such. Introduction
Croplands are an important component of the European car-on balance (Janssens et al., 2003, 2005; Schulze et al., 2009;
utsch et al., 2010).They cover a large area between 1.10 (EPA-orine2000) and 1.24 Mkm−2 (Gervois et al., 2008), within the EU27lus Switzerland, and there have been a number of integrated stud-es that attempt to quantify, at the continental scale, their carbon
∗ Corresponding author. Present address: Freie Universität Berlin, Institute ofeteorology, Carl-Heinrich-Becker Weg 6-10, D-12165 Berlin, Germany.
el.: +49 3641 576140; fax: +49 3641 577100.E-mail address: [email protected] (M. Wattenbach).
167-8809/$ – see front matter © 2010 Elsevier B.V. All rights reserved.oi:10.1016/j.agee.2010.08.004
itions, resulting in more accurate simulation of annual cumulative NEE.© 2010 Elsevier B.V. All rights reserved.
balance. Each previous study has used different approaches, fromextrapolation of regional statistics, through remote sensing to mod-elling (Vleeshouwers and Verghagen, 2002; Janssens et al., 2003;Smith, 2004; Smith et al., 2005a; Bondeau et al., 2007; Gervoiset al., 2008; Ciais et al., 2009). However, CO2 emissions are largelydetermined by the temporal and spatial sequence of human activ-ity and there remains a considerable degree of uncertainty (Smithet al., 2005b; Osborne et al., 2010). Regional- or continental-scalestatistics are not consistently available for the entire area of Europe
(Ramankutty et al., 2008) and available experimental data arescarce, and come from heterogeneous sources. Remote sensingproducts lack the accuracy and precision to reflect the degree oftemporal and/or spatial heterogeneity of croplands (Reeves et al.,2005; Osborne et al., 2010). In the case of modelling, the data now
420 M. Wattenbach et al. / Agriculture, Ecosystems and Environment 139 (2010) 419–453
Table 1The combination of sites, models and crops and the lengths of the simulation period for the comparison in days of the year (DOY).
Site Crop Time period Model
Start End DOY CERES SPA ORCHIDEE DNDC
Oensingen Winter wheat 19/10/2006 16/07/2007 270 X x x
Grignon Maize 09/05/2005 28/09/2005 142 x x xWinter wheat 28/10/2005 14/07/2006 259 x x x x
667
ahp2
getossdoitpn1im(EtLmeaTrf122moagat
saowe2Niwa
rs
Aurade Winter wheat 27/10/2005 29/06/200Klingenberg Winter wheat 25/09/2005 06/09/200Gebesee Winter wheat 09/11/2006 07/08/200
vailable through the CarboEurope network, are the first compre-ensive high resolution flux data suitable for use in parameterizingrocess based agro-ecosystem models across Europe (Smith et al.,010).
Croplands may play an important role in climate change miti-ation (IPCC, 2007; Smith et al., 2008). It is therefore imperative tostablish a better understanding of processes in order to reproducehe current pattern of cropland carbon dynamics. In the frameworkf the CarboEurope integrated project, detailed information aboutoil, vegetation and carbon and water fluxes from eddy covarianceystems, in connection with comprehensive crop managementata covering entire crop rotations, are available. The networkf sites covers all main regions of EU25 and Switzerland, reflect-ng regionally specific crops and management (see Ceschia et al.,his issue; Eugster et al., this issue; Kutsch et al., 2010). Here, weresent a multi-site model comparison for four ecosystem models,amely the DeNitrification DeComposition model (DNDC) (Li et al.,992, 1994, 2005), the coupled vegetation-crop model “Organ-
sing Carbon and Hydrology In Dynamic EcosystEms-SimulateurulTIdisciplinaire pour les Cultures Standard” (ORCHIDEE-STICS)
De Noblet-Ducoudré et al., 2004; Gervois et al., 2008), the “Cropnvironment REsource Synthesis Environnement et Grandes Cul-ures” (CERES-EGC) (Gabrielle et al., 2006; Lehuger et al., 2009,ehuger et al., this issue) model and the Soil Plant Atmosphereodel (SPA) (Williams et al., 1996; Sus et al., 2010). These mod-
ls represent a crosscut of widely applied model species thatre currently used to analyse the carbon dynamics of croplands.hese include site-scale semi-empirical models, biogeochemicalegional-scale process models, soil-vegetation-atmosphere trans-er models (SVATs), and coupled global vegetation models (Li et al.,997; Smith et al., 1997a; Williams and Rastetter, 1999; Law et al.,000; Brown et al., 2002; Zhang et al., 2006; Lehuger et al., 2007,009; Gervois et al., 2008; Vuichard et al., 2008). We compare theodels in terms of their performance in simulating the cycling
f carbon and water between vegetation and the atmosphere ondaily time scale. This study does not include other greenhouse
asses, due to the lack of high resolution measurements at the sites,nd the limitation of ORCHIDEE-STICS and SPA to simulation onlyhe carbon cycle.
The key elements of the carbon cycle are the fixation of atmo-pheric carbon dioxide (CO2) by photosynthesis and its release byutotrophic and heterotrophic respiration. The net flux as the sumf these three components is the net ecosystem exchange (NEE)hich can be measured by eddy covariance systems (Baldocchi
t al., 1996; Black et al., 1996; Moncrieff et al., 1997; Baldocchi,003; Reichstein et al., 2005; Aubinet, 2008; Smith et al., 2010).EE is the net uptake or release of carbon by terrestrial ecosystems
nfluenced by climatic and by non-climatic factors like the plant
ater supply, leaf area index and soil carbon dynamics, which aregain influenced by crop type and associated management.The terrestrial water cycle includes the precipitation that
eaches the vegetation surface from the atmosphere, which is sub-equently partitioned into rain intercepted by the canopy, surface
245 x x x x346 x x x271 x x x
and sub-surface runoff, and water infiltrating the soil profile. Thewater which enters the soil profile either evaporates, is taken upby plant roots and subsequently transpired, or percolates out of therooting zone. The sum of the first two, evaporation and transpira-tion, is the process of evapotranspiration (Bosch and Hewlett, 1982;Zhang et al., 2001; Farley et al., 2005; Falloon and Betts, in press).The two processes of water release and carbon uptake are closelyinterlinked by plant stomatal conductance of water and CO2 (Beeret al., 2007).
Besides being a key factor in the exchange of carbon and waterbetween the plant and atmosphere, the soil water status also influ-ences the microbial decay of carbon which is strongly constrainedby soil moisture conditions, as either too much or too little waterreduce microbial activity (Pastor and Post, 1986; Davidson et al.,2006).
A number of previous studies have evaluated SVAT models forsimulating carbon fluxes from croplands (Wang et al., 2005, 2007;Adiku et al., 2006; Huang et al., 2009). Elsewhere in this issue,three papers present detailed evaluations of the SPA (Sus et al.,2010), CERES-EGC (Lehuger et al., this issue) and the DNDC (Dietikeret al., 2010) models. However, the combined evaluation of waterand carbon fluxes is relatively rare in the literature (Adiku et al.,2006). Three previous studies have had comparable aims (Krameret al., 2002; Morales et al., 2005; Grant et al., 2007). The study byGrant et al. (2007) evaluates only one model against cropland eddycovariance data for latent heat and net biome productivity (NBP)measured over an irrigated and rain fed Maize–Soybean rotation inthe US. Kramer et al. (2002) and Morales et al. (2005), on the otherhand, compare a number of biogeochemical and coupled globalvegetation models including ORCHIDEE against global EUROFLUXdata, but in that case, for global forest biomes and not croplandecosystems.
Here we focus on the accurate representation of the main com-ponents of the cropland carbon cycle: net ecosystem exchange,ecosystem respiration (Reco) and gross primary production (GPP) inconnection with the actual evapo-transpiration (ETa). This modelevaluation is conducted on a daily time scale, and over a gradientof environmental conditions in Europe ranging from the easternpart of Germany (mean annual temperature (T) = 7.3 ◦C; precipi-tation (P) = 850 mm) over a central mountainous alpine region inSwitzerland (T = 9.0 ◦C; P = 1100 mm), to the central and southernpart of France (T = 12.9 ◦C; P = 700 mm). This multi-criterion, multi-model, multi-site evaluation provides insights into the applicabilityof the models to simulate the carbon balance of cropland ecosys-tems within Europe.
2. Material and methods
2.1. The cropland sites
The four models were run at five sites (Oensingen, Gebe-see, Grignon, Aurade, Klingenberg) for one year of winter wheat(Triticum aestivum) at each site and one year for maize (Zea mays)

stems
amkCmciC
2
2
o1wntsDe
2eaacFiudae
2dmmposstta(
2Dtprotip
2
2mm
(di
M. Wattenbach et al. / Agriculture, Ecosy
t Grignon. However, the extent of our comparison is limited byodel differences in the number of crop types simulated and the
ind of output data produced. For example, SPA has no maize andERES-EGC produces no estimate of Reco. The combinations of sites,odels, crops and years are given in Table 1. Model results were
ompared accordingly. A more detailed description of the sitess given in other papers in this special issue (Kutsch et al., 2010,eschia et al., 2010).
.2. Models
.2.1. The DNDC modelThe DNDC model (in this study version 9.2), is a general model
f C and N biogeochemistry in agricultural ecosystems (Li et al.,992, 1994, 2005). It is a process-oriented simulation model,hich contains four interacting sub-models for soil climate, de-itrification, decomposition and plant growth. The model has beenested against numerous field data sets of nitrous oxide (N2O) emis-ions (Frolking et al., 1998; Tonitto et al., 2007a; Abdalla et al., 2009;avid et al., 2009) and soil carbon dynamics (Li et al., 1997; Smitht al., 1997a; Brown et al., 2002; Zhang et al., 2006).
.2.1.1. Plant Growth. DNDC simulates plant growth using anmpirical approach calculating photosynthesis, respiration, waternd N demand, C allocation, crop yield, and litter production ondaily time step for about sixty different crops. Photosynthesis is
alculated using the radiation use efficiency approach (Aber andederer, 1992), with interception of light depending on leaf areasndex based on Beer’s law (Falge et al., 2005). Phenology is sim-lated using accumulative thermal degree days approach. A userefined amount of litter either from roots or aboveground residuefter harvest is assumed to enter the carbon cycle of the model (Qiut al., 2009).
.2.1.2. Soil organic carbon dynamics. The soil organic carbon (SOC)ynamics is simulated by assuming four main pools: plant residue,icrobial biomes, active humus, and passive humus. Each of theain pools is subdivided into one or more sub-pools with different
roperties. The daily decomposition rate is calculated dependingn the relative size of each sub-pool and is regulated by each poolize, its decomposition rate, the soil clay content, N availability,oil temperature and moisture, and its depth in the soil profile. Inhe process of the decomposition simulation, carbon is transferredo the soil pool with the next lower decomposition rate, partiallyssimilated into microbial biomes, and partially converted into CO2Qiu et al., 2009).
.2.1.3. Latent heat flux. Potential evapo-transpiration (ET) inNDC is calculated using a daily average value from the Thorn-
hwaite formula (Thornthwaite and Hare, 1965). Subsequently,otential ET is separated into potential evaporation and transpi-ation. To calculate the potential transpiration, the water demandf plants is calculated based on the daily biomass increment usinghe water/biomass ratio of the crops. The actual plant transpirations then calculated by taking the actual soil water content of the soilrofile into account (Li et al., 2006).
.2.2. The ORCHIDEE-STICS modelORCHIDEE-STICS is a coupled model (De Noblet-Ducoudré et al.,
004; Gervois et al., 2008) consisting of a dynamic global vegetationodel ORCHIDEE (Krinner et al., 2005), and a process-oriented crop
odel STICS (Brisson et al., 1998, 2002, 2003).The ORCHIDEE model calculates, for diverse vegetation typesplant functional types), surface CO2, water vapour and heat fluxesriven by varying weather, and the soil water and C pools dynam-
cs. It contains a biophysical module, dealing with photosynthesis
and Environment 139 (2010) 419–453 421
and energy balance calculations each 30 min, and a carbon dynam-ics module, dealing with phenology, growth, allocation, mortalityand SOM decomposition, on a daily time step. For better represent-ing cultivated plants, their phenology and management-relatedgrowth is calculated by the STICS model which is coupled toORCHIDEE, providing daily foliar index, root density profiles, nitro-gen stress, vegetation height, and irrigation requirements. Thesevariables are then sequentially assimilated into ORCHIDEE each dayto further calculate accurately gross primary production.
Currently, the ORCHIDEE-STICS model has been used for simu-lating Wheat, Soybean and Maize although STICS has sufficientlygeneric parameterizations to allow simulation of other cropspecies. The processes of the STICS sub model are:
2.2.2.1. Plant growth. Crop growth is driven by the plant car-bon accumulation and solar radiation intercepted by the foliage.According to the plant type, crop development is driven eitherby a thermal index (degree-days), a photothermal index or aphotothermal index taking into account vernalisation. The vernali-sation factor is the ratio between the sum of vernalising days sinceplanting and plant vernalisation requirements. Water stress andnitrogen stress, if any, reduce leaf growth and biomass accumu-lation, based on stress indices that are calculated in water andnitrogen balance modules (Brisson et al., 1998, 2002, 2003).
2.2.2.2. Soil organic carbon dynamics. Soil organic matter (SOM)decomposition is modelled based on the work of Parton andRasmussen (1994). SOM decomposition results in carbon fluxeswithin three carbon pools (active, slow, and passive). These fluxesare function of time constants under reference temperature andmoisture values and vary with temperature and moisture inhibi-tion functions that are used to parameterize the decrease of soilmetabolic activity under cold, dry, or anaerobic conditions. Thefractions of these fluxes that are attributed to the other carbon poolsand, as CO2 flux to the atmosphere, are also prescribed.
2.2.2.3. Latent heat flux. The latent heat flux calculation accountsfor soil evaporation, foliage water (ie. intercepted precipitationand dew) evaporation, canopy transpiration and snow sublimation.Each of these fluxes is driven by the gradient of specific humiditybetween the evaporating surface and the overlaying air and limitedby a set of resistances (Krinner et al., 2005).
2.2.3. The SPA modelThe Soil Plant Atmosphere model (Williams et al., 1996) is a
process-based model that simulates ecosystem photosynthesis andwater balance at fine temporal and spatial scales (up to 30 min timestep, ten canopy and twenty soil layers). The scale of parameteriza-tion (leaf-level) and prediction (canopy-level) have been designedto allow the model to diagnose eddy-flux data and to provide a toolfor scaling up leaf level processes to canopy and landscape scales(Williams et al., 2000).
2.2.3.1. Plant growth. The SPA model employs the Farquharapproach of leaf-level photosynthesis (Farquhar et al., 1980) to cal-culate the amount of carbohydrates synthesised at each time step.The carbohydrates are then allocated to one root and four above-ground carbon pools (labile, foliage, stem and storage organ carbonpools), and accounts for autotrophic and heterotrophic respiratoryprocesses (Vertregt and Penning de Vries, 1987). The C allocationpattern itself is dependent on the developmental stage (DS) of the
crop plant. DS is calculated as the sum of daily developmental rates,which are a function of temperature, photoperiod, and vernalisa-tion (Sus et al., 2010). Senescence is calculated as a function of eithermutual shading effects of canopies with a LAI > 4, or developmentalrate in the reproductive phase, whichever is dominant. Senescent
4 stems
cgc
2ttCbsab2
2t1mua
2
1Losspt
csrug
2laleatosdttod
2sDwbaCd
2(er
22 M. Wattenbach et al. / Agriculture, Ecosy
arbon is either remobilised and subsequently reallocated to therowing storage organ, or added to a standing dead leaf biomassarbon pool.
.2.3.2. Soil organic carbon dynamics. At harvest, the fraction ofhe aboveground biomass exported from the field is estimated byhe storage organ C content plus non-crop residue leaf and stem
mass. The residual crop biomass gradually enters the litter car-on pool. The fraction of crop residue entering either the litter oroil carbon pool further depends on land management and can bedjusted accordingly. Following this approach, SPA models the car-on mass balance for winter/spring barley and wheat (Sus et al.,010).
.2.3.3. Latent heat flux. SPA uses the Penman-Monteith equationo determine leaf-level transpiration (Penman, 1948; Monteith,965, 1977). It is linked to the photosynthesis module by a novelodel of stomatal conductance that optimizes daily carbon gain per
nit leaf nitrogen, within the limitations of canopy water storagend soil to canopy water transport.
.2.4. The CERES-EGC modelThe original CERES model is a soil-crop model (Jones and Kiniry,
986). It was extended into CERES-EGC (Gabrielle et al., 2006;ehuger et al., 2009) by moving the focus towards the simulationf nitrogen-cycle-related processes such as nitrate leaching, emis-ions of N2O and nitrogen oxides. CERES-EGC runs on a daily timetep, and requires daily rain, mean air temperature and Penmanotential evapo-transpiration (Penman, 1948) as forcing variableso calculate actual evapo-transpiration.
CERES-EGC simulates water, carbon and nitrogen in the soil-rop systems in a number of sub modules. A physical sub-modelimulates heat, water and nitrate movement in the soil. It is alsoesponsible for the calculation of soil evaporation, plant waterptake and transpiration. A biological sub-model simulates therowth and phenology of the crops.
.2.4.1. Plant growth. The model calculates net photosynthesis as ainear function of intercepted radiation according to the Monteithpproach (Monteith, 1977), with light interception depending oneaf area index based on Beer’s law. The key species specific param-ter in this calculation is the radiation use efficiency (RUE) defineds the dry biomass produced per unit of radiation intercepted. Pho-osynthates are partitioned on a daily basis to currently growingrgans (roots, leaves, stems, fruits) according to crop developmenttage. The latter is driven by the accumulation of growing degreeays, as well as cold temperature and day-length for crops sensitiveo vernalisation and photoperiod. Lastly, crop N uptake is computedhrough a supply/demand scheme, with soil supply dependingn soil nitrate and ammonium concentrations and root lengthensity.
.2.4.2. Soil organs carbon dynamics. A micro-biological sub-modelimulates the turnover of organic matter in the plough layer.ecomposition, mineralisation and N-immobilisation are modelledith three pools of organic matter (OM): the labile OM, the micro-
ial biomass and the humads. Kinetic rate constants define the Cnd N flows between the different pools. Direct field emissions ofO2, N2O, NO and NH3 into the atmosphere are simulated withifferent trace gas modules (Lehuger et al., this issue).
.2.4.3. Latent heat flux. The Penman potential evapo-transpirationPenman, 1948) is used as forcing variables to calculate actualvapo-transpiration based on the water status of the soil and crop,espectively.
and Environment 139 (2010) 419–453
2.2.5. Simulation set-up2.2.5.1. Input data. Models are driven by meteorological variablesderived from half hourly measurements at each site. Simulationtime steps differ among models (and consequently time resolu-tion of input meteorological variables): from daily (for DNDC) andCERES-EGC) to half-hourly (for SPA and ORCHIDEE-STICS). Thenumber of meteorological variables used also differs among themodels: from only two for DNDC (temperature and precipitation)to up to six for ORCHIDEE-STICS (temperature, precipitation, inci-dent long and short-wave radiation, relative humidity and windspeed).
In case of gaps in the on-site daily time series, the data fromthe nearest climate station from the ECAD dataset was used to gap-fill with daily values for models with daily time steps (Klein Tanket al., 2002). In case of gaps in the half hourly data required bythe ORCHIDEE-STICS and SPA, data were gap filled with long termsite-specific half-hourly average values.
The soil texture is determined from measurements made at eachsite (Kutsch et al., 2010; Sus et al., 2010) and prescribed accordinglyfor all four models. Management events, such as fertilization, irri-gation, planting, harvest or ploughing are also defined by on-siteobserved values (Kutsch et al., 2010). In the SPA model, the effectsof fertilization are not taken into account, but reported harvestdates and crop residue management are considered in the modelruns.
The simulated crops were parameterized for each model using‘standard’ published values (Kätterer et al., 1997; López and Arrúe,1997; Van Den Boogaard et al., 1997; Juskiw et al., 2001; Lohilaet al., 2003; McMaster and Wilhelm, 2003; Mueller et al., 2005)or data provided by the site. For the DNDC model, values given inTable 2 are for the time of harvest as prescribed in the DNDC usermanual. For the estimation of plant C/N ratios in DNDC, site data forbiomass and carbon and nitrogen content were used. ORCHIDEE-STICS, SPA and CERES-EGC use generic parameterizations for allsites. Where carbon and nitrogen content data were not available,fertilizer application data, provided by the site managers, were usedto derive site specific C/N ratios under the assumption of optimumnitrogen supply during growth.
2.2.5.2. Initialisation procedure. For the initialisation of the soil car-bon and nitrogen pools, the DNDC model was run for ten years usingdaily ECAD weather data from the nearest weather station (KleinTank et al., 2002). The litter input for the initialisation period wasmanually adjusted so that modelled matched measured total soilorganic carbon at the beginning of the simulation period. The fer-tilizer input for this initialisation period was assumed to be in thesame order of magnitude as the mineral fertilizer input during thesimulation period.
For simulations performed by ORCHIDEE-STICS, the soil carbonpools were initialised to their steady state equilibrium values aftera thousand-years spin-up during which climate and managementpractice of the simulated year were repeatedly cycled.
For SPA simulations, the initial soil organic matter as well aslabile carbon content is estimated based on field observationsreported in the literature (Halley and Soffe, 1988; Anthoni et al.,2004; Aubinet, 2008). The initial labile carbon content is equal tothe seed carbon content at sowing in the SPA model.
The CERES-EGC model was run for two rotations at all sitesbefore the measurement period to stabilize the C and N soilpools and dampen the initial conditions. The same meteorologi-cal data were repeatedly used in case the historical data were not
available.DNDC was set up to run for the full crop rotation using litterinputs based on the calculated crop growth. The optimum yieldparameter was adjusted to match the site specific yields. The DNDCmodel does not incorporate the concept of crop germination and
M. Wattenbach et al. / Agriculture, Ecosystems and Environment 139 (2010) 419–453 423
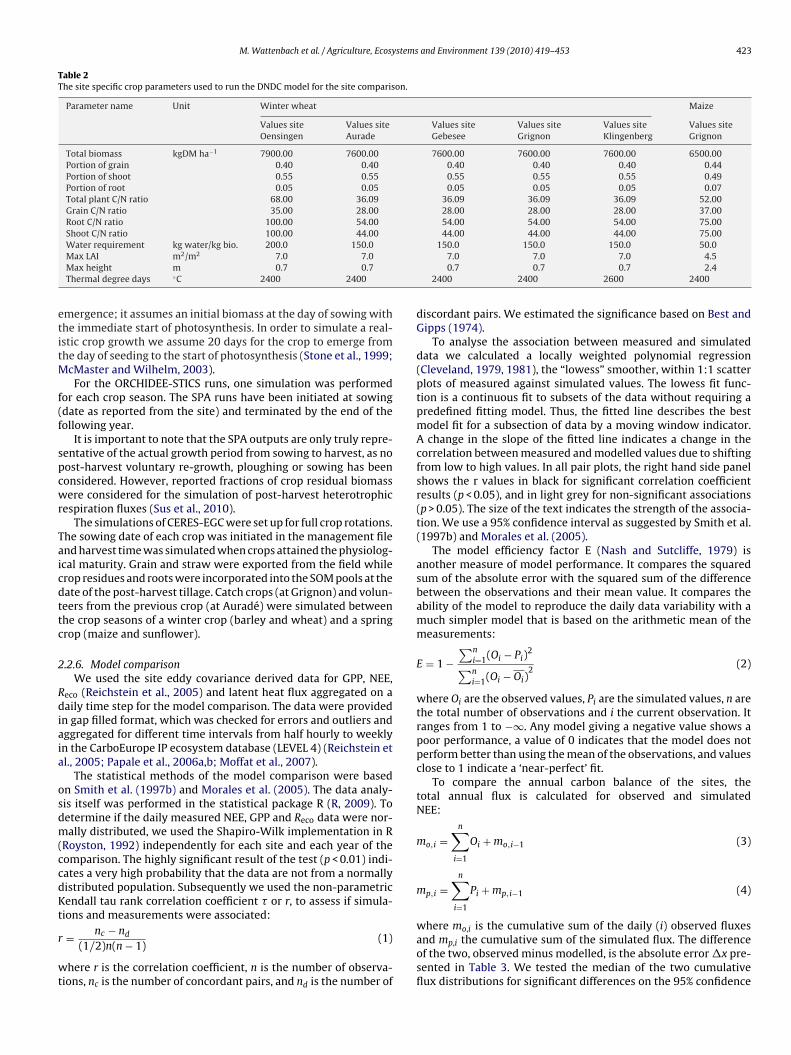
Table 2The site specific crop parameters used to run the DNDC model for the site comparison.
Parameter name Unit Winter wheat Maize
Values siteOensingen
Values siteAurade
Values siteGebesee
Values siteGrignon
Values siteKlingenberg
Values siteGrignon
Total biomass kgDM ha−1 7900.00 7600.00 7600.00 7600.00 7600.00 6500.00Portion of grain 0.40 0.40 0.40 0.40 0.40 0.44Portion of shoot 0.55 0.55 0.55 0.55 0.55 0.49Portion of root 0.05 0.05 0.05 0.05 0.05 0.07Total plant C/N ratio 68.00 36.09 36.09 36.09 36.09 52.00Grain C/N ratio 35.00 28.00 28.00 28.00 28.00 37.00Root C/N ratio 100.00 54.00 54.00 54.00 54.00 75.00Shoot C/N ratio 100.00 44.00 44.00 44.00 44.00 75.00
etitM
f(f
spcwr
Taicdttc
2
Rdiaia
osdm(ccdKt
r
wt
Water requirement kg water/kg bio. 200.0 150.0Max LAI m2/m2 7.0 7.0Max height m 0.7 0.7Thermal degree days ◦C 2400 2400
mergence; it assumes an initial biomass at the day of sowing withhe immediate start of photosynthesis. In order to simulate a real-stic crop growth we assume 20 days for the crop to emerge fromhe day of seeding to the start of photosynthesis (Stone et al., 1999;
cMaster and Wilhelm, 2003).For the ORCHIDEE-STICS runs, one simulation was performed
or each crop season. The SPA runs have been initiated at sowingdate as reported from the site) and terminated by the end of theollowing year.
It is important to note that the SPA outputs are only truly repre-entative of the actual growth period from sowing to harvest, as noost-harvest voluntary re-growth, ploughing or sowing has beenonsidered. However, reported fractions of crop residual biomassere considered for the simulation of post-harvest heterotrophic
espiration fluxes (Sus et al., 2010).The simulations of CERES-EGC were set up for full crop rotations.
he sowing date of each crop was initiated in the management filend harvest time was simulated when crops attained the physiolog-cal maturity. Grain and straw were exported from the field whilerop residues and roots were incorporated into the SOM pools at theate of the post-harvest tillage. Catch crops (at Grignon) and volun-eers from the previous crop (at Auradé) were simulated betweenhe crop seasons of a winter crop (barley and wheat) and a springrop (maize and sunflower).
.2.6. Model comparisonWe used the site eddy covariance derived data for GPP, NEE,
eco (Reichstein et al., 2005) and latent heat flux aggregated on aaily time step for the model comparison. The data were provided
n gap filled format, which was checked for errors and outliers andggregated for different time intervals from half hourly to weeklyn the CarboEurope IP ecosystem database (LEVEL 4) (Reichstein etl., 2005; Papale et al., 2006a,b; Moffat et al., 2007).
The statistical methods of the model comparison were basedn Smith et al. (1997b) and Morales et al. (2005). The data analy-is itself was performed in the statistical package R (R, 2009). Toetermine if the daily measured NEE, GPP and Reco data were nor-ally distributed, we used the Shapiro-Wilk implementation in R
Royston, 1992) independently for each site and each year of theomparison. The highly significant result of the test (p < 0.01) indi-ates a very high probability that the data are not from a normallyistributed population. Subsequently we used the non-parametricendall tau rank correlation coefficient � or r, to assess if simula-
ions and measurements were associated:
= nc − nd
(1/2)n(n − 1)(1)
here r is the correlation coefficient, n is the number of observa-ions, nc is the number of concordant pairs, and nd is the number of
150.0 150.0 150.0 50.07.0 7.0 7.0 4.50.7 0.7 0.7 2.4
2400 2400 2600 2400
discordant pairs. We estimated the significance based on Best andGipps (1974).
To analyse the association between measured and simulateddata we calculated a locally weighted polynomial regression(Cleveland, 1979, 1981), the “lowess” smoother, within 1:1 scatterplots of measured against simulated values. The lowess fit func-tion is a continuous fit to subsets of the data without requiring apredefined fitting model. Thus, the fitted line describes the bestmodel fit for a subsection of data by a moving window indicator.A change in the slope of the fitted line indicates a change in thecorrelation between measured and modelled values due to shiftingfrom low to high values. In all pair plots, the right hand side panelshows the r values in black for significant correlation coefficientresults (p < 0.05), and in light grey for non-significant associations(p > 0.05). The size of the text indicates the strength of the associa-tion. We use a 95% confidence interval as suggested by Smith et al.(1997b) and Morales et al. (2005).
The model efficiency factor E (Nash and Sutcliffe, 1979) isanother measure of model performance. It compares the squaredsum of the absolute error with the squared sum of the differencebetween the observations and their mean value. It compares theability of the model to reproduce the daily data variability with amuch simpler model that is based on the arithmetic mean of themeasurements:
E = 1 −∑n
i=1(Oi − Pi)2
∑ni=1(Oi − Oi)
2(2)
where Oi are the observed values, Pi are the simulated values, n arethe total number of observations and i the current observation. Itranges from 1 to −∞. Any model giving a negative value shows apoor performance, a value of 0 indicates that the model does notperform better than using the mean of the observations, and valuesclose to 1 indicate a ‘near-perfect’ fit.
To compare the annual carbon balance of the sites, thetotal annual flux is calculated for observed and simulatedNEE:
mo,i =n∑
i=1
Oi + mo,i−1 (3)
mp,i =n∑
i=1
Pi + mp,i−1 (4)
where mo,i is the cumulative sum of the daily (i) observed fluxesand mp,i the cumulative sum of the simulated flux. The differenceof the two, observed minus modelled, is the absolute error �x pre-sented in Table 3. We tested the median of the two cumulativeflux distributions for significant differences on the 95% confidence

424M
.Wattenbach
etal./A
griculture,Ecosystems
andEnvironm
ent139
(2010)419–453
Table 3Performance criteria of the models across sites and models. E—Nash Sutcliffe efficiency (Nash and Sutcliffe, 1979), r—Kendall correlation coefficient and NEE absolute error �x.
Site Flux Model
DNDC CERES-EGC OERCHIDEE-STICS SPA Site mean
Criteria E r �x (g C m−2) E r �x (g C m−2) E r �x (g C m−2) E r �x (g C m−2) E r
Oensingen 2007 NEE 0.33 0.45 −127 NA NA NA 0.56 0.54 125 0.7 0.56 22 0.53 0.52GPP 0.62 0.57 NA NA 0.58 0.43 0.52 0.54 0.57 0.51Reco 0.1 0.5 NA NA 0.14 0.66 −0.06 0.64 0.06 0.60Eta −0.13 0.41 NA NA 0.27 0.68 0.2 0.65 0.11 0.58
Grignon 2005 NEE 0.25 0.28 −207 0.85 0.4 185 0.29 0.59 −189 NA NA NA 0.46 0.42GPP 0.76 0.51 NA NA 0.53 0.54 NA NA 0.65 0.53Reco −2 0.61 NA NA 0.38 0.71 NA NA −0.81 0.66Eta 0.08 0.4 0.72 0.37 0.52 0.57 NA NA 0.44 0.45
Grignon 2006 NEE −0.15 0.32 −204 0.84 0.6 109 0.82 0.72 22 0.87 0.71 46 0.51 0.58GPP 0.31 0.49 NA NA 0.83 0.59 0.87 0.51 0.67 0.53Reco −1.79 0.29 NA NA 0.64 0.71 0.43 0.65 −0.24 0.55Eta −0.04 0.42 −0.75 0.32 0.78 0.61 0.69 0.68 0.48 0.57
Aurade 2006 NEE 0.62 0.68 −67 0.64 0.57 40 0.56 0.63 −8 0.86 0.63 82 0.68 0.65GPP 0.47 0.59 NA NA 0.68 0.51 0.77 0.64 0.64 0.58Reco −2.91 0.38 NA NA 0.35 0.71 0.22 0.62 −0.78 0.57Eta −0.04 0.43 −0.47 0.46 0.59 0.6 0.5 0.68 0.35 0.57
Klingenberg 2006 NEE 0.47 0.59 −97 NA NA NA 0.39 0.55 217 0.62 0.69 179 0.49 0.61GPP 0.68 0.59 NA NA 0.67 0.46 0.45 0.8 0.60 0.62Reco −0.27 0.63 NA NA 0.69 0.79 0.66 0.51 0.36 0.64Eta 0.23 0.58 NA NA 0.49 0.54 0.68 0.76 0.47 0.63
Gebesee 2007 NEE 0.35 0.5 −67 0.67 0.74 110 NA NA NA 0.76 0.81 126 0.59 0.68GPP 0.67 0.67 NA NA NA NA 0.84 0.74 0.76 0.71Reco 0.73 0.62 NA NA NA NA 0.41 0.72 0.57 0.67Eta −0.35 0.48 −0.29 0.38 NA NA 0.61 0.66 −0.01 0.51
Model mean NEE 0.31 0.47 −128 0.75 0.58 111 0.52 0.61 27 0.76 0.68 91 0.55 0.58GPP 0.59 0.57 NA NA 0.66 0.51 0.69 0.65 0.65 0.58Reco −1.02 0.51 NA NA 0.44 0.72 0.33 0.63 −0.14 0.62Eta −0.04 0.45 −0.20 0.38 0.53 0.60 0.54 0.69 0.31 0.55

stems
l(
3
Tim
Fsa
M. Wattenbach et al. / Agriculture, Ecosy
evel by using the R implementation of the Wilcoxon rank sum testHollander and Wolfe, 1973; Corder and Foreman, 2009).
. Results
The statistical results of r and E for all sites are summarised inable 3 and in the figures that show the site to site performancen terms of r. There are common patterns for all sites and for all
odels which are:
NEE meas [gC m−2]
−5 0 5
0.68 0.57
−5
05
NEE DNDC [gC m−2] 0.49
NEE CERE. [
−10
−5
05
−10 −6 −2 2 −8 −4
ig. 1. The scatter plots of simulated versus measured NEE for the site Aurade, winter white panel are Kendall correlations coefficients. The size of the number indicates the stressociation.
and Environment 139 (2010) 419–453 425
◦ Poor performance of all models in reproducing low carbon fluxesranging between −2 g C m2 day−1 and 2 g C m2 day−1 (e.g. Fig. 1and Appendix odd numbered Figs. A1 to A9).
◦ All models have problems with capturing the crop phenology,which is indirectly indicated by either an overestimation of the
amplitude of growth in the later stage of crop development(mainly the case for ORCHIDEE-STICS, SPA and CERES-EGC model)or a phase shift of growth as seen for DNDC (especially for winterwheat by simulating the onset of growth to early in the season)(Fig. 2 and Appendix even numbered Figs. A2 to A10).−10 −5 0 5
0.63
−10
−6
−2
2
0.63
0.54 0.51
gC m−2] 0.67
−8
−4
02
0.71
NEE ORCH. [gC m−2] 0.82
0 2 −8 −4 0 2
−8
−4
02
NEE SPA [gC m−2]
eat, 2006. The grey line indicates the lowess regression. The numbers in right handngth of the association. IN this case all model capture the NEE with good levels of

426 M. Wattenbach et al. / Agriculture, Ecosystems
0 100 200 300
−60
0−
500
−40
0−
300
−20
0−
100
010
0
Day of the year 2006
NE
E [g
C m
−2]
measurements
DNDCCERESORCHIDEESPA
Fig. 2. Cumulative NEE for the year 2006 at the site Aurade, winter wheat. DNDCmEBt
◦
◦
3
tdyimI((
CbSlG((tio
nidmdm
odel: grey solid line, ORCHIDEE-STICS model: dark grey dash dot line, CERES-GC—grey dots, SPA—black dash line, measurements indicated by open circles.esides capturing the daily dynamic of fluxes (Fig. 1) ORCHIDEE-STICS fails to cap-ure the fluxes after the growing season.
A good to very-good fit for GPP and Reco at fluxes below, andrespectively, above the −2 g C m2 day−1 and 2 g C m2 day−1 fluxrates, but a relatively poorer fit for NEE.DNDC and CERES-EGC: a relatively poor performance in repro-ducing the latent heat flux in contrast to a better performancefor NEE, GPP and Reco, suggesting problems in the coupling of thewater and carbon flux in these models.
.1. NEE
There is a wide range in the performance of the various modelso reproduce the measured NEE patterns at different sites and inifferent years, and also between models at one site in the sameear. Correlations range from r = 0.28, p < 0.05 for DNDC simulat-ng maize in year 2005 at Grignon to r = 0.81, p < 0.05 for the SPA
odel simulating winter wheat at Gebesee in 2007 (see Table 3).n general, all models perform better for simulating winter cropssite mean: E = 56, r = 0.61) than the summer maize crop at Grignonsite mean: E = 0.46, r = 0.42).
In general, there is a better inter-model agreement betweenERES-EGC and ORCHIDEE-STICS with an exception at the Klingen-erg site where we observe a slightly better agreement betweenPA and DNDC than between the two. If we test average corre-ation of all models per site, models perform on average best atebesee with winter wheat in 2007 (r = 0.68), followed by Aurade
r = 0.65), Klingenberg (r = 0.61), Grignon 2006 (r = 0.58), Oensingenr = 0.52) and maize crop in Grignon in 2005 (r = 0.42). Even thoughhese results are relatively good, all models expose a weak andnconsistent performance at all sites for low fluxes in the rangef −2 g C m2 day−1 to 2 g C m2 day−1.
If we compare cumulative NEE fluxes (Fig. 2 and Appendix evenumbered Figs. A2 to A10), we observe a mismatch for all models
n the early stage of the growing season, when low fluxes pre-ominate. The DNDC model shows a stronger divergence fromeasurements compared to the other models in the first 100
ays of the year (DOY). The ORCHIDEE-STICS, SPA and CERES-EGCodels start with very similar trajectories but begin to diverge
and Environment 139 (2010) 419–453
between DOY 100 and 200 at most of the sites, except for maizeat Grignon in 2005. A common pattern for the three models isto overestimate the NEE peak and the failure to reproduce thesenescence and post harvest fluxes. This leads to a mismatch ofthe cumulative NEE for the year (Table 3). In general, the SPAmodel shows the best performance when expressed as r and Efor NEE over all sites even though deficiencies remain in repro-ducing cumulative NEE because of lacking peak and post-harvestfluxes.
3.2. Reco
The ranking the models according to their association with thedata shows ORCHIDEE-STICS with the best performance on aver-age over all sites (model mean: r = 0.72, p < 0.05). This model isalso consistent in its performance over all sites with comparabler values (Table 3). Between models the r values vary strongly fromr = 0.38 for DNDC in Aurade to r = 0.79 (p < 0.05) for ORCHIDEE-STICSat Klingenberg in 2006. Similar as for the simulation of NEE, wecan identify the highest significant agreement between SPA andORCHIDEE-STICS (Note: CERES-EGC does not simulate Reco), anda lower association between these two models and DNDC. How-ever, the pattern with contrasting behaviour of all models for fluxesbelow 2 g C m2 is again clear (Fig. 3 and Figs. 11 and 12Annex Figs.A11, A12), and a considerable scatter is seen for high flux rates. Thisis also reflected in low mean model efficiency values: E = −1.02,E = 0.44 and E = 0.33 for DNDC, ORCHIDEE-STICS and SPA, respec-tively.
3.3. GPP
All models simulate GPP with association r comparable to per-formance (mean r = 0.85) when simulating NEE, with correlationcoefficient that varies from r = 0.43 (ORCHIDEE-STICS at Oensin-gen) to r = 0.75 (SPA at Gebesee) (p < 0.05) (Fig. 4 and Figs. 13 and14Annex Figs. A13, A14 and Table 3).
Overall the models agree better with each other (mean betweenmodels all sites r = 0.68) than when associated to the measure-ments (mean over all sites measurement model r = 0.58). In thisrespect, ORCHIDEE-STICS and SPA are the two models that relatethe most (mean r = 0.76), followed by SPA and DNDC (mean r = 0.67).Last, DNDC and ORCHIDEE-STICS models disagree the most (meanr = 0.6). Concerning the good agreement between ORCHIDEE-STICSand SPA the scatter between the two models is lower than in theirrespective reproduction of the measured values which suggests acommon reason for the misfit with the data.
Model-data comparisons exhibit a strong mismatch for lowfluxes as indicated by a similar and almost ‘flat’ shape of the regres-sion line for the comparison with low measured values (see Fig. 4and Annex A13, A14).
Overall model-data agreement as evaluated by the Nash-Sutcliffe E is relatively high, being generally greater than 0.55. Itis minimal for DNDC at Grignon in 2006 (E = 0.31) and goes up to0.80 for three model-site combinations (ORCHIDEE-SITCS and SPAat Grignon 2006 and SPA at Gebesee).
3.4. ETa
The comparison of observed and modelled evapotranspirationfluxes generally shows that ORCHIDEE-STICS and SPA show high-est correlations with measurements (mean r for all sites: 0.60 for
ORCHIDEE-STICS, 0.69 for SPA). Again, these models also exhibita considerable degree of cross-correlation, indicating a generalagreement in the response to driving variables. In relation tothat, the accuracy of modelled ETa as simulated by CERES-EGC(mean r: 0.38) and DNDC (mean r: 0.45) is considerably lower.
M. Wattenbach et al. / Agriculture, Ecosystems and Environment 139 (2010) 419–453 427
Reco meas [gC m−2]
0 2 4 6 8 10 12
0.38 0.71
0 2 4 6 8
02
46
0.62
02
46
810
12
Reco DNDC [gC m−2] 0.29 0.42
Reco ORCH. [gC m−2]
24
68
0.68
0 2 4 6
02
46
8
2 4 6 8
Reco SPA [gC m−2]
F wheatr dicaten
FaifimDccEs
ig. 3. The scatter plots of simulated versus measured Reco for the Aurade, winteright hand site panel are Kendall correlations coefficients. The size of the number inow more pronounced for ORCHIDEE-STICS and SPA as in Fig. A11.
or CERES-EGC and DNDC, the relationship between modellednd observed ETa, expressed by the slope of the lowess fit curve,s changing around a value of 1 mm d−1. Beyond this value, thet curve gradually takes over a quasi-logarithmic behaviour forost scatter plots. For certain sites (e.g. both Grignon years),
NDC and CERES-EGC fail to reproduce high flux rates, indi-ated by a high degree of scattering around the fit curve. Theorrelation of modelled values is high between DNDC and CERE-GC, and even higher than with the observations for the Gebeseeite., for the year 2006. The grey line indicates the lowess regression. The numbers ins the strength of the association. The pattern of lack of fit for small fluxes reappears
We found low values of model efficiency for DNDC andCERES-EGC, which were negative for Grignon 2006, Gebesee andKlingenberg. For SPA and ORCHIDEE-STICS, E ranges from 0.2 (SPAat Oensingen) to 0.78 (ORCHIDEE-STICS at Grignon 2006). Thus,the overall efficiency of these two models is higher and broadly
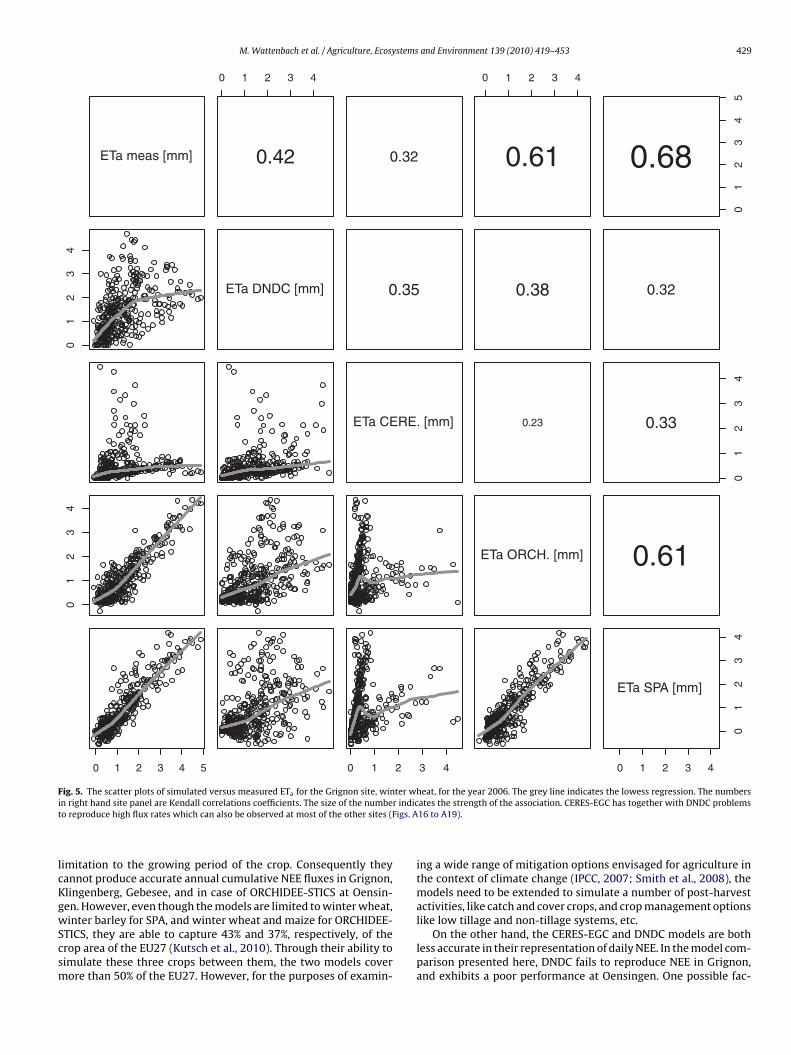
satisfying.In general, lower evapotranspiration fluxes were captured withhigher accuracy by all models, which is indicated by an increasingdata spread beyond 1 mm d−1 in most of the scatter plots (Fig. 5and Annex Figs. A15–A19).

428 M. Wattenbach et al. / Agriculture, Ecosystems and Environment 139 (2010) 419–453
GPP meas [gC m−2]
−14 −10 −6 −2 0
0.57 0.43
−15 −10 −5 0
−20
−15
−10
−5
0
0.54
−14
−10
−6
−4
−2
0
GPP DNDC [gC m−2] 0.63 0.76
GPP ORCH. [gC m−2]
−25
−20
−15
−10
−5
0
0.83
−20 −15 −10 −5 0
−15
−10
−5
0
−25 −20 −15 −10 −5 0
GPP SPA [gC m−2]
F r wher dicatea t betwr
4
stisrmr
ig. 4. The scatter plots of simulated versus measured GPP for the Oensingen, winteight hand site panel are Kendall correlations coefficients. The size of the number innd a less pronounced small flux disagreement. Interesting here the high agreemenesponse to the external drivers.
. Discussion
The aim of the paper was to test four models for accuracy inimulating the main components of the carbon cycle, net ecosys-em exchange, ecosystem respiration and gross primary production
n connection with the actual evapo-transpiration on a daily timecale over a gradient of environmental conditions in Europe. Theesults show a heterogeneous picture, with differences betweenodels and between sites. The two models with the highest accu-acy over all sites when simulating daily NEE and latent heat are
at, for the year 2007. The grey line indicates the lowess regression. The numbers ins the strength of the association. There is a good reproduction of GPP by the models
een ORCHIDEEE-STICS and SPA indicating, again, the high similarity of the model
SPA and ORCHIDEE-STICS. Both models run on a half hourly time-step with a high process resolution, so they are able to capturethe diurnal variability of processes leading to a high level of agree-ment when measurements are aggregated to daily fluxes. They arestrong, in particular, in simulating water fluxes where they clearly
out-perform the two other models, which is most probably a resultof the more process oriented representation of latent heat flux inthe models (see model description).However, the models are not able to simulate crop rotationsdue to the limited number crops parameterized, and their current
M. Wattenbach et al. / Agriculture, Ecosystems and Environment 139 (2010) 419–453 429
ETa meas [mm]
0 1 2 3 4
0.42 0.32
0 1 2 3 4
0.61
01
23
45
0.68
01
23
4
ETa DNDC [mm] 0.35 0.38 0.32
ETa CERE. [mm] 0.23
01
23
4
0.33
01
23
4
ETa ORCH. [mm] 0.61
0 1 2 3 4 5 0 1 2 3 4 0 1 2 3 4
01
23
4
ETa SPA [mm]
Fig. 5. The scatter plots of simulated versus measured ETa for the Grignon site, winter wheat, for the year 2006. The grey line indicates the lowess regression. The numbersi r indict igs. A
lcKgwScsm
n right hand site panel are Kendall correlations coefficients. The size of the numbeo reproduce high flux rates which can also be observed at most of the other sites (F
imitation to the growing period of the crop. Consequently theyannot produce accurate annual cumulative NEE fluxes in Grignon,lingenberg, Gebesee, and in case of ORCHIDEE-STICS at Oensin-en. However, even though the models are limited to winter wheat,
inter barley for SPA, and winter wheat and maize for ORCHIDEE-TICS, they are able to capture 43% and 37%, respectively, of therop area of the EU27 (Kutsch et al., 2010). Through their ability toimulate these three crops between them, the two models coverore than 50% of the EU27. However, for the purposes of examin-
ates the strength of the association. CERES-EGC has together with DNDC problems16 to A19).
ing a wide range of mitigation options envisaged for agriculture inthe context of climate change (IPCC, 2007; Smith et al., 2008), themodels need to be extended to simulate a number of post-harvestactivities, like catch and cover crops, and crop management options
like low tillage and non-tillage systems, etc.On the other hand, the CERES-EGC and DNDC models are bothless accurate in their representation of daily NEE. In the model com-parison presented here, DNDC fails to reproduce NEE in Grignon,and exhibits a poor performance at Oensingen. One possible fac-
4 stems
ttimrttwatmlTw
c(Tl(ehahc2
famrtspaghsm
tmGotp
iciirarwhf2i
4
iat
30 M. Wattenbach et al. / Agriculture, Ecosy
or leading to the failure of DNDC at the Grignon site in 2006 washe particularly mild winter, with temperatures rising above +10 ◦Cn the first 100 days of the year. The DNDC model seems to be
ore sensitive to these temperatures than the other models. DNDCesponds with immediate growth which leads to a strong overes-imation of early GPP and to early senescence because, in contrasto the other models, it uses temperature sum-based phenology,hich causes the strong phase mismatch with the measurement
nd with the other models. Another important factor determininghe accuracy of the DNDC model is the lack of consideration of ger-
ination/emergence as well as vernalisation in the model, whicheads to unrealistic growth in the early stage of the growing season.hese factors lead to a relatively poor performance of the modelhen simulating NEE in particular.
The lack-of-fit for the simulation of water fluxes for DNDCan be explained by the models use of the Thornthwaite formulaThornthwaite and Hare, 1965) to calculate evapo-transpiration.he Thornthwaite formula is known to underestimate potentialatent heat flux, especially under arid and semiarid conditionsAmatya et al., 1995; McKenney and Rosenberg, 1993). Thisxplains the lack-of-fit for the all sites except Oensingen, whichas the highest precipitation combined with a relatively low meannnual temperature. There are also reported problems with theydrological component in DNDC, especially regarding the cal-ulation of water filled pore space in the soil (Tonitto et al.,007a,b).
However, there are a number of factors that limited the per-ormance of DNDC in comparison to the other models. The firstnd most important point when compared to the best performingodels, SPA and ORCHIDEE-STICS, is the simulation of the full crop
otations at all sites. Where SPA and ORCHIDEE-STICS were ini-ialised to determine the initial conditions only for the year of theimulation, the DNDC model had to use the conditions related to therevious crops. The model also considers all management optionspplied at the sites including manure applications, tillage and therowth of cover crops. The level of model complexity for this partas also a profound impact on the uncertainties associated with theimulations which also increases the chance of poorer model fit toeasurements.In the case of CERES-EGC, we see a comparable performance
o ORCHIDEE-STICS and SPA when we compare the simulated toeasured NEE. However, the model was calibrated for the sites inrignon and Aurade, (Lehuger et al., this issue), limiting the degreesf freedom when simulating fluxes at these sites. If we comparehe performance for the un-calibrated site in Gebesee though, theerformance is still good for the simulation of NEE.
In general the results are in agreement with other studies exam-ning carbon fluxes. A direct model comparison of simulation ofarbon and water fluxes at forest sites of the EUROFLUX network,ncluding the two model classes present in this study (biogeochem-cal and dynamic global vegetation models), showed very similaresults (Morales et al., 2005). In that study, great variance of modelccuracy across all sites was also found. A main problem was theepresentation of water fluxes in the southern European region,here models performed poorly. We observe that especially DNDCas a low performance at all sites, except for Oensingen, but also
or CERES-EGC exhibits problems at the site Grignon in 2005 and006 as well as Gebesee, and in terms of model efficiency at Aurade
n 2006.
.1. Why do models fail to simulate low fluxes?
The lack of accuracy when simulating carbon fluxes close to zeros the most prevalent effect observed in this model comparisoncross sites and across models. There are two possible explana-ions. The first is that the concepts implemented in the models
and Environment 139 (2010) 419–453
under comparison are not adequate to simulate the underlyingprocesses. The second is that the measured fluxes are unrealisticdue to the inherent properties of uncertainty of eddy covariancemeasurements, such as u* correction, gap filling, outlier filtering,advection and flux partitioning, etc. (Hollinger and Richardson,2005; Reichstein et al., 2005; Richardson and Hollinger, 2005;Lasslop et al., 2008; Osborne et al., 2010; Smith et al., 2010). Theresults show that the models fail to reproduce low fluxes in all fluxcomponents namely NEE, GPP and Reco. It is also very importantto note that the models are inconsistent in how they stimulatethe flux, but still show partial consistency when directly com-pared to each other (this is especially true for ORCHIDEE-STICSand SPA). The measurements and models approach the same quan-tity from completely different directions. The entity measured ineddy covariance systems is NEE. The values for GPP and Reco arederived from NEE using flux partitioning (Reichstein et al., 2005)which uses measured weather data as drivers. The models, onthe other hand, use the same weather data as drivers to simulateGPP and Reco to calculate NEE. So given the same driving vari-ables, we arrive at different results for these low fluxes. If welook at the results of GPP and Reco simulations, we find a gener-ally higher agreement for fluxes below −2 g C m−2 day−1 and above2 g C m−2 day−1, respectively, which indicates that the underlyingassumptions for these fluxes are consistent. The time when theselow fluxes appear are the early growing stages of the crop or theintercropping period, which might hold one key to answer thequestion about the inconsistency. In this part of the growing sea-son, NEE fluxes are dominated by heterotrophic respiration of soilorganic matter and litter carbon. This respiration flux is clearlyhigher than photosynthesis by the small and slowly growing cropbiomass. As a consequence, initial values of soil organic matter,but more importantly litter carbon, largely determine the overallmatch of modelled vs observed NEE in the early growth phase. Forexample, we found clearly improved SPA results for early seasonlow NEE fluxes when increasing initial litter carbon content (from0 g C m−2, the initial litter carbon content for all runs shown here,to 200 g C m−2, results not shown). ORCHIDEE-STICS and SPA, themodels with the highest agreement between each other for the lowfluxes, are the two models that only simulate the cropping sea-son with a limited implementation of management action, whichcan explain the mismatch. On the other hand DNDC shows a goodperformance in simulating GPP, and in some cases Reco, but wasnot able to adequately reproduce the temporal development of thecrop, which in turn caused a lack of alignment between the peaksin GPP and Reco. Because NEE is calculated as the difference of thetwo, the errors amplify, especially at the end of the growing sea-son when the model simulates senescence, reducing GPP, which inparallel increases the ecosystem respiration due to a higher carboninput into the soil. However, the inherent properties of eddy covari-ance measurements also have effects on the model comparison.There are a number of papers discussing the influence of differentassumptions on aggregated NEE fluxes at agricultural sites (Anthoniet al., 2004; Aubinet, 2008; Moureaux et al., 2008), which show aconsiderable systematic uncertainly in the flux estimates varyingfrom 10 g C m−2 y−1 to 40 g C m−2 y−1. Estimates of NEE at Gebeseein 2003 ranged from −185 g C m−2 y−1 to −245 g C m−2 y−1, basedon different assumptions in the data processing (Anthoni et al.,2004).
Especially for low fluxes, as discussed here, with low photosyn-thetic activity in the early, late or inter growing season, the fluxmeasurements at night, when turbulent mixing is insufficient are
becoming over proportional important, because they are also usedto derive daytime Reco. These data need also to be gap filled in orderto be used to calculate daily values. The error introduced by gapfilling can be estimated as follows: at daytime, maximum observederrors were ±0.20 g C m−2, and at night time the maximum was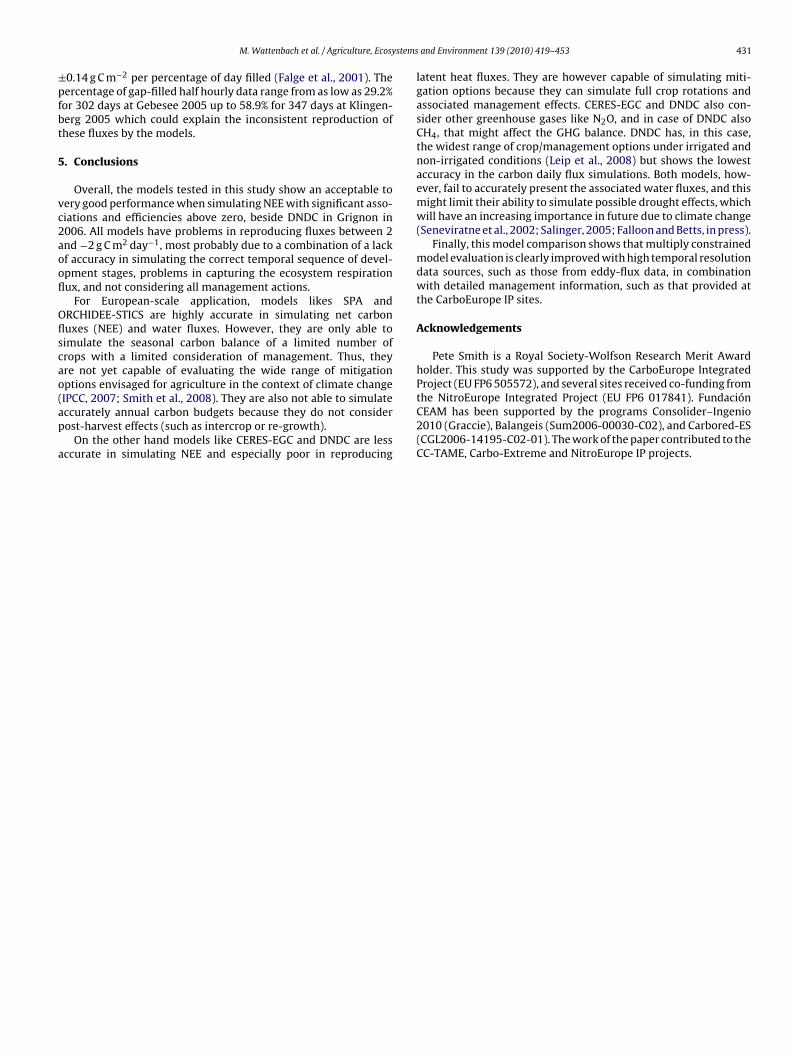
stems
±pfbt
5
vc2aoofl
Oflscao(ap
a
M. Wattenbach et al. / Agriculture, Ecosy
0.14 g C m−2 per percentage of day filled (Falge et al., 2001). Theercentage of gap-filled half hourly data range from as low as 29.2%or 302 days at Gebesee 2005 up to 58.9% for 347 days at Klingen-erg 2005 which could explain the inconsistent reproduction ofhese fluxes by the models.
. Conclusions
Overall, the models tested in this study show an acceptable toery good performance when simulating NEE with significant asso-iations and efficiencies above zero, beside DNDC in Grignon in006. All models have problems in reproducing fluxes between 2nd −2 g C m2 day−1, most probably due to a combination of a lackf accuracy in simulating the correct temporal sequence of devel-pment stages, problems in capturing the ecosystem respirationux, and not considering all management actions.
For European-scale application, models likes SPA andRCHIDEE-STICS are highly accurate in simulating net carbonuxes (NEE) and water fluxes. However, they are only able toimulate the seasonal carbon balance of a limited number ofrops with a limited consideration of management. Thus, theyre not yet capable of evaluating the wide range of mitigationptions envisaged for agriculture in the context of climate change
IPCC, 2007; Smith et al., 2008). They are also not able to simulateccurately annual carbon budgets because they do not considerost-harvest effects (such as intercrop or re-growth).On the other hand models like CERES-EGC and DNDC are lessccurate in simulating NEE and especially poor in reproducing
and Environment 139 (2010) 419–453 431
latent heat fluxes. They are however capable of simulating miti-gation options because they can simulate full crop rotations andassociated management effects. CERES-EGC and DNDC also con-sider other greenhouse gases like N2O, and in case of DNDC alsoCH4, that might affect the GHG balance. DNDC has, in this case,the widest range of crop/management options under irrigated andnon-irrigated conditions (Leip et al., 2008) but shows the lowestaccuracy in the carbon daily flux simulations. Both models, how-ever, fail to accurately present the associated water fluxes, and thismight limit their ability to simulate possible drought effects, whichwill have an increasing importance in future due to climate change(Seneviratne et al., 2002; Salinger, 2005; Falloon and Betts, in press).
Finally, this model comparison shows that multiply constrainedmodel evaluation is clearly improved with high temporal resolutiondata sources, such as those from eddy-flux data, in combinationwith detailed management information, such as that provided atthe CarboEurope IP sites.
Acknowledgements
Pete Smith is a Royal Society-Wolfson Research Merit Awardholder. This study was supported by the CarboEurope IntegratedProject (EU FP6 505572), and several sites received co-funding from
the NitroEurope Integrated Project (EU FP6 017841). FundaciónCEAM has been supported by the programs Consolider–Ingenio2010 (Graccie), Balangeis (Sum2006-00030-C02), and Carbored-ES(CGL2006-14195-C02-01). The work of the paper contributed to theCC-TAME, Carbo-Extreme and NitroEurope IP projects.
4
A
Fil
32 M. Wattenbach et al. / Agriculture, Ecosystems and Environment 139 (2010) 419–453
ppendix A
NEE meas [gC m−2]
−4 −2 0 2 4
0.45 0.54
−8 −6 −4 −2 0 2 4
−10
−5
05
0.56
−4
−2
02
4
NEE DNDC [gC m−2] 0.62 0.59
NEE ORCH. [gC m−2]
−15
−10
−5
05
0.82
−8
−6
−4
−2
02
4
NEE SPA [gC m−2]
−10 −5 0 5 −15 −10 −5 0 5
ig. A1. The scatter plots of simulated versus measured NEE for the site Oensingen, winter wheat, for the year 2007. The grey line indicates the lowess regression. The numbersn right hand site panel are Kendall correlations coefficients. The size of the number indicates the strength of the association. Noticeable is the change in the regression forow fluxes between −2 g C m2 day−1 and 2 g C m−2 day−1.
M. Wattenbach et al. / Agriculture, Ecosystems and Environment 139 (2010) 419–453 433
0 100 200 300
−60
0−
500
−40
0−
300
−20
0−
100
010
0
Day of the year 2007
NE
E [g
C m
−2]
measurements
DNDCORCHIDEESPA
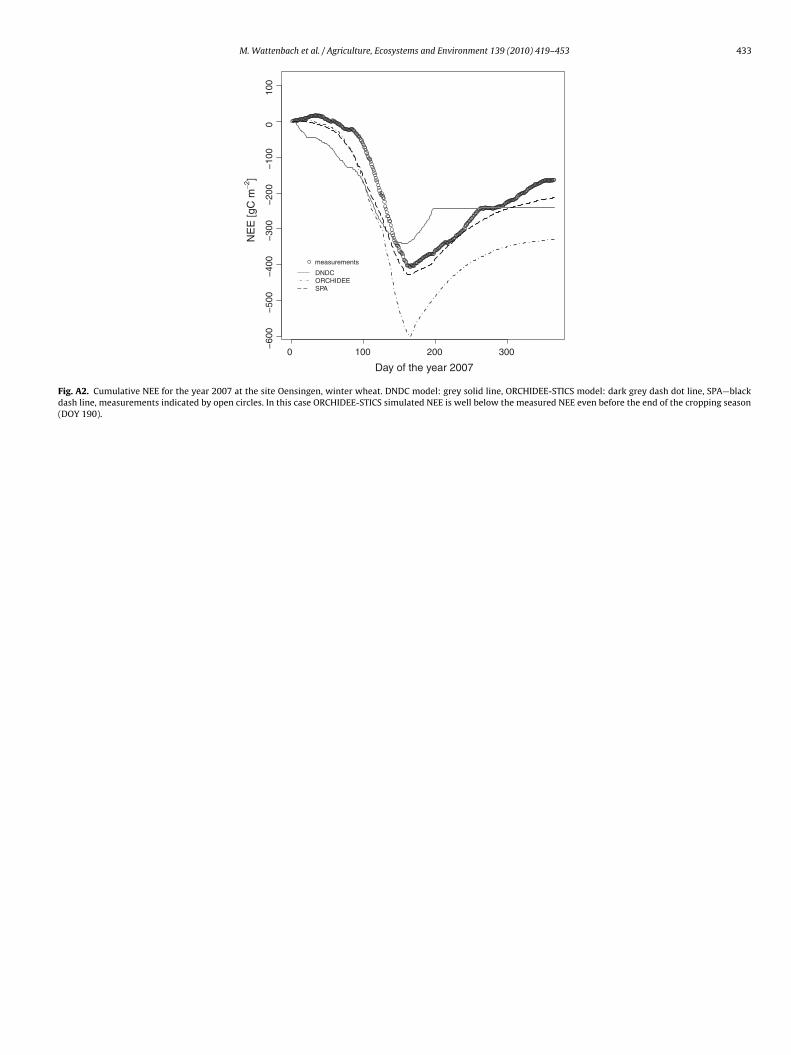
Fig. A2. Cumulative NEE for the year 2007 at the site Oensingen, winter wheat. DNDC model: grey solid line, ORCHIDEE-STICS model: dark grey dash dot line, SPA—blackdash line, measurements indicated by open circles. In this case ORCHIDEE-STICS simulated NEE is well below the measured NEE even before the end of the cropping season(DOY 190).
434 M. Wattenbach et al. / Agriculture, Ecosystems and Environment 139 (2010) 419–453
NEE meas [gC m−2]
−10 −5 0 5
0.28 0.59
−10 −5 0 5
−15
−10
−5
05
0.40
−10
−5
05
NEE DNDC [gC m−2] 0.28
NEE CERE. [gC m−2]
−15
−10
−5
0
0.50
−15 −10 −5 0 5
−10
−5
05
−15 −10 −5 0
NEE ORCH. [gC m−2]
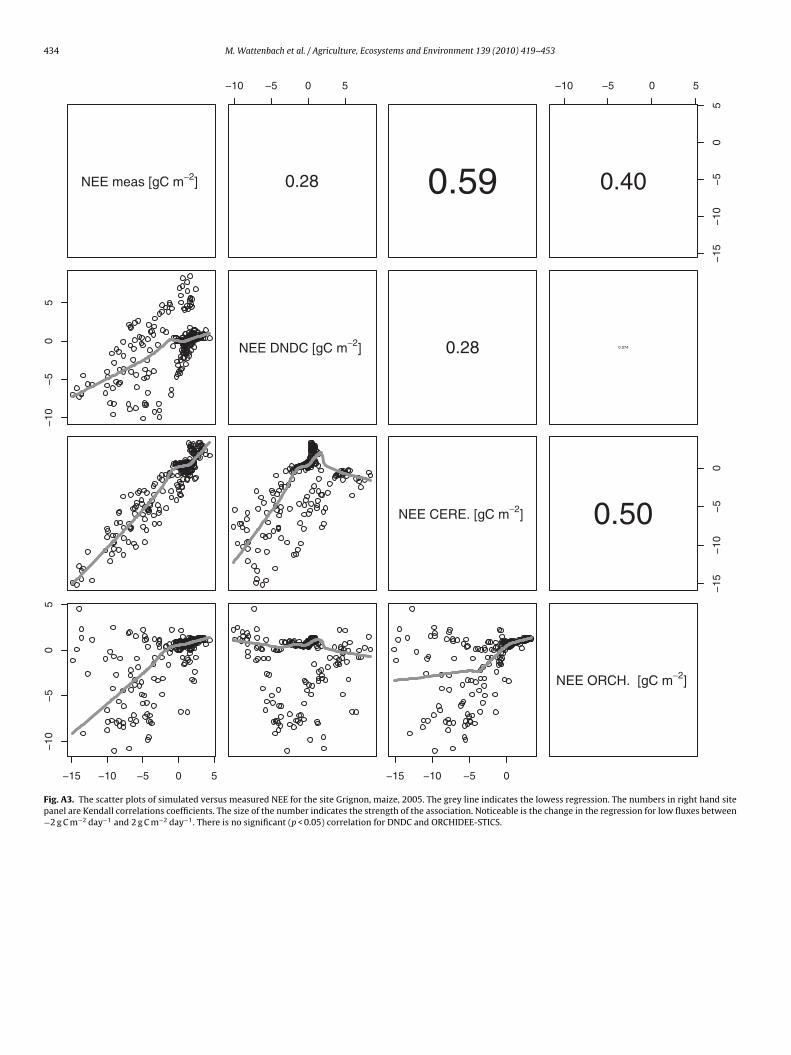
Fig. A3. The scatter plots of simulated versus measured NEE for the site Grignon, maize, 2005. The grey line indicates the lowess regression. The numbers in right hand sitepanel are Kendall correlations coefficients. The size of the number indicates the strength of the association. Noticeable is the change in the regression for low fluxes between−2 g C m−2 day−1 and 2 g C m−2 day−1. There is no significant (p < 0.05) correlation for DNDC and ORCHIDEE-STICS.

M. Wattenbach et al. / Agriculture, Ecosystems and Environment 139 (2010) 419–453 435
0 100 200 300
−50
0−
400
−30
0−
200
−10
00
100
Day of the year 2005
NE
E [g
C m
−2]
measurements
DNDCCERESORCHIDEE
Fig. A4. Cumulative NEE for the year 2005 at the site Grignon, maize. DNDC model: grey solid line, ORCHIDEE-STICS model: dark grey dash dot line, CERES-EGC—grey dots,measurements indicated by open circles. All model fail to capture the cumulative flux for the year.
436 M. Wattenbach et al. / Agriculture, Ecosystems and Environment 139 (2010) 419–453
NEE meas [gC m−2]
−5 0 5
0.32 0.60
−10 −5 0
0.72
−10
−5
0
0.71
−5
05
NEE DNDC [gC m−2] 0.35 0.32 0.30
NEE CERE. [gC m−2] 0.68
−10
−6
−2
2
0.69
−10
−5
0
NEE ORCH. [gC m−2] 0.88
−10 −5 0 −10 −6 −2 2 −8 −4 0 2 4
−8
−4
02
4
NEE SPA [gC m−2]
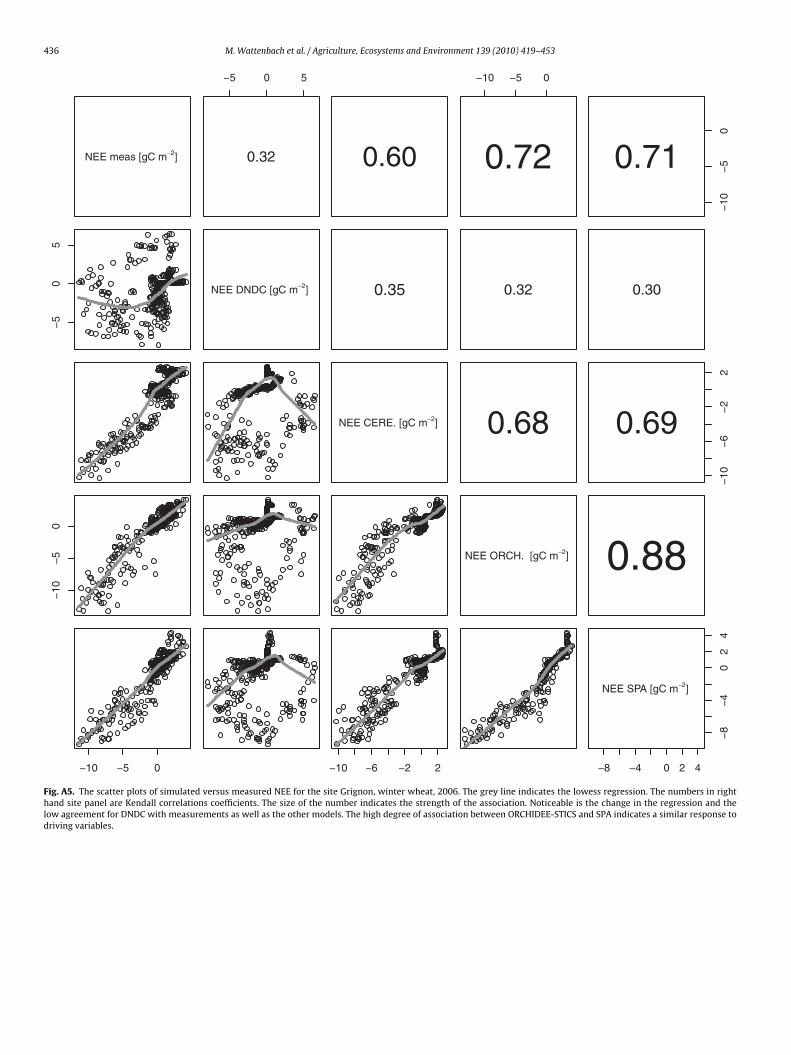
Fig. A5. The scatter plots of simulated versus measured NEE for the site Grignon, winter wheat, 2006. The grey line indicates the lowess regression. The numbers in righthand site panel are Kendall correlations coefficients. The size of the number indicates the strength of the association. Noticeable is the change in the regression and thelow agreement for DNDC with measurements as well as the other models. The high degree of association between ORCHIDEE-STICS and SPA indicates a similar response todriving variables.

M. Wattenbach et al. / Agriculture, Ecosystems and Environment 139 (2010) 419–453 437
0 100 200 300
−60
0−
500
−40
0−
300
−20
0−
100
010
0
Day of the year 2006
NE
E [g
C m
−2]
measurements
DNDCCERESORCHIDEESPA
Fig. A6. Cumulative NEE for the year 2006 at the site Grignon, winter wheat. DNDC model: grey solid line, ORCHIDEE-STICS model: dark grey dash dot line, CERES-EGC—greydots, SPA—black dash line, measurements indicated by open circles. Very pronounced in this case the missing phase alignment between DNDC simulations and observations.All models beside CERES-EGC are close to the measured cumulative NEE.
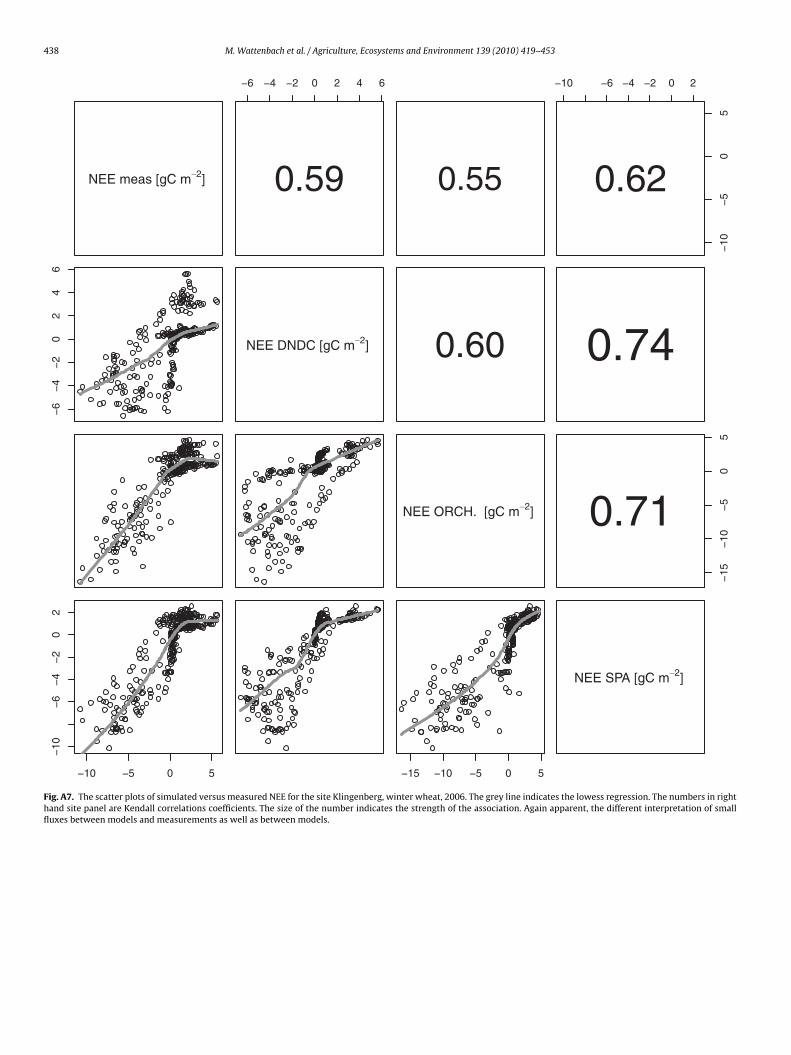
438 M. Wattenbach et al. / Agriculture, Ecosystems and Environment 139 (2010) 419–453
NEE meas [gC m−2]
−6 −4 −2 0 2 4 6
0.59 0.55
−10 −6 −4 −2 0 2
−10
−5
05
0.62
−6
−4
−2
02
46
NEE DNDC [gC m−2] 0.60 0.74
NEE ORCH. [gC m−2]
−15
−10
−5
05
0.71
−10 −5 0 5
−10
−6
−4
−2
02
−15 −10 −5 0 5
NEE SPA [gC m−2]
Fig. A7. The scatter plots of simulated versus measured NEE for the site Klingenberg, winter wheat, 2006. The grey line indicates the lowess regression. The numbers in righthand site panel are Kendall correlations coefficients. The size of the number indicates the strength of the association. Again apparent, the different interpretation of smallfluxes between models and measurements as well as between models.

M. Wattenbach et al. / Agriculture, Ecosystems and Environment 139 (2010) 419–453 439
0 100 200 300
−60
0−
400
−20
00
Day of the year 2006
NE
E [g
C m
−2]
measurements
DNDCORCHIDEESPA
Fig. A8. Cumulative NEE for the year 2006 at the site Klingenberg, winter wheat. DNDC model: grey solid line, ORCHIDEE-STICS model: dark grey dash dot line, SPA—blackdash line, measurements indicated by open circles. Here DNDC captures again the cumulative flux better than the two other models.
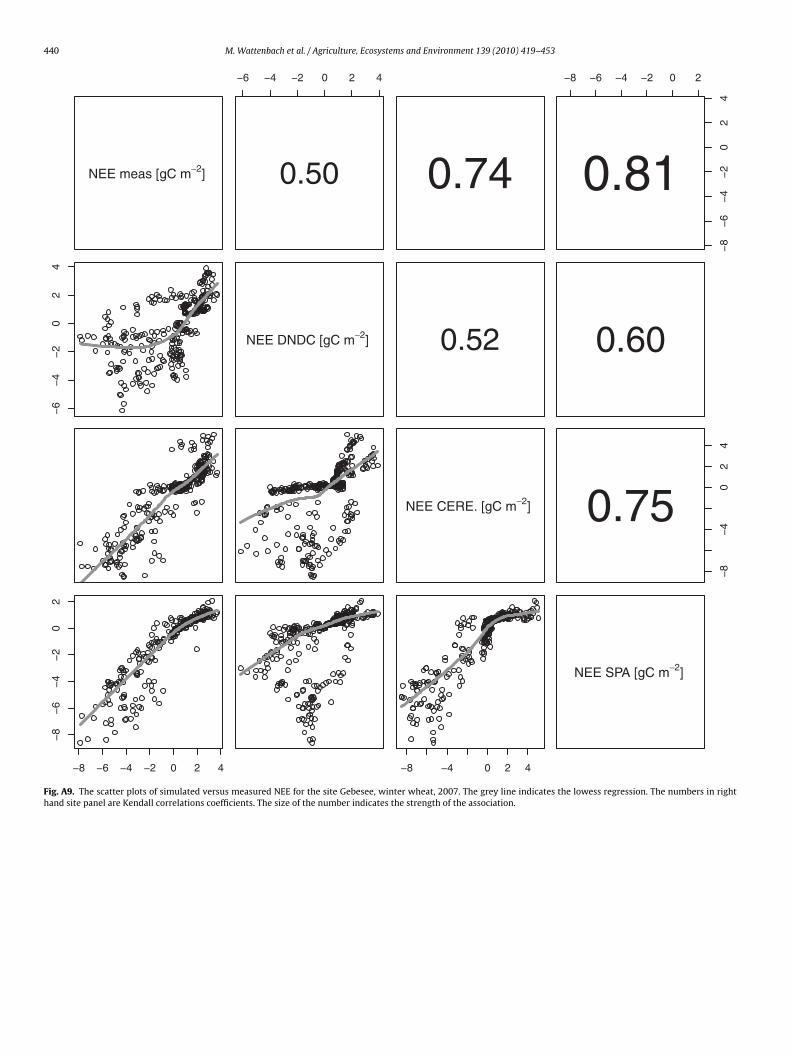
440 M. Wattenbach et al. / Agriculture, Ecosystems and Environment 139 (2010) 419–453
NEE meas [gC m−2]
−6 −4 −2 0 2 4
0.50 0.74
−8 −6 −4 −2 0 2
−8
−6
−4
−2
02
4
0.81
−6
−4
−2
02
4
NEE DNDC [gC m−2] 0.52 0.60
NEE CERE. [gC m−2]
−8
−4
02
4
0.75
−8 −6 −4 −2 0 2 4
−8
−6
−4
−2
02
−8 −4 0 2 4
NEE SPA [gC m−2]
Fig. A9. The scatter plots of simulated versus measured NEE for the site Gebesee, winter wheat, 2007. The grey line indicates the lowess regression. The numbers in righthand site panel are Kendall correlations coefficients. The size of the number indicates the strength of the association.

M. Wattenbach et al. / Agriculture, Ecosystems and Environment 139 (2010) 419–453 441
0 100 200 300
−60
0−
500
−40
0−
300
−20
0−
100
010
0
Day of the year 2007
NE
E [g
C m
−2]
measurements
DNDCCERESSPA
Fig. A10. Cumulative NEE for the year 2007 at the site Gebesee, winter wheat. DNDC model: grey solid line, CERES-EGC—grey dots, SPA—black dash line, measurementsindicated by open circles. The DNDC model is again able to capture the cumulative flux even so it shows a strong temporal misalignment.

442 M. Wattenbach et al. / Agriculture, Ecosystems and Environment 139 (2010) 419–453
Reco meas [gC m−2]
0 2 4 6 8 10 12
0.50 0.66
0 2 4 6 8
02
46
810
1214
0.64
02
46
810
12
Reco DNDC [gC m−2] 0.60 0.50
Reco ORCH. [gC m−2]
02
46
8
0.79
0 2 4 6 8 10 14
02
46
8
0 2 4 6 8
Reco SPA [gC m−2]
Fig. A11. The scatter plots of simulated versus measured Reco for the Oensingen, winter wheat, for the year 2007. The grey line indicates the lowess regression. The numbersin right hand site panel are Kendall correlations coefficients. The size of the number indicates the strength of the association. We observe a strong mismatch for the lowfluxes especially for DNDC but also for the other models indicated by the change in the lowess fit function.
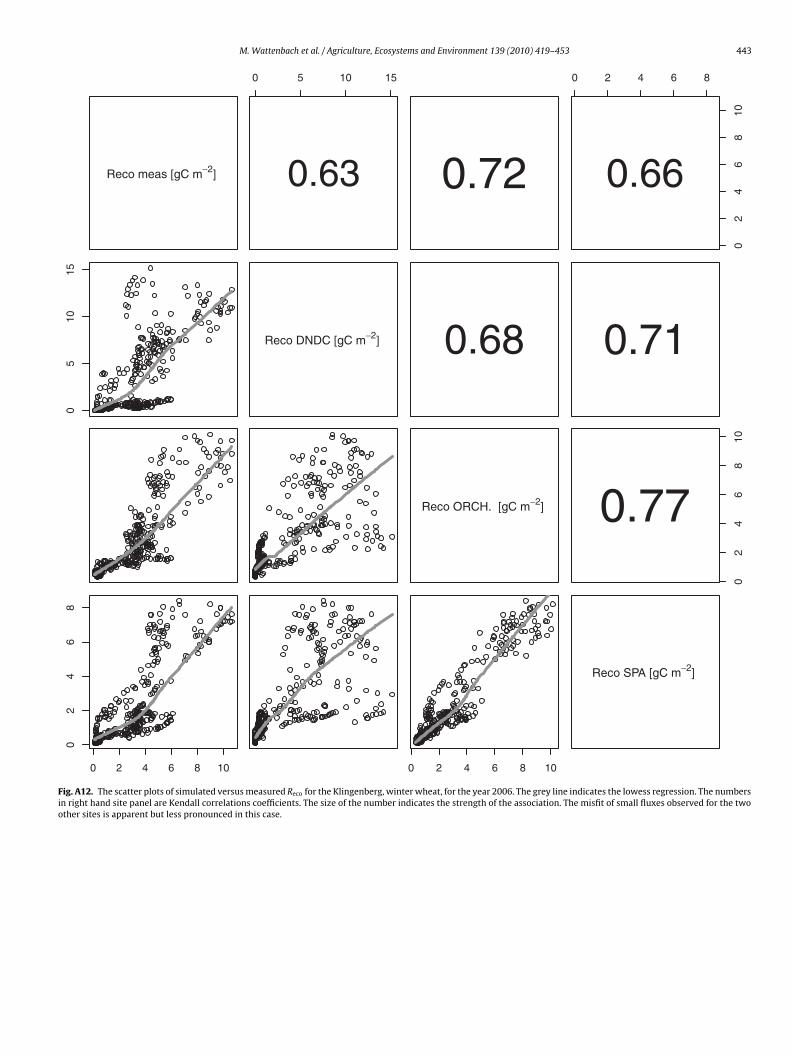
M. Wattenbach et al. / Agriculture, Ecosystems and Environment 139 (2010) 419–453 443
Reco meas [gC m−2]
0 5 10 15
0.63 0.72
0 2 4 6 8
02
46
810
0.66
05
1015
Reco DNDC [gC m−2] 0.68 0.71
Reco ORCH. [gC m−2]
02
46
810
0.77
0 2 4 6 8 10
02
46
8
0 2 4 6 8 10
Reco SPA [gC m−2]
Fig. A12. The scatter plots of simulated versus measured Reco for the Klingenberg, winter wheat, for the year 2006. The grey line indicates the lowess regression. The numbersin right hand site panel are Kendall correlations coefficients. The size of the number indicates the strength of the association. The misfit of small fluxes observed for the twoother sites is apparent but less pronounced in this case.
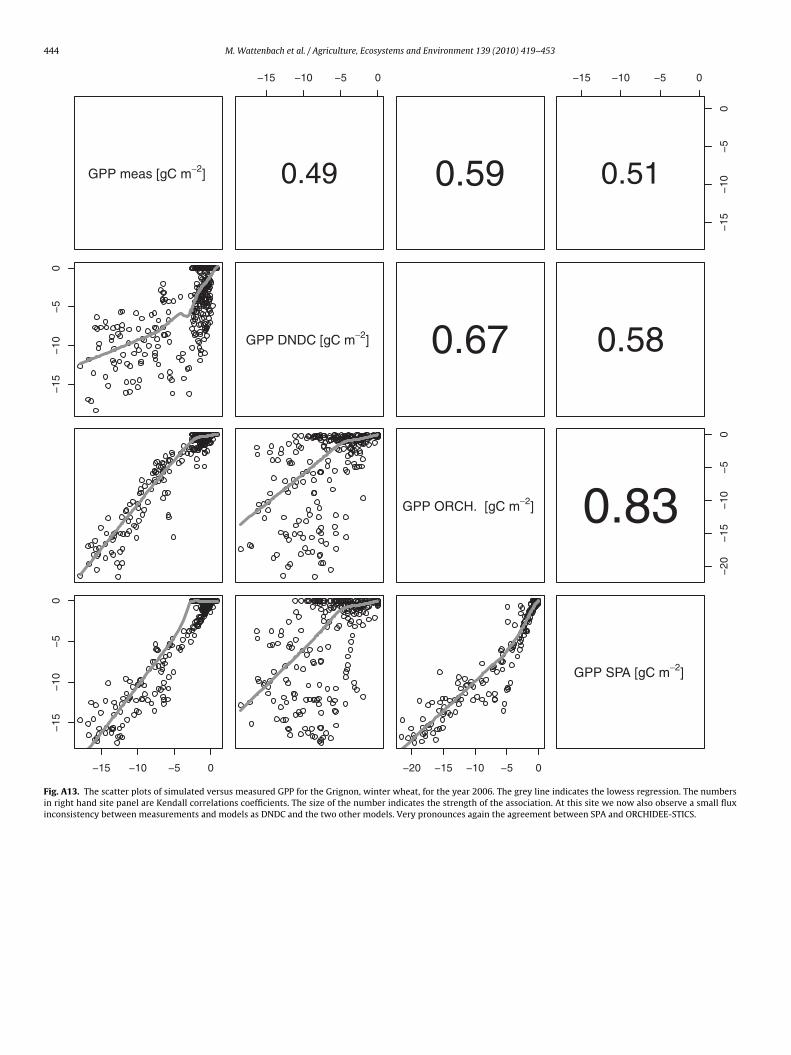
444 M. Wattenbach et al. / Agriculture, Ecosystems and Environment 139 (2010) 419–453
GPP meas [gC m−2]
−15 −10 −5 0
0.49 0.59
−15 −10 −5 0
−15
−10
−5
0
0.51
−15
−10
−5
0
GPP DNDC [gC m−2] 0.67 0.58
GPP ORCH. [gC m−2]
−20
−15
−10
−5
0
0.83
−15 −10 −5 0
−15
−10
−5
0
−20 −15 −10 −5 0
GPP SPA [gC m−2]
Fig. A13. The scatter plots of simulated versus measured GPP for the Grignon, winter wheat, for the year 2006. The grey line indicates the lowess regression. The numbersin right hand site panel are Kendall correlations coefficients. The size of the number indicates the strength of the association. At this site we now also observe a small fluxinconsistency between measurements and models as DNDC and the two other models. Very pronounces again the agreement between SPA and ORCHIDEE-STICS.

M. Wattenbach et al. / Agriculture, Ecosystems and Environment 139 (2010) 419–453 445
GPP meas [gC m−2]
−15 −10 −5 0
0.59 0.46
−15 −10 −5 0
−15
−10
−5
0
0.45
−15
−10
−5
0
GPP DNDC [gC m−2] 0.51 0.66
GPP ORCH. [gC m−2]
−25
−20
−15
−10
−5
0
0.63
−15 −10 −5 0
−15
−10
−5
0
−25 −15 −5 0
GPP SPA [gC m−2]
Fig. A14. The scatter plots of simulated versus measured GPP for the Klingenberg, winter wheat, for the year 2006. The grey line indicates the lowess regression. The numbersin right hand site panel are Kendall correlations coefficients. The size of the number indicates the strength of the association. The models exhibit a similar behaviour as wesaw in the other plots with an overall moderate to good agreement.
446 M. Wattenbach et al. / Agriculture, Ecosystems and Environment 139 (2010) 419–453
ETa meas [mm]
0 1 2 3 4 5
0.41 0.68
0 1 2 3 4 5
01
23
45
6
0.65
01
23
45
ETa DNDC [mm] 0.39 0.39
ETa ORCH. [mm]
01
23
4
0.70
0 1 2 3 4 5 6
01
23
45
0 1 2 3 4
ETa SPA [mm]
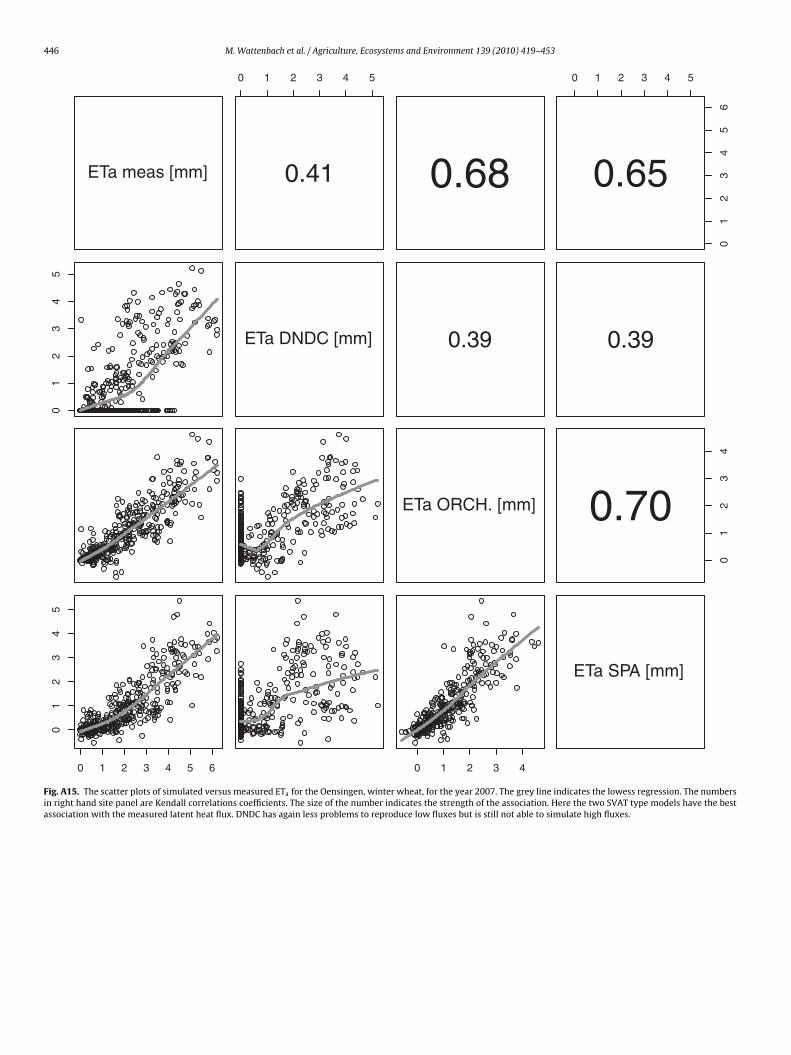
Fig. A15. The scatter plots of simulated versus measured ETa for the Oensingen, winter wheat, for the year 2007. The grey line indicates the lowess regression. The numbersin right hand site panel are Kendall correlations coefficients. The size of the number indicates the strength of the association. Here the two SVAT type models have the bestassociation with the measured latent heat flux. DNDC has again less problems to reproduce low fluxes but is still not able to simulate high fluxes.
M. Wattenbach et al. / Agriculture, Ecosystems and Environment 139 (2010) 419–453 447
ETa meas [mm]
0 1 2 3 4 5
0.40 0.37
0.0 1.0 2.0 3.0
01
23
45
6
0.57
01
23
45
ETa DNDC [mm] 0.18 0.30
ETa CERE. [mm]
0.0
1.0
2.0
3.0
0.21
0 1 2 3 4 5 6
0.0
1.0
2.0
3.0
0.0 1.0 2.0 3.0
ETa ORCH. [mm]
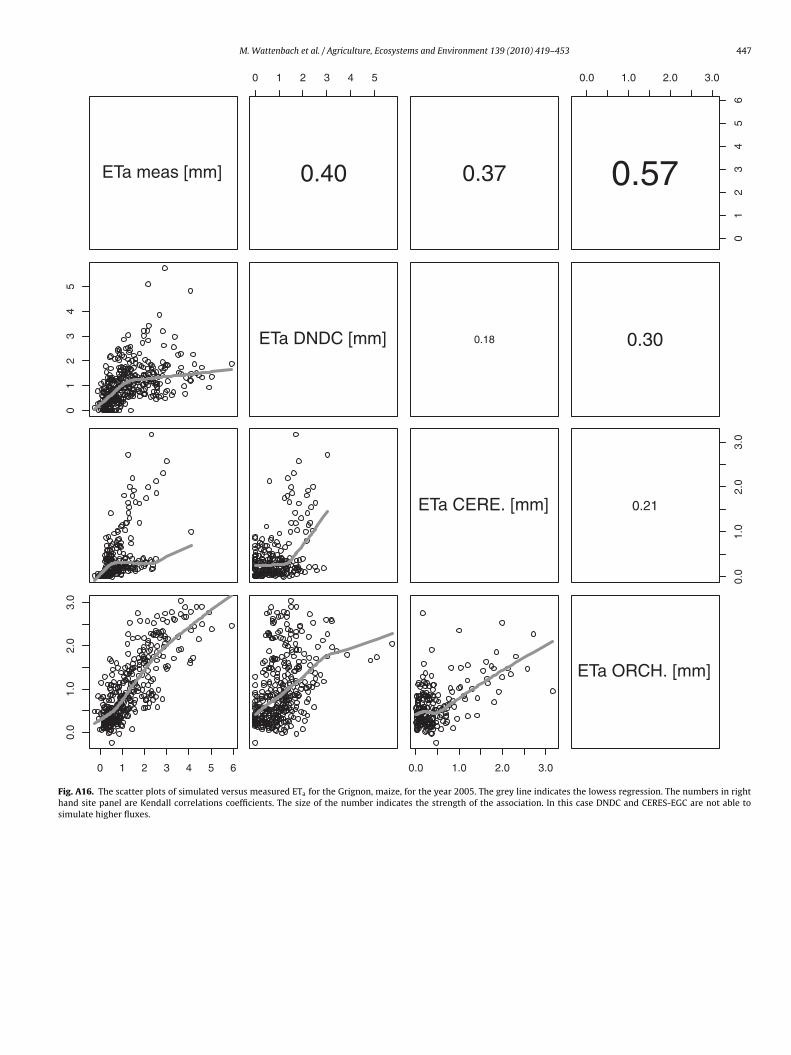
Fig. A16. The scatter plots of simulated versus measured ETa for the Grignon, maize, for the year 2005. The grey line indicates the lowess regression. The numbers in righthand site panel are Kendall correlations coefficients. The size of the number indicates the strength of the association. In this case DNDC and CERES-EGC are not able tosimulate higher fluxes.

448 M. Wattenbach et al. / Agriculture, Ecosystems and Environment 139 (2010) 419–453
ETa meas [mm]
0 1 2 3 4
0.43 0.46
0 1 2 3 4
0.60
01
23
4
0.68
01
23
4
ETa DNDC [mm] 0.38 0.47 0.42
ETa CERE. [mm] 0.46
01
23
45
0.41
01
23
4
ETa ORCH. [mm] 0.65
0 1 2 3 4 0 1 2 3 4 5 0 1 2 3 4 5
01
23
45
ETa SPA [mm]
Fig. A17. The scatter plots of simulated versus measured ETa for the Aurade site, winter wheat, for the year 2006. The grey line indicates the lowess regression. The numbersin right hand site panel are Kendall correlations coefficients. The size of the number indicates the strength of the association. Apparent again, a lack of fit for DNDC for higherflux rates.

M. Wattenbach et al. / Agriculture, Ecosystems and Environment 139 (2010) 419–453 449
ETa meas [mm]
0 1 2 3 4 5
0.48 0.38
0 1 2 3 4
01
23
4
0.66
01
23
45
ETa DNDC [mm] 0.47 0.49
ETa CERE. [mm]
01
23
45
0.34
0 1 2 3 4
01
23
4
0 1 2 3 4 5
ETa SPA [mm]
Fig. A18. The scatter plots of simulated versus measured ETa for the Gebesee site, winter wheat, for the year 2007. The grey line indicates the lowess regression. The numbersin right hand site panel are Kendall correlations coefficients. The size of the number indicates the strength of the association. We observe the same pattern again, CERES-EGCand DNDC fail to simulate the higher flux rates.

450 M. Wattenbach et al. / Agriculture, Ecosystems and Environment 139 (2010) 419–453
ETa meas [mm]
0 1 2 3 4
0.58 0.54
0 1 2 3 4
01
23
4
0.68
01
23
4
ETa DNDC [mm] 0.47 0.52
ETa ORCH. [mm]
01
23
45
6
0.57
0 1 2 3 4
01
23
4
0 1 2 3 4 5 6
ETa SPA [mm]
Fig. A19. The scatter plots of simulated versus measured ETa for the site in Klingenberg, winter wheat, for the year 2006. The grey line indicates the lowess regression. Thesize of the number indicates the strength of the association.

stems
R
A
A
A
A
A
A
B
B
B
B
B
B
B
B
B
B
B
C
C
C
C
D
D
D
D
F
F
M. Wattenbach et al. / Agriculture, Ecosy
eferences
bdalla, M., Wattenbach, M., Smith, P., Ambus, P., Jones, M., Williams, M., 2009.Application of the DNDC model to predict emissions of N2O from Irish agricul-ture. Geoderma 151, 327–337.
ber, J.D., Federer, C.A., 1992. A generalized, lumped-parameter model of photosyn-thesis, evapotranspiration and net primary production in temperate and borealforest ecosystems. Oecologia 92, 463–474.
diku, S.G.K., Reichstein, M., Lohila, A., Dinh, N.Q., Aurela, M., Laurila, T., Lueers,J., Tenhunen, J.D., 2006. PIXGRO: a model for simulating the ecosystemCO2 exchange and growth of spring barley. Ecological Modelling 190, 260–276.
matya, D.M., Skaggs, R.W., Gregory, J.D., 1995. Comparison of methods for estimat-ing REF-ET. Journal of Irrigation and Drainage Engineering 121, 427–435.
nthoni, P.M., Freibauer, A., Kolle, O., Schulze, E.D., 2004. Winter wheat carbonexchange in Thuringia, Germany. Agricultural and Forest Meteorology 121,55–67.
ubinet, M., 2008. Eddy covariance CO2 flux measurements in nocturnal conditions:an analysis of the problem. Ecological Applications 18, 1368–1378.
aldocchi, D., Valentini, R., Running, S., Oechel, W., Dahlman, R., 1996. Strategies formeasuring and modelling carbon dioxide and water vapour fluxes over terres-trial ecosystems. Global Change Biology 2, 159–168.
aldocchi, D.D., 2003. Assessing the eddy covariance technique for evaluating carbondioxide exchange rates of ecosystems: past, present and future. Global ChangeBiology 9, 479–492.
eer, C., Reichstein, M., Ciais, P., Farquhar, G.D., Papale, D., 2007. Mean annual GPPof Europe derived from its water balance. Geophysical Research Letters, 34.
est, D.J., Gipps, P.G., 1974. An improved gamma approximation to the negativebinomial. Technometrics 16, 621–624.
lack, T.A., Den Hartog, G., Neumann, H.H., Blanken, P.D., Yang, P.C., Russell, C., Nesic,Z., Lee, X., Chen, S.G., Staebler, R., Novak, M.D., 1996. Annual cycles of watervapour and carbon dioxide fluxes in and above a boreal aspen forest. GlobalChange Biology 2, 219–229.
ondeau, A., Smith, P.C., Zaehle, S., Schaphoff, S., Lucht, W., Cramer, W., Gerten,D., Lotze-campen, H., Mueller, C., Reichstein, M., Smith, B., 2007. Modelling therole of agriculture for the 20th century global terrestrial carbon balance. GlobalChange Biology 13, 679–706.
osch, J.M., Hewlett, J.D., 1982. A review of catchment experiments to determinethe effect of vegetation changes on water yield and evapotranspiration. Journalof Hydrology 55, 3–23.
risson, N., Gary, C., Justes, E., Roche, R., Mary, B., Ripoche, D., Zimmer, D., Sierra,J., Bertuzzi, P., Burger, P., Bussière, F., Cabidoche, Y.M., Cellier, P., Debaeke, P.,Gaudillère, J.P., Hénault, C., Maraux, F., Seguin, B., Sinoquet, H., 2003. An overviewof the crop model STICS. European Journal of Agronomy 18, 309–332.
risson, N., Mary, B., Ripoche, D., Jeuffroy, M.H., Ruget, F., Nicoullaud, B., Gate, P.,Devienne-Barret, F., Antonioletti, R., Durr, C., Richard, G., Beaudoin, N., Recous,S., Tayot, X., Plenet, D., Cellier, P., Machet, J.M., Meynard, J.M., Delécolle, R., 1998.STICS: a generic model for the simulation of crops and their water and nitrogenbalances. I. Theory and parameterization applied to wheat and corn. Agronomie18, 311–346.
risson, N., Ruget, F., Gate, P., Lorgeou, J., Nicoullaud, B., Tayot, X., Plenet, D., Jeuffroy,M.H., Bouthier, A., Ripoche, D., Mary, B., Justes, E., 2002. STICS: a generic modelfor simulating crops and their water and nitrogen balances. II. Model validationfor wheat and maize. Agronomie 22, 69–92.
rown, L., Syed, B., Jarvis, S.C., Sneath, R.W., Phillips, V.R., Goulding, K.W.T., Li, C.,2002. Development and application of a mechanistic model to estimate emissionof nitrous oxide from UK agriculture. Atmospheric Environment 36, 917–928.
iais, P., Wattenbach, M., Vuichard, N., Smith, P., Piao, S.L., Don, A., Luyssaert, S.,Janssens, I.A., Bondeau, A., Dechow, R., Leip, A., Smith, P., Beer, C., Van Der Werf,G.R., Gervois, S., Van Oost, K., Tomelleri, E., Freibauer, A., Schulze, E.D., 2009. Car-boeurope Synthesis, T., The European carbon balance. Part 2: croplands. GlobalChange Biology 16, 1409–1428.
leveland, W.S., 1979. Robust locally weighted regression and smoothing scatter-plots. Journal of the American Statistical Association 74, 829–836.
leveland, W.S., 1981. LOWESS: a program for smoothing scatterplots by robustlocally weighted regression. The American Statistician 35, 54.
order, G.W., Foreman, D.I., 2009. Nonparametric Statistics for Non-statisticians: AStep-by-step Approach. John Wiley and Sons.
avid, M.B., Del Grosso, S.J., Hu, X., Marshall, E.P., McIsaac, G.F., Parton, W.J., Tonitto,C., Youssef, M.A., 2009. Modeling denitrification in a tile-drained, corn and soy-bean agroecosystem of Illinois, USA. Biogeochemistry 93, 7–30.
avidson, E.A., Janssens, I.A., Lou, Y., 2006. On the variability of respiration in ter-restrial ecosystems: moving beyond Q10. Global Change Biology 12, 154–164.
e Noblet-Ducoudré, N., Gervois, S., Ciais, P., Viovy, N., Brisson, N., Seguin, B., Perrier,A., 2004. Coupling the soil-vegetation-atmosphere-transfer scheme ORCHIDEEto the agronomy model STICS to study the influence of croplands on the Euro-pean carbon and water budgets. Agronomie 24, 397–407.
ietiker, D., Buchmann, N., Eugster, W., 2010. Testing the ability of the DNDC modelto predict CO2 and water vapour fluxes of a Swiss cropland site. Agriculture,Ecosystems and Environment, 139, 396–401.
alge, E., Baldocchi, D., Olson, R., Anthoni, P., Aubinet, M., Bernhofer, C., Burba, G.,Ceulemans, R., Clement, R., Dolman, H., 2001. Gap filling strategies for defensibleannual sums of net ecosystem exchange. Agricultural and Forest Meteorology107, 43–69.
alge, E., Reth, S., Brüggemann, N., Butterbach-Bahl, K., Goldberg, V., Oltchev, A.,Schaaf, S., Spindler, G., Stiller, B., Queck, R., Köstner, B., Bernhofer, C., 2005. Com-
and Environment 139 (2010) 419–453 451
parison of surface energy exchange models with eddy flux data in forest andgrassland ecosystems of Germany. Ecological Modelling 188, 174–216.
Falloon, P., Betts, R., 2009. Climate impacts on European agriculture and water man-agement in the context of adaptation and mitigation—the importance of anintegrated approach. Science of the Total Environment, in press.
Farley, K.A., Jobbagy, E.G., Jackson, R.B., 2005. Effects of afforestation on wateryield: a global synthesis with implications for policy. Global Change Biology11, 1565–1576.
Farquhar, G.D., Von Caemmerer, S., Berry, J.A., 1980. A biochemical model of photo-synthetic CO2 assimilation in leaves of C3 species. Planta 149, 78–90.
Frolking, S.E., Mosier, A.R., Ojima, D.S., Li, C., Parton, W.J., Potter, C.S., Priesack, E.,Stenger, R., Haberbosch, C., Dörsch, P., Flessa, H., Smith, K.A., 1998. Comparisonof N2O emissions from soils at three temperate agricultural sites: Simulations ofyear-round measurements by four models. Nutrient Cycling in Agroecosystems52, 77–105.
Gabrielle, B., Laville, P., Duval, O., Nicoullaud, B., Germon, J.C., Hénault, C., 2006.Process-based modeling of nitrous oxide emissions from wheat-cropped soilsat the subregional scale. Global Biogeochemical Cycles, 20.
Gervois, S., Ciais, P., de Noblet-Ducoudré, N., Brisson, N., Vuichard, N., Viovy, N., 2008.Carbon and water balance of European croplands throughout the 20th century.Global Biogeochemical Cycles, 22.
Grant, R.F., Arkebauer, T.J., Dobermann, A., Hubbard, K.G., Schimelfenig, T.T., Suyker,A.E., Verma, S.B., Walters, D.T., 2007. Net biome productivity of irrigated andrainfed maize-soybean rotations: Modeling vs. measurements. Agronomy Jour-nal 99, 1404–1423.
Halley, R.J., Soffe, R.J., 1988. The Agricultural Notebook. Blackwell Scientific Publica-tions, Oxford.
Hollander, M., Wolfe, D.A., 1973. Nonparametric Statistical Methods. Wiley, NewYork.
Hollinger, D.Y., Richardson, A.D., 2005. Uncertainty in eddy covariance measure-ments and its application to physiological models. Tree Physiology 25, 873–885.
Huang, Y., Yu, Y., Zhang, W., Sun, W., Liu, S., Jiang, J., Wu, J., Yu, W., Wang, Y., Yang,Z., 2009. Agro-C: a biogeophysical model for simulating the carbon budget ofagroecosystems. Agricultural and Forest Meteorology 149, 106–129.
IPCC (Ed), 2007. Mitigation of Climate Change—Contribution of Working Group I tothe Fourth Assessment Report of the IPCC. Cambridge University Press, Cam-bridge, New York.
Janssens, I.A., Freibauer, A., Ciais, P., Smith, P., Nabuurs, G.J., Folberth, G., Schla-madinger, B., Hutjes, R., Ceulemans, R., Schulze, E.D., Valentini, R., Dolman, A.J.,2003. Europe’s terrestrial biosphere absorbs 7 to 12% of European anthropogenicCO2 emissions. Science 300, 1538–1542.
Janssens, I.A., Freibauer, A., Schlamadinger, B., Ceulemans, R., Ciais, P., Dolman, A.J.,Heimann, M., Nabuurs, G.J., Smith, P., Valentini, R., Schulze, E.D., 2005. The car-bon budget of terrestrial ecosystems at country-scale—a European case study.Biogeosciences 2, 15–26.
Jones, C.A., Kiniry, J.R., 1986. CERES-Maize: A Simulation Model of Maize Growthand Development. Texas A&M University Press, Temple, TX.
Juskiw, P.E., Jame, Y.-W., Kryzanowski, L., 2001. Phenological development of springbarley in a short-season growing area. Agronomy Journal 93, 370–379.
Kätterer, T., Eckersten, H., Andrén, O., Pettersson, R., 1997. Winter wheat biomass andnitrogen dynamics under different fertilization and water regimes: applicationof a crop growth model. Ecological Modelling 102, 301–314.
Klein Tank, A.M.G., Wijngaard, J.B., Können, G.P., Böhm, R., Demarée, G., Gocheva, A.,Mileta, M., Pashiardis, S., Hejkrlik, L., Kern-Hansen, C., Heino, R., Bessemoulin,P., Müller-Westermeier, G., Tzanakou, M., Szalai, S., Pálsdóttir, T., Fitzgerald,D., Rubin, S., Capaldo, M., Maugeri, M., Leitass, A., Bukantis, A., Aberfeld, R.,Van Engelen, A.F.V., Forland, E., Mietus, M., Coelho, F., Mares, C., Razuvaev,V., Nieplova, E., Cegnar, T., Antonio López, J., Dahlström, B., Moberg, A., Kirch-hofer, W., Ceylan, A., Pachaliuk, O., Alexander, L.V., Petrovic, P., 2002. Dailydataset of 20th-century surface air temperature and precipitation series for theEuropean Climate Assessment. International Journal of Climatology 22, 1441–1453.
Kramer, K., Leinonen, I., Bartelink, H.H., Berbigier, P., Borghetti, M., Bernhofer, C.,Cienciala, E., Dolman, A.J., Froer, O., Gracia, C.A., Granier, A., Grünwald, T., Hari,P., Jans, W., Kellomäki, S., Loustau, D., Magnani, F., Markkanen, T., Matteucci, G.,Mohren, G.M.J., Moors, E., Nissinen, A., Peltola, H., Sabate, S., Sanchez, A., Sontag,M., Valentini, R., Vesala, T., 2002. Evaluation of six process-based forest growthmodels using eddy-covariance measurements of CO2 and H2O fluxes at six forestsites in Europe. Global Change Biology 8, 213–230.
Krinner, G., Viovy, N., de Noblet-Ducoudré, N., Ogée, J., Polcher, J., Friedlingstein,P., Ciais, P., Sitch, S., Prentice, I.C., 2005. A dynamic global vegetation model forstudies of the coupled atmosphere-biosphere system. Global BiogeochemicalCycles 19, 1–33.
Kutsch, W.L., Aubinet, M., Buchmann, N., Smith, P., Osborne, B., Eugster, W., Watten-bach M., Schulze E.D., Tormellieri E., Ceschia, E., Bernhofer C., Béziat, P., Carrara,A., Di Tommasi, P., Grünwald, T., Jones, M., Magliulo, V., Marloie, O., Olioso, A.,Sanz, M.J., Saunders, M., Søgaard, H., Ziegler, W., 2010. The net biome productionof full crop rotations in Europe. Agriculture, Ecosystem and Environment, 139,336–345.
Lasslop, G., Reichstein, M., Kattge, J., Papale, D., 2008. Influences of observation errors
in eddy flux data on inverse model parameter estimation. Biogeosciences 5,1311–1324.Law, B.E., Williams, M., Anthoni, P.M., Baldocchi, D.D., Unsworth, M.H., 2000. Mea-suring and modelling seasonal variation of carbon dioxide and water vapourexchange of a Pinus ponderosa forest subject to soil water deficit. Global ChangeBiology 6, 613–630.

4 stems
L
L
L
L
L
L
L
L
L
L
M
M
M
M
M
M
M
M
M
N
O
P
P
P
P
P
Q
R
52 M. Wattenbach et al. / Agriculture, Ecosy
ehuger, S., Gabrielle, B., Larmanou, E., Laville, P., Cellier, P., Loubet, B., 2007.Predicting the global warming potential of agro-ecosystems. BiogeosciencesDiscussions 4, 1059–1092.
ehuger, S., Gabrielle, B., Oijen, M.V., Makowski, D., Germon, J.C., Morvan, T., Henault,C., 2009. Bayesian calibration of the nitrous oxide emission module of an agro-ecosystem model. Agriculture, Ecosystems and Environment.
eip, A., Marchi, G., Koeble, R., Kempen, M., Britz, W., Li, C., 2008. Linking an economicmodel for European agriculture with a mechanistic model to estimate nitrogenand carbon losses from arable soils in Europe. Biogeosciences 5, 73–94.
i, C., Farahbakhshazad, N., Jaynes, D.B., Dinnes, D.L., Salas, W., McLaughlin, D., 2006.Modeling nitrate leaching with a biogeochemical model modified based onobservations in a row-crop field in Iowa. Ecological Modelling 196, 116–130.
i, C., Frolking, S., Crocker, G.J., Grace, P.R., Klir, J., Koerchens, M., Poulton, P.R., 1997.Simulating trends in soil organic carbon in long-term experiments using theDNDC model. Geoderma 81, 45–60.
i, C., Frolking, S., Frolking, T.A., 1992. A model of nitrous oxide evolution from soildriven by rainfall events: 1. Model structure and sensitivity. Journal of Geophys-ical Research 97, 9759–9776.
i, C., Frolking, S., Xiao, X., Moore III, B., Boles, S., Qiu, J., Huang, Y., Salas, W., Sass, R.,2005. Modelling impacts of farming management alternatives on CO2, CH4 andN2O emissions: a case study for water management of rice agriculture of China.Global Biogeochemical Cycles 19, 1–10.
i, C., Frolking, S.E., Harriss, R.C., Terry, R.E., 1994. Modeling nitrous oxide emissionsfrom agriculture: a Florida case study. Chemosphere 28, 1401–1415.
ohila, A., Aurela, M., Regina, K., Laurila, T., 2003. Soil and total ecosystem respirationin agricultural fields: effect of soil and crop type. Plant and Soil 251, 303–317.
ópez, M.V., Arrúe, J.L., 1997. Growth, yield and water use efficiency of winter barleyin response to conservation tillage in a semi-arid region of Spain. Soil and TillageResearch 44, 35–54.
cMaster, G.S., Wilhelm, W.W., 2003. Phenological responses of wheat and bar-ley to water and temperature: improving simulation models. The Journal ofAgricultural Science 141, 129–147.
cKenney, M.S., Rosenberg, N.J., 1993. Sensitivity of some potential evapotranspira-tion estimation methods to climate change. Agricultural and Forest Meteorology64, 81–110.
offat, A.M., Papale, D., Reichstein, M., Hollinger, D.Y., Richardson, A.D., Barr,A.G., Beckstein, C., Braswell, B.H., Churkina, G., Desai, A.R., Falge, E., Gove, J.H.,Heimann, M., Hui, D., Jarvis, A.J., Kattge, J., Noormets, A., Stauch, V.J., 2007. Com-prehensive comparison of gap-filling techniques for eddy covariance net carbonfluxes. Agricultural and Forest Meteorology 147, 209–232.
oncrieff, J.B., Massheder, J.M., De Bruin, H., Elbers, J., Friborg, T., Heusinkveld, B.,Kabat, P., Scott, S., Soegaard, H., Verhoef, A., 1997. A system to measure surfacefluxes of momentum, sensible heat, water vapour and carbon dioxide. Journalof Hydrology 188–189, 589–611.
onteith, J.L., 1965. Evaporation and environment. In: Fogg, G.E. (Ed.), The State andMovement of Water in Living Organisms. Academic Press, London, pp. 205–234.
onteith, J.L., 1977. Climate and the efficiency of crop production in Britian.Philosophical Transactions of Research Society London Series B 281, 277–329.
orales, P., Sykes, M.T., Prentice, I.C., Smith, P., Smith, B., Bugmann, H., Zierl, B.,Friedlingstein, P., Viovy, N., Sabaté, S., Sánchez, A., Pla, E., Gracia, C.A., Sitch, S.,Arneth, A., Ogee, J., 2005. Comparing and Evaluating Process-based EcosystemModel Predictions of Carbon and Water Fluxes in Major European Forest Biomes.pp. 2211–2233.
oureaux, C., Debacq, A., Hoyaux, J., Suleau, M., Tourneur, D., Vancutsem, F., Bodson,B., Aubinet, M., 2008. Carbon balance assessment of a Belgian winter wheat crop(Triticum aestivum L.). Global Change Biology 14, 1353–1366.
ueller, L., Behrendt, A., Schalitz, G., Schindler, U., 2005. Above ground biomass andwater use efficiency of crops at shallow water tables in a temperate climate.Agricultural Water Management 75, 117–136.
ash, J.E., Sutcliffe, J.V., 1979. River flow forecasting through conceptional models,1. A. discussion of the principles. Journal of Hydrology 10, 282–290.
sborne, B.A., Saunders, M.J., Jones, M.B., Wattenbach, M., Smith, P., Walmsley, D.,2010. Key questions and uncertainties associated with the assessment of thecropland greenhouse gas balance. Agriculture, Ecosystem and Environment, 139,293–301.
apale, D., Reichstein, M., Aubinet, M., Canfora, E., Bernhofer, C., Kutsch, W., Longdoz,B., Rambal, S., Valentini, R., Vesala, T., Yakir, D., 2006a. Towards a standard-ized processing of Net Ecosystem Exchange measured with eddy covariancetechnique: algorithms and uncertainty estimation. Biogeosciences 3, 571–583.
apale, D., Reichstein, M., Canfora, E., Aubinet, M., Bernhofer, C., Longdoz, B., Kutsch,W., Rambal, S., Valentini, R., Vesala, T., Yakir, D., 2006b. Towards a more har-monized processing of eddy covariance CO2 fluxes: algorithms and uncertaintyestimation. Biogeosciences Discussions 3, 961–992.
arton, W.J., Rasmussen, P.E., 1994. Long-term effects of crop management in wheat-fallow: II. CENTURY model simulations. Soil Science Society of America Journal58, 530–536.
astor, J., Post, W.M., 1986. Influence of climate, soil moisture, and succession onforest carbon and nitrogen cycles. Biogeochemistry 2, 3–27.
enman, H.L., 1948. Natural evaporation from open water, bare soil and grass. Pro-
ceeding of Royal Society Series A, 120–145.iu, J., Li, C., Wang, L., Tang, H., Li, H., Van Ranst, E., 2009. Modeling impacts of carbonsequestration on net greenhouse gas emissions from agricultural soils in China.Global Biogeochemical Cycles, 23.
-project, 2009. R: A Language and Environment for Statistical Computing. R Foun-dation for Statistical Computing, Vienna, Austria.
and Environment 139 (2010) 419–453
Ramankutty, N., Evan, A.T., Monfreda, C., Foley, J.A., 2008. Farming the planet: 1.Geographic distribution of global agricultural lands in the year 2000. GlobalBiogeochemical Cycles, 22.
Reeves, M.C., Zhao, M., Running, S.W., 2005. Usefulness and limits on MODIS GPP forestimating wheat yield. International Journal of Remote Sensing 26, 1403–1421.
Reichstein, M., Falge, E., Baldocchi, D., Papale, D., Aubinet, M., Berbigier, P., Bern-hofer, C., Buchmann, N., Gilmanov, T., Granier, A., Grünwald, T., Havránková, K.,Ilvesniemi, H., Janous, D., Knohl, A., Laurila, T., Lohila, A., Loustau, D., Matteucci,G., Meyers, T., Miglietta, F., Ourcival, J.M., Pumpanen, J., Rambal, S., Rotenberg,E., Sanz, M., Tenhunen, J., Seufert, G., Vaccari, F., Vesala, T., Yakir, D., Valentini,R., 2005. On the separation of net ecosystem exchange into assimilation andecosystem respiration: review and improved algorithm. Global Change Biology11, 1424–1439.
Richardson, A.D., Hollinger, D.Y., 2005. Statistical modeling of ecosystem respirationusing eddy covariance data: maximum likelihood parameter estimation, andMonte Carlo simulation of model and parameter uncertainty, applied to threesimple models. Agricultural and Forest Meteorology 131, 191–208.
Royston, P., 1992. Approximating the Shapiro-Wilk W-test for non-normality. Statis-tics and Computing 2, 117–119.
Salinger, M.J., 2005. Climate variability and change: past, present and future—anoverview. Climatic Change 70, 9–29.
Schulze, E.D., Luyssaert, S., Ciais, P., Freibauer, A., Janssens, I.A., Soussana, J.F., Smith,P., Grace, J., Levin, I., Thiruchittampalam, B., Heimann, M., Dolman, A.J., Valentini,R., Bousquet, P., Peylin, P., Peters, W., Rödenbeck, C., Etiope, G., Vuichard, N., Wat-tenbach, M., Nabuurs, G.J., Poussi, Z., Nieschulze, J., Gash, J.H., 2009. Importanceof methane and nitrous oxide for Europe’s terrestrial greenhouse-gas balance.Nature Geosci 2, 842–850.
Seneviratne, S.I., Pal, J.S., Eltahir, E.A.B., Schär, C., 2002. Summer dryness in a warmerclimate: a process study with a regional climate model. Climate Dynamics 20,69–85.
Smith, J.U., Smith, P., Wattenbach, M., Zaehle, S., Hiederer, R., Jones, R.J.A., Mon-tanarella, L., Rounsevell, M.D.A., Reginster, I., Ewert, F., 2005a. Projected changesin mineral soil carbon of European croplands and grasslands, 1990-2080. GlobalChange Biology 11, 2141–2152.
Smith, P., 2004. Carbon sequestration in croplands: the potential in Europe and theglobal context. European Journal of Agronomy 20, 229–236.
Smith, P., Andrén, O., Karlsson, T., Perälä, P., Regina, K., Rounsevell, M., Van Wese-mael, B., 2005b. Carbon sequestration potential in European croplands has beenoverestimated. Global Change Biology 11, 2153–2163.
Smith, P., Lanigan, G., Kutsch, W.L., Buchmann, N., Eugster, W., Aubinet, M., Ceschia,E., Béziat, P., Yeluripati, J.B., Osborne, B., Moors, E.J., Brut, A., Wattenbach, M.,Saunders, M., Jones, M., 2010. Measurements necessary for assessing the netecosystem carbon budget of croplands. Agriculture, Ecosystem and Environ-ment, 139, 302–315.
Smith, P., Martino, D., Cai, Z., Gwary, D., Janzen, H., Kumar, P., McCarl, B.,Ogle, S., O’Mara, F., Rice, C., Scholes, B., Sirotenko, O., Howden, M., McAllis-ter, T., Pan, G., Romanenkov, V., Schneider, U., Towprayoon, S., Wattenbach,M., Smith, J., 2008. Greenhouse gas mitigation in agriculture. Philosoph-ical Transactions of the Royal Society B: Biological Sciences 363, 789–813.
Smith, P., Smith, J.U., Powlson, D.S., Coleman, K., Jenkinson, D.S., McGill, W.B., Arah,J.R.M., Thornley, J.H.M., Chertov, O.G., Komarov, A.S., Franko, U., Frolking, S., Li, C.,Jensen, L.S., Mueller, T., Kelly, R.H., Parton, W.J., Klein-Gunnewiek, H., Whitmore,A.P., Molina, J.A.E., 1997a. A comparison of the performance of nine soil organicmatter models using datasets from seven long-term experiments. Geoderma 81,153–225.
Smith, P., Smith, J.U., Powlson, D.S., McGill, W.B., Arah, J.R.M., Chertov, O.G., Coleman,K., Franko, U., Frolking, S., Jenkinson, D.S., Jensen, L.S., Kelly, R.H., Klein-Gunnewiek, H., Komarov, A.S., Li, C., Molina, J.A.E., Mueller, T., Parton, W.J.,Thornley, J.H.M., Whitmore, A.P., 1997b. A comparison of the performance ofnine soil organic matter models using datasets from seven long-term experi-ments. Geoderma 81, 153–225.
Stone, P.J., Sorensen, I.B., Jamieson, P.D., 1999. Effect of soil temperature on phe-nology, canopy development, biomass and yield of maize in a cool-temperateclimate. Field Crops Research 63, 169–178.
Sus, O., Williams, M., Bernhofer, C., Beziat, P., Buchmann, N., Ceschia, E., Doherty,R., Eugster, W., Grünwald, T., Kutsch, W., Smith, P., Wattenbach, M., 2010. Alinked carbon cycle and crop developmental model: Description and evaluationagainst measurements of carbon fluxes and carbon stocks at several Euro-pean agricultural sites. Agriculture, Ecosystems and Environment, 139, 402–418.
Thornthwaite, C.W., Hare, F.K., 1965. The loss of water to the air. MeteorologicalMonographs, 163–180.
Tonitto, C., David, M.B., Drinkwater, L.E., Li, C., 2007a. Application of the DNDCmodel to tile-drained Illinois agroecosystems: model calibration, validation, anduncertainty analysis. Nutrient Cycling in Agroecosystems 78, 51–63.
Tonitto, C., David, M.B., Li, C., Drinkwater, L.E., 2007b. Application of the DNDC modelto tile-drained Illinois agroecosystems: model comparison of conventional anddiversified rotations. Nutrient Cycling in Agroecosystems 78, 65–81.
Van Den Boogaard, R., Alewijnse, D., Veneklaas, E.J., Lambers, H., 1997. Growth
and water-use efficiency of 10 Triticum aestivum cultivars at different wateravailability in relation to allocation of biomass. Plant, Cell and Environment 20,200–210.Vertregt, N., Penning de Vries, F.W.T., 1987. A rapid method for determining theefficiency of biosynthesis of plant biomass. Journal of Theoretical Biology 128,109–119.

stems
V
V
W
W
W
M. Wattenbach et al. / Agriculture, Ecosy
leeshouwers, L.M., Verghagen, A., 2002. Carbon emission and sequestration by agri-cultural land use: a model study for Europe. Global Change Biology 8, 519–530.
uichard, N., Ciais, P., Belelli, L., Smith, P., Valentini, R., 2008. Carbon sequestrationdue to the abandonment of agriculture in the former USSR since 1990. GlobalBiogeochemical Cycles, 22.
ang, J., Yu, Q., Lee, X., 2007. Simulation of crop growth and energy and carbon diox-ide fluxes at different time steps from hourly to daily. Hydrological Processes21, 2474–2492.
ang, Q., Watanabe, M., Ouyang, Z., 2005. Simulation of water and carbon fluxesusing BIOME-BGC model over crops in China. Agricultural and Forest Meteorol-ogy 131, 209–224.
illiams, M., Eugster, W., Rastetter, E.B., McFadden, J.P., Chapin Iii, F.S., 2000. Thecontrols on net ecosystem productivity along an Arctic transect: a model com-parison with flux measurements. Global Change Biology 6, 116–126.
and Environment 139 (2010) 419–453 453
Williams, M., Rastetter, E.B., 1999. Vegetation characteristics and primary produc-tivity along an arctic transect: implications for scaling-up. Journal of Ecology 87,885–898.
Williams, M., Rastetter, E.B., Fernandes, D.N., Goulden, M.L., Wofsy, S.C., Shaver, G.R.,Melillo, J.M., Munger, J.W., Fan, S.M., Nadelhoffer, K.J., 1996. Modelling the soil-plant-atmosphere continuum in a Quercus-acer stand at Harvard forest: theregulation of stomatal conductance by light, nitrogen and soil/plant hydraulicproperties. Plant, Cell and Environment 19, 911–927.
Zhang, F., Li, C., Wang, Z., Wu, H., 2006. Modeling impacts of management alterna-tives on soil carbon storage of farmland in Northwest China. Biogeosciences 3,451–466.
Zhang, L., Dawes, W.R., Walker, G.R., 2001. Response of mean annual evapotranspi-ration to vegetation changes at catchment scale. Water Resources Research 37,701–708.


![Converged Storage, Wishful Thinking & Realitycloudscaling.com/assets/pdf/cloudscaling_whitepaper_converged_st… · inimitable Werner Vogels, CTO of Amazon [@werner]. Werner focuses](https://static.fdocuments.net/doc/165x107/5f46e8be3e118e38f36b60e4/converged-storage-wishful-thinking-inimitable-werner-vogels-cto-of-amazon.jpg)