Agricultural Economy in Southern Minnesota -...
28
Agricultural Economy in Southern Minnesota PAUL LANOUE DEAN OF MANAGEMENT MINNESOTA WEST
Transcript of Agricultural Economy in Southern Minnesota -...
Agricultural Economy in Southern Minnesota
PAUL LANOUEDEAN OF MANAGEMENT
MINNESOTA WEST

Where are we at?
Variability◦ Yields◦ Weather◦ Financial health◦ Commodities◦ Land Ownership◦ Debt load◦ Tax planning

2015 Financial Year in Review
ANALYSIS FINANCIAL TREND DATA
COMPILED BY
AL BRUDELIE ( RETIRED DEAN OF MANAGEMENT)
MARCH 2016
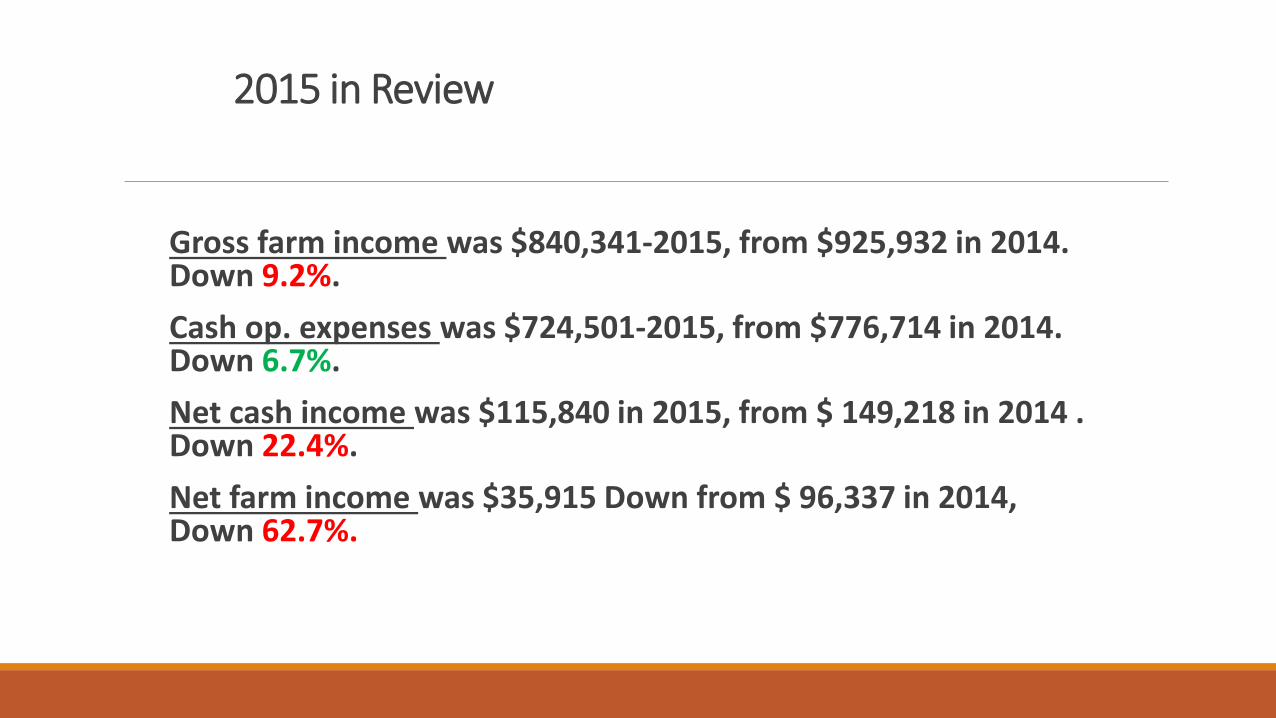
2015 in Review
Gross farm income was $840,341-2015, from $925,932 in 2014. Down 9.2%.
Cash op. expenses was $724,501-2015, from $776,714 in 2014. Down 6.7%.
Net cash income was $115,840 in 2015, from $ 149,218 in 2014 . Down 22.4%.
Net farm income was $35,915 Down from $ 96,337 in 2014, Down 62.7%.

2015 in Review
Corn production was up 25.7% to a yield of 205.9 bu. in 2015 from a yield of 163.8 in 2014.
The highest yield ever was in 2015 at 205.9 bu. The lowest was 54 bu. in 1965.
Soybean production was up 27.8% to a yield of 60.1 bu. in 2015 from a yield of 47.0 bu. in 2014.
The lowest yield was 18 bu. in 1996. The highest yield was 60.1 bu. in 2015.
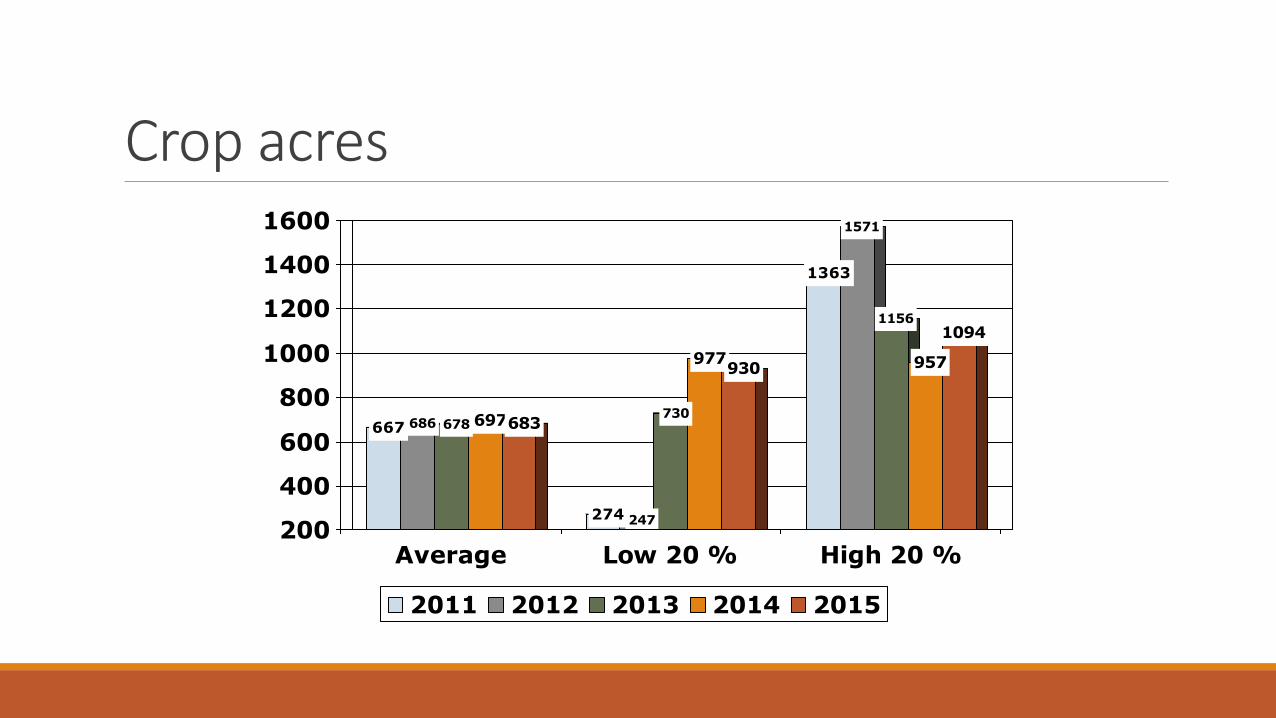
Crop acres
667 686 678 697683
274 247
730
977930
1363
1571
1156
957
1094
200
400
600
800
1000
1200
1400
1600
Average Low 20 % High 20 %
2011 2012 2013 2014 2015

Net Farm Income (Ave)
106,964
149,940139,986
61,350
183,808199,794
272,544
73,67896,337
35,915
0
50,000
100,000
150,000
200,000
250,000
300,000
2006
2007
2008
2009
2010
2011
2012
2013
2014
2015
Southern Minnesota Book
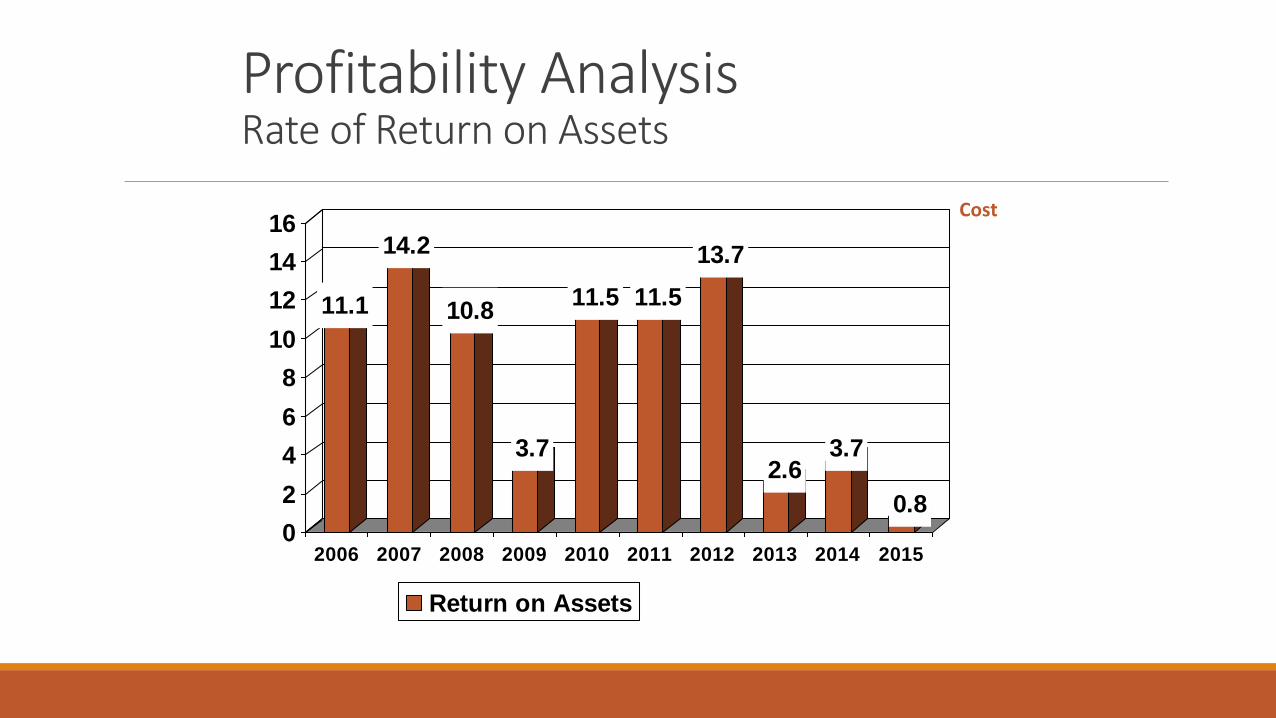
Profitability AnalysisRate of Return on Assets
11.1
14.2
10.8
3.7
11.5 11.5
13.7
2.63.7
0.80
2
4
6
8
10
12
14
16
2006 2007 2008 2009 2010 2011 2012 2013 2014 2015
Return on Assets
Cost
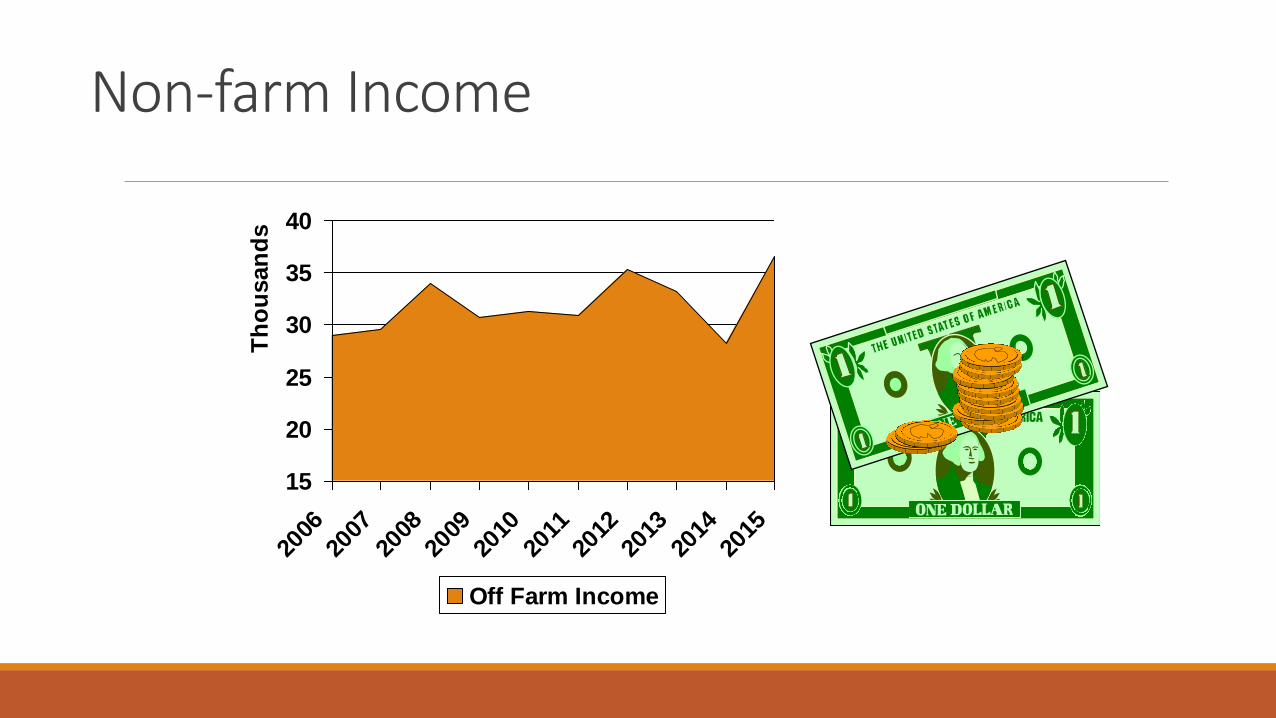
Non-farm Income
15
20
25
30
35
40
2006
2007
2008
2009
2010
2011
2012
2013
2014
2015
Th
ou
san
ds
Off Farm Income
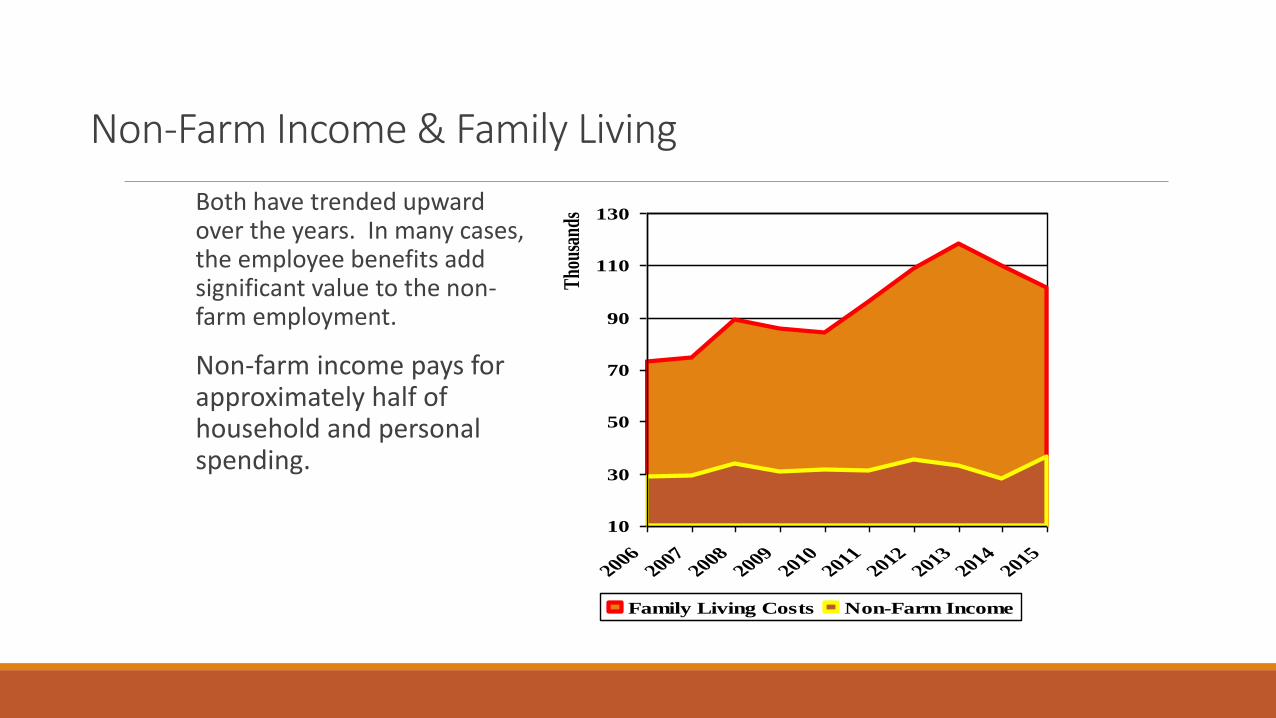
Non-Farm Income & Family Living
Both have trended upward over the years. In many cases, the employee benefits add significant value to the non-farm employment.
Non-farm income pays for approximately half of household and personal spending.
10
30
50
70
90
110
130
20062007
20082009
20102011
20122013
20142015
Tho
usan
ds
Family Living Costs Non-Farm Income
Farm & Family SpendingWhere Did the $1,024,388 Go in 2014?
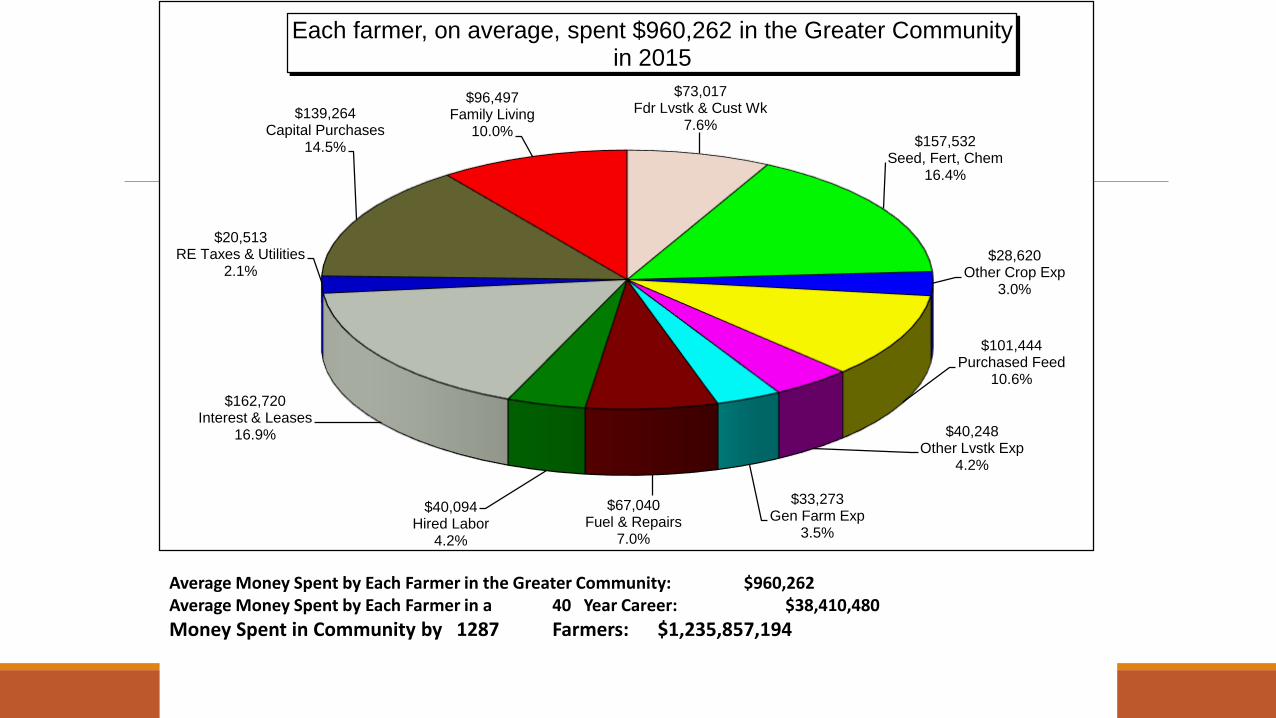
$73,017 Fdr Lvstk & Cust Wk
7.6%$157,532
Seed, Fert, Chem16.4%
$28,620 Other Crop Exp
3.0%
$101,444 Purchased Feed
10.6%
$40,248 Other Lvstk Exp
4.2%
$33,273 Gen Farm Exp
3.5%
$67,040 Fuel & Repairs
7.0%
$40,094 Hired Labor
4.2%
$162,720 Interest & Leases
16.9%
$20,513 RE Taxes & Utilities
2.1%
$139,264 Capital Purchases
14.5%
$96,497 Family Living
10.0%
Each farmer, on average, spent $960,262 in the Greater Communityin 2015
Average Money Spent by Each Farmer in the Greater Community: $960,262 Average Money Spent by Each Farmer in a 40 Year Career: $38,410,480
Money Spent in Community by 1287 Farmers: $1,235,857,194
Farm Financial Standards
The American Bankers Association has endorsed the use of sixteen “standards” to rate business performance (see page 20).
These standards are measures of:◦ Liquidity
◦ Solvency
◦ Profitability
◦ Repayment Capacity
◦ Financial Efficiency
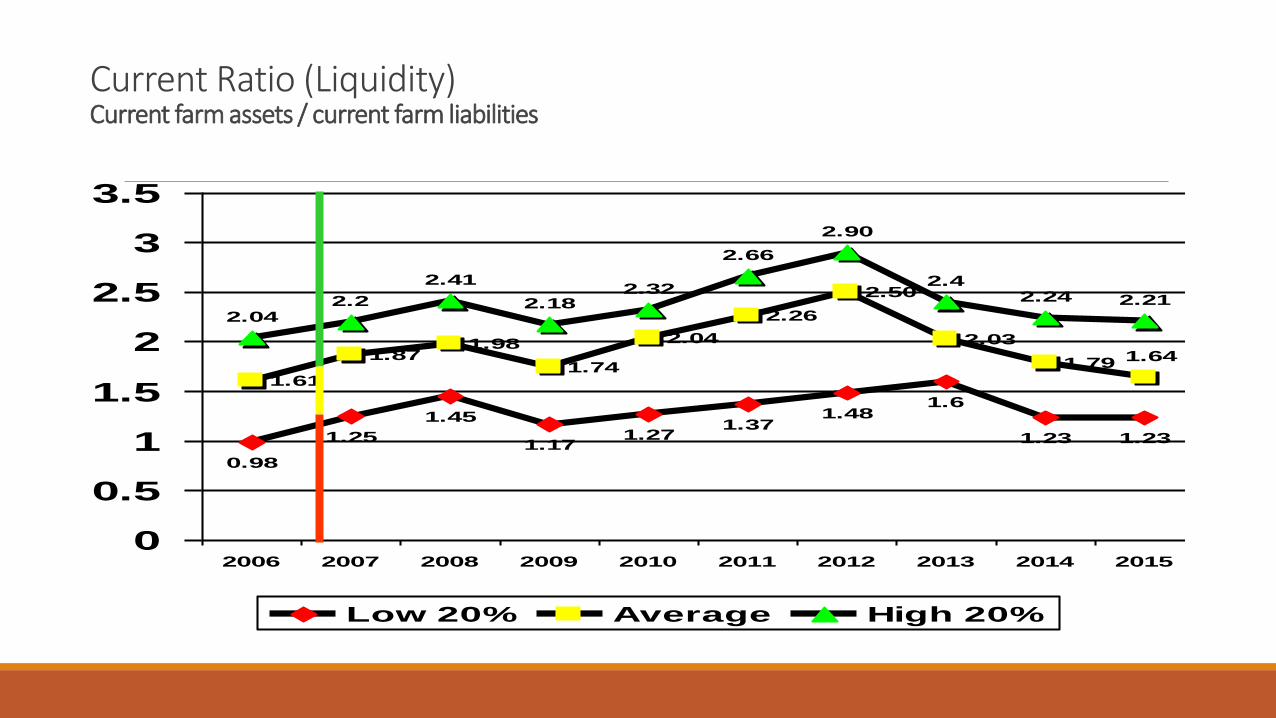
Current Ratio (Liquidity)Current farm assets / current farm liabilities
0.98
1.25
1.45
1.171.27
1.371.48
1.6
1.23 1.23
1.61
1.871.98
1.74
2.04
2.26
2.50
2.03
1.79
2.042.2
2.41
2.182.32
2.66
2.90
2.42.24 2.21
1.64
0
0.5
1
1.5
2
2.5
3
3.5
2006 2007 2008 2009 2010 2011 2012 2013 2014 2015
Low 20% Average High 20%

Working Capital to Gross Income All Farms
23
2932.9
28.3
36 36.842.2
35.5
29.927.4
-1
9
15.8
6.910.3
15.3 16.8
24.3
14.811.8
3237
42.5 42.845.6
43.1
51.4
42.6
32.1
39.9
-10
0
10
20
30
40
50
60
20062007
20082009
20102011
20122013
20142015
Average Low 20% High 20%
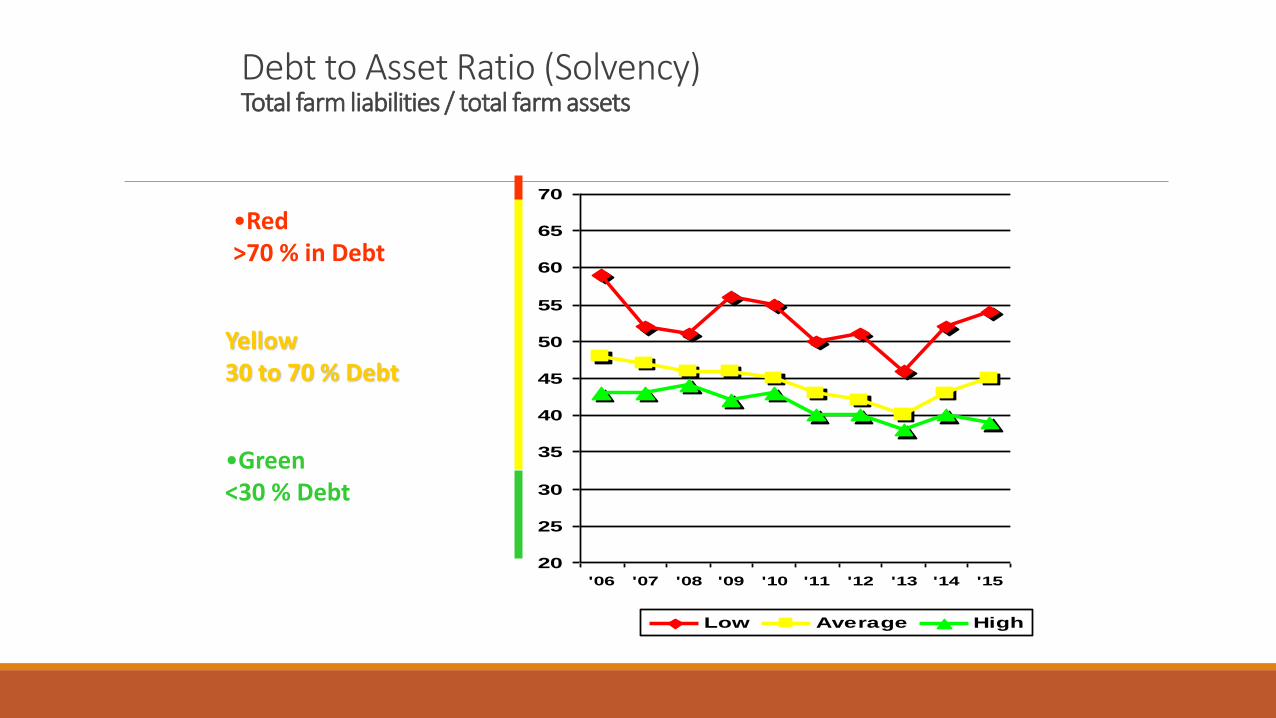
Debt to Asset Ratio (Solvency)Total farm liabilities / total farm assets
20
25
30
35
40
45
50
55
60
65
70
'06 '07 '08 '09 '10 '11 '12 '13 '14 '15
Low Average High
•Green <30 % Debt
Yellow 30 to 70 % Debt
•Red >70 % in Debt
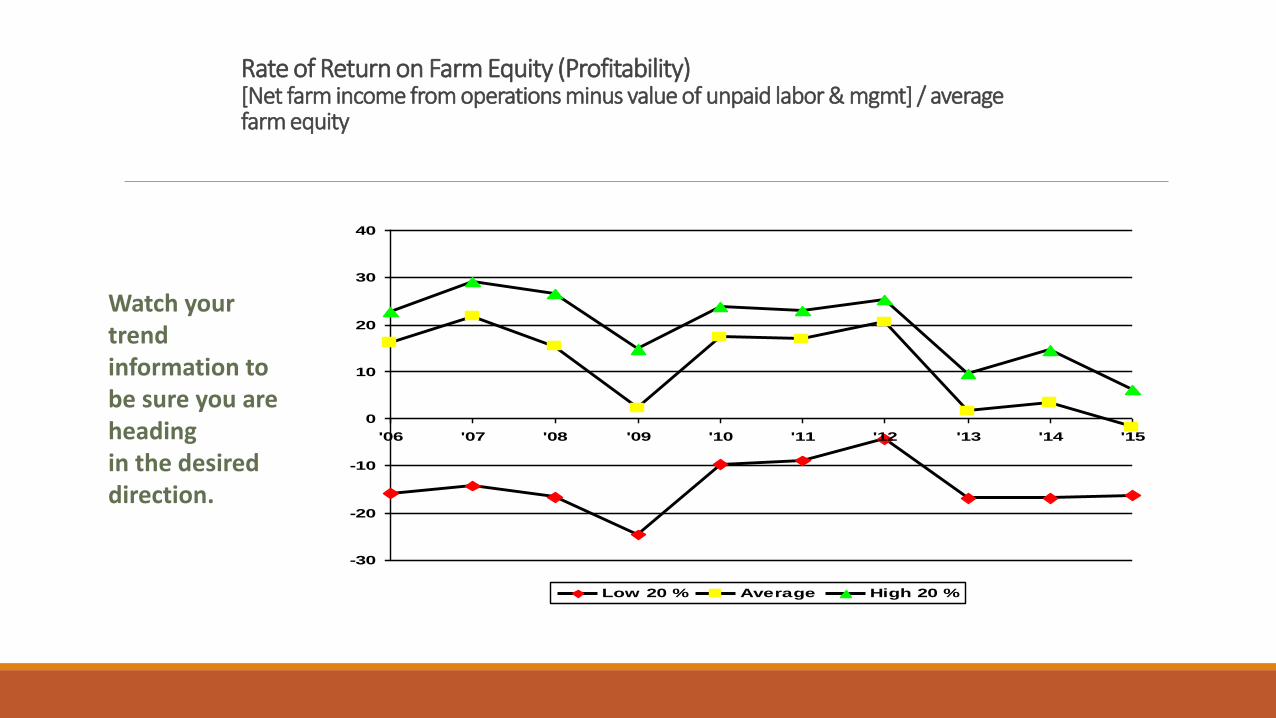
Rate of Return on Farm Equity (Profitability)[Net farm income from operations minus value of unpaid labor & mgmt] / average farm equity
-30
-20
-10
0
10
20
30
40
'06 '07 '08 '09 '10 '11 '12 '13 '14 '15
Low 20 % Average High 20 %
Watch your trendinformation to be sure you are headingin the desired direction.
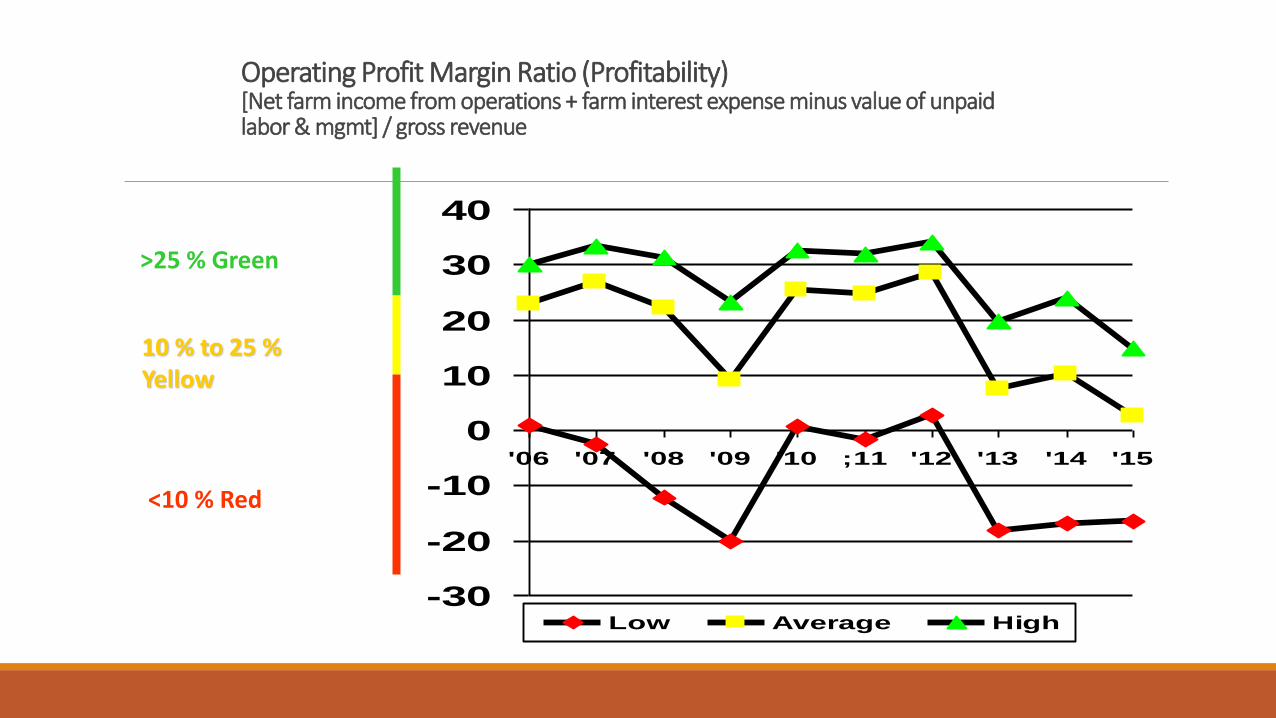
Operating Profit Margin Ratio (Profitability)[Net farm income from operations + farm interest expense minus value of unpaid labor & mgmt] / gross revenue
-30
-20
-10
0
10
20
30
40
'06 '07 '08 '09 '10 ;11 '12 '13 '14 '15
Low Average High
>25 % Green
10 % to 25 % Yellow
<10 % Red
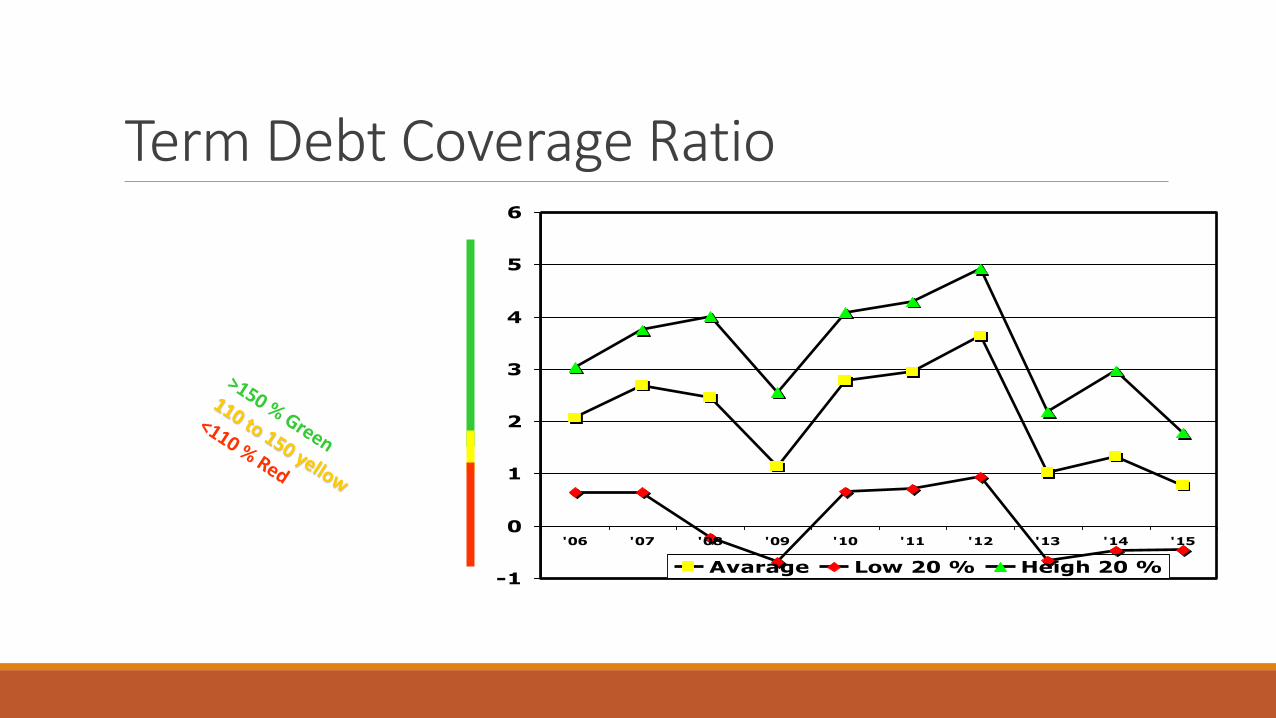
Term Debt Coverage Ratio
-1
0
1
2
3
4
5
6
'06 '07 '08 '09 '10 '11 '12 '13 '14 '15
Avarage Low 20 % Heigh 20 %

Capital Replacement Margin 2015
-47,775
-230,462
68,990
128,129
-250,000
-200,000
-150,000
-100,000
-50,000
0
50,000
100,000
150,000
Replacement Margin Accural
Average Low 20 % High 20 % High 10%
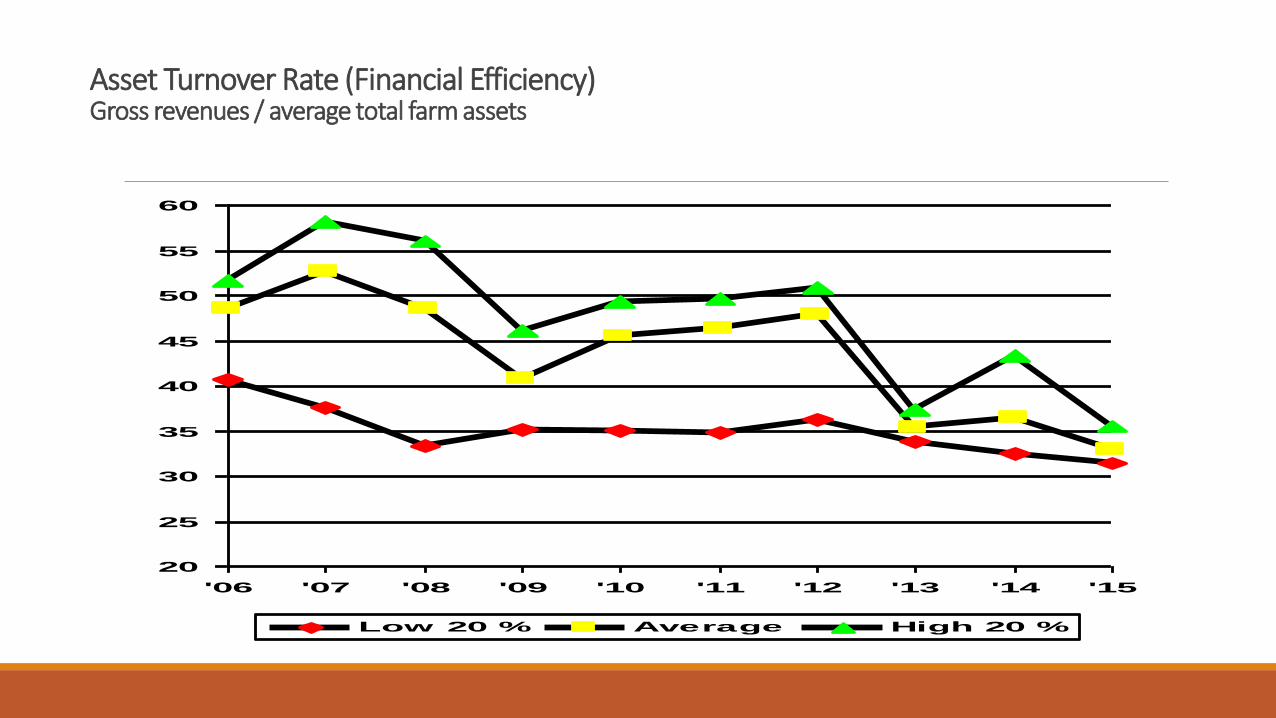
Asset Turnover Rate (Financial Efficiency)Gross revenues / average total farm assets
20
25
30
35
40
45
50
55
60
'06 '07 '08 '09 '10 '11 '12 '13 '14 '15
Low 20 % Average High 20 %
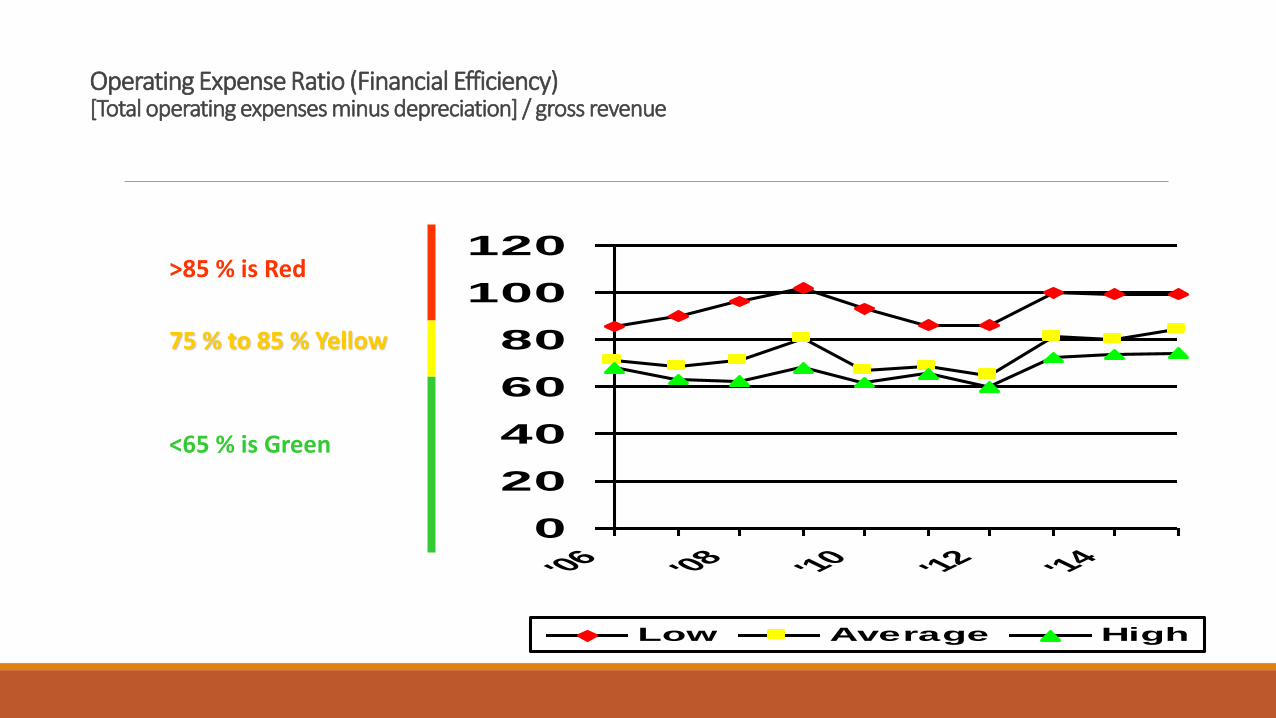
Operating Expense Ratio (Financial Efficiency)[Total operating expenses minus depreciation] / gross revenue
0
20
40
60
80
100
120
'06 '08 '10 '12 '14
Low Average High
>85 % is Red
75 % to 85 % Yellow
<65 % is Green
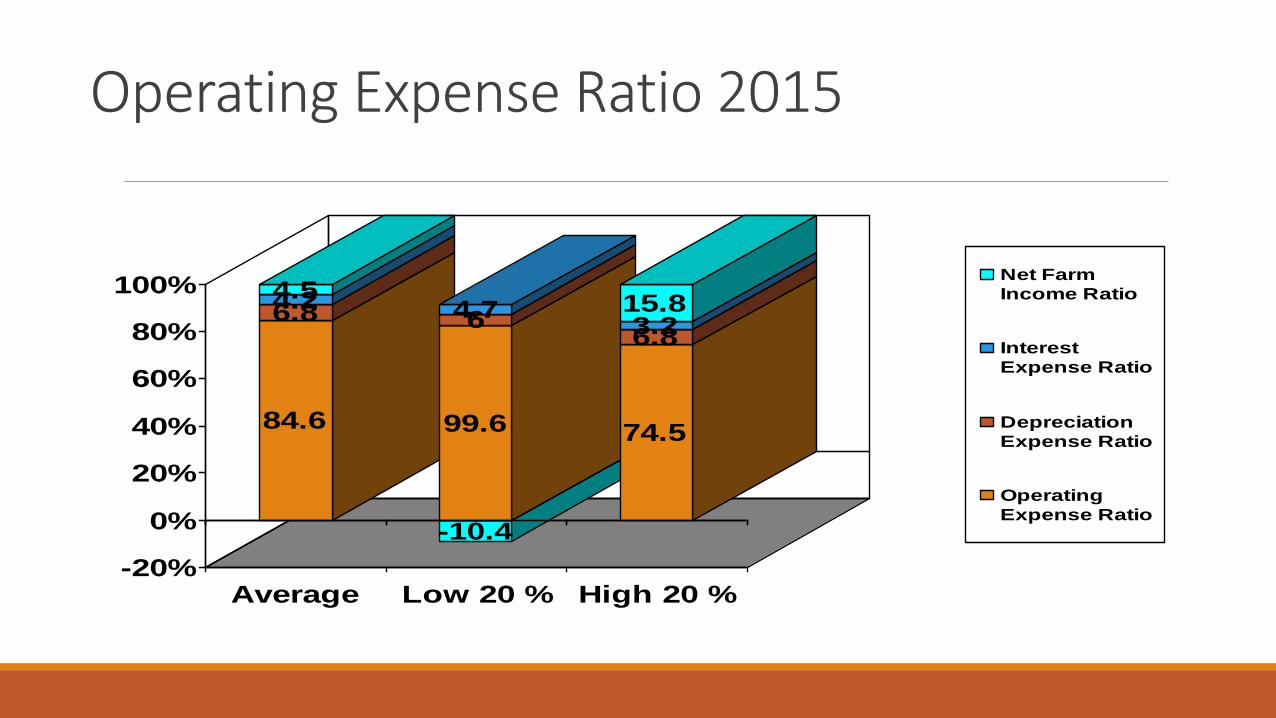
Operating Expense Ratio 2015
84.6
6.84.24.5
99.6
64.7
-10.4
74.5
6.83.215.8
-20%
0%
20%
40%
60%
80%
100%
Average Low 20 % High 20 %
Net Farm
Income Ratio
Interest
Expense Ratio
Depreciation
Expense Ratio
Operating
Expense Ratio
Conclusions about ratiosBusiness trend lines are priceless
Compare information for the last 5 years
Compare farm data to peer groups
How does the business stack up?
What are your new strategies?
Managing in volatile times?How do you improve your bottom line?◦ Conduct Variance Analysis (planned vs. actual)
◦ Position your balance sheet
◦ Manage 100 things 1% better each year
◦ Manage the operation to be on the right side of the financial divide
How do you survive the volatile ride ahead?
Conduct sensitivity analysis cash flows
Aspire to be a top half marketer by having a written marketing plan
Form peer advisory groups
Form strategic alliances
Capture economies of scale, reducing costs, improving asset utilization
Looking forward to 2017What is in store?
Let’s look at impact of price and yield variability on farm profit.
Access Farm Profit Tool

Have a Great Year in 2017!MAKE SURE YOU ARE ON YOUR A GAME IN MANAGING YOUR OPERATION THIS YEAR!