Agrarian Solar Ponds Final REPORT 03
20
1 FINAL REPORT SALTON SEA SOLAR PILOT POND PROJECT AGRARIAN RESEARCH AND MANAGEMENT COMPANY JUNE 2003 EXECUTIVE SUMMARY The purpose of this project was to assist the Salton Sea Authority in developing the data and the expertise to proceed with confidence with the construction and operation of a large-scale solar evaporation pond project that would be a cost-effective method of removing salt from the Salton Sea. The Salton Sea Authority (Authority) contracted with Agrarian Research and Management Company (Agrarian) to construct and operate a pilot project to evaluate the feasibility of such a solar evaporation facility. The project was developed to produce the data necessary for the responsible design of a larger project that would most efficiently remove salts from the Salton Sea. The project explored the operational requirements for the efficient and effective production of solid salt from the brines of the Salton Sea water. In addition, it generated data on the nature of the precipitated salts that will allow for the planning and scaling of a large-scale project for salinity control of the Sea water. Laboratory studies were conducted to determine the phase chemistry of the salts at different concentrations, and a final report for the phase chemistry studies was submitted in December 2001. The field portion of the project was summarized in an Annual Report from July 2002. The current report brings together data from the laboratory studies, pilot pond site, and the modeling exercise conducted to produce the best available information for large scale design based on the laboratory and field data. The pond system, following a retrofit in February 2002, consists of twelve ponds operated in series. There are six larger ponds in the series that are concentrators, and six smaller ponds producing solid salt, including one pond that was allowed to dry out to demonstrate the nature of a crystallized salt bed. Regarding seepage, a geotechnical investigation estimated a seepage rate of about 0.0003 inches per day, but exhaustive field measurements determined a leakage rate of about 0.04 inches per day. Evaporation rates were collected from four pans over the course of a year, and the data have been adjusted to account for long-term climate averages, producing a predicted monthly evaporation rate for brines of all concentrations. Solid salt samples were collected from both the laboratory and field projects simultaneously with brine samples, so the analyses together determined the composition of the complex salts together with their entrained brine. All of these data--seepage information, evaporation data, and brine and solid salt chemistry results--are used to develop future project parameters such as total project size, individual pond size and partitioning, as well infrastructure parameters such as berm and brine transfer design. The operational experience gained from this pilot project will also be available to guide the development as well as the pricing and economic evaluation of future large-scale salt removal projects.
Transcript of Agrarian Solar Ponds Final REPORT 03

1
FINAL REPORT
SALTON SEA SOLAR PILOT POND PROJECT
AGRARIAN RESEARCH AND MANAGEMENT COMPANY
JUNE 2003
EXECUTIVE SUMMARY
The purpose of this project was to assist the Salton Sea Authority in developing
the data and the expertise to proceed with confidence with the construction and operation
of a large-scale solar evaporation pond project that would be a cost-effective method of
removing salt from the Salton Sea. The Salton Sea Authority (Authority) contracted with
Agrarian Research and Management Company (Agrarian) to construct and operate a pilot
project to evaluate the feasibility of such a solar evaporation facility. The project was
developed to produce the data necessary for the responsible design of a larger project that
would most efficiently remove salts from the Salton Sea. The project explored the
operational requirements for the efficient and effective production of solid salt from the
brines of the Salton Sea water. In addition, it generated data on the nature of the
precipitated salts that will allow for the planning and scaling of a large-scale project for
salinity control of the Sea water.
Laboratory studies were conducted to determine the phase chemistry of the salts
at different concentrations, and a final report for the phase chemistry studies was
submitted in December 2001. The field portion of the project was summarized in an
Annual Report from July 2002. The current report brings together data from the
laboratory studies, pilot pond site, and the modeling exercise conducted to produce the
best available information for large scale design based on the laboratory and field data.
The pond system, following a retrofit in February 2002, consists of twelve ponds
operated in series. There are six larger ponds in the series that are concentrators, and six
smaller ponds producing solid salt, including one pond that was allowed to dry out to
demonstrate the nature of a crystallized salt bed. Regarding seepage, a geotechnical
investigation estimated a seepage rate of about 0.0003 inches per day, but exhaustive
field measurements determined a leakage rate of about 0.04 inches per day. Evaporation
rates were collected from four pans over the course of a year, and the data have been
adjusted to account for long-term climate averages, producing a predicted monthly
evaporation rate for brines of all concentrations. Solid salt samples were collected from
both the laboratory and field projects simultaneously with brine samples, so the analyses
together determined the composition of the complex salts together with their entrained
brine. All of these data--seepage information, evaporation data, and brine and solid salt
chemistry results--are used to develop future project parameters such as total project size,
individual pond size and partitioning, as well infrastructure parameters such as berm and
brine transfer design. The operational experience gained from this pilot project will also
be available to guide the development as well as the pricing and economic evaluation of
future large-scale salt removal projects.

2
1. INTRODUCTION:
The Salton Sea Authority (Authority) contracted with Agrarian Research and
Management Company (Agrarian) to construct and operate a pilot project for solar
evaporation ponds for the purpose of salinity management at the Salton Sea. The purpose
of the Salton Sea Solar Pilot Pond Project was to assist the Salton Sea Authority in
developing the data and the expertise to proceed with confidence with a large-scale solar
evaporation pond project that would be a cost-effective method of removing salt from the
Salton Sea.
Two previous reports were submitted to the Authority as critical stages of the
research were completed. One is titled “Final Report: Laboratory Studies On Salton Sea
Brine: Chemistry And Area Relationships.” Data from this report are summarized here,
and it appears as Appendix 1 to this final report. The second submitted report is titled
“Annual Report: Salton Sea Solar Pilot Pond Project July 2002”. This report detailed
field data from the pilot ponds. Since most of the data are reported here, this annual
report is not attached. Important field and laboratory brine chemistry data are submitted
as Appendix 2. In addition, detailed information on the ponds, with all aspects of field
studies, is found in monthly reports, which are available from the Authority. An
Operational Manual for field and laboratory data collection was developed as well, and is
included as Appendix 3. The data were used to develop a model and a design for a
facility that would remove one million tons of salt from the Salton Sea. There are three
spreadsheets that detail the operation of the model, and associated written documents to
explain the models and the design parameters. These documents are also included as
Appendix 4.
2. OBJECTIVES
The project was developed to produce the data necessary for the responsible
design of a larger project that would most efficiently remove salts from the Salton Sea.
The project explored the operational requirements for the efficient and effective
production of solid salt from the brines of the Salton Sea water. In addition, it generated
data on the nature of the precipitated salts that allow for the planning and scaling of a
large-scale project for salinity control of the Sea water. The original objectives of the
project are listed below.
1) Successfully adapt for Salton Sea brines the general design criteria for solar
salt ponds developed by the solar salt industry that take into account water
quality, salt composition of the initial brines, and regional climate data.
2) Determine the evaporation rate of the Sea brine at various concentrations both
in a pan and a pond setting, and compare these rates to empirically derived
and published data for fresh water evaporation at the same location.
3) Determine the seepage rate of the soil on which the ponds are constructed to a
sufficiently accurate degree to allow for responsible future planning.

3
4) Monitor and quantify the change in the depth to groundwater and the quality
of groundwater under and around the evaporation ponds.
5) Theoretically calculate the concentration of Sea water brine at which solid salt
begins to form, and empirically test that result with a solar pond concentrating
series.
6) Determine the proper bittern points for the production of salt of different
qualities with field and laboratory observations using distinct crystallizers and
bittern ponds that receive brines at different concentrations.
7) Determine the quality of the salt produced from different bittern points using
the distinct crystallizers and bittern ponds.
8) Determine the bulk density of all solid salts produced with field and
laboratory methods.
9) Determine the growth rate of all qualities of salt in a crystallizer with field
methods.
10) Determine the characteristics of the bittern generated at different
concentrations.
In addition, the following critical data for pond design have been articulated to the project
managers (Dave Butts, unpubl. data):
Brine feed concentration
Brine concentration profiles
Brine phase chemistry
Leakage rate
Evaporation rate and other weather data
The objectives have been largely met, and all of the critical data have been provided by
the project.
3. SITE DESCRIPTION
3.1 PILOT PONDS. The pilot ponds are located at the Imperial County
Niland Boat Ramp site on the east shore of the Salton Sea between Bombay Beach and
Niland, California. The initial series of ponds was constructed in March 2001 and
consisted of a series of 10 ponds for the solar salt project, two identically configured
ponds one of which was lined for seepage studies, and a pump station on the shore of the
Sea. The existing fenced area was leveled and used for the evaporation study and for
storage.
By about 8 months into the project, it was apparent that the proposed
concentrator:crystallizer ratio was not correct for the location, including the excessive
seepage experienced by the ponds both through the floor and the berms. For this reason,
the ponds were not able to attain the steady state required for the completion of the
project. In February 2002 Agrarian constructed an additional two ponds at the upslope
side of the pilot pond series, and thereby added an additional 4.6 acres to the concentrator
series. The final pond layout is shown in Figure 1 below. The new system of ponds was

4
also retrofitted for gravity flow. This new system began operation in March 2002, and
attained steady state by early June 2002. The solar pond series then consisted of 12
ponds, with the final 6 ponds performing as crystallizers. The ponds were maintained at
approximately 8 inches deep.
The intake structure became separated from the suction hose attached to the pump
during a severe wind storm in mid-May. Upon recovery, the structure was corroded
sufficiently that a new assembly was required to be constructed, using some salvaged
parts. This new intake structure was installed in the Sea with modifications to prevent a
repeat of the accident. The replacement did not affect pumping rates, and the new intake
structure performed well until the end of the project in May 2003.
Figure 1. Aerial photo of the pilot ponds at Niland, California. Water is delivered to the
project via a pipeline from the pump intake at the Salton Sea shoreline. The water is
delivered into Pond B, and then is pumped with a small transfer pump to Pond A. From
there, the water continues to flow by gravity through Ponds 1-10. Ponds B, A, and 1-4
were concentrator ponds; Ponds 5-10 were crystallizer ponds. The two paired seepage
study ponds are shown as well.
Pump and intake
at the Salton Sea
Pipeline to
project
Delivery to
Pond B
Delivery to
Pond A
(pumped)
Gravity delivery
from Pond A to
Ponds 1-10
Seepage
ponds
Pond B
Pond A
Crystallizers

5
3.2 SEEPAGE STUDY. The seepage ponds were constructed to measure the
difference in water loss between identical ponds, one of which was lined and the other of
which was not. After 5 months of operation, it was apparent that the water loss data from
the unlined pond reflected more than evaporation losses plus losses to the pond floor. As
had been the case in the pilot ponds, there was considerable water loss from the berms
that would not be typical in a large pond system. An eight foot diameter steel tank was
installed in the center of the pond as an infiltrometer and water depth measurements from
inside this structure were taken. The berms surrounding this pond were treated with
Salton Sea brine to create a barrier to evaporation, and data from the infiltrometer
continued to be gathered.
Additional seepage data were obtained with the piezometer nests located in each
pond (except Pond 7). Each nest consists of three sealed tubes open only at the bottom
that are installed to depths of 5, 10, and 20 feet. The water level in these tubes was read
monthly, and trends were plotted.
3.3 EVAPORATION STUDY. The evaporation study was in effect for
almost two years. The study consisted of four Class A pans. The first one contained fresh
water, and was elevated on a pallet according to standard specifications. The remaining
pans contained brine of varying concentrations, and were buried in the ground, with
about 4 inches of the pan remaining above the ground surface. The burial facilitated the
conversion of the pan data to pond-scale evaporation rates. Weather data including wind
speed and maximum-minimum temperatures were collected on weekdays as well.
3.4 LABORATORY STUDIES: There have been a series of laboratory
studies conducted to determine the phase chemistry of the salts at different conditions.
The first study was conducted indoors using heat lamps, beginning with Salton Sea brine.
Although protocols were developed for conducting the brine and solid salt analyses at the
site facility, the decision was made to forward samples to the Denver laboratory of the
Bureau of Reclamation in order to assure processing uniformity with the brines collected
and evaluated by the Bureau at the Salton Sea Test Base (SSTB) facility on the west side
of the Sea. The laboratory study yielded good data for warm (summer) conditions in the
lower concentration ranges. A second indoor laboratory study was initiated in January
starting with the higher concentration brine collected from the sump at the Salton Sea
Test Base site. This study produced good data for warm (summer) conditions in the
higher concentration ranges. The study was continued in order to determine whether the
bittern can be driven to dryness, and what is the highest level of concentration that can be
attained. We also conducted brine studies outdoors under ambient conditions during cold
(winter) conditions, starting with the same concentrated brines from the SSTB as well as
with minimally concentrated Salton Sea brines obtained from the pilot ponds. The
laboratory analyses from all these studies combined permitted the determination of a
complete view of solid salt formation during the entire year in a solar evaporation pond
system. For a detailed description of the laboratory studies, refer to the document titled
titled “Final Report: Laboratory Studies On Salton Sea Brine: Chemistry And Area
Relationships” in Appendix 1.

6
4. OPERATIONAL PARAMETERS
4.1 PILOT PONDS. Water from the Salton Sea was pumped into Pond B, and
was moved by a portable gasoline powered pump to Pond A, from whence it flowed by
gravity into the remaining ponds. The flow rate was governed from Pond A to Pond 1
with a valve, and the rate of delivery was calculated daily using evaporation data
generated on-site, and estimated seepage rates over the entire pond system. This method
of water transfer proved to be simple and effective.
The delivery pipes between the crystallizer ponds become clogged frequently with
solid salt. The pipes were kept clear by the injection of a high-pressure stream of the
more dilute Salton Sea water (functionally a fresh water source) delivered from a water
truck. This method is superior to dislodging salt physically, as it has minimum impact on
the pipe itself, and reduces the potential for fracturing the pipes.
We worked actively to counteract seepage through the berms of the ponds by
delivering Salton Sea brine to the berm surfaces with a water truck. The water truck loads
brine from the main transmission line. This method allowed for a competent crust to be
developed over the treated berms, and water losses by that wicking action were sharply
minimized.
We note that the intake structure used for this project, which consisted of stainless
steel fish screens and welded poly hose, did not foul with barnacles during the entire
course of the project. This may be attributable to the pumping schedule, which was not
continuous. The pumps were run for several hours daily during the summer, and several
hours weekly during the winter, feeding only the first pond in the series. Continuing
operations used a small transfer pump from Pond B into Pond A, and brine flowed by
gravity through the rest of the pond system.
4.2 SEEPAGE STUDY. The water level inside the infiltrometer and the
level in the surrounding pond were kept approximately the same, which minimized water
losses either into or out of the infiltrometer due to head differential. Piezometers were
read monthly, and trends plotted. Agrarian also commissioned a geotechnical study from
URS to quantify hydraulic conductivity rates in the sub-soil in the vicinity of the ponds.
The URS report is attached as Appendix 5.
4.3 EVAPORATION STUDY. The pans were checked daily for leaks.
Water additions were made to maintain the water level in the pans, and also to maintain a
constant brine concentration in each pan. Other weather data were measured and
reported, including maximum and minimum daily temperatures, rainfall, and wind speed.
Daily weather data for CIMIS stations operated in the area were used in the modeling
effort, to calibrate the field data with long-term (10 year) climate trends.
4.4 LABORATORY STUDIES. The brine in each of the studies, both those
conducted indoors and those conducted outdoors, was sampled regularly to determine the
percent magnesium in the brine. Brine samples for analysis were taken at each change of
0.5% magnesium. Solid salt samples were taken at the same time as the brine samples,

7
and any remaining solid salt was removed from the pan at that time. We therefore
collected a continuous series of paired brine and salt samples ranging from very low
concentrations (< 0.5 % magnesium) up to over 9% magnesium, collected at intervals of
0.5% magnesium.
5. RESULTS
5.1 PILOT PONDS. Steady state was attained in the pilot pond system as
of July 2002. Although it was not possible to attain steady state in the pond system as
originally designed at a 6:1 concentrator:crystallizer ratio under the climate and seepage
conditions of this site, increasing the ratio to about 10:1 allowed for the development of
an adequate brine stock to bring the ponds rather quickly to a steady state that included
ponds in a continuum of concentrations as well as ponds producing salt in just four
months. There are six larger ponds in the series that are concentrators, and six smaller
ponds producing solid salt, including one pond that was allowed to dry out to
demonstrate the nature of a crystallized salt bed. The specific gravity in each pond
remained stable at this depth, as had been predicted by the pond model that was
developed for operations. We observed crusting over the crystallizer ponds, which
inhibits evaporation and therefore slows concentration. This phenomenon was not
considered in the models, and may not be typical of a large pond system. The gradient in
the crystallizers did not change in the winter, however, even when the crusts do not form.
Salt growth in the crystallizers has been considerable, and has been quantified.
Table 1 below shows rate and total accumulation in each of the crystallizer ponds of the
series.
POND 5 6 7 8 9 10
MONTH inches of salt
June 3.5 3 3 3.5
July 4 3 3 3
August 2 4.5 3.5 3.5 2
Sep / Oct 1 3 3.5 4 4 --
November 0.75 1.25 2 2.5 1.5 --
December 0.3 0.6 1.5 0.8 1.0 --
January 0.3 1.5 2.5 2.5 2.5 --
February 0 0.2 0.2 1.2 1.0 --
March 1 2 2.5 2.5 3
Total 3.35 10.55 24.2 23.0 22.5 8.5
Mean monthly 0.48 1.32 2.42 2.30 2.25 2.83
Table 1. Growth of salt in the 6 crystallizer ponds between June 2002 and March 2003.
Data are in inches of salt, as measured from the lid samplers.
Maximum accumulation can be seen to be 24.2 inches in a 10 month period of time.
Deposition rates vary with pond, with Pond 7 having the highest accumulation. The data

8
from Pond 10 reflect the fact that this pond did not receive any brine delivery after
August 2002.
Results from the pilot pond system address items 1 and 9 in the list of objectives
above. In addition, the pilot ponds served as a demonstration project for the public, as
evidenced by the many field trips and tours conducted at the site. These ponds will also
served as the location for biological studies that evaluated habitat characteristics for birds
and the organisms that form the basis of their food chain.
5.2 SEEPAGE STUDY: We developed several ways of estimating seepage.
One method used the difference between two paired ponds, one of which was lined and
the other of which was unlined. The difference in water level between the two was
determined to be the seepage rate. The second method used the large infiltrometer
installed in the unlined pond. The data are summarized in the Table 2 below:
Method Mean Range
(in/day) (in/day)
unlined pond 0.056 0.016 - 0.104
infiltrometer 0.045 0.032 - 0.061
geotechnical 0.0003 0.0002 - 0.0006
Table 2. Seepage estimates using three methods at the pilot pond system. The
infiltrometer data were the most consistent measurements observed.
The data from the first 5 months of the seepage pond project included elevated
losses to the banks, which were estimated to be as much as 25% of all the losses. The
edge ratio in a small pond is much larger than in a large pond. Furthermore, the banks
were constructed of dry, minimally compacted material, which take up water much more
than would banks constructed of wet, fully compacted material as would be the case in a
large scale pond system. When the pond margins were sealed with a brine cap, infiltration
decreased. The data from the infiltrometer show mean water movement of about 0.045
inches per day over about 18 months of observations. The seepage rate using both field
measures stabilized after two years at about .035 inches per day.
Agrarian commissioned a geotechnical report from URS in September 2001 to
evaluate soil conditions. The report of this investigation, submitted in December 2001
(URS 2001) estimates a seepage rate of about 0.0003 inches per day. This rate is two
orders of magnitude less than the rate observed in the unlined pond and in the
infiltrometer. The discrepancy indicates that the soil beneath the pilot ponds is not yet
charged with water, and the water loss rates we are seeing in the ponds is attributable not
to seepage in an equilibrium condition but to water moving into unsaturated soils directly
beneath the ponds.
The piezometer results confirm this interpretation. Although not especially useful
for evaluating rate of seepage, the piezometers have allowed for the evaluation of
differences in permeability of the pond floors over the relatively small distances of the
project. The piezometers also show that the overall rate of infiltration may be quite slow.
The piezometer evaluations show that although after two years of continuous operation,
water shows in all of the 5 foot and all of the 10 foot piezometers, there is no water found

9
Depth to Water, 5 foot Piezometers, Concentrator Ponds
-2
-1
0
1
2
3
4
5
Au
g
Oct
De
c
Fe
b
Ap
r
Jun
Au
g
Oct
De
c
Fe
b
Dep
th t
o W
ater
(Feet)
Pond 2
Pond 3
Pond 4
Pond 5
Depth to Water, 5 foot Piezometers, Crystallizer Ponds
-2
-1
0
1
2
3
4
5
Aug Oct
Dec
Feb Apr
Jun
Aug Oct
Dec
Feb
Dep
th t
o W
ate
r (f
ee
t)
Pond 6
Pond 8
Pond 9
Pond 10
Figure 2 A and B. Depth to water in the concentrator (upper) and crystallizer (lower)
ponds in the 5 foot piezometers, from August 2001 to February 2003.

10
10 foot Piezometers
Concentrator Ponds Depth to Water
-2
0
2
4
6
8
10
12
Au
g
Oct
De
c
Fe
b
Ap
r
Jun
Au
g
Oct
De
c
Fe
b
Fee
t
Pond 1
Pond 2
Pond 3
Pond 4
Pond 5
10 foot Piezometers
Crystallizer Ponds Depth to Water
-2
0
2
4
6
8
10
12
Au
g
Oct
De
c
Fe
b
Ap
r
Jun
Au
g
Oct
De
c
Fe
b
Fee
t
Pond 6
Pond 8
pond 9
pond 10
Figure 2 C and D. Depth to water in the 10 foot piezometers from August 2001 to
February 2003.
11
Change in Depth in Inch/Month
(June 2002 to March 2003)
piezometers
0.0
2.0
4.0
6.0
8.0
10.0
Pond
1
Pond
2
Pond
3
Pond
4
Pond
5
Pond
6
Pond
8
Pond
9
Pond
10
5 foot
10foot
Profile of 5 foot Piezometer
-2
-1
0
1
2
3
4
5
Pond
1
Pond
2
Pond
3
Pond
4
Pond
5
Pond
6
Pond
8
Pond
9
Pond
10
depth
to
wate
r (F
eet)
Mar-03Nov-02
May 2002Feb 2002
Jan 2002Sept 2001
Profile of 10 foot Piezometer
-2.0
0.0
2.0
4.0
6.0
8.0
10.0
12.0
Pond
1
Pond
2
Pond
3
Pond
4
Pond
5
Pond
6
Pond
8
Pond
9
Pond
10
dep
th t
o w
ate
r (F
eet)
Mar-03
Nov-02
March 2002
Feb 2002
Jan 2002
May 2002
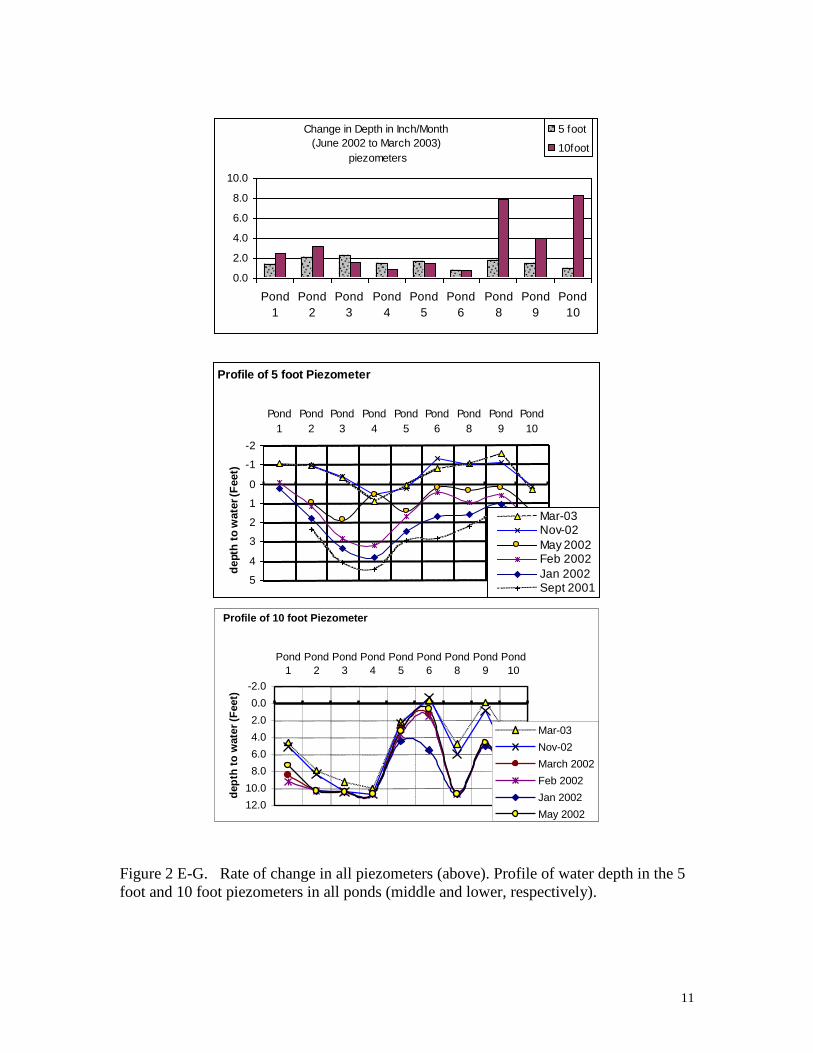
Figure 2 E-G. Rate of change in all piezometers (above). Profile of water depth in the 5
foot and 10 foot piezometers in all ponds (middle and lower, respectively).

12
in any of the 20 foot piezometers.
Piezometer data are charted in the above figures. The depth to water in the 5 foot
piezometers largely leveled off as of October 2002. Water level is above ground level
because the piezometers are responding to head upslope, as well as to the fact that in the
crystallizer ponds, the water level was stood at 8 inches above the salt bed, which in some
cases was almost two feet thick (Figure 2 A-D). The rate of change in depth to water
from month to month changes in these piezometers, which indicates that the soils are not
yet at equilibrium. Furthermore, the rate of change in depth varies from pond to pond,
indicating that there is considerable heterogeneity in the subfloor soils (Figure 2 E).
Finally, the profile of the water table shown in the piezometers across the site clearly
shows the nature of that heterogeneity (Figure 2 F and G) , as some areas consistently
have deeper water tables (Ponds 3, 4, and 8) , indicating a less permeable floor. There has
been no water found in the piezometers located outside the ponds, which indicates that
water is not moving very fast laterally through the undisturbed soil. We have been told
that a pond system can take up to several years to fully “condition” (David Butts, pers.
comm.) so the long-term seepage rate determined by the geotechnical evaluation may
well be the value that could ultimately be used for design.
The results from this portion of the project address items 3 and 4 from the list
above. They also provide the design data for bullet 4 in the second list.
5.3 EVAPORATION STUDY. We have collected evaporation data from the four
pans for 23 months, and have normalized and correlated those data with long-term
evaporation rates as calculated from CIMIS information reported from the site at
Calipatria. These data are summarized in Figures 3 and 4 below.
Average Monthly Evaporation
0.00
0.10
0.20
0.30
0.40
0.50
0.60
May-0
1
Ju
l-0
1
Sep
-01
Nov-0
1
Ja
n-0
2
Mar-
02
May-0
2
Ju
l-0
2
Sep
-02
Nov-0
2
Ja
n-0
3
Mar-
03
May-0
3
Inch
/Day
Pan FW
PAN SEA
PAN 2
PAN 3
Cimis
Figure 3. Evaporation rate in inches per day for each pan. CIMIS data are included.

13
Nested Evaporation Lines
0.00
0.10
0.20
0.30
0.40
0.50
0.60
1.000 1.050 1.100 1.150 1.200 1.250 1.300 1.350
SG
inch
es/d
ay
July-02
Jun-02
Aug-01
Sep-01
April-02
Oct-02
Mar-03
Feb-03
Dec-02
Figure 4. Evaporation rates for selected months of the project, shown for the range of
specific gravity in the evaporation pans.
Figure 3 shows that the evaporation rates predictably are higher in the summer
than in the winter, and the rates for the less concentrated water is higher than for
concentrated brines. CIMIS data are included as well, CIMIS values are always lower
than the measured values in the pans, as CIMIS reports an evapotranspiration value from
a vegetated site, which is lower than in either an open pond or a small pan. The
correlations of the CIMIS data and the pan data, however, have been shown to be
excellent, and the data were incorporated in the design model (See Appendix 4 for amore
complete explanation). In Figure 4, it can be seen that the difference between evaporation
rates for brines of various concentrations is greater during summer months than during
winter months.
We have also calculated the evaporation rate that would occur in ponds of various
concentrations, using a global pan:pond ratio of 0.71. This calculation is used in the
design model, and the method is detailed in Appendix 4.
Wind speed, rainfall, and maximum and minimum temperatures for the duration
of the study on a monthly basis are also reported in the Table 3 below.
Highest winds are reported in the spring months. Wind speeds are 24-hour
averages, so the wind speed at a given time may have greatly exceeded the reported
average. Wind directions were those primarily reported during the month, but wind
direction was in fact extremely variable.
These data combined address item 2 in the list above, and provide design data for
bullet 5 in the second list.

14
Month Max wind Min wind Direction Max temp Min temp
(mph) (mph) (primary) (deg. F) (deg. F)
Jan 12.6 1 NW 76 38
Feb 12.1 1.9 south 77 32
Mar 13.5 1.6 SW 91 44
April 14.6 2.5 SW 105 48
May 11.8 3.3 SW 117 54
June 8.7 3.2 south 122 68
July 7.0 1.8 south 119 77
Aug 9.7 2.8 south 118 68
Sept 8.2 1.9 south 117 67
Oct 11.1 1.5 E -> W 100 51
Nov 11.1 1.5 south 90 42
Dec 9.0 1.4 west 74 33
Table 3. Weather data collected from the soar pond site from 2001 – 2003. The
numbers represent the maximum and minimum values reported for each month over the
period of the project.
5.4 LABORATORY STUDIES. The brine and solid salt samples collected both from
the pilot pond project and from the Salton Sea Test Base (SSTB) site were analyzed by
the laboratory at the Bureau of Reclamation Denver Office. A table of all of the raw
results, including brine data and solid salt results is shown in Appendix 2. The solid salts
were collected simultaneously with brine samples, so the analyses together determine the
composition of these complex salts together with their entrained brine. These data were
used to develop pond deign parameters such as sizing and partitioning, as well as
predicting the complex salts that are to be expected from concentration of Salton Sea
brine.
Brine profiles change with season, as certain salts precipitate at different
temperatures. Salt production is very low during winter months, however, and the salts
(predominately hydrated forms of sodium sulfate) are re-absorbed by the brine in the
summer months, making the summer brine profile much more relevant to the
determination of salts produced (David Butts, pers. comm.). These are the profiles that
were used in the calculations for design purposes. The brine profile shown as well in
Appendix 2 is therefore for high temperature brines. The brine profile table includes
charts showing the relationship of the major ions to weight percent magnesium for these
samples.
These data address items 5, 6, and 10 in the list above, and provide for the bullets
2 and 3 in the second list.
The chemistry of the feed brine is also of importance, and it has been determined
at both the pilot pond and the SSTB sites. The feed brine quality is consistent at both
sites, as shown in Table 4 below. This is pertinent to the first bullet in the second list
above.

15
Location SG Cl % SO4 % Ca % Mg % Na % K %
SSTB 1.034 1.78 1.06 0.10 0.15 1.36 0.02
Niland 1.035 1.79 1.03 0.09 0.14 1.24 0.06
Table 4. Chemistry of the feed brine from the Salton Sea into the solar ponds, as
measured at two different locations.
5.5 MODELING AND DESIGN DATA. In order to form a solar pond design, the
following data are required:
Brine feed concentration
Brine concentration profiles
Brine phase chemistry
Leakage rate
Evaporation rate and other weather data
The brine feed concentration has been determined by analysis of Salton Sea brine,
and the brine is relatively constant at different locations (SSTB and Niland site) as was
shown above.
The brine concentration profiles were generated in the various laboratory
sequences. The brine concentration profiles are shown in Appendix 5 with weight percent
of the constituents of the brine as well as the concentration of the brine in mg/kg. This
table shows the entire series regardless of season of collection, including samples from
the SSTB site.
Brine phase chemistry shows stable salt phases at any concentration movement.
Complex salts forming at different concentrations can be calculated from the brine and
from the solid salt data developed from this project, as described above. The calculations
for complex salt formation were made by Agrarian, using methods developed by David
Butts.
The seepage or leakage rate over the long term is difficult to determine, as the
data collected by different methods were not consistent. Furthermore, field data indicate
that subsurface saturation of the pilot ponds is not yet complete, and the ponds may not
yet be in equilibrium for leakage. Nevertheless, in order to adopt a conservative
approach, we have used a leakage rate of .02 inches per day for the model presented here.
The evaporation rate data are presented as a function of brine concentration
(expressed in specific gravity and weight percent magnesium) and month of year. This
rate was calculated based on field data and correlations to CIMIS data and to long term
evaporation averages from the region. The relationship of fresh water pan data to CIMIS
is predictable. Since the relationship of concentration data to freshwater pan data is also
predictable, evaporation rate at any concentration and at any season can be predicted with
confidence based on reported CIMIS evapo-transpiration data.

16
6.2 POND DESIGN: Agrarian used the data described above to develop a
pond design for the removal of salt from Salton Sea brine. We used the methods
described and communicated to us by David Butts for the design effort. The details of the
model and the resulting design are detailed in three spreadsheets, and three explanatory
files, all of which are attached to this report as Appendix 4. The results of the model are
discussed and summarized here.
The summary model resulted from a design program called Pond_Partitions.xls,
which is a standard Excel file. A Word document that describes the program
accompanies that file. Contained in this design program are information on evaporation
and salt chemistry, which were derived in turn from other programs, which are also
provided. The file called Evaporation6.xls shows the details of how the evaporation data
used in the partitions file were generated. There are two additional files explaining this
program as well. Finally, the brine chemistry used in the design program is generated in
the Excel file titled SSBrine_2002.xls. The information contained in these files provides
full and transparent disclosure of the methods used to develop the design. There is no
proprietary information that is withheld, nor are there any hidden calculations or
assumptions. These files are of considerable technical importance, but their details are not
necessary for this discussion, so they will not be considered in depth here.
The pond partition model uses a concentrator series consisting of four ponds,
which feed a crystallizer pond array that is run in parallel. Since this project does not
require that salts be sorted for purity, each crystallizer can receive brine from the
concentrators at any time. The model permits specification of an area ratio, among other
parameters, and the model then calculates the area required for all ponds, as well as the
volume of brine that would be delivered to each pond. The concentrator ponds produce a
brine saturated in sodium chloride (NaCl), which is then fed into a crystallizer pond that
is allowed to precipitate and concentrate to magnesium sulfate (Mg SO4) saturation. This
brine then flows to a smaller magnesium sulfate pond where brine is maintained at a
steady state just below the bittern point, which is at 6.5% magnesium (Mg).
The optimum pond performance is encountered when the ponds are sized in step-
wise fashion, with the first concentrator pond at 47 percent of the total concentrator area.
Using four ponds of equal size reduces the efficiency by about 6 percent, which may be
unimportant if construction costs are substantially reduced by making equal sized ponds.
The ratio of concentrator to crystallizer is about 10.75:1, which is near published
recommendations for ocean water systems. The performance of the pilot pond system
showed this ratio to be correct.
The leakage rate used in the model was 0.02 inch/day. This model would then
predict that 383 tons of salt would be produced per acre of project per year.
The pilot ponds, based on pumping data, processed in 2,924 tons of salt on a
6.796 acre facility since its beginning operation in March 2002, as shown in the Table 5
below. Gallons are reported in millions. Values in blue are estimated.
Annual seepage losses are estimated at 36 tons per acre, or 245 tons, based on the
modeled rates. Tons presumably deposited, then are 394 tons of salt per acre of project
for the year reported (March 2002 – February 2003), which is a very close agreement
between pilot ponds and model.

17
Mar Apr May Jun Jul Aug Sept Oct Nov Dec
Jan Feb TOTAL
gal 1.51 1.75 0.57 2.20 2.68 2.26 1.49 1.34 0.75 0.43
0.77 0.69 16.44
af 4.63 5.37 1.75 6.75 8.22 6.94 4.57 4.10 2.29 1.31
2.35 2.12 50.41
tons 268.83 311.67 101.59 391.62 476.83 402.57 265.07 237.69 132.70 75.87
136.3 123.0 2923.74
Table 5. Pumping into the solar ponds at the Salton Sea. Data are in millions of gallons,
acre feet (1 acre foot = 325,828 gallons), and in tons of salt (based on brine of 44 ppt).
The model was then developed to simulate a project or module that would remove
one million tons of salt from the Sea on an annual basis. The optimum design would be as
shown in Figure 5, with a total acreage of 2,614 acres, of which 2,316 acres is
concentrators, 262 acres are crystallizers, and the bittern sump is 12 acres. The remaining
24 acres are utility areas and dikes. The system would remove 16,218 acre-feet (AF) per
year of brine from the Sea. The amount of bittern that is calculated to remain annually is
about 45 AF, all of which could be used for dust control on the roads associated with the
pond system.
An important aspect of the design is that it allows for the determination of flow
rates between each pond during different times of year. This feature allows for the design
of infrastructure elements as well as of pond construction. For example, the model
predicts that in June, the concentrators will require a flow of Salton Sea brine of about
17,000 gallons per minute (gpm), whereas in December the delivery will be reduced to
only 1,630 gpm. From the concentrators to the crystallizers, the flow would be 4,667 gpm
in July, and only 190 gpm in December. Such data are critical for a complete project
design.

18
Figure 5. Design and scaling for a one million ton salt removal facility at the Salton Sea.

19
7. FUTURE WORK
There remain two of the original objectives of the pilot pond study that have not
been fully met: issues 7 and 8. These issues relate to the quality and bulk density
characteristics of the salts produced in a solar evaporation facility. Although these data
were slated to be collected largely in the ponds at the SSTB site, the pilot ponds could
serve as a site for the generation of additional, or corroborative, data.
Solid salt collections for the evaluation of salt quality could be made at the pilot
ponds, after they have dried out. Any analyses of these salts would be made by the
laboratory at the Bureau of Reclamation. Bulk density is less of a concern at this point
than are the physical and structural characteristics of the salt generated in the solar ponds,
but we have developed a protocol for that as well, which is included in the appendix.
8. CONCLUSION
Agrarian produced for the Authority a fully functioning pilot pond system, as well
as a data set generated for a responsible design of a future solar evaporation pond project.
In addition, Agrarian constructed, at our own expense, modifications to the project that
were the result of early widely shared misconceptions about the proper design for the
project. These modifications allowed the pilot ponds to function for the additional
research that is currently under way, including biological monitoring.
Possibly one of the most important deliverables of this project, however, is the
fact that Agrarian took the salt pond design mathematics out of the “black box” and has
put the calculations into the light of day, where they can be used by independent
modelers to arrive at a consensus for design and infrastructure decisions. The Authority’s
continued work is no longer dependent on proprietary models. The information
generously made available by David Butts has served as the backbone for our programs
and calculations, which can now be used by professional modelers to arrive at responsible
designs that can be fully critiqued and examined by others.
Agrarian looks forward to the opportunity for continued participation in the use of
solar ponds for salt production.

20
REFERENCES CITED
Agrarian Research and Management Company. 2001. Laboratory Studies on Salton Sea
Brine: Chemistry and Area Relationships. Prepared for: Salton Sea Authority. Prepared
by: Agrarian Research and Management Company. December 2001.
Agrarian Research and Management Company. 2001-2002. Monthly reports on Salton
Sea Solar Pilot Pond Project. Prepared for: Salton Sea Authority. Prepared by: Agrarian
Research and Management Company. May 2001 – July 2002.
Butts, David. Theory and Practice of Extracting Minerals from Brine. Volume I. Solar
Ponds. Unpublished report by Great Salt Lake and Minerals Corporation for the People’s
Republic of China.
URS. 2001. Geotechnical Investigation: Evaporation Pond Pilot Study Salton Sea
Restoration Imperial County, California. Prepared for: Agrarian Research and
Management Company, URS Project No. 58-0011106.01-SIO1H. Prepared by: URS.
December 7, 2001.