AGING IN NC PRESENTATION - ABROWN 2015-09
52
AGING IN NORTH CAROLINA Allison Brown September 10, 2015
-
Upload
allison-brown -
Category
Documents
-
view
143 -
download
0
Transcript of AGING IN NC PRESENTATION - ABROWN 2015-09

AGING INNORTH CAROLINA
Allison BrownSeptember 10, 2015


10 8 6 4 2 0 2 4 6 8 10
0-4
5-9
10-14
15-19
20-24
25-29
30-34
35-39
40-44
45-49
50-54
55-59
60-64
65-69
70-74
75+
PERCENT OF TOTAL POPULATION
AGE
GRO
UP
Males Females
NORTH CAROLINA 1900

10 8 6 4 2 0 2 4 6 8 10
0-4
5-9
10-14
15-19
20-24
25-29
30-34
35-39
40-44
45-49
50-54
55-59
60-64
65-69
70-74
75+
PERCENT OF TOTAL POPULATION
AGE
GRO
UP
Males Females
2010NORTH CAROLINA

10 8 6 4 2 0 2 4 6 8 10
0-4
5-9
10-14
15-19
20-24
25-29
30-34
35-39
40-44
45-49
50-54
55-59
60-64
65-69
70-74
75+
PERCENT OF TOTAL POPULATION
AGE
GRO
UP
Males Females
2020NORTH CAROLINA

10 8 6 4 2 0 2 4 6 8 10
0-4
5-9
10-14
15-19
20-24
25-29
30-34
35-39
40-44
45-49
50-54
55-59
60-64
65-69
70-74
75+
PERCENT OF TOTAL POPULATION
AGE
GRO
UP
Males Females
2030N.C. IS AGING!

Baby Boomers
In 2015: 51-69 years old Have distinct social and demographic attributes Obtained more education Have more women in labor force More likely to occupy professional positions More racially and ethnically diverse Higher rates of divorce and separation Lower rates of marriage Fewer children Technology and social media users
- William H. Frey

NC 1990 – 2030: 177% Growth
-
2
4
6
8
10
12
1990 2000 2010 2020 2030
Mill
ions
Age 0-19 Age 20-59 Age 60+
6.6 M 8.0 M 9.6 M 10.7 M 11.7 M

Ranked 10th in Total Population
Rank StatePopulation
(millions)
1 California 382 Texas 263 New York 19.64 Florida 195 Illinois 12.96 Pennsylvania 12.87 Ohio 11.58 Georgia 9.99 Michigan 9.8
10 North Carolina 9.75

NC Age 60+ Has Greatest Growth
-
2,000,000
4,000,000
6,000,000
8,000,000
10,000,000
12,000,000
1990 2000 2010 2020 2030
Age 0-19 Age 20-59 Age 60+
16%
25%
269%
28% 25%
157%
56%50%
159%

Ranked 9th in Age 65+ Population
Rank StatePopulation
(millions)
1 California 4.42 Florida 3.43 Texas 2.74 New York 2.65 Pennsylvania 2.06 Ohio 1.67 Illinois 1.68 Michigan 1.4
9 North Carolina 1.310 New Jersey 1.2

NC Age 85+ Has Greatest Growth Rate
0.0
0.5
1.0
1.5
2.0
2.5
3.0
1990 2000 2010 2020 2030
Mill
ions
Age 60-64 Age 65-74 Age 75-84 Age 85+
69K
260K378%

Ranked 10th in Age 85+ Population
Rank StatePopulation
(000,000s)
1 California 6012 Florida 4343 New York 3914 Pennsylvania 3065 Texas 3056 Illinois 2357 Ohio 2308 Michigan 1929 New Jersey 180
10 North Carolina 147

10 Largest Counties
Rank County Population
1 Mecklenburg 962,5932 Wake 945,1433 Guilford 501,0584 Forsyth 357,4835 Cumberland 331,2796 Durham 280,9217 Buncombe 245,2288 New Hanover 209,8469 Gaston 208,70410 Union 207,896

High Growth Counties
1990—2010
Rank County %
Change
1 UNION 140%2 WAKE 113%3 BRUNSWICK 112%4 JOHNSTON 109%5 HOKE 108%
2010—2030
Rank County %
Change1 DURHAM 52%2 HOKE 52%3 HARNETT 49%4 MECKLENBURG 47%5 WAKE 46%

Low Growth Counties
1990—2010
Rank County %
Change
1 WASHINGTON -6%2 MARTIN -2%3 HALIFAX -2%4 EDGECOMBE 0%5 LENOIR 4%
2010—2030
Rank County % Change
1 NORTHAMPTON -21%2 ALLEGHANY -17%3 TYRRELL -14%4 MARTIN -13%5 GATES -12%

Age 65+ High Growth Counties
1990—2010
Rank County %
Change
1 BRUNSWICK 215%2 UNION 144%3 WAKE 135%4 CHATHAM 112%5 ONSLOW 111%
2010—2030
Rank County %
Change
1 WAKE 176%2 HOKE 159%3 MECKLENBURG 145%4 ORANGE 142%5 CHATHAM 132%

Age 65+ Low Growth Counties
1990—2010
Rank County %
Change
1 HYDE -2%2 ANSON 7%3 RICHMOND 7%4 TYRRELL 8%5 HALIFAX 13%
2010—2030
Rank County % Change
1 NORTHAMPTON -1%2 ALLEGHANY 17%3 POLK 19%4 MITCHELL 20%5 CRAVEN 22%

Centenarians
2010Rank County #
1 MECKLENBURG 1332 WAKE 943 GUILFORD 834 FORSYTH 775 BUNCOMBE 74
STATE 1,512
2030 Rank County #
1 WAKE 5772 MECKLENBURG 5343 GUILFORD 2884 BUNCOMBE 1895 FORSYTH 186
STATE 4,853
New
Alexander
AlleghanyAshe
Avery
BuncombeBurke
Cabarrus
Caldwell
Catawba
CherokeeCleveland
Davie
GastonGraham
Haywood
Henderson
Iredell
Jackson
McDowell
Macon
Madison
Mecklenburg
Mitchell
Polk
Rowan
Rutherford
Surry
Swain
Union
Watauga WilkesYadkin
Yancey
ClayTransylvania
Lincoln
Granville
NashAlamance
Anson
Bladen
Caswell
Chatham
Columbus
Cumberland
Davidson
Durham
Forsyth FranklinGuilford
Harnett
Hoke
JohnstonLee
Montgomery Moore
Orange
Person
Randolph
Richmond
Robeson
Rockingham
Sampson
Scotland
Stanly
StokesVance
Wake
Warren
Beaufort
Bertie
Carteret
Chowan
Craven
Dare
Duplin
Edgecombe
Gates
Greene
Halifax Hertford
Hyde
Jones
Lenoir
Martin
Hanover
Northampton
Onslow
Pamlico
Pasquotank
Pender
Perquimans
Pitt
Tyrrell
Brunswick
Washington
Wayne
Wilson
CamdenCurrituck
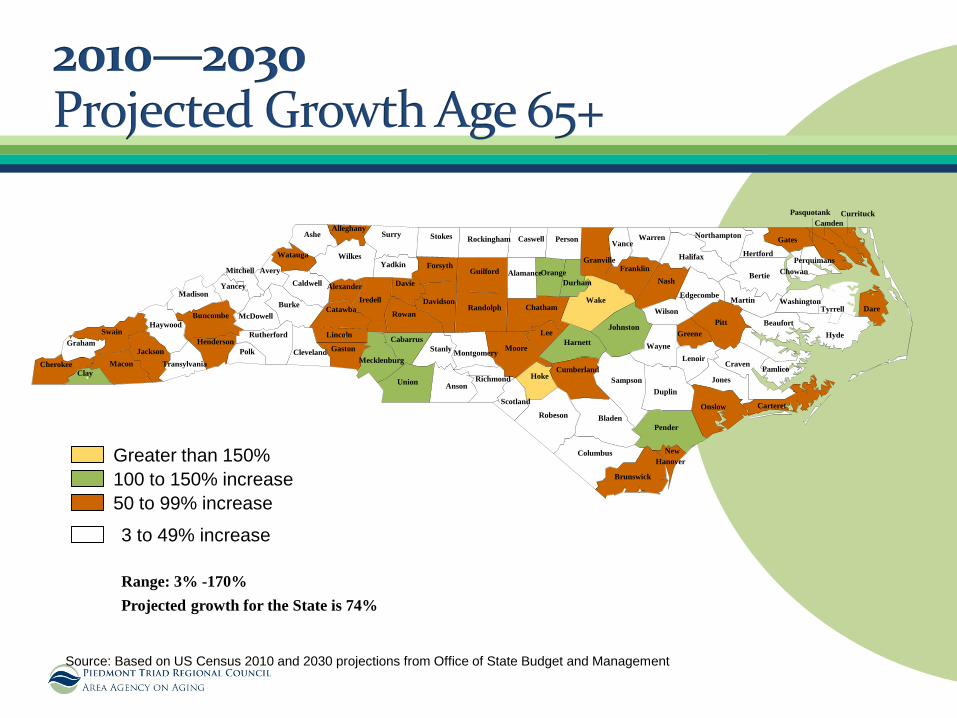
Greater than 150%100 to 150% increase50 to 99% increase
Source: Based on US Census 2010 and 2030 projections from Office of State Budget and Management
Range: 3% -170%
3 to 49% increase
Projected growth for the State is 74%

Counties with more age 60+ than age 0-17 (43)
Counties with more age 0-17 than age 60+ (57)Source: US Census 2010
New
Alexander
AlleghanyAshe
Avery
BuncombeBurke
Cabarrus
Caldwell
Catawba
CherokeeCleveland
Davie
GastonGraham
Haywood
Henderson
Iredell
Jackson
McDowell
Macon
Madison
Mecklenburg
Mitchell
Polk
Rowan
Rutherford
Surry
Swain
Union
Watauga WilkesYadkin
Yancey
ClayTransylvania
Lincoln
Granville
NashAlamance
Anson
Bladen
Caswell
Chatham
Columbus
Cumberland
Davidson
Durham
Forsyth FranklinGuilford
Harnett
Hoke
JohnstonLee
Montgomery Moore
Orange
Person
Randolph
Richmond
Robeson
Rockingham
Sampson
Scotland
Stanly
StokesVance
Wake
Warren
Beaufort
Bertie
Carteret
Chowan
Craven
Dare
Duplin
Edgecombe
Gates
Greene
Halifax Hertford
Hyde
Jones
Lenoir
Martin
Hanover
Northampton
Onslow
Pamlico
Pasquotank
Pender
Perquimans
Pitt
Tyrrell
Brunswick
Washington
Wayne
Wilson
CamdenCurrituck

Counties with more 60+ than 0-17 (86)
Counties with more 0-17 than 60+ (14)
New
Alexander
AlleghanyAshe
Avery
BuncombeBurke
Cabarrus
Caldwell
Catawba
CherokeeCleveland
Davie
GastonGraham
Haywood
Henderson
Iredell
Jackson
McDowell
Macon
Madison
Mecklenburg
Mitchell
Polk
Rowan
Rutherford
Surry
Swain
Union
Watauga WilkesYadkin
Yancey
ClayTransylvania
Lincoln
Granville
NashAlamance
Anson
Bladen
Caswell
Chatham
Columbus
Cumberland
Davidson
Durham
Forsyth FranklinGuilford
Harnett
Hoke
JohnstonLee
Montgomery Moore
Orange
Person
Randolph
Richmond
Robeson
Rockingham
Sampson
Scotland
Stanly
StokesVance
Wake
Warren
Beaufort
Bertie
Carteret
Chowan
Craven
Dare
Duplin
Edgecombe
Gates
Greene
Halifax Hertford
Hyde
Jones
Lenoir
Martin
Hanover
Northampton
Onslow
Pamlico
Pasquotank
Pender
Perquimans
Pitt
Tyrrell
Brunswick
Washington
Wayne
Wilson
CamdenCurrituck

Source: US Census 2010
“Younger” and “Older” Counties
0%
10%
20%
30%
40%
50%
60%
70%
80%
90%
2010 2025
YoungerOlder

Race & Ethnicity Age 60+
80.5%
16.4%
0.9% 1.1% 1.2% 0.5% White
African American
American Indian
Asian
Hispanic / Latino
Other ethnicity

2010 Hispanic / Latino
Total population – 800,120 80% of the total population is 0-40 years 61% is Mexican Age 60 and over – 27,339 (3.4%) 77% of people 65 and over live in family
households 241 people 65 and over in group quarters

• 98,634 grandparents age 30+
• Responsible for 100,577 grandchildren under age 18
• 23% with income below poverty
• 36% in labor force• NC ranks 7th nationally in
grandparents responsible for grandchildren under 18
ACS
Age 30-64
68%
Age 65+32%

Source: US Census 2010
Women Outnumber Men
0%
10%
20%
30%
40%
50%
60%
70%
65+ 85+
MalesFemales

Source: ACS 2006-2010
Marital Status Age 65+
30%
35%
19%
4% 12%Married
Widowed
Divorced
Separated
NeverMarried

Source: ACS 2006-2010
47%
67%
90%
25%30%
50%
Age 65-74 Age 75-84 Age 85+
Unmarried Women Unmarried Men
2010 Marital Status and Gender

Source: ACS 2006-2010
Age 65+ Education Levels
28%
32%
17%
4% 11%
8%< High School
High School / GED /EquivalentSome College
Associate's Degree
Bachelor's Degree
Graduate orProfessional Degree


Availability of Caregivers
0.0
0.5
1.0
1.5
2.0
2.5
3.0
3.5
4.0
1990 2000 2010 2020 2030
Mill
ions
45-64 Primary Caregiving Years Age 75-84 Age 85+
1 : 191 : 17
1 : 171 : 14
1 : 11

Availability of Nursing Home Beds
0.0
0.5
1.0
1.5
2.0
2.5
3.0
3.5
4.0
1990 2000 2010 2020 2030
Mill
ions
45-64 Primary Caregiving Years Age 75-84 Age 85+
1 : 71 : 10
1 : 131 : 16
1 : 24

Costs of Services for Seniors
2%
82%
7% 9%
DHHS Expenditures 2015DOT 0.2%
DAAS 2.3%
DMA 81.6%
Mental Health 6.9%
Services for the Blind0.04%DSS 8.7%
Voc Rehab 0.2%

2010 Poverty Status
9%13%
21%
30%
Age 65-74 Age 75+
Below Poverty Level 100-199% of Poverty Level
2015 PL = $11,670

2010 EmploymentPersons age 65 and over in civilian labor
force (as % of age group) 14.3%
Most people 65 and over retire (social security, pensions, savings)
Some work out of economic necessity
Others for social contact, intellectual challenges or sense of value
The difference between labor force participation in men and women has narrowed over time

2010 Life Expectancy
People are living longer than ever before.
Women live longer than men.
Increasing longevity -rising medical costs & increasing demands for health services
Life expectancy varies between gender and race
Age Groups NC60-64 22.765-69 18.870-74 15.375-79 12.080-84 9.285+ 6.8

Living Arrangements Age 65+
65%9%
22%
4%FamilyHouseholdLiving Alone -MenLiving Alone -WomenGroup Quarters

Leading Causes of Death 2010
Rank Cause
1 Heart disease
2 Cancer
3 Chronic lower respiratory diseases
4 Cerebrovascular diseases
5 Alzheimer’s disease

Leading Cause of Injury Death
FALLS

Additional Characteristics Age 65+
23% are veterans 270,032 82% own their homes 29% live aloneMedian household income is
$35,237
Source: US Census Bureau, ACS 2007-2011

16.3% 22.1%
61.6%
0%
10%
20%
30%
40%
50%
60%
70%
One disability Two or moredisabilities
No disability
Source: ACS 2010, 1 year estimate
Age 65+ Disabilities

2010 Disability Characteristics
Population 65 and over with a disability 38.4%With an ambulatory difficulty 25.6%With an independent living difficulty 16.7%With a hearing difficulty 15.8%With a cognitive difficulty 10.4%With a self-care difficulty 9.2%With a vision difficulty 7.9%
Source: ACS 2010, 1 year estimate

Source: State Center for Health Statistics, 2010
10%
25%
33%
21%
11%
0%
5%
10%
15%
20%
25%
30%
35%
Excellent Very Good Good Fair Poor

Source: http://www.alz.org/alzheimers_disease_facts_and_figures.asp
-50%
-30%
-10%
10%
30%
50%
70%Breast Cancer -2%Prostate Cancer-8%Heart Disease -16%Stroke -23%
HIV -42%
Alzheimer's+68%

Hunger
N.C. Food Insecurity Rating of 16.9% of age 60+ Ranked 12th nationally for Senior Hunger (down
from 9th in 2010) Seniors are more likely to be food insecure if they Live in a southern stateAre youngerLive with a grandchildAre African AmericanAre Hispanic

Elder Care Workforce
Research studies agree:Drastic workforce shortages will occur in the jobs most critical for elder care over next 20-30 years:• Personal Care Aides• Home Care Aides• Nurses• Physicians

High Growth Projected in Healthcare Occupations
Projected 2012-2022• Healthcare Support
Occupations: 28.1%• Healthcare Practitioners &
Technical: 21.5%• Personal Care & Service:
20.9%

Implications for Seniors
• Living Arrangements:“Communal Art Colonies”
• Manufacturing:Senior-specific products
• Technology:Senior-friendly devices
• Primary Care:Health centers and clinics administered by nurses
• Assisted living:Younger seniors caring for older seniors
• Lifestyle:Preventive measures

Aging in Place ● Aging With Choice
In-Home Aide Services Nutrition Transportation Caregiver Respite Socialization Healthy Living End-of-Life Planning

Importance of Aging Demographics
Targeting the need for senior adult servicesWhere?Who?
Identifying gaps in services Anticipating future needs for services Providing “proof” of the needs – grant
writing

Aging Resources
Allison Brown [email protected]
NC DHHS DAAShttp://ncdhhs.gov/aging/
AARP: www.aarp.org“Policy and Research”