Agenda Item No. 18-09-17
30
Agenda Item No. 18-09-17 Date: September 28, 2018 File Number: 8000180 Memo to: Board of Directors From: Kim Kawada, Chief Deputy Executive Director Subject: Overview of Developments in the Financial Markets, Quarterly Finance Report, and Annual Interest Rate Swap Evaluation for the Period Ending June 30, 2018 Introduction Staff provides quarterly briefings on the latest developments in the financial markets, economy, sales tax revenues, and the strategies being explored and implemented to minimize possible impacts to the TransNet Program; and a quarterly report on investments as required per Board Policy No. 003: Investment Policy. In addition, Board Policy No. 032: San Diego County Regional Transportation Commission Interest Rate Swap Policy, requires that a written description of the swaps and an evaluation of the risks associated with outstanding interest rate swaps be presented to the Board on an annual basis. Discussion Market Review and Update Overview More than half way through the third quarter, the treasury yield curve remains near its flattest level in more than a decade. The Federal Open Market Committee (FOMC) rate increases have driven short-term rates higher. However, long-term rates have not increased quite as dramatically. Concerns about escalation of trade disputes, emerging market currency risks, and a waning of fiscal stimulus sustained demand for longer- term paper, keeping long-term rates low. After a volatile first quarter, the U.S. equity markets stabilized, and the bull market continued, marking the longest bull run in history for equity markets. S&P-500 reached all- time highs yet again in August. This is in part buoyed by strong earnings from the corporate tax breaks as well as robust consumer demand. For August, the S&P 500 is up 2.1 percent, and up 7.5 percent for the year. The first estimate for second-quarter Gross Domestic Product (GDP) growth breached 4 percent for the first time since the third quarter of 2014. A strong rebound in consumer spending, sustained business investment, strong federal government defense spending, and a surge in exports (before certain tariffs became effective) boosted economic expansion to a 4.1 percent annual rate. Across the pond, Eurozone GDP slowed further in the second quarter, after a weak first quarter. Rising inflation, falling consumer sentiment, and a strengthening U.S. dollar (USD) weighed on consumer spending in the region. In a surprisingly unanimous decision, the Bank of England raised its benchmark interest rate for only the second time in a decade, as inflation worries trumped concerns about Brexit.
Transcript of Agenda Item No. 18-09-17

Agenda Item No. 18-09-17
Date: September 28, 2018
File Number: 8000180
Memo to: Board of Directors
From: Kim Kawada, Chief Deputy Executive Director
Subject: Overview of Developments in the Financial Markets, Quarterly Finance Report, and Annual Interest Rate Swap Evaluation for the Period Ending June 30, 2018
Introduction
Staff provides quarterly briefings on the latest developments in the financial markets, economy, sales tax
revenues, and the strategies being explored and implemented to minimize possible impacts to the TransNet
Program; and a quarterly report on investments as required per Board Policy No. 003: Investment Policy.
In addition, Board Policy No. 032: San Diego County Regional Transportation Commission Interest Rate Swap
Policy, requires that a written description of the swaps and an evaluation of the risks associated with
outstanding interest rate swaps be presented to the Board on an annual basis.
Discussion
Market Review and Update
Overview
More than half way through the third quarter, the treasury yield curve remains near its flattest level in more
than a decade. The Federal Open Market Committee (FOMC) rate increases have driven short-term rates
higher. However, long-term rates have not increased quite as dramatically. Concerns about escalation of
trade disputes, emerging market currency risks, and a waning of fiscal stimulus sustained demand for longer-
term paper, keeping long-term rates low. After a volatile first quarter, the U.S. equity markets stabilized, and
the bull market continued, marking the longest bull run in history for equity markets. S&P-500 reached all-
time highs yet again in August. This is in part buoyed by strong earnings from the corporate tax breaks as
well as robust consumer demand. For August, the S&P 500 is up 2.1 percent, and up 7.5 percent for the
year.
The first estimate for second-quarter Gross Domestic Product (GDP) growth breached 4 percent for the first
time since the third quarter of 2014. A strong rebound in consumer spending, sustained business investment,
strong federal government defense spending, and a surge in exports (before certain tariffs became effective)
boosted economic expansion to a 4.1 percent annual rate. Across the pond, Eurozone GDP slowed further in
the second quarter, after a weak first quarter. Rising inflation, falling consumer sentiment, and a
strengthening U.S. dollar (USD) weighed on consumer spending in the region. In a surprisingly unanimous
decision, the Bank of England raised its benchmark interest rate for only the second time in a decade, as
inflation worries trumped concerns about Brexit.

3
At the FOMC August meeting, the officials voted to leave the target federal funds rates unchanged but
hinted at a rate hike at the September meeting, with more to follow. Officials will continue to monitor
inflation, among other indicators, in determining when next to raise rates. Based on projection materials
released with the August statement, the vast majority of FOMC officials anticipate at least one more rate hike
in 2018, and over half expect at least two more.
Since the start of the year, the AAA Municipal Market Data (MMD) index (industry-accepted index for tax-
exempt bonds) rose by 46 basis points (bps), or .46 percent. The current 30-year AAA MMD bond yield is still
relatively low, at 3 percent.
0.00%
0.50%
1.00%
1.50%
2.00%
2.50%
3.00%
3.50%
1-Y
ear
2-Y
ear
3-Y
ear
4-Y
ear
5-Y
ear
6-Y
ear
7-Y
ear
8-Y
ear
9-Y
ear
10
-Yea
r
11
-Yea
r
12
-Yea
r
13
-Yea
r
14
-Yea
r
15
-Yea
r
16
-Yea
r
17
-Yea
r
18
-Yea
r
19
-Yea
r
20
-Yea
r
21
-Yea
r
22
-Yea
r
23
-Yea
r
24
-Yea
r
25
-Yea
r
26
-Yea
r
27
-Yea
r
28
-Yea
r
29
-Yea
r
30
-Yea
r
12/30/2016 6/30/2017 12/29/2017 Current (8/24/2018)
AAA MMD Yield Curve Movement
1.75%
2.00%
2.25%
2.50%
2.75%
3.00%
3.25%
3.50%
-20 bps
-15 bps
-10 bps
-5 bps
0 bps
5 bps
10 bps
15 bps
20 bps
25 bps
Increase from Previos Day (Left Axis)
Decrease from Previous Day (Left Axis)
30-Year AAA MMD (Right Axis)
1.00%
2.00%
3.00%
4.00%
5.00%
6.00%
7.00%
8.00%
30 Year MMD
Benchmark Tax-Exempt Rate History
(January 4, 1993 to August 24, 2018)Benchmark Tax-Exempt Rate History
(September 1, 2016 to August 24, 2018)
4
Municipal Market Supply 1
Total year-to-date tax-exempt municipal bond
supply for 2018 is $166.2 billion, down
16 percent from calendar year 2017. The new tax
legislation, which was passed last December and
became effective in January, eliminated the ability
to advance refund bonds on a tax-exempt basis.
Over the last decade, advance refundings
constituted roughly 20 percent of the tax-exempt
market, and market participants expect about a
10 percent to 15 percent decline in volume over
the next few years due to the loss of tax-exempt
advance refundings.
Interest Rate Forecasts
The table below provides an average of interest rate forecasts by industry professionals. These are surveyed
and compiled by Bloomberg. The two-year United States Treasury (UST) rate is forecast to increase to
2.83 percent by the end of 2018. The ten-year UST rate is forecast to increase to 3.09 percent by the end of
2018. The 30-year UST rate is forecast to increase to 3.3 percent by the end of 2018.
The Street’s Interest Rate Forecast 2
Forecast 8/24/18 Q3 18 Q4 18 Q1 19 Q2 19 Q3 19 Q4 19 Q1 20
30-Year UST 2.99% 3.19% 3.30% 3.39% 3.47% 3.53% 3.61% 3.69%
10-Year UST 2.85% 2.97% 3.09% 3.19% 3.26% 3.31% 3.37% 3.42%
2-Year UST 2.64% 2.68% 2.83% 2.94% 3.04% 3.12% 3.18% 3.21%
3M London Interbank Offered Rate
2.32% 2.43% 2.63% 2.79% 2.97% 3.07% 3.13% 3.14%
Federal Funds Target Rate Upper Bound
2.00% 2.25% 2.50% 2.70% 2.90% 3.00% 3.10% 3.05%
Federal Funds Target Rate Lower Bound
1.75% 1.99% 2.23% 2.44% 2.64% 2.77% 2.82% 2.78%
1 Issuance data from The Bond Buyer 2 Bloomberg survey compilation as of August 24, 2018
$0
$5
$10
$15
$20
$25
$30
$35
$40
Jan Feb Mar Apr May Jun Jul
Billio
ns
2017 2018
Issuance Volume

5
Debt Portfolio Overview and Update
Outstanding Debt Overview
On April 18, 2018, the San Diego County Regional Transportation Commission (Commission) issued the
Series 2018A Short Term Notes (Notes), with a total par of $537.5 million. The Notes mature in 2021 and
have an all-in borrowing cost of 1.85 percent. Interest on the Notes will be repaid from TransNet revenues,
while the principal will be repaid by drawing on the Transportation Infrastructure Finance and Innovation Act
(TIFIA) loan. The Notes will serve as interim financing for the Mid-Coast Corridor Transit Project, allowing the
Commission to fund ongoing capital expenses at a borrowing cost lower than the TIFIA loan’s already
favorable 2.72 percent.
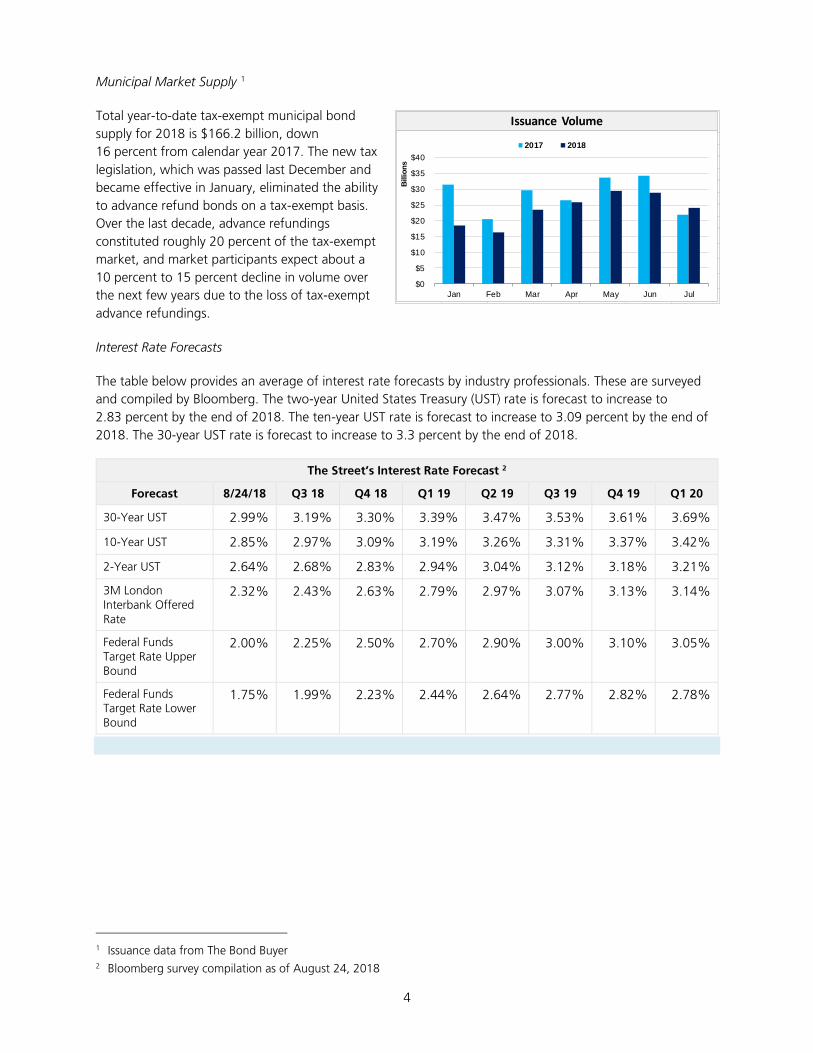
Currently, the loan is undrawn and does not represent an obligation of SANDAG at this time. While the TIFIA
loan remains undrawn, the Commission has $2.26 billion of outstanding long-term debt, including the
recently issued Notes. Of the total debt portfolio, 18 percent consists of synthetic, fixed-rate bonds
(variable-rate bonds hedged with fixed-payer interest rate swaps), and the remaining 82 percent are fixed-
rate bonds. A summary of the outstanding bonds is tabulated and graphically presented below.
Summary of Outstanding Debt
Series Tax Status Coupon Type Original Issue Size Outstanding Par Call Option Final
Maturity
2008A Tax-Exempt Variable-Rate $150,000,000 $100,575,000 Current 4/1/2038
2008B Tax-Exempt Variable-Rate $150,000,000 $100,575,000 Current 4/1/2038
2008C Tax-Exempt Variable-Rate $150,000,000 $100,575,000 Current 4/1/2038
2008D Tax-Exempt Variable-Rate $150,000,000 $100,575,000 Current 4/1/2038
2010A Taxable BABs Fixed-Rate $338,960,000 $338,960,000 Make-Whole 4/1/2048
2010B Tax-Exempt Fixed-Rate $11,040,000 $6,235,000 4/1/2020 4/1/2030
2012A Tax-Exempt Fixed-Rate $420,585,000 $324,400,000 4/1/2022 4/1/2048
2014A Tax-Exempt Fixed-Rate $350,000,000 $336,130,000 4/1/2024 4/1/2048
2016A Tax-Exempt Fixed-Rate $325,000,000 $317,680,000 4/1/2026 4/1/2048
2018A
Notes Tax-Exempt Fixed-Rate $537,480,000 $537,480,000 Non-Callable 4/1/2021
Total $2,263,185,000
Summary of TIFIA Loan Commitment
Series Tax Status Coupon Type Original Issue Size Outstanding Par Call Option Final
Maturity
TIFIA* Taxable Fixed-Rate $537,484,439 $537,484,439 Anytime 10/1/2045
Total with Loan Commitment
$2,263,189,439
* The TIFIA loan will be drawn upon in 2021 to retire the 2018A Notes. The simultaneous draw on the TIFIA
loan and the retirement of the 2018A Notes will have an offsetting impact and will not increase the
amount of total obligations outstanding.
6
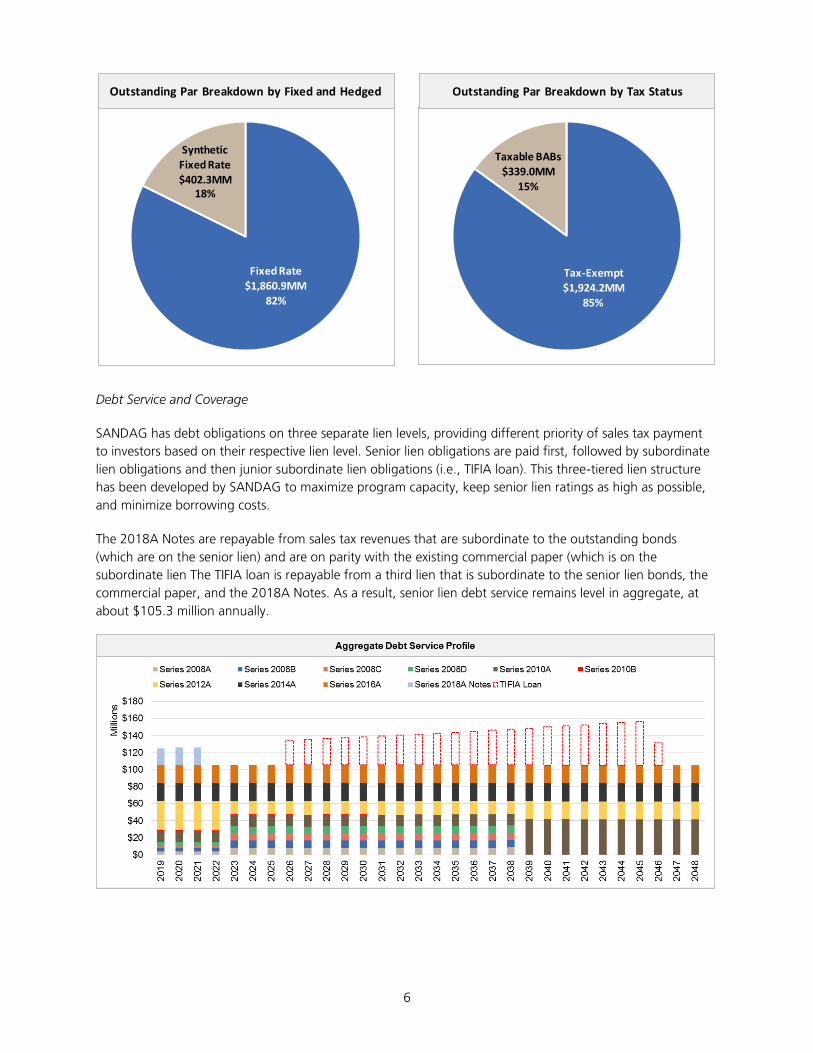
Debt Service and Coverage
SANDAG has debt obligations on three separate lien levels, providing different priority of sales tax payment
to investors based on their respective lien level. Senior lien obligations are paid first, followed by subordinate
lien obligations and then junior subordinate lien obligations (i.e., TIFIA loan). This three-tiered lien structure
has been developed by SANDAG to maximize program capacity, keep senior lien ratings as high as possible,
and minimize borrowing costs.
The 2018A Notes are repayable from sales tax revenues that are subordinate to the outstanding bonds
(which are on the senior lien) and are on parity with the existing commercial paper (which is on the
subordinate lien The TIFIA loan is repayable from a third lien that is subordinate to the senior lien bonds, the
commercial paper, and the 2018A Notes. As a result, senior lien debt service remains level in aggregate, at
about $105.3 million annually.
Tax-Exempt$1,924.2MM
85%
Taxable BABs
$339.0MM15%
Fixed Rate
$1,860.9MM82%
Synthetic Fixed Rate$402.3MM
18%
Outstanding Par Breakdown by Fixed and Hedged Outstanding Par Breakdown by Tax Status

7
Assuming SANDAG draws on the TIFIA loan as expected to complete the Mid-Coast Corridor Transit Project,
SANDAG aggregate debt service will peak at $163.3 million in FY 2045. Senior lien debt service coverage,
using sales tax receipts of $294.5 million for the last 12 months ending June 30, 2018, is 2.80 times.
Meaning, for every $1 of senior lien debt service, SANDAG received $2.80 of sales tax revenue providing
ample coverage, supporting SANDAG senior lien triple-A ratings. Total coverage, when comparing the last
12 months of revenues to peak debt service (including assumed debt service on the undrawn TIFIA loan) in
FY 2045, is 1.80 times.
Major Corridors Coverage
In accordance with the TransNet Ordinance, the Major Corridors subprogram receives 38 percent of TransNet
revenues after allocations for administrative and ITOC expenses. Major Corridors is the most capital-intensive
program, funding various projects, including the Mid-Coast Corridor Transit Project. Costs associated with
these projects can and have been funded with tax-exempt bonds. SANDAG Board Policy No. 036: San Diego
County Regional Transportation Commission Debt Policy, dictates that the Major Corridors subprogram (and
other TransNet subprograms) maintain an annual debt service coverage ratio of at least 1 times, meaning that
for every $1 of TransNet revenue, there is no more than $1 of debt service allocated to the subprogram in
any given year. Board Policy No. 036, Section 2.3, states as follows:
2.3 Borrowing requirements are determined for each eligible sub-program and debt service is allocated
to each sub-program based upon its pro rata share of bond proceeds. It is the general principal for the
TransNet Plan of Finance that the annual debt service for each sub-program be less than the annual
sales tax revenue allocated to a sub-program on an annual basis. This 1.0x program debt service
coverage requirement ensures that no single sub-program incurs more debt than it can afford.
For planning purposes, debt service has been structured using a forecast of sales tax receipts. Based on this
forecast, following the issuance of the Notes, coverage in the Major Corridors Program is projected to drop to
1.01 times in FY 2019 and 1.06 times in FY 2020 based on the latest Plan of Finance. Annual coverage
rebounds after the retirement of the notes in FY 2021 and is 1.18 times when the TIFIA loan begins to
amortize in FY 2026. The TIFIA debt service structure in the Major Corridors Program increases over time, in
anticipation of increased sales tax revenue.
8
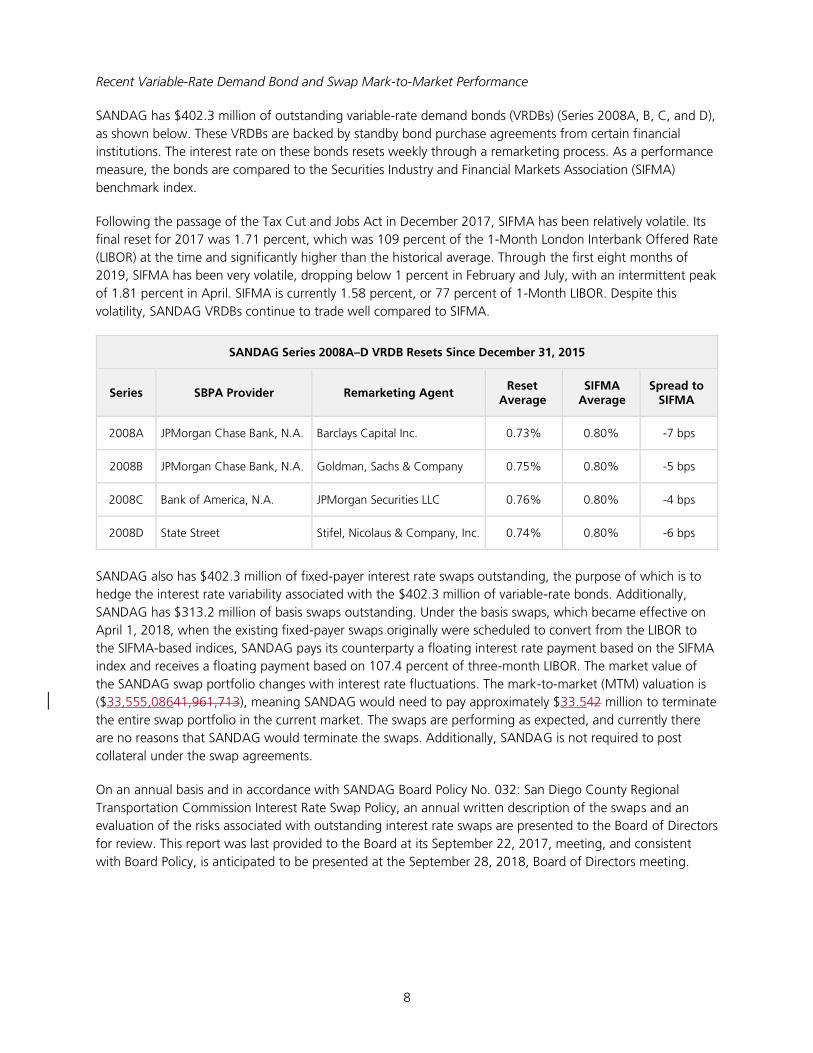
Recent Variable-Rate Demand Bond and Swap Mark-to-Market Performance
SANDAG has $402.3 million of outstanding variable-rate demand bonds (VRDBs) (Series 2008A, B, C, and D),
as shown below. These VRDBs are backed by standby bond purchase agreements from certain financial
institutions. The interest rate on these bonds resets weekly through a remarketing process. As a performance
measure, the bonds are compared to the Securities Industry and Financial Markets Association (SIFMA)
benchmark index.
Following the passage of the Tax Cut and Jobs Act in December 2017, SIFMA has been relatively volatile. Its
final reset for 2017 was 1.71 percent, which was 109 percent of the 1-Month London Interbank Offered Rate
(LIBOR) at the time and significantly higher than the historical average. Through the first eight months of
2019, SIFMA has been very volatile, dropping below 1 percent in February and July, with an intermittent peak
of 1.81 percent in April. SIFMA is currently 1.58 percent, or 77 percent of 1-Month LIBOR. Despite this
volatility, SANDAG VRDBs continue to trade well compared to SIFMA.
SANDAG Series 2008A–D VRDB Resets Since December 31, 2015
Series SBPA Provider Remarketing Agent Reset
Average SIFMA
Average Spread to
SIFMA
2008A JPMorgan Chase Bank, N.A. Barclays Capital Inc. 0.73% 0.80% -7 bps
2008B JPMorgan Chase Bank, N.A. Goldman, Sachs & Company 0.75% 0.80% -5 bps
2008C Bank of America, N.A. JPMorgan Securities LLC 0.76% 0.80% -4 bps
2008D State Street Stifel, Nicolaus & Company, Inc. 0.74% 0.80% -6 bps
SANDAG also has $402.3 million of fixed-payer interest rate swaps outstanding, the purpose of which is to
hedge the interest rate variability associated with the $402.3 million of variable-rate bonds. Additionally,
SANDAG has $313.2 million of basis swaps outstanding. Under the basis swaps, which became effective on
April 1, 2018, when the existing fixed-payer swaps originally were scheduled to convert from the LIBOR to
the SIFMA-based indices, SANDAG pays its counterparty a floating interest rate payment based on the SIFMA
index and receives a floating payment based on 107.4 percent of three-month LIBOR. The market value of
the SANDAG swap portfolio changes with interest rate fluctuations. The mark-to-market (MTM) valuation is
($33,555,08641,961,713), meaning SANDAG would need to pay approximately $33.542 million to terminate
the entire swap portfolio in the current market. The swaps are performing as expected, and currently there
are no reasons that SANDAG would terminate the swaps. Additionally, SANDAG is not required to post
collateral under the swap agreements.
On an annual basis and in accordance with SANDAG Board Policy No. 032: San Diego County Regional
Transportation Commission Interest Rate Swap Policy, an annual written description of the swaps and an
evaluation of the risks associated with outstanding interest rate swaps are presented to the Board of Directors
for review. This report was last provided to the Board at its September 22, 2017, meeting, and consistent
with Board Policy, is anticipated to be presented at the September 28, 2018, Board of Directors meeting.

9
Swap Portfolio Overview
Associated Series
SANDAG Pays
SANDAG Receives
Trade Date
Effective Date
Maturity Date
MTM Value (As of 98/1824/2018)
Notional Outstanding
Bank Counterparty
Series 2008 3.8165% SIFMA Swap Index
5/23/2012 5/23/2012 4/1/2038 ($19,931,45522,476,556) $134,100,000
Bank of America, N.A.
(Aa3/A+/A+)
Series 2008 3.8165% SIFMA Swap Index
5/23/2012 5/23/2012 4/1/2038 ($19,931,45522,476,556) $134,100,000
Goldman Sachs Mitsui Marine Derivative Products, L.P.
(Aa2/AA-/ )
Series 2008 3.4100% 65% of USD-LIBOR
5/23/2012 5/23/2012 4/1/2038 ($20,319,0682,425,786) $134,100,000
Bank of America, N.A.
(Aa3/A+/A+)
Total Fixed-Payer Swaps ($60,181,9787,384,898) $402,300,000
Series 2008 SIFMA Swap Index
107.4% of 3 month USD-LIBOR
3/19/2009 4/1/2018 4/1/2038 $13,313,4462,711,593 $156,600,000
Barclays Bank PLC
(A2/A/A)
Series 2008 SIFMA Swap Index
107.4% of 3 month USD-LIBOR
3/19/2009 4/1/2018 4/1/2038 $13,313,4462,711,593 $156,600,000
Barclays Bank PLC
(A2/A/A)
Total Index Conversion Swaps $26,626,8925,423,185 $313,200,000
Total Combined ($33,555,08641,961,713) $715,500,000

10
Cost of Capital
SANDAG has a very attractive weighted average cost of capital (WACC) of 3.35 percent. This cost can vary
based on swap performance and the cost of liquidity to support the variable-rate debt.
The 2008A–D bonds, with the current swap rate and associated fees, provide a cost of capital equal to
4.11 percent. The 2010A bonds were issued as taxable Build America Bonds and have a borrowing cost of
3.89 percent. The 2010B tax-exempt bonds have a borrowing cost of 3.14 percent. The 2012A, 2014A, and
2016A bonds were sold at an all-in cost of 3.72 percent, 3.85 percent, and 3.29 percent, respectively. The
2018A Short Term Notes have a borrowing cost of 1.86 percent. Taken together, SANDAG has issued
approximately $2.39 billion in long-term debt to accelerate project delivery, for a WACC of 3.35 percent.
SANDAG’s WACC Calculations
Synthetic Fixed Rate:
Series Par Post 2012 Refunding Swap Rate SBPA Fee Remarketing Agent Fee Cost of Capital
2008A $100,575,000 3.8165% 0.390% 0.06% 4.2665%
2008B $100,575,000 3.8165% 0.390% 0.06% 4.2665%
2008C1 $67,050,000 3.8165% 0.350% 0.06% 4.2265%
2008C2 $33,525,000 3.4100% 0.350% 0.06% 3.8200%
2008D $100,575,000 3.4100% 0.340% 0.06% 3.8100%
2008 Weighted Average 4.1085%
Fixed Rate:
Series Original Par - - - All-in True
Interest Cost
2010A $338,960,000 - - - 3.8871%
2010B $11,040,000 - - - 3.1434%
2012A $420,585,000 - - - 3.7167%
2014A $350,000,000 - - - 3.8507%
2016A $325,000,000 - - - 3.2947%
2018A
Notes $537,480,000 - - - 1.8596%
Total Weighted Average Without TIFIA Loan 3.3477%
Commercial Paper
In addition to the long-term debt, SANDAG has a short-term Commercial Paper Program supported by a
Letter of Credit (LOC) from Union Bank. The Commercial Paper Program was authorized at $100 million and
has a current outstanding balance of $26.6 million as of August 7, 2018. The paper was most recently
remarketed out 41 days, at a rate of 1.48 bps. The LOC expires in September 2018, and SANDAG staff
solicited bids for a replacement LOC in July 2018. Bank of America Merrill Lynch submitted the winning bid
and staff currently is in the process of finalizing the related legal documents. The commercial paper will be
remarketed with the new LOC on September 11, 2018. Through the competitive Request for Proposals
process, SANDAG lowered the annual LOC fees from .40 percent to .32 percent for the next three years.
11
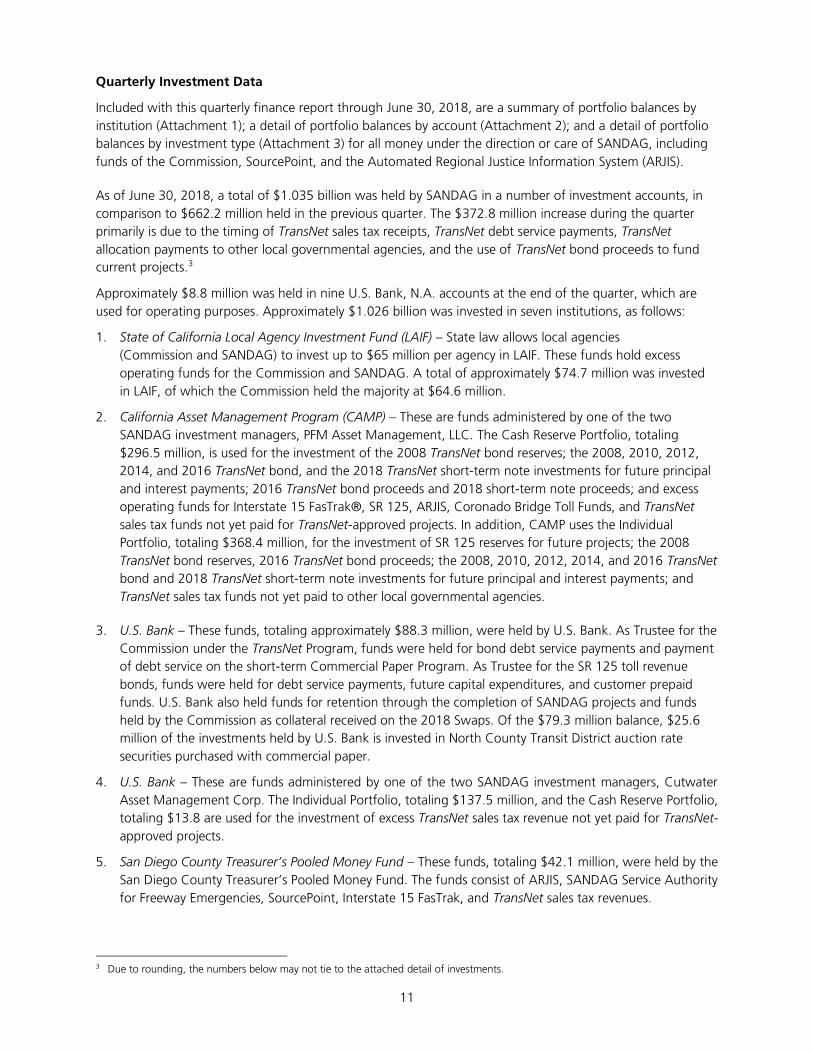
Quarterly Investment Data
Included with this quarterly finance report through June 30, 2018, are a summary of portfolio balances by
institution (Attachment 1); a detail of portfolio balances by account (Attachment 2); and a detail of portfolio
balances by investment type (Attachment 3) for all money under the direction or care of SANDAG, including
funds of the Commission, SourcePoint, and the Automated Regional Justice Information System (ARJIS).
As of June 30, 2018, a total of $1.035 billion was held by SANDAG in a number of investment accounts, in
comparison to $662.2 million held in the previous quarter. The $372.8 million increase during the quarter
primarily is due to the timing of TransNet sales tax receipts, TransNet debt service payments, TransNet
allocation payments to other local governmental agencies, and the use of TransNet bond proceeds to fund
current projects.3
Approximately $8.8 million was held in nine U.S. Bank, N.A. accounts at the end of the quarter, which are
used for operating purposes. Approximately $1.026 billion was invested in seven institutions, as follows:
1. State of California Local Agency Investment Fund (LAIF) – State law allows local agencies
(Commission and SANDAG) to invest up to $65 million per agency in LAIF. These funds hold excess
operating funds for the Commission and SANDAG. A total of approximately $74.7 million was invested
in LAIF, of which the Commission held the majority at $64.6 million.
2. California Asset Management Program (CAMP) – These are funds administered by one of the two
SANDAG investment managers, PFM Asset Management, LLC. The Cash Reserve Portfolio, totaling
$296.5 million, is used for the investment of the 2008 TransNet bond reserves; the 2008, 2010, 2012,
2014, and 2016 TransNet bond, and the 2018 TransNet short-term note investments for future principal
and interest payments; 2016 TransNet bond proceeds and 2018 short-term note proceeds; and excess
operating funds for Interstate 15 FasTrak®, SR 125, ARJIS, Coronado Bridge Toll Funds, and TransNet
sales tax funds not yet paid for TransNet-approved projects. In addition, CAMP uses the Individual
Portfolio, totaling $368.4 million, for the investment of SR 125 reserves for future projects; the 2008
TransNet bond reserves, 2016 TransNet bond proceeds; the 2008, 2010, 2012, 2014, and 2016 TransNet
bond and 2018 TransNet short-term note investments for future principal and interest payments; and
TransNet sales tax funds not yet paid to other local governmental agencies.
3. U.S. Bank – These funds, totaling approximately $88.3 million, were held by U.S. Bank. As Trustee for the
Commission under the TransNet Program, funds were held for bond debt service payments and payment
of debt service on the short-term Commercial Paper Program. As Trustee for the SR 125 toll revenue
bonds, funds were held for debt service payments, future capital expenditures, and customer prepaid
funds. U.S. Bank also held funds for retention through the completion of SANDAG projects and funds
held by the Commission as collateral received on the 2018 Swaps. Of the $79.3 million balance, $25.6
million of the investments held by U.S. Bank is invested in North County Transit District auction rate
securities purchased with commercial paper.
4. U.S. Bank – These are funds administered by one of the two SANDAG investment managers, Cutwater
Asset Management Corp. The Individual Portfolio, totaling $137.5 million, and the Cash Reserve Portfolio,
totaling $13.8 are used for the investment of excess TransNet sales tax revenue not yet paid for TransNet-
approved projects.
5. San Diego County Treasurer’s Pooled Money Fund – These funds, totaling $42.1 million, were held by the
San Diego County Treasurer’s Pooled Money Fund. The funds consist of ARJIS, SANDAG Service Authority
for Freeway Emergencies, SourcePoint, Interstate 15 FasTrak, and TransNet sales tax revenues.
3 Due to rounding, the numbers below may not tie to the attached detail of investments.

12
6. California Bank and Trust – There was $174,216 on deposit with California Bank and Trust pursuant to
capital project escrow retention agreements with various contractors.
7. Wells Fargo Bank, N.A. – These funds are administered by PFM Asset Management, LLC, the administrator
for SANDAG’s Internal Revenue Code Section 115 Trust Account. These funds total approximately
$4.7 million and are savings for future pension costs.
The chart below provides a snapshot of the investment holding locations as of June 30, 2018.
As shown in the chart below, as of June 30, 2018, the yield on cost of the portfolio was 1.72 percent, with a
weighted average maturity of 200 days, in comparison to 1.43 percent and 313 days in the prior quarter.
The Finance Department has continued to implement the Board of Directors investment objectives of safety,
liquidity, and return on investment for the SANDAG investment portfolio. These will continue to be important
investment objectives for the future.
0
0.5
1
1.5
2
2.5
3
Semi-Annual Yield on Cost
Investment Holdings US BANK, N.A.
LAIF
CAMP IP
CAMP CASH RESERVE
US BANK
US BANK IP
US BANK CASH RESERVE
COSD TREASURER'S POOL
CALIFORNIA BANK AND TRUST
WELLS FARGO BANK, N.A.

13
Annual Interest Rate Swap Policy Report: Description and Evaluation of Risks for Outstanding
Interest Rate Swaps
The Commission uses derivative instruments to hedge its exposure to changing interest rates through the use
of interest rate swaps. An interest rate swap is the exchange of payments between the Commission and a
counterparty in order to potentially obtain a lower cost of funding than traditional fixed rate bonds, or to
hedge interest rate exposure. The Commission has entered into three pay-fixed, receive-variable interest rate
swaps and two basis swaps to produce savings or to result in lower costs than what the Commission would
have paid using fixed-rate debt over the life of the 2008 Series ABCD Bonds.
On an annual basis and in accordance with Board Policy No. 032, an annual written description of the swaps
and an evaluation of the risks associated with outstanding interest rate swaps are presented to the Board for
review.
The following describes the interest rate swaps and evaluates the risks for the interest rate swaps in which
the Commission currently participates.
2008 Interest Rate Swaps
Objectives. In 2005, the Commission entered into three forward interest rate swaps for $200 million each in
order to hedge the interest rate risk associated with future variable-rate revenue bonds expected to be issued
in 2008 by “locking in” a fixed interest rate. The intention of the Commission in entering into the swaps was
to lock in a relatively low cost of funds on a substantial portion of the TransNet Early Action Program (EAP).
The variable-rate bonds were issued in March 2008.
On May 23, 2012, the Commission refunded $151.5 million of the outstanding variable-rate bonds with
fixed-rate bonds and terminated the associated interest rate swaps. The low fixed municipal interest rates at
that time provided the opportunity for the Commission to refund the 2013 through 2022 maturities of the
Series 2008 variable-rate bonds ($151.5 million in par) and terminate the associated swaps (also equal to
$151.5 million in notional amount) without increasing annual debt service. The purpose of this transaction
was to reduce variable-rate exposure and swap counterparty risk at no additional cost to the Commission.
The current notional amounts of the swaps are, following the refunding described above, $134.1 million
each, totaling $402.3 million.
Objective and terms of hedging derivative instruments. The following table displays the objective and
terms of the Commission’s hedging derivative instruments outstanding at June 30, 2018, along with the
credit rating of the associated counterparty (amounts in thousands):
Pay-fixed interest
rate swap
Hedge of changes in
cash flows on the
2008 Series A and B
bonds $134,100,000 5/23/2012 4/1/2038
Pay
3.8165%;
received
SIFMA Aa2/AAA
Pay-fixed interest
rate swap
Hedge of changes in
cash flows on the
2008 Series B and C
bonds $134,100,000 5/23/2012 4/1/2038
Pay
3.8165%;
received
SIFMA Aa2/AAA
Pay-fixed interest
rate swap
Hedge of changes in
cash flows on the
2008 Series C and D
bonds $134,100,000 5/23/2012 4/1/2038
Pay 3.41%;
received
65% of USD-
LIBOR Aa2/AAA
Counterparty
Credit Rating
Moody's/S&PType Objective
Notional
Amount
Effective
Date
Maturity
Date Terms
14
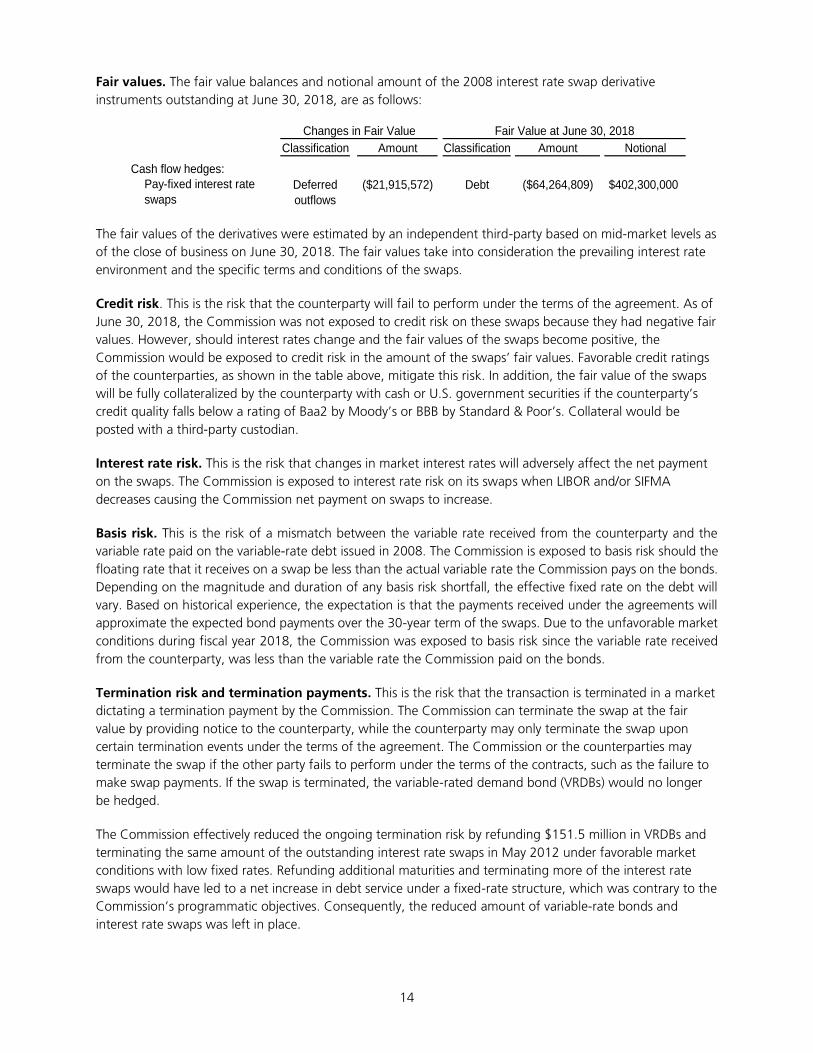
Fair values. The fair value balances and notional amount of the 2008 interest rate swap derivative
instruments outstanding at June 30, 2018, are as follows:
Classification Amount Classification Amount Notional
Cash flow hedges:
Pay-fixed interest rate
swaps
Deferred
outflows
($21,915,572) Debt ($64,264,809) $402,300,000
Fair Value at June 30, 2018Changes in Fair Value
The fair values of the derivatives were estimated by an independent third-party based on mid-market levels as
of the close of business on June 30, 2018. The fair values take into consideration the prevailing interest rate
environment and the specific terms and conditions of the swaps.
Credit risk. This is the risk that the counterparty will fail to perform under the terms of the agreement. As of
June 30, 2018, the Commission was not exposed to credit risk on these swaps because they had negative fair
values. However, should interest rates change and the fair values of the swaps become positive, the
Commission would be exposed to credit risk in the amount of the swaps’ fair values. Favorable credit ratings
of the counterparties, as shown in the table above, mitigate this risk. In addition, the fair value of the swaps
will be fully collateralized by the counterparty with cash or U.S. government securities if the counterparty’s
credit quality falls below a rating of Baa2 by Moody’s or BBB by Standard & Poor’s. Collateral would be
posted with a third-party custodian.
Interest rate risk. This is the risk that changes in market interest rates will adversely affect the net payment
on the swaps. The Commission is exposed to interest rate risk on its swaps when LIBOR and/or SIFMA
decreases causing the Commission net payment on swaps to increase.
Basis risk. This is the risk of a mismatch between the variable rate received from the counterparty and the
variable rate paid on the variable-rate debt issued in 2008. The Commission is exposed to basis risk should the
floating rate that it receives on a swap be less than the actual variable rate the Commission pays on the bonds.
Depending on the magnitude and duration of any basis risk shortfall, the effective fixed rate on the debt will
vary. Based on historical experience, the expectation is that the payments received under the agreements will
approximate the expected bond payments over the 30-year term of the swaps. Due to the unfavorable market
conditions during fiscal year 2018, the Commission was exposed to basis risk since the variable rate received
from the counterparty, was less than the variable rate the Commission paid on the bonds.
Termination risk and termination payments. This is the risk that the transaction is terminated in a market
dictating a termination payment by the Commission. The Commission can terminate the swap at the fair
value by providing notice to the counterparty, while the counterparty may only terminate the swap upon
certain termination events under the terms of the agreement. The Commission or the counterparties may
terminate the swap if the other party fails to perform under the terms of the contracts, such as the failure to
make swap payments. If the swap is terminated, the variable-rated demand bond (VRDBs) would no longer
be hedged.
The Commission effectively reduced the ongoing termination risk by refunding $151.5 million in VRDBs and
terminating the same amount of the outstanding interest rate swaps in May 2012 under favorable market
conditions with low fixed rates. Refunding additional maturities and terminating more of the interest rate
swaps would have led to a net increase in debt service under a fixed-rate structure, which was contrary to the
Commission’s programmatic objectives. Consequently, the reduced amount of variable-rate bonds and
interest rate swaps was left in place.

15
Rollover risk. This is the risk that maturity of the hedging derivative instruments is shorter than the maturity
of the associated debt leaving the Commission unprotected in the future. When these swaps terminate, or in
the case of a termination option, if the counterparty exercises its option, the Commission will be re-exposed
to the risks being hedged by the swaps. The Commission is exposed to rollover risk on the swaps only in the
event of a failure to perform under the terms of the contracts by the Commission or counterparty.
Market access risk. This is the risk that the Commission will not be able to enter credit markets or that
credit will become more costly. The Commission’s financial rating is tied to the credit strength of the sales tax
revenue. The Commission is also exposed to market access risks caused by disruptions in the municipal bond
market.
Reset rates paid and received by the Commission. The range of weekly variable interest rates paid on the
2008 TransNet bonds by the Commission to the bondholders for the period July 1, 2017, through June 30,
2018, are as follows:
Bondholder Low High
Barclays Bank 0.72% 1.72%
Goldman, Sachs & Co. 0.72% 1.73%
JP Morgan Securities, Inc. 0.75% 1.75%
Stifel, Nicolaus & Company 0.72% 1.75%
Commission Pays
Weekly Reset Rates
Fixed rates are paid by the Commission to the swap provider counterparties and sixty-five percent of LIBOR or
SIFMA is received by the Commission from the swap provider counterparties.
On April 1, 2018, the payment index adjusted from LIBOR to SIFMA for two of the swap counterparties.
The following table includes the range of LIBOR rates received by the Commission and the fixed rate paid to
the swap counterparties from July 1, 2017, through March 31, 2018.
Commission Pays
Swap Counterparty Low High Fixed
Bank of America 0.68283% 1.08172% 3.410%
Bank of America 0.68283% 1.08172% 3.8165%
Goldman Sachs Mitsui
Marine Derivative Products 0.68283% 1.08172% 3.8165%
Commission Receives
65% LIBOR
The following table includes the range of LIBOR rates received for one swap and the range of SIFMA
rates received for two swaps; and the fixed rate paid to the swap counterparties from April 1, 2018,
through June 30, 2018.
Commission
Pays
Swap Counterparty Low High Low High Fixed
Bank of America 0.68283% 1.08172% 3.410%
Bank of America 1.43419% 1.69933% 3.8165%
Goldman Sachs Mitsui
Marine Derivative Products 1.43419% 1.69933% 3.8165%
Commission Receives
65% LIBOR
Commission Receives
SIFMA

16
Actual debt service requirements versus the projected debt service on the swap transaction. For the
fiscal year ending June 30, 2018, actual debt service was more than projected resulting in excess variable-rate
payments made on the bonds as compared to the variable-rate payments received from the swap in the
amount of $103,620:
Counterparty
Actual Debt
Service
Projected
Debt Service
Bank of America 4,650,069$ 4,572,811$
Bank of America 5,116,471 5,117,926
Goldman Sachs Mitsui Marine Derivative Products 5,145,743 5,117,926
14,912,283$ 14,808,663$
Over the life of the swaps from the issuance of the bonds through June 30, 2018, the cumulative excess of
the variable-rate payments made on the bonds as compared to the variable-rate payments received from the
swap counterparties is $4,251,393. This means that the net variable rates that the Commission is paying on
the 2008 TransNet bonds is more than the variable rate that the Commission is receiving; these rates
originally were intended to offset and net to zero.
The total net cost of the program includes liquidity facilities with J.P. Morgan (Series A and B), Bank of
America, N.A. (Series C), and State Street Bank and Trust Company (Series D). Standby Bond Purchase
Agreement (SBPA) costs at year end for the Series A and B bonds is 39 basis points, the Series C bonds is 35
basis points, and the SBPA cost for the Series D bonds is 34 basis points.
2018 basis rate swaps overlay to the 2008 interest rate swaps
Objective. On March 19, 2009, the Commission entered into a SIFMA versus LIBOR floating-to-floating or
“basis” swap. The combination of the Basis Swaps and the existing 2008 Interest Rate Swaps effectively
amended the existing swaps without having to change the existing floating-to-fixed interest rate swaps. This
overlay allowed the Commission to bid out the new transaction to a group of potential counterparties
without changing the existing 2008 Interest Rate Swaps. The Commission entered into a new transaction
with Barclays Bank PLC (Barclays) to overlay the terms under two of the 2008 Interest Rate Swaps, with an
expected benefit to the Commission of a substantial reduction in the cost of debt after the effective date of
April 1, 2018.
Terms. The initial notional amounts of the swaps are $156.6 million each. Under two of the 2008 Interest
Rate Swaps, the Commission pays the counterparties a fixed payment of 3.8165 percent and receives 65
percent of LIBOR (through April 2018) and thereafter receives the SIFMA index. The 2018 Basis Rate Swaps
overlay these two 2008 Interest Rate Swaps with a payment of the SIFMA index and a receipt of 107.4
percent of LIBOR for the last 20 years of the swap (April 2018 to April 2038).
Fair values. The swaps had a total combined positive fair value of $24,119,001 at fiscal year end. The fair
values of the derivatives were estimated by an independent third party based on mid-market levels as of the
close of business on June 30, 2018. The fair values take into consideration the prevailing interest rate
environment and the specific terms and conditions of the swaps.

17
Classification Amount Classification Amount Notional
Investment derivatives:
Pay-floating Receive
floating interest rate
swaps
Investment
revenue
$6,887,882 Investment $24,119,002 $313,200,000
Fair Value at June 30, 2018Changes in Fair Value
Terms and fair value of investment derivative instruments
The following table displays the terms and fair value of the Commission’s investment derivative instruments
outstanding at June 30, 2018, along with the credit rating of the associated swap counterparty (amounts in
thousands):
SIFMA Swap
Index
107.4% of 3-
month USD-
LIBOR 3/19/2009 4/1/2018 4/1/2038 $12,059,501 $156,600,000 A2/A/A
SIFMA Swap
Index
107.4% of 3-
month USD-
LIBOR 3/19/2009 4/1/2018 4/1/2038 $12,059,501 $156,600,000 A2/A/A
*Moody's/S&P/Fitch
Counterparty
Credit Rating*
Variable Rate
Paid
Variable Rate
Received Trade Date
Effective
Date
Maturity
Date
Notional
AmountFair Value
Credit risk. This is the risk that the counterparty will fail to perform under the terms of the agreements. As
of June 30, 2018, the Commission was exposed to credit risk on these swaps in the amount of $12,739,569,
which is the fair value of the derivatives net of collateral posted. However, should interest rates change and
the fair value of the swaps become negative, the Commission would not be exposed to any credit risk. The
favorable credit rating of the counterparty, as shown in the table above, mitigates this risk.
Collateral. To further mitigate credit risk, under terms of the International Swaps and Derivatives
Association, Inc. (ISDA) Master Agreement, dated March 19, 2009, by and between the Commission and
Barclays, upon a demand by either party, collateral may be posted by Barclays to the Commission’s Trust
account or returned to Barclays; dependent upon the valuation amount each day. Collateral can be posted on
amounts over $15,000,000 when the minimum daily valuation change is at least $250,000. Interest earned
on collateral held by the Commission is due to Barclays monthly. The Commission reports collateral holdings,
including interest earned, as deposits payable. At June 30, 2018, there was $11,379,433 reported as deposits
payable.
Netting. Under terms of the ISDA Master Agreement, in respect of the same transaction, the Commission
and Barclays may elect a net amount due and payable for the party with the larger aggregate amount over
the smaller aggregate amount. The Commission and Barclays elected the netting option, which resulted in
net receipts of $814,382 by the Commission at year end.
Interest rate risk. This is the risk that changes in market interest rates will adversely affect the net payment
on the swaps. The Commission is exposed to interest rate risk on its swaps when LIBOR decreases and/or
SIFMA increases, causing the Commission net payment on the swaps to increase.
Basis risk. This is the risk of a mismatch between the variable rate received from the counterparty and the
variable rate paid on the variable-rate debt issued in 2008. The Commission is exposed to basis risk should
the floating rate that it receives on a swap be less than the actual variable rate the Commission pays on the

18
bonds. Depending on the magnitude and duration of any basis risk shortfall, the effective fixed rate on the
debt will vary. Based on current and historical experience, staff expects the overlay of the SIFMA to LIBOR
Basis Rate Swaps to significantly reduce the costs of financing after 2018, assuming a return to normal, or
even near to normal trading relationships. Due to the favorable market conditions during fiscal year 2018, the
Commission was not exposed to basis risk since the variable rate received was more than the variable rate
paid and amounted to $814,382.
Termination risk and termination payments. This is the risk that the transaction is terminated in a market
dictating a termination payment by the Commission. The Commission can terminate a swap at the fair
market value by providing notice to the counterparty, while the counterparty may only terminate the swap
upon certain termination events under the terms of the agreement. Given the positive fair value at
June 30, 2018, the Commission was in a favorable termination position relative to the market.
SANDAG Board Policy No. 032: San Diego County Regional Transportation Commission Interest Rate Swap
Policy requires a contingency plan to either replace the swaps or fund the termination payments, if any, in the
event one or more outstanding swaps are terminated. Should a swap be terminated, the excellent credit
rating of Commission would allow it to assign the swap to another counterparty. Alternatively, if a swap is
terminated and it has a negative fair value, the Commission could use TransNet sales tax receipts to fund the
termination payment.
Certifications
The Director of Finance reports that this investment portfolio, together with the authorized short-term
Commercial Paper Program, will provide the necessary liquidity to meet the expenditure requirements of
SANDAG, the Commission, ARJIS, and SourcePoint for the next six months. This portfolio is in compliance
with state law and Board Policy No. 003: Investment Policy.
The Director of Finance reports that there has not been any material event involving outstanding swap
agreements, nor has there been any default by a swap counterparty or counterparty termination.
The Local Economy and Sales Tax Revenues
The San Diego economy added close to 22,000 jobs in in the past year, bringing unemployment to a very low
3.5 percent in July 2018, down from 4.4 percent in July 2017. The local economy is near “full employment,”
and this has begun to show in both lower numbers of jobs added and in wage growth, as San Diego regional
weekly pay grew 3.9 percent in the last year. This recent upturn has led to some growth in consumer
spending, as taxable retail sales were up 7.4 percent in the first quarter of 2018 versus the first quarter of
2017. Consumer spending makes up more than 70 percent of the economy and is a primary driver of sales
tax revenue.
In additional metrics, San Diego has continued to attract venture capital, more than $1.2 billion in 2017, and
more than $900 million in the first two quarters of 2018, with the largest amount (just over half) going to
healthcare/life sciences firms. Construction accelerated its pace, adding roughly 10,000 units in 2017 for the
third year in a row, but roughly 7,000 permits in the first six months of 2018. This better pace is roughly the
number needed to keep pace with population growth (about 12,000). A decade of low construction has led
to steadily rising rents and home prices that create a situation where only roughly a quarter of San Diego
households could afford a median-priced home. The median home price in San Diego County hit a record
high of $580,000 in July.
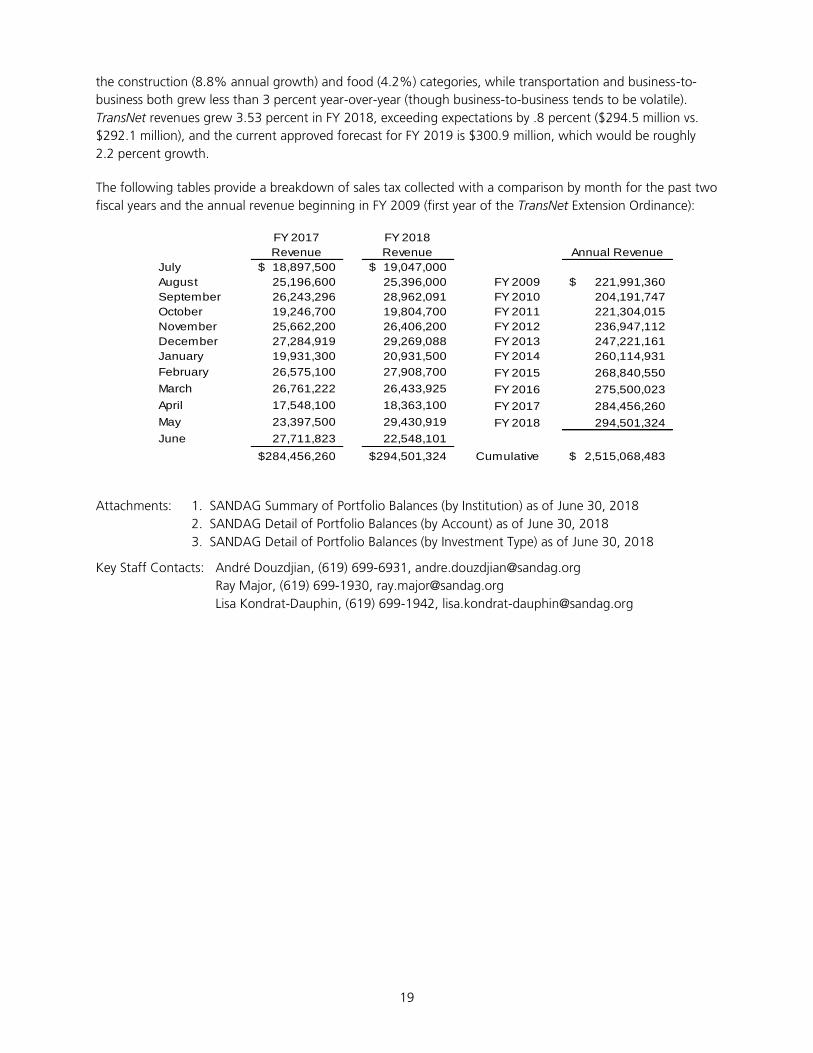
TransNet revenues have increased 3.9 percent over the last four quarters (through March 2018), and the first
quarter of 2018 was more than 5.6 percent better than the first quarter of 2017. Strong gains were seen in
19
the construction (8.8% annual growth) and food (4.2%) categories, while transportation and business-to-
business both grew less than 3 percent year-over-year (though business-to-business tends to be volatile).
TransNet revenues grew 3.53 percent in FY 2018, exceeding expectations by .8 percent ($294.5 million vs.
$292.1 million), and the current approved forecast for FY 2019 is $300.9 million, which would be roughly
2.2 percent growth.
The following tables provide a breakdown of sales tax collected with a comparison by month for the past two
fiscal years and the annual revenue beginning in FY 2009 (first year of the TransNet Extension Ordinance):
FY 2017
Revenue
FY 2018
Revenue Annual Revenue
July 18,897,500$ 19,047,000$
August 25,196,600 25,396,000 FY 2009 221,991,360$
September 26,243,296 28,962,091 FY 2010 204,191,747
October 19,246,700 19,804,700 FY 2011 221,304,015
November 25,662,200 26,406,200 FY 2012 236,947,112
December 27,284,919 29,269,088 FY 2013 247,221,161
January 19,931,300 20,931,500 FY 2014 260,114,931
February 26,575,100 27,908,700 FY 2015 268,840,550
March 26,761,222 26,433,925 FY 2016 275,500,023
April 17,548,100 18,363,100 FY 2017 284,456,260
May 23,397,500 29,430,919 FY 2018 294,501,324
June 27,711,823 22,548,101
284,456,260$ 294,501,324$ Cumulative 2,515,068,483$
Attachments: 1. SANDAG Summary of Portfolio Balances (by Institution) as of June 30, 2018
2. SANDAG Detail of Portfolio Balances (by Account) as of June 30, 2018
3. SANDAG Detail of Portfolio Balances (by Investment Type) as of June 30, 2018
Key Staff Contacts: André Douzdjian, (619) 699-6931, [email protected]
Ray Major, (619) 699-1930, [email protected]
Lisa Kondrat-Dauphin, (619) 699-1942, [email protected]

Attachment 1
SANDAGSummary of Portfolio Balances (by Institution)
as of June 30, 2018
Wtd. Avg.Book Percent of Market Market Unrealized Yield on Days to
Institution Value Portfolio Value Price Gain/(Loss) Cost Maturity
US BANK, N.A. 8,849,835.46$ 0.85% 8,849,835.46$ 100.00% -$ N/A 1
STATE OF CALIFORNIA LOCAL AGENCY INVESTMENT FUND 74,658,181.13 7.18% 74,658,181.13 100.00% - 1.92% 193 **
CALIFORNIA ASSET MANAGEMENT PROGRAM (CAMP) INDIVIDUAL PORTFOLIO 370,770,362.49 35.68% 368,446,701.65 99.37% (2,323,660.84) 1.82% 332
CAMP CASH RESERVE PORTFOLIO 296,514,680.21 28.53% 296,514,680.21 100.00% - 2.05% 35 **
US BANK 88,363,366.92 8.50% 88,363,366.92 100.00% - 1.13% 12
US BANK INDIVIDUAL PORTFOLIO 139,350,339.58 13.41% 137,538,556.80 98.70% (1,811,782.78) 1.30% 320
US BANK CASH RESERVE PORTFOLIO 13,848,061.50 1.33% 13,848,061.50 100.00% - 0.00% 1
SAN DIEGO COUNTY TREASURER'S POOLED MONEY FUND 42,140,468.77 4.05% 42,140,468.77 100.00% - 1.94% 345 **
CALIFORNIA BANK AND TRUST 174,216.39 0.02% 174,216.39 100.00% - 0.12% 1
WELLS FARGO BANK, N.A. 4,601,540.95 0.44% 4,692,362.74 101.97% 90,821.79 2.23% 1
TOTAL 1,039,271,053.40$ 100.00% 1,035,226,431.57$ 99.61% (4,044,621.83)$ 1.72% 200
** Although average days to maturity is greater than one day, funds are available at par the same day.
Summary of Portfolio Balances (by Agency)
Wtd. Avg.Book Percent of Market Market Unrealized Yield on Days to
Agency Value Portfolio Value Price Gain/(Loss) Cost Maturity
SANDAG FUNDS 177,095,132.44$ 17.04% 177,014,529.22$ 99.95% (80,603.22)$ 1.49% 108
AUTOMATED REGIONAL JUSTICE INFORMATION SYSTEM FUNDS 7,497,110.32 0.72% 7,497,110.32 100.00% - 2.01% 137
SOURCEPOINT FUNDS 209,669.26 0.02% 209,669.26 100.00% - 1.94% 284
CORONADO BRIDGE TOLL FUNDS 280,126.16 0.03% 280,126.16 100.00% - 2.05% 35
SAN DIEGO COUNTY REGIONAL TRANSPORTATION COMMISSION FUNDS 854,189,015.22 82.18% 850,224,996.61 99.54% (3,964,018.61) 1.77% 220
TOTAL 1,039,271,053.40$ 100.00% 1,035,226,431.57$ 99.61% (4,044,621.83)$ 1.72% 200
Note: In addition to the funds held above, there is $4,750 petty cash held at SANDAG.

Attachment 2
Percent Wtd. Avg.
Book of Market Market Unrealized Yield on Days to
Institution / Account Value Portfolio Value Price Gain/(Loss) Cost Maturity
US BANK, N.A.:
Checking - TransNet Sales Tax (RTC) 690,604.78$ 0.07% 690,604.78$ 100.00% -$ N/A 1
Checking - SANDAG General 2,584,610.31 0.25% 2,584,610.31 100.00% - N/A 1
Checking - SANDAG Flexible Spending Acct (FSA) 79,431.61 0.01% 79,431.61 100.00% - N/A 1
Checking - SANDAG Interstate 15 (I-15) FasTrak ® 940,592.36 0.09% 940,592.36 100.00% - N/A 1
Checking - SANDAG SAFE Program Acct 618,459.50 0.06% 618,459.50 100.00% - N/A 1
Checking - SourcePoint 36,926.87 0.00% 36,926.87 100.00% - N/A 1
Checking - ARJIS 288,856.13 0.03% 288,856.13 100.00% - N/A 1
Checking - State Route 125 (SR 125) Payment Account 3,203,763.49 0.31% 3,203,763.49 100.00% - N/A 1
Checking - State Route 125 (SR 125) Collection Account 406,590.41 0.04% 406,590.41 100.00% - N/A 1
TOTAL US BANK, N.A. 8,849,835.46$ 0.85% 8,849,835.46$ 100.00% -$ N/A 1
STATE OF CA LOCAL AGENCY INVESTMENT FUND (LAIF):
TransNet (RTC) 64,644,392.78$ 6.22% 64,644,392.78$ 100.00% -$ 1.92% 193
SANDAG 10,013,788.35 0.96% 10,013,788.35 100.00% - 1.92% 193
TOTAL LAIF 74,658,181.13$ 7.18% 74,658,181.13$ 100.00% -$ 1.92% 193 **
CALIFORNIA ASSET MANAGEMENT PROGRAM (CAMP):
INDIVIDUAL PORTFOLIO:
TransNet Sales Tax (RTC) 134,154,550.55$ 12.91% 132,270,338.96$ 98.60% (1,884,211.59)$ 1.65% 575
TransNet Program Reserve (RTC) 54,129,337.84 5.21% 53,374,123.85 98.60% (755,213.99) 1.58% 553
TransNet 2008 Bond Proceeds A/B/C/D Reserve Fund (RTC) 17,207,520.71 1.66% 17,056,473.66 99.12% (151,047.05) 2.20% 433
TransNet 2016 Bond Proceeds Series A Project (RTC) 155,096,548.64 14.92% 155,748,875.61 100.42% 652,326.97 2.07% 47
Sage Hill Endowment (RTC) 821,139.00 0.08% 807,048.83 98.28% (14,090.17) 1.79% 822
SANDAG Toll Rd Project Major Main Reserve Acct 9,361,265.75 0.90% 9,189,840.74 98.17% (171,425.01) 0.93% 164
TOTAL INDIVIDUAL PORTFOLIO 370,770,362.49$ 35.68% 368,446,701.65$ 99.37% (2,323,660.84)$ 1.82% 332
SANDAG
Detail of Portfolio Balances (by Account)
as of June 30, 2018

Percent Wtd. Avg.
Book of Market Market Unrealized Yield on Days to
Institution / Account Value Portfolio Value Price Gain/(Loss) Cost Maturity
SANDAG
Detail of Portfolio Balances (by Account)
as of June 30, 2018
CASH RESERVE PORTFOLIO:
I-15 FasTrak 635,542.28$ 0.06% 635,542.28$ 100.00% -$ 2.05% 35
ARJIS 4,700,419.74 0.45% 4,700,419.74 100.00% - 2.05% 35
California Coastal Commission 1,005,509.86 0.10% 1,005,509.86 100.00% - 2.05% 35
SANDAG SR 125 1,894,294.36 0.18% 1,894,294.36 100.00% - 2.05% 35
SANDAG SR 125 24,172,545.34 2.33% 24,172,545.34 100.00% - 2.05% 35
SANDAG SR 125 27,963,182.67 2.69% 27,963,182.67 100.00% - 2.05% 35
Coronado Bridge Toll Funds 280,126.16 0.03% 280,126.16 100.00% - 2.05% 35
SANDAG Shoreline Management Account 165,309.10 0.02% 165,309.10 100.00% - 2.05% 35
2008 Bond Series A/B/C/D Reserve Fund (RTC) 72,976.04 0.01% 72,976.04 100.00% - 2.05% 35
2008 Bond Series A - Principal (RTC) 1.00 0.00% 1.00 100.00% - 2.05% 35
2008 Bond Series B - Principal (RTC) 1.00 0.00% 1.00 100.00% - 2.05% 35
2008 Bond Series C - Principal (RTC) 1.00 0.00% 1.00 100.00% - 2.05% 35
2008 Bond Series D - Principal (RTC) 1.00 0.00% 1.00 100.00% - 2.05% 35
2010 Bond Series B - Principal (RTC) 180,346.65 0.02% 180,346.65 100.00% - 2.05% 35
2010 Bond Series B - Interest (RTC) 63,661.16 0.01% 63,661.16 100.00% - 2.05% 35
2010 Bond Series A - Interest (RTC) 5,019,960.64 0.48% 5,019,960.64 100.00% - 2.05% 35
2012 Bond Series A - Interest (RTC) 3,929,176.66 0.38% 3,929,176.66 100.00% - 2.05% 35
2012 Bond Series A - Principal (RTC) 4,473,912.35 0.43% 4,473,912.35 100.00% - 2.05% 35
2008 Sales Tax Account - TransNet Extension (RTC) 21,989,800.07 2.12% 21,989,800.07 100.00% - 2.05% 35
Wetland Mitigation TransNet Sales Tax (RTC) 298,487.20 0.03% 298,487.20 100.00% - 2.05% 35
Sage Hill Endowment (RTC) 18,391.89 0.00% 18,391.89 100.00% - 2.05% 35
TransNet Program Reserve (RTC) 102,938.58 0.01% 102,938.58 100.00% - 2.05% 35
2014 Bond Series A - Principal (RTC) 1,267,832.96 0.12% 1,267,832.96 100.00% - 2.05% 35
2014 Bond Series A - Interest (RTC) 4,184,456.67 0.40% 4,184,456.67 100.00% - 2.05% 35
2016 Bond Series A Principal Account (RTC) 1,197,737.19 0.12% 1,197,737.19 100.00% - 2.05% 35
2016 Bond Series A Interest Account (RTC) 3,979,593.73 0.38% 3,979,593.73 100.00% - 2.05% 35
2016 Bond Series A Project Account (RTC) 70,649,351.29 6.80% 70,649,351.29 100.00% - 2.05% 35
2018 Bond Series A Project Account (RTC) 114,106,452.10 10.98% 114,106,452.10 100.00% 2.05% 35
2018 Bond Series A Interest Account (RTC) 4,162,671.52 0.40% 4,162,671.52 100.00% 2.05% 35
TOTAL CASH RESERVE PORTFOLIO 296,514,680.21$ 28.53% 296,514,680.21$ 100.00% -$ 2.05% 35 **
TOTAL CAMP 667,285,042.70$ 64.21% 664,961,381.86$ 99.65% -$ 1.92% 200

Percent Wtd. Avg.
Book of Market Market Unrealized Yield on Days to
Institution / Account Value Portfolio Value Price Gain/(Loss) Cost Maturity
SANDAG
Detail of Portfolio Balances (by Account)
as of June 30, 2018
US BANK:
Capital Project Retention Account 24,721,563.24$ 2.38% 24,721,563.24$ 100.00% -$ 0.25% 1
SANDAG SR 125 First Senior Lien bonds 2017 Series A 311,893.34 0.03% 311,893.34 100.00% - 0.65% 1
SANDAG SR 125 First Senior Lien bonds 2017 Series A Reserve Account 13,803,659.27 1.33% 13,803,659.27 100.00% - 0.65% 1
SANDAG SR 125 First Senior Lien bonds 2017 Series A Interest Account 5,976,956.50 0.58% 5,976,956.50 100.00% - 0.65% 1
SANDAG SR 125 First Senior Lien bonds 2017 Series A Principal Account 3,073,544.04 0.30% 3,073,544.04 100.00% - 0.65% 1
SANDAG SR 125 FasTrak Customer Prepaid Fund 2,006,254.69 0.19% 2,006,254.69 100.00% - 0.65% 1
2008 Bond Series A/B/C/D Main Interest (RTC) 1,251,825.24 0.12% 1,251,825.24 100.00% - 0.25% 1
Commercial Paper Series B - NCTD Interest (RTC) 221,977.24 0.02% 221,977.24 100.00% - 0.25% 1
NCTD Certificates of Participation 25,550,000.00 2.46% 25,550,000.00 100.00% - 1.37% 38
2018A Short-term Notes Project (RTC) 19,328.19 0.00% 19,328.19 100.00% - 0.20% 1
Custody Account (RTC) 11,379,432.92 1.09% 11,379,432.92 100.00% - 1.75% 1
Commercial Paper Notes Series B Interest (RTC) 6.19 0.00% 6.19 100.00% - 1.29% 1
Commercial Paper Notes Series B Principal (RTC) 46,926.06 0.00% 46,926.06 100.00% - 1.30% 1
TOTAL US BANK 88,363,366.92$ 8.50% 88,363,366.92$ 100.00% -$ 1.13% 12
US BANK:
INDIVIDUAL PORTFOLIO:
TransNet Extension (RTC) 139,350,339.58$ 13.41% 137,538,556.80$ 98.70% (1,811,782.78)$ 1.30% 320
TOTAL INDIVIDUAL PORTFOLIO 139,350,339.58$ 13.41% 137,538,556.80$ 98.70% (1,811,782.78)$ 1.30% 320
CASH RESERVE:
TransNet Extension (RTC) 13,848,061.50$ 1.33% 13,848,061.50$ 100.00% -$ 0.00% 1
TOTAL CASH RESERVE 13,848,061.50$ 1.33% 13,848,061.50$ 100.00% -$ 0.00% 1
TOTAL US BANK 153,198,401.08$ 14.74% 151,386,618.30$ 98.82% (1,811,782.78)$ 1.18% 291

Percent Wtd. Avg.
Book of Market Market Unrealized Yield on Days to
Institution / Account Value Portfolio Value Price Gain/(Loss) Cost Maturity
SANDAG
Detail of Portfolio Balances (by Account)
as of June 30, 2018
SAN DIEGO COUNTY TREASURER'S POOLED MONEY FUND:
SourcePoint Cash Reserve Fund 172,742.39$ 0.02% 172,742.39$ 100.00% -$ 1.94% 345
SANDAG I-15 FasTrak 30,482,928.03 2.93% 30,482,928.03 100.00% - 1.94% 345
TransNet Extension (RTC) 79,273.30 0.01% 79,273.30 100.00% - 1.94% 345
ARJIS 2,507,834.45 0.24% 2,507,834.45 100.00% - 1.94% 345
SANDAG SAFE Program 8,897,690.60 0.86% 8,897,690.60 100.00% - 1.94% 345
TOTAL SAN DIEGO COUNTY TREASURER'S POOLED MONEY FUND 42,140,468.77$ 4.05% 42,140,468.77$ 100.00% -$ 1.94% 345 **
CALIFORNIA BANK AND TRUST:
Capital Project Retention Accounts 174,216.39$ 0.02% 174,216.39$ 100.00% -$ 0.12% 1
TOTAL CALIFORNIA BANK AND TRUST 174,216.39$ 0.02% 174,216.39$ 100.00% -$ 0.12% 1
WELLS FARGO BANK, N.A.:
SANDAG Section 115 Pension Trust 4,601,540.95$ 0.44% 4,692,362.74$ 101.97% 90,821.79$ 2.23% 1
TOTAL WELLS FARGO BANK, N.A. 4,601,540.95$ 0.44% 4,692,362.74$ 101.97% 90,821.79$ 2.23% 1
TOTAL 1,039,271,053.40$ 100.00% 1,035,226,431.57$ 99.61% (4,044,621.83)$ 1.72% 200
Legend:
Automated Regional Justice Information System (ARJIS)
Commercial Paper (CP)
State of California Local Agency Investment Fund (LAIF)
North County Transit District (NCTD)
San Diego County Regional Transportation Commission (RTC)
** Although average days to maturity is greater than one day, funds are available at par the same day.

Attachment 3
Wtd. Avg.
Trade Maturity Unrealized S&P Moody's Fitch Yield Days to
Investment Date Date Book Value Market Value Gain / (Loss) Par Value Rating Rating Rating on Cost Maturity
Cash and cash equivalents:
Demand deposits:
Checking - TransNet Sales Tax (RTC) N/A N/A 690,604.78$ 690,604.78$ -$ N/A NR NR NR N/A 1
Checking - SANDAG General N/A N/A 2,584,610.31 2,584,610.31 - N/A NR NR NR N/A 1
Checking - SANDAG Flexible Spending Acct (FSA) N/A N/A 79,431.61 79,431.61 - N/A NR NR NR N/A 1
Checking - SANDAG Interstate 15 (I-15) FasTrak ® N/A N/A 940,592.36 940,592.36 - N/A NR NR NR N/A 1
Checking - SANDAG SAFE Program Acct N/A N/A 618,459.50 618,459.50 - N/A NR NR NR N/A 1
Checking - SourcePoint N/A N/A 36,926.87 36,926.87 - N/A NR NR NR N/A 1
Checking - ARJIS N/A N/A 288,856.13 288,856.13 - N/A NR NR NR N/A 1
Checking - State Route 125 (SR 125) Payment Account N/A N/A 3,203,763.49 3,203,763.49 - N/A NR NR NR N/A 1
Checking - SR 125 Collection Account N/A N/A 406,590.41 406,590.41 - N/A NR NR NR N/A 1
Total demand deposits 8,849,835.46$ 8,849,835.46$ -$ N/A N/A 1
Money market accounts and funds:
Money Market - Capital Project Retention Account N/A N/A 174,216.39$ 174,216.39$ -$ N/A NR NR NR 0.12% 1
Money Market - Capital Project Retention Account N/A N/A 24,721,563.24 24,721,563.24 - N/A NR NR NR 0.25% 1
San Diego County Treasurer's Pooled Money Fund (SourcePoint) N/A N/A 172,742.39 172,742.39 - N/A NR NR AAAf / S1 1.94% 345 *
San Diego County Treasurer's Pooled Money Fund (I-15 FasTrak ®) N/A N/A 30,482,928.03 30,482,928.03 - N/A NR NR AAAf / S1 1.94% 345 *
San Diego County Treasurer's Pooled Money Fund (RTC) N/A N/A 79,273.30 79,273.30 - N/A NR NR AAAf / S1 1.94% 345 *
San Diego County Treasurer's Pooled Money Fund (ARJIS) N/A N/A 2,507,834.45 2,507,834.45 - N/A NR NR AAAf / S1 1.94% 345 *
San Diego County Treasurer's Pooled Money Fund (SAFE) N/A N/A 8,897,690.60 8,897,690.60 - N/A NR NR AAAf / S1 1.94% 345 *
Money Market - SANDAG SR 125 Lien bonds 2017 Series A N/A N/A 311,893.34 311,893.34 - N/A NR NR NR 0.65% 1
Money Market - SANDAG SR 125 Lien bonds 2017 Ser A Reserve Account N/A N/A 13,803,659.27 13,803,659.27 - N/A NR NR NR 0.65% 1
Money Market - SANDAG SR 125 Lien bonds 2017 Ser A Interest Account N/A N/A 5,976,956.50 5,976,956.50 - N/A NR NR NR 0.65% 1
Money Market - SANDAG SR 125 Lien bonds 2017 Ser A Principal N/A N/A 3,073,544.04 3,073,544.04 - N/A NR NR NR 0.65% 1
Money Market - SANDAG SR 125 FasTrak Customer Prepaid Fund N/A N/A 2,006,254.69 2,006,254.69 - N/A NR NR NR 0.65% 1
Money Market - RTC (2008 Bond - Main Interest) N/A N/A 1,251,825.24 1,251,825.24 - N/A NR NR NR 0.25% 1
Money Market - RTC (CP Series B - NCTD) N/A N/A 221,977.24 221,977.24 - N/A NR NR NR 0.25% 1
Money Market - RTC (2018 Short-term Notes Project) N/A N/A 19,328.19 19,328.19 - N/A NR NR NR 0.20% 1
Money Market - RTC (CP Notes Series B Principal) N/A N/A 6.19 6.19 - N/A NR NR NR 1.29% 1
Money Market - RTC (CP Notes Series B Interest) N/A N/A 46,926.06 46,926.06 - N/A NR NR NR 1.30% 1
Money Market - RTC (Custody Account) N/A N/A 11,379,432.92 11,379,432.92 - N/A NR NR NR 1.75% 1
CAMP Cash Reserve Portfolio (I-15 FasTrak ®) N/A N/A 635,542.28 635,542.28 - N/A AAAm NR NR 2.05% 35
CAMP Cash Reserve Portfolio (ARJIS) N/A N/A 4,700,419.74 4,700,419.74 - N/A AAAm NR NR 2.05% 35
CAMP Cash Reserve Portfolio - CA Coastal Commission N/A N/A 1,005,509.86 1,005,509.86 - N/A AAAm NR NR 2.05% 35
CAMP Cash Reserve Portfolio (SANDAG SR 125) N/A N/A 1,894,294.36 1,894,294.36 - N/A AAAm NR NR 2.05% 35
CAMP Cash Reserve Portfolio - Coronado Bridge Toll Funds N/A N/A 280,126.16 280,126.16 - N/A AAAm NR NR 2.05% 35
SANDAG
Detail of Portfolio Balances (by Investment Type)
as of June 30, 2018

Wtd. Avg.
Trade Maturity Unrealized S&P Moody's Fitch Yield Days to
Investment Date Date Book Value Market Value Gain / (Loss) Par Value Rating Rating Rating on Cost Maturity
SANDAG
Detail of Portfolio Balances (by Investment Type)
as of June 30, 2018
CAMP Cash Reserve Portfolio - SANDAG Shoreline Management Account N/A N/A 165,309.10 165,309.10 - N/A AAAm NR NR 2.05% 35
CAMP Cash Reserve Portfolio (RTC) - 2008 Bond Reserve N/A N/A 72,976.04 72,976.04 - N/A AAAm NR NR 2.05% 35
CAMP Cash Reserve Portfolio (RTC) - 2008 Bond Ser A Principal N/A N/A 1.00 1.00 - N/A AAAm NR NR 2.05% 35
CAMP Cash Reserve Portfolio (RTC) - 2008 Bond Ser B Principal N/A N/A 1.00 1.00 - N/A AAAm NR NR 2.05% 35
CAMP Cash Reserve Portfolio (RTC) - 2008 Bond Ser C Principal N/A N/A 1.00 1.00 - N/A AAAm NR NR 2.05% 35
CAMP Cash Reserve Portfolio (RTC) - 2008 Bond Ser D Principal N/A N/A 1.00 1.00 - N/A AAAm NR NR 2.05% 35
CAMP Cash Reserve Portfolio (RTC) - 2010 Bond Ser B Principal N/A N/A 180,346.65 180,346.65 - N/A AAAm NR NR 2.05% 35
CAMP Cash Reserve Portfolio (RTC) - 2010 Bond Ser B Interest N/A N/A 63,661.16 63,661.16 - N/A AAAm NR NR 2.05% 35
CAMP Cash Reserve Portfolio (RTC) - 2010 Bond Ser A Interest N/A N/A 5,019,960.64 5,019,960.64 - N/A AAAm NR NR 2.05% 35
CAMP Cash Reserve Portfolio (RTC) - 2012 Bond Interest N/A N/A 3,929,176.66 3,929,176.66 - N/A AAAm NR NR 2.05% 35
CAMP Cash Reserve Portfolio (RTC) - 2012 Bond Principal N/A N/A 4,473,912.35 4,473,912.35 - N/A AAAm NR NR 2.05% 35
CAMP Cash Reserve Portfolio (SR 125) - Operating/Maint Reserve N/A N/A 24,172,545.34 24,172,545.34 - N/A AAAm NR NR 2.05% 35
CAMP Cash Reserve Portfolio (SR 125) - Capital Expenditures Fund N/A N/A 27,963,182.67 27,963,182.67 - N/A AAAm NR NR 2.05% 35
CAMP Cash Reserve Portfolio (RTC) - Sales Tax N/A N/A 21,989,800.07 21,989,800.07 - N/A AAAm NR NR 2.05% 35
CAMP Cash Reserve Portfolio - Wetland Mitigation (RTC) N/A N/A 298,487.20 298,487.20 - N/A AAAm NR NR 2.05% 35
CAMP Cash Reserve Portfolio - Sage Hill Endowment (RTC) N/A N/A 18,391.89 18,391.89 - N/A AAAm NR NR 2.05% 35
CAMP Cash Reserve Portfolio - TransNet Program Reserve (RTC) N/A N/A 102,938.58 102,938.58 - N/A AAAm NR NR 2.05% 35
CAMP Cash Reserve Portfolio (RTC) - 2014 Bond Ser A Principal N/A N/A 1,267,832.96 1,267,832.96 - N/A AAAm NR NR 2.05% 35
CAMP Cash Reserve Portfolio (RTC) - 2014 Bond Ser A Interest N/A N/A 4,184,456.67 4,184,456.67 - N/A AAAm NR NR 2.05% 35
CAMP Cash Reserve Portfolio (RTC) - 2016 Series A Principal N/A N/A 1,197,737.19 1,197,737.19 - N/A AAAm NR NR 2.05% 35
CAMP Cash Reserve Portfolio (RTC) - 2016 Series A Interest N/A N/A 3,979,593.73 3,979,593.73 - N/A AAAm NR NR 2.05% 35
CAMP Cash Reserve Portfolio (RTC) - 2016 Bond Series A Project N/A N/A 70,649,351.29 70,649,351.29 - N/A AAAm NR NR 2.05% 35
CAMP Cash Reserve Portfolio (RTC) - 2018 Bond Series A Project N/A N/A 114,106,452.10 114,106,452.10 - N/A AAAm NR NR 2.05% 35
CAMP Cash Reserve Portfolio (RTC) - 2018 Bond Series A Interest N/A N/A 4,162,671.52 4,162,671.52 - N/A AAAm NR NR 2.05% 35
State of CA Local Agency Investment Fund (LAIF) (RTC) N/A N/A 64,644,392.78 64,644,392.78 - N/A NR NR NR 1.92% 193
State of CA Local Agency Investment Fund (LAIF) SANDAG N/A N/A 10,013,788.35 10,013,788.35 - N/A NR NR NR 1.92% 193
US Bank Cash Reserve TransNet Extension (RTC) N/A N/A 13,848,061.50 13,848,061.50 - N/A NR NR NR 0.00% 1
Wells Fargo Section 115 Trust N/A N/A 4,601,540.95 4,692,362.74 90,821.79 N/A NR NR NR 2.23% 1
Total money market accounts and funds 494,750,515.87$ 494,841,337.66$ 90,821.79$ N/A 1.79% 80
Total cash and cash equivalents 503,600,351.33$ 503,691,173.12$ 90,821.79$ N/A N/A 78
Investments:
U.S. Agencies:
Federal Home Loan Banks Notes 04/16/2018 03/30/2020 9,301,772.70$ 9,286,626.51$ (15,146.19)$ 9,315,000.00$ AA+ Aaa NR 2.45% 639
FHLMC Notes 12/09/2016 03/27/2019 3,710,504.30 3,552,997.15 (157,507.15) 3,515,000.00 AA+ Aaa AAA 1.28% 270
Federal Home Loan Banks Disc Note 04/18/2018 07/18/2018 26,095,388.93 26,189,051.61 93,662.68 26,214,000.00 A-1+ P-1 NR 1.80% 18

Wtd. Avg.
Trade Maturity Unrealized S&P Moody's Fitch Yield Days to
Investment Date Date Book Value Market Value Gain / (Loss) Par Value Rating Rating Rating on Cost Maturity
SANDAG
Detail of Portfolio Balances (by Investment Type)
as of June 30, 2018
Federal Home Loan Banks Disc Note 04/18/2018 07/18/2018 49,773,763.89 49,952,414.00 178,650.11 50,000,000.00 A-1+ P-1 NR 1.80% 18
FNMA Notes 06/17/2016 07/20/2018 503,715.00 499,805.00 (3,910.00) 500,000.00 AA+ Aaa AAA 0.77% 20
FNMA Benchmark Note 06/17/2016 10/19/2018 503,585.00 498,589.00 (4,996.00) 500,000.00 AA+ Aaa AAA 0.81% 111
FNMA Benchmark Note 06/17/2016 10/19/2018 1,510,755.00 1,495,767.00 (14,988.00) 1,500,000.00 AA+ Aaa AAA 0.81% 111
FNMA Benchmark Note 06/17/2016 01/28/2019 1,521,135.00 1,492,603.50 (28,531.50) 1,500,000.00 AA+ Aaa AAA 0.83% 212
FNMA Benchmark Note 06/17/2016 01/28/2019 507,045.00 497,534.50 (9,510.50) 500,000.00 AA+ Aaa AAA 0.83% 212
FHLMC Notes 06/17/2016 03/27/2019 538,870.00 505,405.00 (33,465.00) 500,000.00 AA+ Aaa AAA 0.90% 270
Freddie Mac Notes 12/10/2015 05/30/2019 722,900.75 711,016.74 (11,884.01) 715,000.00 AA+ Aaa AAA 1.42% 334
FNMA Benchmark Note 07/29/2016 08/02/2019 6,529,012.80 6,431,298.66 (97,714.14) 6,540,000.00 AA+ Aaa AAA 0.93% 398
FNMA Notes 08/31/2016 08/28/2019 7,887,676.00 7,770,795.50 (116,880.50) 7,900,000.00 AA+ Aaa AAA 1.05% 424
FNMA Notes 10/03/2016 08/28/2019 3,717,768.00 3,659,159.40 (58,608.60) 3,720,000.00 AA+ Aaa AAA 1.02% 424
Fannie Mae Global Notes 01/03/2017 10/24/2019 4,155,357.75 4,134,759.05 (20,598.70) 4,215,000.00 AA+ Aaa AAA 1.52% 481
FNMA Notes 07/28/2017 07/30/2020 3,623,985.95 3,552,427.34 (71,558.61) 3,635,000.00 AA+ Aaa AAA 1.60% 761
FHLMC Reference Note 07/19/2016 07/19/2019 5,721,121.30 5,644,404.21 (76,717.09) 5,735,000.00 AA+ Aaa AAA 0.96% 384
FHLMC Reference Note 10/03/2016 07/19/2019 3,488,590.00 3,444,710.50 (43,879.50) 3,500,000.00 AA+ Aaa AAA 0.99% 384
Freddie Mac Notes 04/03/2017 01/17/2020 7,720,983.00 7,603,647.98 (117,335.02) 7,725,000.00 AA+ Aaa AAA 1.52% 566
FHLMC Agency Notes 04/19/2017 04/20/2020 1,729,066.30 1,698,938.03 (30,128.27) 1,735,000.00 AA+ Aaa AAA 1.49% 660
Freddie Mac Notes 07/18/2017 08/15/2019 3,459,906.45 3,424,424.85 (35,481.60) 3,465,000.00 AA+ Aaa AAA 1.45% 411
Fannie Mae Series 10/07/2015 09/01/2019 684,709.75 674,446.97 (10,262.78) 677,921.11 AA+ Aaa NR 1.08% 428
FNMA Series 11/06/2015 01/01/2019 200,051.42 197,464.54 (2,586.88) 198,070.74 AA+ Aaa NR 1.20% 185
FNMA Series 06/09/2016 06/01/2019 655,993.36 646,943.24 (9,050.12) 649,498.69 AA+ Aaa NR 1.05% 336
US Treasury Notes 11/01/2017 10/31/2020 1,409,080.08 1,386,257.10 (22,822.98) 1,425,000.00 AA+ Aaa AAAu 1.76% 854
US Treasury Notes 09/01/2017 08/15/2020 604,858.01 585,754.07 (19,103.94) 585,000.00 AA+ Aaa AAAu 1.44% 777
US Treasury N/B Notes 11/01/2017 04/15/2020 1,990,781.25 1,964,454.00 (26,327.25) 2,000,000.00 AA+ Aaa AAAu 1.69% 655
FHLB Global Note 06/02/2016 06/21/2019 12,604,703.80 12,456,901.99 (147,801.81) 12,610,000.00 AA+ Aaa NR 1.14% 356
FHLB Notes 09/07/2017 09/28/2020 309,004.90 301,397.50 (7,607.40) 310,000.00 AA+ Aaa NR 1.48% 821
FHLB Notes 01/03/2018 09/28/2020 569,548.40 563,905.00 (5,643.40) 580,000.00 AA+ Aaa NR 2.06% 821
FHLB Notes 01/03/2018 09/28/2020 5,303,070.00 5,250,150.00 (52,920.00) 5,400,000.00 AA+ Aaa NR 2.05% 821
FNMA Notes 08/30/2017 02/28/2020 4,704,324.00 4,620,570.00 (83,754.00) 4,700,000.00 AA+ Aaa AAA 1.46% 608
FNMA Notes 03/02/2017 02/28/2020 5,270,108.00 5,210,430.00 (59,678.00) 5,300,000.00 AA+ Aaa AAA 1.70% 608
FNMA Notes 07/28/2017 07/30/2020 274,166.75 268,753.10 (5,413.65) 275,000.00 AA+ Aaa AAA 1.60% 761
FNMA Notes 08/30/2017 07/30/2020 4,674,252.00 4,568,802.70 (105,449.30) 4,675,000.00 AA+ Aaa AAA 1.51% 761
FNMA Notes 08/02/2017 07/30/2020 1,596,544.00 1,563,654.40 (32,889.60) 1,600,000.00 AA+ Aaa AAA 1.57% 761
FHLMC Notes 12/01/2017 11/17/2020 4,087,167.00 4,024,236.10 (62,930.90) 4,100,000.00 AA+ Aaa AAA 1.99% 871
US Treasury Notes 06/27/2016 04/30/2019 3,185,414.64 3,087,171.09 (98,243.55) 3,105,000.00 AA+ Aaa AAAu 0.70% 304
FHLMC Notes 10/26/2017 09/29/2020 821,139.00 807,048.83 (14,090.17) 825,000.00 AA+ Aaa AAA 1.79% 822
Federal Home Loan Bank 10/09/2015 09/14/2018 5,017,550.00 4,990,430.00 (27,120.00) 5,000,000.00 AA+ Aaa AAA 1.00% 76

Wtd. Avg.
Trade Maturity Unrealized S&P Moody's Fitch Yield Days to
Investment Date Date Book Value Market Value Gain / (Loss) Par Value Rating Rating Rating on Cost Maturity
SANDAG
Detail of Portfolio Balances (by Investment Type)
as of June 30, 2018
Federal Home Loan Bank 10/21/2015 09/14/2018 3,015,210.00 2,994,258.00 (20,952.00) 3,000,000.00 AA+ Aaa AAA 0.95% 76
Federal Home Loan Bank 10/21/2015 09/14/2018 1,256,400.00 1,247,607.50 (8,792.50) 1,250,000.00 AA+ Aaa AAA 0.94% 76
Federal Home Loan Bank 08/20/2015 10/30/2018 4,994,550.00 4,984,700.00 (9,850.00) 5,000,000.00 AA+ Aaa AAA 1.16% 122
Federal National Mortgage Association 05/26/2015 11/27/2018 5,576,230.00 5,489,165.00 (87,065.00) 5,500,000.00 AA+ Aaa AAA 1.22% 150
Federal Home Loan Mortgage Corp (Callable) 04/25/2016 01/28/2019 4,993,250.00 4,973,350.00 (19,900.00) 5,000,000.00 AA+ Aaa AAA 1.20% 212
Federal Farm Credit Bank 08/31/2015 01/30/2019 4,004,520.00 3,979,480.00 (25,040.00) 4,000,000.00 AA+ Aaa AAA 1.29% 214
Federal National Mortgage Association (Callable) 10/20/2015 02/25/2019 4,024,800.00 3,974,240.00 (50,560.00) 4,000,000.00 AA+ Aaa AAA 1.11% 240
Federal Home Loan Bank 04/22/2016 03/08/2019 5,057,500.00 4,974,750.00 (82,750.00) 5,000,000.00 AA+ Aaa AAA 1.09% 251
Federal Home Loan Mortgage Corp 05/25/2016 04/15/2019 6,994,820.00 6,935,467.00 (59,353.00) 7,000,000.00 AA+ Aaa AAA 1.15% 289
Federal Farm Credit Bank (Callable) 05/09/2016 05/16/2019 5,500,000.00 5,444,945.00 (55,055.00) 5,500,000.00 AA+ Aaa AAA 1.17% 320
Federal Home Loan Mortgage Corp (Callable) 04/22/2016 10/28/2019 5,000,000.00 4,916,850.00 (83,150.00) 5,000,000.00 AA+ Aaa AAA 1.25% 485
Federal National Mortgage Association (Callable) 10/03/2016 03/30/2020 5,097,450.00 4,987,596.00 (109,854.00) 5,100,000.00 AA+ Aaa AAA 1.26% 639
Federal Home Loan Mortgage Corp (Callable) 10/03/2016 07/06/2020 5,498,625.00 5,365,470.00 (133,155.00) 5,500,000.00 AA+ Aaa AAA 1.38% 737
United States Treasury Note/Bond 01/11/2016 07/31/2018 4,529,003.91 4,498,398.00 (30,605.91) 4,500,000.00 AA+ Aaa AAA 1.12% 31
United States Treasury Note/Bond 06/11/2015 01/31/2019 4,974,218.75 4,972,460.00 (1,758.75) 5,000,000.00 AA+ Aaa AAA 1.40% 215
United States Treasury Note/Bond 03/08/2017 06/15/2019 3,652,449.22 3,648,259.20 (4,190.02) 3,700,000.00 AA+ Aaa AAA 1.45% 350
United States Treasury Note/Bond 10/13/2016 09/30/2019 4,998,437.50 4,912,305.00 (86,132.50) 5,000,000.00 AA+ Aaa AAA 1.01% 457
United States Treasury Note/Bond 10/13/2016 12/31/2019 4,810,125.00 4,704,936.00 (105,189.00) 4,800,000.00 AA+ Aaa AAA 1.06% 549
Total U.S. Agencies 280,662,958.86$ 278,219,382.86$ (2,443,576.00)$ 280,794,490.54$ 1.45% 314
Corporate Medium Term Notes:
The Walt Disney Corp 06/17/2016 09/17/2018 506,355.00$ 498,964.50$ (7,390.50)$ 500,000.00$ A+ A2 A *- 0.92% 79
Microsoft Corp Notes 06/17/2016 11/03/2018 1,509,285.00 1,494,444.00 (14,841.00) 1,500,000.00 AAA Aaa AA+u 1.03% 126
Wal-Mart Stores Inc Corp Note 06/17/2016 12/15/2018 1,537,620.00 1,495,711.50 (41,908.50) 1,500,000.00 AA Aa2 AA 0.93% 168
American Express Credit (Callable) Note 09/01/2017 03/03/2020 3,024,630.00 2,960,640.00 (63,990.00) 3,000,000.00 A- A2 A 1.86% 612
American Honda Finance Corp Notes 02/18/2016 02/22/2019 1,144,771.00 1,138,573.12 (6,197.88) 1,145,000.00 A+ A2 NR 1.71% 237
Branch Banking & Trust (Callable) Notes 10/23/2017 02/01/2021 999,540.00 972,501.00 (27,039.00) 1,000,000.00 A- A2 A+ 2.17% 947
Berkshire Hathaway Inc Notes 03/08/2016 03/15/2019 839,361.60 835,626.12 (3,735.48) 840,000.00 AA Aa2 A+u 1.73% 258
Berkshire Hathaway Inc Corporate Notes 08/08/2016 08/15/2019 959,068.80 945,554.88 (13,513.92) 960,000.00 AA Aa2 A+u 1.33% 411
Caterpillar Finl Service Note 09/05/2017 09/04/2020 1,463,769.40 1,426,631.65 (37,137.75) 1,465,000.00 A A3 A 1.88% 797
Chevron Corp Notes 02/28/2017 02/28/2019 1,470,000.00 1,460,802.21 (9,197.79) 1,470,000.00 AA- Aa2 NR 1.69% 243
John Deere Capital Corp Note 01/05/2016 01/08/2019 949,943.00 947,112.00 (2,831.00) 950,000.00 A A2 A 1.95% 192
John Deere Capital Corp Notes 01/03/2018 01/08/2021 419,781.60 412,637.40 (7,144.20) 420,000.00 A A2 A 2.37% 923
General Electric Co Corporate Note 09/25/2017 05/04/2020 3,829,770.00 3,647,840.00 (181,930.00) 3,500,000.00 A A2 A 1.83% 674
Home Depot Inc Corp Notes 05/24/2017 06/05/2020 1,044,393.90 1,026,203.59 (18,190.31) 1,045,000.00 A A2 Au 1.82% 706
Honeywell International Corp Notes 10/23/2017 10/30/2019 544,574.90 538,210.94 (6,363.96) 545,000.00 A A2 A 1.84% 487
IBM Credit Corp Note 09/05/2017 09/06/2019 1,678,723.20 1,658,773.20 (19,950.00) 1,680,000.00 A+ A1 A+ 1.66% 433
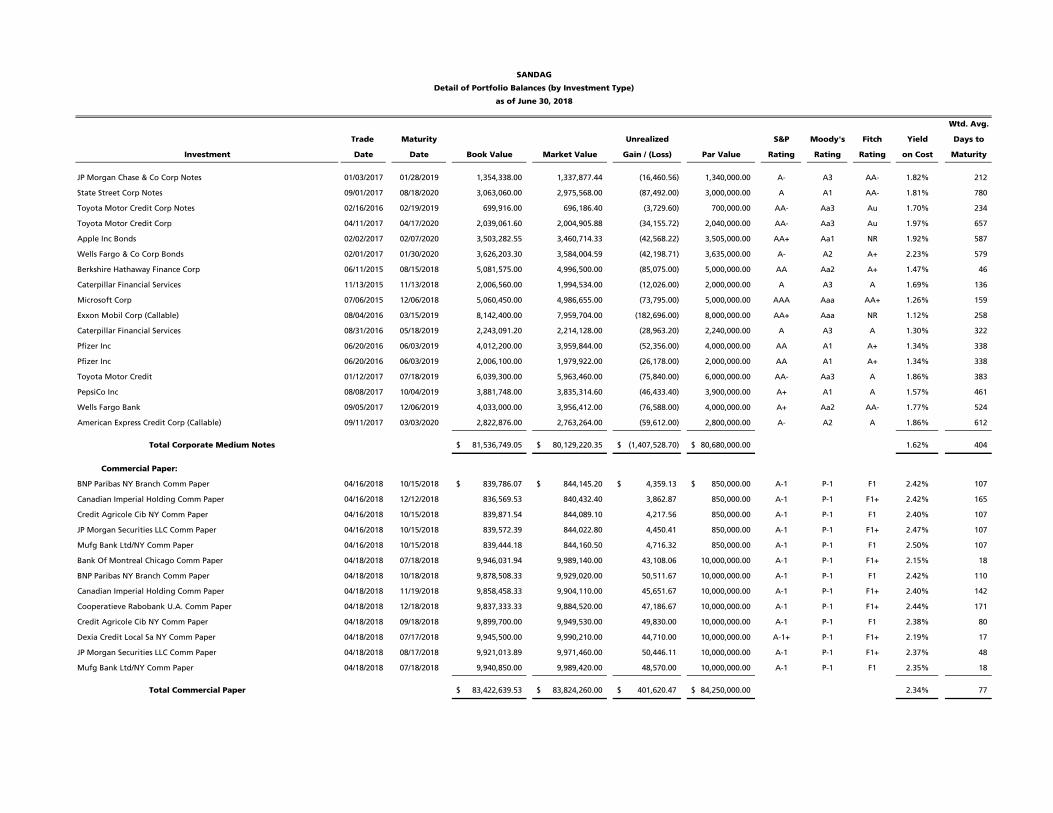
Wtd. Avg.
Trade Maturity Unrealized S&P Moody's Fitch Yield Days to
Investment Date Date Book Value Market Value Gain / (Loss) Par Value Rating Rating Rating on Cost Maturity
SANDAG
Detail of Portfolio Balances (by Investment Type)
as of June 30, 2018
JP Morgan Chase & Co Corp Notes 01/03/2017 01/28/2019 1,354,338.00 1,337,877.44 (16,460.56) 1,340,000.00 A- A3 AA- 1.82% 212
State Street Corp Notes 09/01/2017 08/18/2020 3,063,060.00 2,975,568.00 (87,492.00) 3,000,000.00 A A1 AA- 1.81% 780
Toyota Motor Credit Corp Notes 02/16/2016 02/19/2019 699,916.00 696,186.40 (3,729.60) 700,000.00 AA- Aa3 Au 1.70% 234
Toyota Motor Credit Corp 04/11/2017 04/17/2020 2,039,061.60 2,004,905.88 (34,155.72) 2,040,000.00 AA- Aa3 Au 1.97% 657
Apple Inc Bonds 02/02/2017 02/07/2020 3,503,282.55 3,460,714.33 (42,568.22) 3,505,000.00 AA+ Aa1 NR 1.92% 587
Wells Fargo & Co Corp Bonds 02/01/2017 01/30/2020 3,626,203.30 3,584,004.59 (42,198.71) 3,635,000.00 A- A2 A+ 2.23% 579
Berkshire Hathaway Finance Corp 06/11/2015 08/15/2018 5,081,575.00 4,996,500.00 (85,075.00) 5,000,000.00 AA Aa2 A+ 1.47% 46
Caterpillar Financial Services 11/13/2015 11/13/2018 2,006,560.00 1,994,534.00 (12,026.00) 2,000,000.00 A A3 A 1.69% 136
Microsoft Corp 07/06/2015 12/06/2018 5,060,450.00 4,986,655.00 (73,795.00) 5,000,000.00 AAA Aaa AA+ 1.26% 159
Exxon Mobil Corp (Callable) 08/04/2016 03/15/2019 8,142,400.00 7,959,704.00 (182,696.00) 8,000,000.00 AA+ Aaa NR 1.12% 258
Caterpillar Financial Services 08/31/2016 05/18/2019 2,243,091.20 2,214,128.00 (28,963.20) 2,240,000.00 A A3 A 1.30% 322
Pfizer Inc 06/20/2016 06/03/2019 4,012,200.00 3,959,844.00 (52,356.00) 4,000,000.00 AA A1 A+ 1.34% 338
Pfizer Inc 06/20/2016 06/03/2019 2,006,100.00 1,979,922.00 (26,178.00) 2,000,000.00 AA A1 A+ 1.34% 338
Toyota Motor Credit 01/12/2017 07/18/2019 6,039,300.00 5,963,460.00 (75,840.00) 6,000,000.00 AA- Aa3 A 1.86% 383
PepsiCo Inc 08/08/2017 10/04/2019 3,881,748.00 3,835,314.60 (46,433.40) 3,900,000.00 A+ A1 A 1.57% 461
Wells Fargo Bank 09/05/2017 12/06/2019 4,033,000.00 3,956,412.00 (76,588.00) 4,000,000.00 A+ Aa2 AA- 1.77% 524
American Express Credit Corp (Callable) 09/11/2017 03/03/2020 2,822,876.00 2,763,264.00 (59,612.00) 2,800,000.00 A- A2 A 1.86% 612
Total Corporate Medium Notes 81,536,749.05$ 80,129,220.35$ (1,407,528.70)$ 80,680,000.00$ 1.62% 404
Commercial Paper:
BNP Paribas NY Branch Comm Paper 04/16/2018 10/15/2018 839,786.07$ 844,145.20$ 4,359.13$ 850,000.00$ A-1 P-1 F1 2.42% 107
Canadian Imperial Holding Comm Paper 04/16/2018 12/12/2018 836,569.53 840,432.40 3,862.87 850,000.00 A-1 P-1 F1+ 2.42% 165
Credit Agricole Cib NY Comm Paper 04/16/2018 10/15/2018 839,871.54 844,089.10 4,217.56 850,000.00 A-1 P-1 F1 2.40% 107
JP Morgan Securities LLC Comm Paper 04/16/2018 10/15/2018 839,572.39 844,022.80 4,450.41 850,000.00 A-1 P-1 F1+ 2.47% 107
Mufg Bank Ltd/NY Comm Paper 04/16/2018 10/15/2018 839,444.18 844,160.50 4,716.32 850,000.00 A-1 P-1 F1 2.50% 107
Bank Of Montreal Chicago Comm Paper 04/18/2018 07/18/2018 9,946,031.94 9,989,140.00 43,108.06 10,000,000.00 A-1 P-1 F1+ 2.15% 18
BNP Paribas NY Branch Comm Paper 04/18/2018 10/18/2018 9,878,508.33 9,929,020.00 50,511.67 10,000,000.00 A-1 P-1 F1 2.42% 110
Canadian Imperial Holding Comm Paper 04/18/2018 11/19/2018 9,858,458.33 9,904,110.00 45,651.67 10,000,000.00 A-1 P-1 F1+ 2.40% 142
Cooperatieve Rabobank U.A. Comm Paper 04/18/2018 12/18/2018 9,837,333.33 9,884,520.00 47,186.67 10,000,000.00 A-1 P-1 F1+ 2.44% 171
Credit Agricole Cib NY Comm Paper 04/18/2018 09/18/2018 9,899,700.00 9,949,530.00 49,830.00 10,000,000.00 A-1 P-1 F1 2.38% 80
Dexia Credit Local Sa NY Comm Paper 04/18/2018 07/17/2018 9,945,500.00 9,990,210.00 44,710.00 10,000,000.00 A-1+ P-1 F1+ 2.19% 17
JP Morgan Securities LLC Comm Paper 04/18/2018 08/17/2018 9,921,013.89 9,971,460.00 50,446.11 10,000,000.00 A-1 P-1 F1+ 2.37% 48
Mufg Bank Ltd/NY Comm Paper 04/18/2018 07/18/2018 9,940,850.00 9,989,420.00 48,570.00 10,000,000.00 A-1 P-1 F1 2.35% 18
Total Commercial Paper 83,422,639.53$ 83,824,260.00$ 401,620.47$ 84,250,000.00$ 2.34% 77

Wtd. Avg.
Trade Maturity Unrealized S&P Moody's Fitch Yield Days to
Investment Date Date Book Value Market Value Gain / (Loss) Par Value Rating Rating Rating on Cost Maturity
SANDAG
Detail of Portfolio Balances (by Investment Type)
as of June 30, 2018
Supra-National Agency Bond/Note
Inter-American Development Bank 10/02/2017 11/09/2020 3,638,415.12$ 3,556,512.75$ (81,902.37)$ 3,605,000.00$ AAA Aaa AAA 1.81% 863
Intl Bank Of Reconstruction & Dev Notes 09/27/2017 10/07/2019 1,844,909.00 1,819,475.90 (25,433.10) 1,835,000.00 AAA Aaa AAAu 1.60% 464
Intl Bank Of Reconstruction And Dev Note 09/12/2017 09/12/2020 3,666,180.00 3,583,676.25 (82,503.75) 3,675,000.00 AAA Aaa AAAu 1.64% 805
International Finance Corporation Note 01/18/2018 01/25/2021 1,540,457.70 1,526,671.67 (13,786.03) 1,545,000.00 AAA Aaa NR 2.35% 940
Int'l Bank For Recon And Development 04/07/2017 04/21/2020 5,025,900.00 4,934,152.50 (91,747.50) 5,000,000.00 AAA Aaa AAA 1.70% 661
Total Supra-National Agency Bond/Notes 15,715,861.82$ 15,420,489.07$ (295,372.75)$ 15,660,000.00$ 1.77% 745
Certificates of Deposits:
Skandinav Enskilda Banken NY CD 08/03/2017 08/02/2019 3,898,479.00$ 3,866,354.70$ (32,124.30)$ 3,900,000.00$ A+ Aa2 NR 1.85% 398
Bank Of Nova Scotia Houston Lt CD 04/05/2017 04/05/2019 4,440,000.00 4,414,212.48 (25,787.52) 4,440,000.00 A-1 P-1 NR 1.91% 279
Bank Of Montreal Chicago Cert Deposit 02/08/2017 02/07/2019 5,000,000.00 4,990,685.00 (9,315.00) 5,000,000.00 A-1 P-1 NR 1.90% 222
Mufg Bank Ltd/NY Cert Deposit 09/25/2017 09/25/2019 1,950,000.00 1,930,501.95 (19,498.05) 1,950,000.00 A A1 A 2.07% 452
Credit Suisse New York Cert Deposit 02/07/2018 02/07/2020 1,920,000.00 1,919,928.96 (71.04) 1,920,000.00 A A1 NR 2.67% 587
Nordea Bank AB NY CD 02/20/2018 02/20/2020 2,875,000.00 2,859,834.38 (15,165.62) 2,875,000.00 AA- Aa3 NR 2.72% 600
Svenska Handelsbanken NY Lt CD 01/10/2017 01/10/2019 5,000,000.00 4,978,285.00 (21,715.00) 5,000,000.00 A-1+ P-1 NR 1.91% 194
Swedbank (New York) Cert Deposit 11/16/2017 11/16/2020 2,905,000.00 2,844,337.79 (60,662.21) 2,905,000.00 AA- Aa2 NR 2.30% 870
Westpac Banking Corp NY CD 08/03/2017 08/03/2020 3,500,000.00 3,444,609.00 (55,391.00) 3,500,000.00 AA- Aa3 NR 2.05% 765
Canadian Imperial Bank NY CD 12/01/2016 11/30/2018 4,421,548.50 4,413,433.05 (8,115.45) 4,425,000.00 A-1 P-1 NR 1.78% 153
Total Certificates of Deposits 35,910,027.50$ 35,662,182.31$ (247,845.19)$ 35,915,000.00$ 2.05% 402
Asset-Backed Security:
Ally ABS 03/21/2017 08/15/2021 799,905.68$ 792,864.32$ (7,041.36)$ 800,000.00$ NR Aaa AAA 1.79% 1,142
Ally ABS 01/24/2017 06/15/2021 769,932.70 763,615.78 (6,316.92) 770,000.00 NR Aaa AAA 1.70% 1,081
Allya 11/14/2017 03/15/2022 1,504,883.21 1,486,855.87 (18,027.34) 1,505,000.00 AAA Aaa NR 1.99% 1,354
CNH ABS 09/13/2016 02/15/2020 244,479.43 244,223.83 (255.60) 244,501.68 AAA Aaa NR 1.27% 595
Harot 11/22/2017 11/21/2021 1,084,847.12 1,070,278.61 (14,568.51) 1,085,000.00 NR Aaa AAA 2.06% 1,240
Honda ABS 03/21/2017 07/21/2021 459,972.63 455,383.99 (4,588.64) 460,000.00 NR Aaa AAA 1.72% 1,117
Hyundai ABS 09/14/2016 04/15/2021 1,099,851.94 1,085,590.22 (14,261.72) 1,100,000.00 AAA Aaa NR 1.30% 1,020
Hyundai ABS 03/22/2016 09/15/2020 538,835.28 536,267.66 (2,567.62) 538,939.83 AAA Aaa NR 1.57% 808
Hyundai ABS 03/22/2017 08/15/2021 429,965.21 424,446.85 (5,518.36) 430,000.00 AAA NR AAA 1.76% 1,142
Hyundai ABS 08/09/2017 01/15/2022 1,254,782.51 1,233,337.95 (21,444.56) 1,255,000.00 AAA Aaa NR 1.78% 1,295
John Deere ABS 02/22/2017 04/15/2021 529,924.53 525,056.58 (4,867.95) 530,000.00 NR Aaa AAA 1.79% 1,020
Nissan ABS 04/18/2016 01/15/2021 422,902.50 419,049.64 (3,852.86) 422,968.10 NR Aaa AAA 1.33% 930
Toyota ABS 02/23/2016 03/15/2020 746,580.12 743,078.53 (3,501.59) 746,622.45 AAA Aaa NR 1.25% 624
Toyota ABS 08/01/2016 08/15/2020 500,757.37 496,827.72 (3,929.65) 500,770.79 AAA Aaa NR 1.14% 777
Taot 01/23/2018 05/16/2022 999,988.50 989,890.50 (10,098.00) 1,000,000.00 AAA Aaa NR 2.35% 1,416

Wtd. Avg.
Trade Maturity Unrealized S&P Moody's Fitch Yield Days to
Investment Date Date Book Value Market Value Gain / (Loss) Par Value Rating Rating Rating on Cost Maturity
SANDAG
Detail of Portfolio Balances (by Investment Type)
as of June 30, 2018
Taot 11/07/2017 01/15/2022 1,229,886.59 1,210,439.56 (19,447.03) 1,230,000.00 AAA Aaa NR 2.26% 1,295
Toyota ABS 03/07/2017 02/15/2021 254,969.99 252,516.25 (2,453.74) 255,000.00 AAA Aaa NR 1.74% 961
Total Asset-Backed Security 12,872,465.31$ 12,729,723.86$ (142,741.45)$ 12,873,802.85$ 1.78% 1,126
Certificates of Participation:
North County Transit District Certificates of Participation 06/13/2018 08/07/2018 25,550,000.00$ 25,550,000.00$ -$ 25,550,000.00$ NR A1 NR 1.37% 38
Total Certificates of Participation 25,550,000.00$ 25,550,000.00$ -$ 25,550,000.00$ 1.37% 38
Total investments 535,670,702.07$ 531,535,258.45$ (4,135,443.62)$ N/A 1.67% 315
Total Portfolio: 1,039,271,053.40$ 1,035,226,431.57$ (4,044,621.83)$ N/A 1.72% 200
Legend:
Automated Regional Justice Information System (ARJIS)
Commercial Paper (CP)
State of California Local Agency Investment Fund (LAIF)
North County Transit District (NCTD)
San Diego County Regional Transportation Commission (RTC)