
Advanced Corridor Operations Techniques - dot.ca.gov · Limitation in capacity expansion 29....
64
Advanced Corridor Operations Techniques
Transcript of Advanced Corridor Operations Techniques - dot.ca.gov · Limitation in capacity expansion 29....

Advanced Corridor Operations
Techniques

What Is a Corridor?“A broad geographical band that follows a general directional flow connecting major sources of trips that may contain a number of streets, highways and transit route alignments.”
From “Glossary of Regional Transportation Systems Management and Operations Terms” (TRB Circular)
2

How Travelers Use a Corridor
• Travelers view the transportation network as a whole
• When faced with congestion on one facility, travelers may respond by
Selecting a different facility (transit or roadway),
Adjusting their trip to another time of day, or
Remaining on their current route
• Should we manage the corridor to reflect how travelers use it?
3

Corridor Management
Corridors offer opportunities to operate and optimize the entire system Beyond individual networks
Transportation corridors often contain unused capacity Parallel routes Non-peak direction Single-occupant vehicles Underutilized transit services
Managing the corridor can more fully utilize this capacity Management approaches like ramp metering Traveler information and outreach
4

Active Traffic Management
5

What Is Active Traffic Management?
Traffic management concepts intended to:
Enhance roadway safety
Reduce congestion
Provide reliable trips
Provide enhanced information to motorists
Leverage available capacity during periods of congestion or incidents
6
M 42 Speed Harmonization and hard
shoulder lane in England. (UK
Highways Agency)

Examples of ATMLane-use control
Variable speed limits / advisories
Queue warning
Hard shoulder running
Dynamic re-routing
Junction control
Adaptive ramp metering
Active Traffic Management is not limited to urban areas!
7

ATM Simulation
Video 1
8

ATM Simulation
Video 2
9

Examples of ATM in the US
Seattle
Minneapolis
I-66 (Northern Virginia)
Los Angeles
Dallas “Horseshoe”
Denver
Utah I-80 Parley’s Canyon
I-80 (SF Bay Area)
New York Long Island Expressway
Philadelphia I-95
Portland, OR
New Jersey
I-80 Wyoming
Others?
1010
Many examples in Europe and around the world!

Variable Speed System on Rural Corridors
11
I-80 in Wyoming
I-80 in Utah, Parley’s Canyon

Wyoming I-80
AADT 11,000
<50% of I-80 traffic is heavy trucks
12
Significantly
reduced crashes
for trucks and
other vehicles

I-80 Integrated Corridor Mobility
13

Freeway Infrastructure
14

I-80 Corridor Institutional Environment
1 DOT, 9 cities, 2 MPOs, 2 transit agencies
Different stages of infrastructure
Staging of implementation
Arterials first, freeways next (some delays due to concrete piles)
Some equipment went out of warranty before complete
Maintenance
MOU for local agencies
Regional maintenance agreement for maintenance funding
15

OR217 Portland, ORLaunched July 2014
7.5 miles, 110,000 AADT
Incorporated travel times
Variable speeds
Enhanced existing adaptive ramp metering system
Metering rates adjustable through corridor
16

WSDOT’s Smarter Highways
Variable speed limits, lane control, traveler information
Reduce speeds approaching congestion, crashes, work zones
Warn motorists of downstream queues
Display which lanes are open, closed, and closed ahead
Primary objective is safety improvement
17

ATM in Action in Seattle Area
18

Los Angeles Junction Control
NB SR 101 to NB I-5 connector
High collision experience
Congestion
High ramp demand
19

Re-stripe Connector to Two Lanes
20

Replace Crash Attenuators
21

The Use of ATM is Expanding
ATM has moved beyond stand alone implementations
ATM is compatible with other combined, integrated approaches Traffic incident
management
Work zone traffic management
Managed lanes
22

Ramp MeteringReduces overall freeway congestion by managing the amount of
traffic entering the freeway and by breaking up platoons
Algorithm determines entrance rate based on mainline volume, speed, queue length
Objective is to limit the amount of traffic entering freeway to minimize flow breakdown
Widely used throughout California
What about the Altamont Corridor?
23

Ramp Metering BenefitsMobility, Reliability, and Efficiency
Reduced travel times Increased travel time reliability Increased mainline speeds
Safety Crash reduction
Reduced Environmental Impacts Reduces stop-and-go conditions Less fuel consumed
Low cost with High Benefit/Cost Ratio Cost effectiveness Twin Cities metering had B/C ratio of 15 : 1
Probably the most proven freeway management strategy
Leverage ITS infrastructure Reduced environmental documentation
24

Ramp Meter Safety Benefits
Location Benefit
Portland, OR 43% reduction in peak period collisions
Minneapolis, MN 24% reduction in peak period collisions
Seattle, WA 39% reduction in collision rate
Denver, CO 50% reduction in rear-end collisions
Detroit, MI 50% reduction in total collisions and 71%
reduction in injury collisions
Long Island, NY 15% reduction in collision rate
25
FHWA Ramp Management Handbook

Public Perception Challenges
Understanding of Purpose and Benefits
Metering during congested vs non-congested time-of-day
Comparisons to adjacent ramp conditions Wait Time
Cycle Length
Metering congested vs non-congested roadways
26

Is ATM the Right Solution?
ATM sounds great! How do I get started?
Important considerations: What roadway networks and facilities would be best
suited for ATM in my region?
What specific or combination of ATM strategies would work best?
What would be the range of expected benefits?
What would be the expected costs (capital and ongoing)?
27

Guidance DocumentATM Feasibility and Screening Guide
http://www.ops.fhwa.dot.gov/publications/fhwahop14019/fhwahop14019.pdf
28

Success Factors
High traffic volumes
Changes in prevailing conditions
High prevalence of crashes
Bottlenecks
Adverse weather
Variability in trip reliability
Construction impacts
Financial constraints
Limitation in capacity expansion
29

Examples of ATM Benefits in USI-5 Seattle 4.1% reduction in crashes 4.4 % increase in crashes on
SB segment of I-5 (no ATM)
Minneapolis 20+ % decrease in PDO
crashes 17% less congestion during AM
peak
30
LA Junction ControlNB SR-110 to NB I-5Average ramp delay
decreased from 20 minutes to 5 minutes
30% decrease in crashes
Chicago Bus on ShoulderOn-time performance from
68% to 92%No adverse impact on safety
OR217 Portland► 21% reduction in crashes
► 5% increase in throughput during peak period
► 10% reduction travel time variability

Cost Considerations
Gantries and signs Need to make assumptions
on spacing and layout
Widening, refuge areas, shoulder treatments Environmental issues
Ramp treatments
Traffic signal controllers
Detection
Communications / power
31
New software Automated algorithms /
decision support
Systems engineering activities
Public outreach
On-going operations and maintenance Training
Contingency

Assumptions on Gantry Spacing and Layout
Concerns with costs of frequent full gantries
MUTCD requirements on guide sign distances 600 to 800 feet
Significant testing in UK of different spacing / layouts Driver simulations Visualization / response
monitoring software
32
Moving towards more of a
HYBRID approach (“ATM
Lite”)
Longer spacings
between full gantries
(e.g., after on ramps)
Use of side-mounted
signs in-between
Significant reduction in
costs

WSDOT Outreach ExamplesSmarter highways video on Youtube
http://www.youtube.com/wsdot#p/u/12/cd0doR0Ga-I
Smarter highways www.smarterhighways.com
Posted links on Twitter, Facebook and WSDOT blog
Outreach to cities, counties, businesses, colleges
33

Group Discussion
What other examples of ATM have you heard about?
What technologies are in use here that you would consider active traffic management?
What types of ATM could have a positive impact on operations in the Altamont corridor?
34

BREAK
35Session V – Advanced Operations Techniques

INTEGRATED CORRIDOR
MANAGEMENT
36

Integrated Corridor Management
ICM Background and Concepts
Status of the Federal ICM Initiative and Sites
Planning for ICM
Stakeholders
Integrating with existing plans and programs
ICM Concept of Operations
Agreements
Modeling and Performance Measures
Integration to Support ICM Strategies
97

What Is ICM?
98
► Maximize corridor capacity through:
►New institutional models
►New technology
►More dynamic operational strategies

USDOT ICM Initiative
39
• I-10, Phoenix, AZ
• I-210, LA/Pasadena, CA
• SR4, Bay Area, CA
• I-95, Broward Co., FL
• I-95/MD295/US1, Baltimore, MD
• NJ Turnpike and US1
• NYC – multiple corridors
• I-90 Buffalo-Niagra, NY
• I-84, Portland, OR
• IH-10/US-54/IH-110, El Paso, TX
• IH-35, Austin, TX
• I-15, Salt Lake City, UT
• Northern VA – multiple corridors
ICM Pilot Sites:
• San Diego, CA
• Dallas, TX
Key Elements:• Decision Support Systems
• Institutional Agreements
• Operational Strategies
• Multimodal
ICM Planning Grants:

SANDAG I-15 ICM Primary artery for the movement of commuters, goods,
and services from north San Diego County to downtown.
I-15 Managed Lanes System
Multi Institutional Cooperation/ Partnerships
Multi-modal Transportation Improvement Strategies and Mode Shift – BRT, TSP
511, including transit information
40

I-15 ICM Decision Support“Response Postures”
41

I-15 ICM Response Plans 156 Alternate Routes
260 Local Arterial Intersections
18 Metered Interchanges
20 Dynamic Message Signs
5 BRT stations
20 miles HOT – reversible lanes
30 miles Traffic Responsive
511 (including app)
42
Limited set of “point-in-
time” Response Plans by:
Using Asset Restrictions
Using Availability Conditions
Using Thresholds to select
“next move” relationships
= 1.5 billion combinations!

Dallas US-75 ICM Freeway with continuous
frontage roads
Managed HOV lanes
Dallas North Tollway
Arterials
Bus Network, Light Rail
Approx. 900 traffic signals
Multiple TMCs
Regional ATIS (511)
43

US 75 ICM Decision Support
44

USDOT ICM Status Update
San Diego and Dallas went “live” in early 2013
Testing and evaluating the DSS in both regions (3-year evaluation)
Independent evaluation
Early lessons:
Agreements are tough. Most challenging part of ICM.
Data integration from multiple systems and multiple networks
Determining mode shift is difficult, working through how to evaluate effectiveness
Combinations of strategies also are challenging to evaluate
45

AZ Loop 101 ICMArizona DOT, Scottsdale,
Maricopa County, SRPMIC Tribe
Event-driven ICM for freeway closures
Positives: Dense arterial ITS
Experienced TMC staff
Provide arterial alt route
REACT to support arterial traffic diversions
Focus on process improvements
No new infrastructure
46

California Connected Corridors
Initiated in 2011 – Statewide Framework
Focus on planning, implementation, O&M
Implement TSM&O on their most congested corridors (50)
Evolve Caltrans to real-time operations and management
Enhance partnerships
Optimize infrastructure and capacity
Improve overall corridor performance
47
Connected Corridors – VIP
Vehicles, Infrastructure and People
Connected &
Automated Vehicles
Connected Infrastructure
Connected Travelers
Enhanced Decision Support
Corridor Centric Social
Networking

I-210 Project Corridor (Pilot)
48
Freeway Interchange
Freeway
Arterial
N Not to
scaleColorado St
Colorado Pl
Longden Ave
Arrow Hwy
Orange Grove Blvd
Colorado Blvd
Foothill Blvd
Route 66 / Alosta Ave
Arrow Hwy
Gladstone St
Corson St
Ro
se
me
ad
Blv
d
Azu
sa
Ave
Las Tunas Dr
Del Mar Blvd
All
en
Ave
Hill A
ve
La
ke
Ave
Ma
ren
go
Ave
Fa
ir O
ak
s A
ve
Sa
n G
ab
rie
l B
lvd
Sierra
Madre Blvd
Arroyo
Pkwy
St John Ave
Walnut St
Green St Union St
Maple St
Myrt
le A
ve
Mo
un
tain
Ave
Bu
en
a V
ista
St
Citru
s A
ve
Gra
nd A
ve
San D
imas C
anyon R
d
San D
imas A
ve
Lone H
ill A
ve
Am
elia
Ave
Irw
indale
Ave
Pasadena Ave
Los R
oble
s
Mic
hili
linda
Ave
Sie
rra M
adre
Vill
a A
ve
Altadena A
ve
Segment 1 Area of Interest
to Arroyo Blvd
to Figueroa St (freeway only)
End of corridor
slightly east of
I-605

Michigan DOT I-75 Concept of Operations
Travel time reliability within the corridor (freeways and arterials)
Improved traveler information
Incident response
Improved agency coordination
Coordinated use of resources and technologies
Public outreach and education on multi-modal transportation options
CVO through the corridor
Developed a ConOps and Requirements (2008)
Corridor Integration CMM helped guide areas for improvement
49
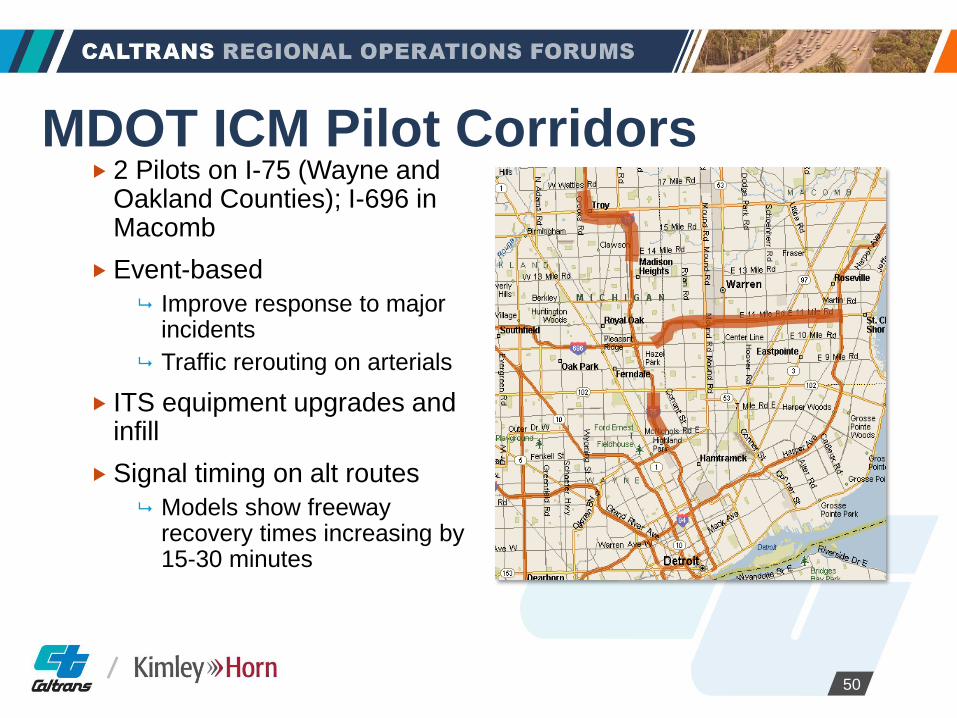
MDOT ICM Pilot Corridors 2 Pilots on I-75 (Wayne and
Oakland Counties); I-696 in Macomb
Event-based
Improve response to major incidents
Traffic rerouting on arterials
ITS equipment upgrades and infill
Signal timing on alt routes
Models show freeway recovery times increasing by 15-30 minutes
50

Stakeholder Roles for ICM
Identifying the right partners
Key partners
Freeway management and operations – TOC, freeway service patrol, freeway incident response
Arterial management and operations – TOC, signal operations
Transit
Incident response and management – freeway and arterial incident response/law enforcement
MPO – planning
Others to be determined on a regional level based on operational need
Leadership commitment – key to sustaining partnerships. You already have this!
51

Leveraging ICM
ITS Plans or Updates/TSMO Planning
Traffic Incident Management Coalitions
Standing Committee Meetings (ITS Partners)
Large-scale freeway or arterial improvement projects
TIP funding cycles
RTP updates
Follow up initiatives from RCTO and other Ops Plans
Plant seeds, build interest, introduce ICM as a collaborative, regional effort
52

Analysis, Modeling and Simulation
Test different scenarios identified in the ConOps
Used available data and future projections
Modeled ICM strategies under typical and incident conditions
Results from the AMS showed: Improved mobility, particularly during NRC
Improved reliability – 2% - 23%
Reduced toxic emissions and fuel consumption
Strong potential for fiscal benefits
53
ICM Performance MeasuresNational evaluation is looking at the following MOEs:
Vehicle and person throughput Travel times and travel time index Standard deviation of travel time 80th, 90th, and 95th percentile travel
times Buffer and Planning Indices Traveler Response Safety benefits
Other ICM Objectives could be… Traveler information TIM Data sharing Institutional participation
54

Demonstration Site Measures
Travel Time
Delay
Throughput
Reliability and Variance of Travel Time
Safety
Emissions and Fuel Consumption
55
Travel Time Reliability
Increase Corridor Throughput
Improve Incident Management
Enable Intermodal Travel Decisions
San Diego Dallas

Interagency Agreements
Essential for ICM and multi-agency operations strategies
New operations models, potential for joint operations
Data sharing and system connectivity
Often, the most complex part of an ICM program and strategy
Examples – I-80, SANDAG, AZ
Operating and operating authority
Data sharing parameters
Cost sharing
Decision making
56

Real-time Data Sharing to Support ICMRegional strategies for sharing data
What information do partners need?
Operations data to support ICM
Real-time freeway, arterial and transit operations
Real-time strategy implementation information
Agency notifications
Overcoming institutional barriers to effective data sharing
SANDAG (San Diego/D11)
RITIS (I-95)
RADS (Arizona)
57

SANDAG Data Hub

Regional Integrated Transportation Information System (RITIS)
59

Regional Archived Data System
60

Staffing and Training
Staff capacity building Current staff vs. supplementing staff
Leveraging available regional technical staff resources
Staff training needs for ICM and next-generation operations New systems and new operational approaches
Multi-agency training strategies essential
61

ICM Resources
California Connected Corridors http://connected-corridors.berkeley.edu/
FHWA/USDOT its.dot.gov/icms
ICM Knowledge and Technology Transfer (KTT)
Guidance documents for each stage – planning, stakeholder engagement, design, test plan, modeling, training, lessons learned
Fact sheets
62

Managing a Corridor Considerations
What is the status of the current ICM planning efforts in D10?
What are your initial considerations?
How would you go about developing a plan for corridor management?
Who would you involve?
What technologies/systems/actions would you consider?
What are the major gaps or challenges you see in implementing the plan?
What would you do to give your plan the best chance of success, especially considering the gaps/challenges?
63

Breakout Group Activity
If ICM is implemented, how do you see agency roles and responsibilities changing? Freeway
Arterial
MPO/Planning
Other partners
Are there other strategies that the region should explore for ICM on the Altamont Corridor?
Based on what you have heard over the last 2 days, what institutional and technical challenges do you see for ICM on the Altamont (or other) corridors?


