profiles of the adult education target population - U.S. Department of

Adult Population Profile, Health and Wellbeing Surveillance System, 2010 Health Regions
Health Survey Unit, Epidemiology Branch Public Health Division, Department of Health, WA

Acknowledgements: Thanks are extended to the people of Western Australia who participated in
the Health and Wellbeing Survey. Appreciation is extended to our colleagues
and specialists in the field who contributed to the content and integrity of the
system and this document.
Suggested Citation: Epidemiology Branch (2011). Adult Population Profile, Health and Wellbeing
Surveillance System, 2010: Health Regions. Perth: Department of Health WA.
Correspondence to: Principal Epidemiologist
Epidemiology Branch, Public Health Division
Department of Health
PO BOX 8172
Perth Business Centre WA 6849
Email: [email protected]
2

Background
The information contained in this report was taken from the WA Health and
Wellbeing Surveillance System (HWSS) from 1st January 2010 to 31st
December 2010 for persons aged 16 years and over. The HWSS is an
ongoing data collection interviewing over 6000 people each year by a
Computer Assisted Telephone Interview (CATI). Information presented is
based on self-report from the respondents.
The HWSS was developed to monitor the health and wellbeing of Western
Australians. People are asked a range of questions on a range of indicators
related to health and wellbeing, including chronic health conditions, lifestyle
risk factors, protective factors and socio-demographics. The data can be
considered representative of the population but will not be representative of
small or specific groups such as Aboriginal people or people from non English
speaking backgrounds. All conditions are self-reported.
The data is weighted to compensate for oversampling in the remote and rural
areas of WA and then adjusted to the age and sex distribution of the WA
population using the 2009 Estimated Resident Population.
3
4

Goldfields Population Profile, Health and Wellbeing Surveillance System (HWSS), January to December 2010Goldfields Population Profile, Health and Wellbeing Surveillance System (HWSS), January to December 2010
Goldfields Western Australia Significant differences*
Prevalence EstimateEstimated
Pop^Prevalence Estimate From WA
Female Male Persons Persons Female Male Persons Female Male Persons
Health Enhancing Behaviours - adults 16 years and over
Currently smokes 20.0 19.0 19.4 8581 11.7 17.9 14.9 Higher - -
Does not eat two or more serves of fruit daily 44.7 54.7 49.9 22032 41.3 48.3 44.8 - - -
Does not eat five or more serves of vegetables daily 83.2 96.8 90.4 39876 83.7 89.5 86.6 - Higher -
Drinks at risky/high risk levels for long-term harm (a) 43.8 63.3 55.7 17941 38.7 60.4 50.6 - - -
Drinks at risky/high risk levels for short-term harm (b) 13.9 35.0 26.8 8632 14.0 30.7 23.2 - - -
Insufficient physical activity (c) 54.0 56.6 55.4 24461 47.9 44.7 46.3 - - Higher
Risk Factors - adults 16 years and over
Current high blood pressure 17.3 12.8 14.8 6547 16.2 18.0 17.1 - - -
Current high cholesterol 14.1 15.5 14.9 6559 19.7 20.1 19.9 - - -
Overweight (d) 34.0 53.3 44.5 19648 32.2 47.0 39.8 - - -
Obese (d) 42.0 24.8 32.6 14392 26.2 26.7 26.5 Higher - -
High or very high psychological distress 12.3 6.6 9.2 4060 9.8 7.5 8.7 - - -
Lack of control over life in general (e) 8.7 4.3 6.3 2780 4.9 3.3 4.1 - - -
Prevalence of National Health Priority Area Health Conditions and Injury - adults 16 years and over
Diabetes 6.1 7.3 6.8 2992 6.3 6.7 6.5 - - -
Heart disease 5.1 5.2 5.2 2292 4.5 7.4 5.9 - - -
Cancer 3.9 4.0 3.9 1742 5.8 4.8 5.3 - - -
Current asthma 14.5 15.8 15.2 6705 11.0 6.6 8.8 - - Higher
Current respiratory problem (f) 1.6 1.5 1.5 680 1.9 1.7 1.8 - - -
Stroke 1.4 1.4 1.4 627 1.4 2.0 1.7 - - -
Arthritis 24.5 11.3 17.3 7644 22.3 17.8 20.0 - Lower -
Osteoporosis 4.1 0.7 2.2 990 7.5 2.1 4.8 Lower - Lower
Injury (g) 15.5 24.9 20.6 9098 20.8 25.4 23.1 - - -
5
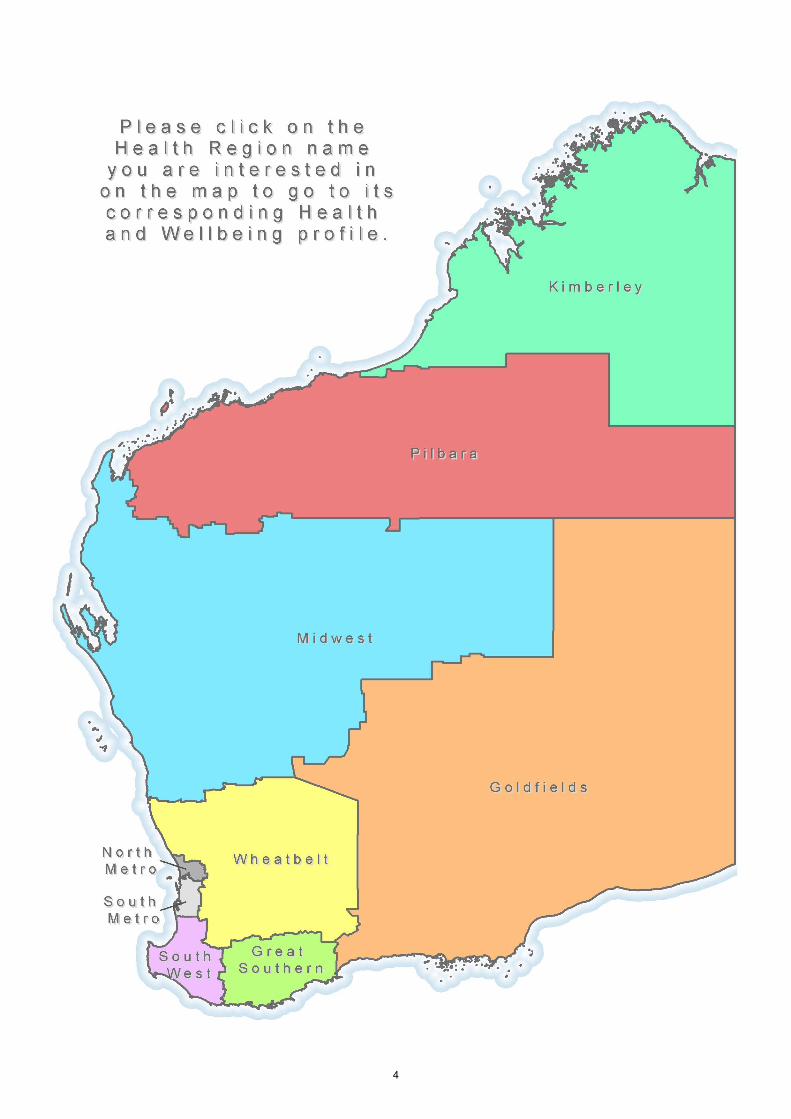
Goldfields Population Profile, Health and Wellbeing Surveillance System (HWSS), January to December 2010
Goldfields Western Australia Significant differences*
Prevalence EstimateEstimated
Pop^Prevalence Estimate From WA
Female Male Persons Persons Female Male Persons Female Male Persons
Current mental health problem (h) 22.3 12.5 17.0 7494 18.2 11.3 14.7 - - -
Health Service Utilisation in the last 12 months - adults 16 years and over
Used a primary health care service (i) 92.0 82.8 87.0 38386 91.9 84.9 88.3 - - -
Used a dental health care service 50.2 53.0 51.7 22823 57.0 49.1 53.0 - - -
Used a mental health care service (j) 11.1 5.3 7.9 3502 7.9 5.9 6.9 - - -
Used an allied health care service (k) 44.6 45.8 45.3 19976 52.2 47.6 49.9 - - -
Used a hospital health care service (l) 37.6 35.9 36.7 16196 29.1 26.1 27.6 - - Higher
Used an alternative health care service (m) 7.2 4.9 5.9 2608 11.4 6.3 8.9 - - -
Mean visits to primary health care service (i) 4.2 3.8 4.0 . 4.9 3.9 4.4 - - -
Mean visits to dental health care service 1.0 1.1 1.1 . 1.2 0.9 1.0 - - -
Mean visits to mental health care service (j) 0.6 0.1 0.3 . 0.6 0.5 0.6 - Lower -
Mean visits to allied health care service (k) 1.9 1.8 1.9 . 3.3 2.7 3.0 Lower - Lower
Mean visits to hospital based health care service (l) 0.7 0.6 0.6 . 0.5 0.5 0.5 - - -
Mean visits to alternative health care service (m) 0.5 0.1 0.3 . 0.5 0.3 0.4 - - -
Source: WA Health and Wellbeing Surveillance System, Epidemiology, DOH.This information is based on responses from 353 adults within the Goldfields health region and 6780 adults within the state.* Determined by comparing confidence intervals, where intervals that do not overlap are deemed significantly different.^ Estimated population refers to the estimated number of people with the risk factor/ condition. It is derived by multiplying the Estimated Resident Population by the persons prevalence estimate.(a) As a proportion of respondents who reported drinking alcohol. Drinks more than 2 standard drinks on any one day.(b) As a proportion of respondents who reported drinking alcohol. Drinks more than 4 standard drinks on any one day.(c) Did not do 150 minutes or more of moderate activity over five or more sessions.(d) Self-reported height and weight have been adjusted for under-reporting.(e) Often or always feels a lack of control over life in general.(f) Respiratory problem other than asthma that has lasted 6 months or more.(g) Injury in the last 12 months requiring treatment from a health professional.(h) Diagnosed with depression, anxiety, stress-related or other mental health problem in the past 12 months.(i) e.g. medical specialist, general practitioner, community health centre, community or district nurses.(j) e.g. psychiatrist, psychologist or counsellor.(k) e.g. optician, physiotherapist, chiropractor, podiatrist, dietician, nutritionist, occupational therapist, diabetes/other health educator.(l) e.g. overnight stay, accident and emergency department or outpatients.(m) e.g. acupuncturist, naturopath, homeopath or any other alternative health service.
6

Great Southern Population Profile, Health and Wellbeing Surveillance System (HWSS), January to December 2010Great Southern Population Profile, Health and Wellbeing Surveillance System (HWSS), January to December 2010
Great Southern Western Australia Significant differences*
Prevalence EstimateEstimated
Pop^Prevalence Estimate From WA
Female Male Persons Persons Female Male Persons Female Male Persons
Health Enhancing Behaviours - adults 16 years and over
Currently smokes 11.1 15.4 13.2 6072 11.7 17.9 14.9 - - -
Does not eat two or more serves of fruit daily 37.3 45.0 41.0 18907 41.3 48.3 44.8 - - -
Does not eat five or more serves of vegetables daily 84.6 90.2 87.3 40235 83.7 89.5 86.6 - - -
Drinks at risky/high risk levels for long-term harm (a) 27.7 53.2 41.7 14323 38.7 60.4 50.6 Lower - Lower
Drinks at risky/high risk levels for short-term harm (b) 13.6 28.8 21.9 7539 14.0 30.7 23.2 - - -
Insufficient physical activity (c) 49.7 48.4 49.1 22609 47.9 44.7 46.3 - - -
Risk Factors - adults 16 years and over
Current high blood pressure 16.3 20.2 18.2 8378 16.2 18.0 17.1 - - -
Current high cholesterol 17.9 22.9 20.4 9398 19.7 20.1 19.9 - - -
Overweight (d) 28.5 46.3 37.5 17288 32.2 47.0 39.8 - - -
Obese (d) 34.8 31.2 33.0 15196 26.2 26.7 26.5 Higher - -
High or very high psychological distress 10.9 5.9 8.5 3910 9.8 7.5 8.7 - - -
Lack of control over life in general (e) 6.7 2.7 4.8 2197 4.9 3.3 4.1 - - -
Prevalence of National Health Priority Area Health Conditions and Injury - adults 16 years and over
Diabetes 7.3 5.4 6.4 2955 6.3 6.7 6.5 - - -
Heart disease 4.4 8.4 6.3 2909 4.5 7.4 5.9 - - -
Cancer 9.1 7.0 8.1 3744 5.8 4.8 5.3 - - -
Current asthma 11.2 9.7 10.4 4815 11.0 6.6 8.8 - - -
Current respiratory problem (f) 3.3 2.4 2.9 1338 1.9 1.7 1.8 - - -
Stroke 1.1 3.6 2.3 1059 1.4 2.0 1.7 - - -
Arthritis 26.2 20.1 23.2 10697 22.3 17.8 20.0 - - -
Osteoporosis 8.1 4.7 6.4 2969 7.5 2.1 4.8 - - -
Injury (g) 24.5 24.6 24.5 11305 20.8 25.4 23.1 - - -
7

Great Southern Population Profile, Health and Wellbeing Surveillance System (HWSS), January to December 2010
Great Southern Western Australia Significant differences*
Prevalence EstimateEstimated
Pop^Prevalence Estimate From WA
Female Male Persons Persons Female Male Persons Female Male Persons
Current mental health problem (h) 17.0 8.6 13.0 5990 18.2 11.3 14.7 - - -
Health Service Utilisation in the last 12 months - adults 16 years and over
Used a primary health care service (i) 87.1 83.7 85.4 39375 91.9 84.9 88.3 - - -
Used a dental health care service 56.9 49.7 53.4 24622 57.0 49.1 53.0 - - -
Used a mental health care service (j) 7.6 3.1 5.4 2489 7.9 5.9 6.9 - - -
Used an allied health care service (k) 63.4 49.2 56.6 26076 52.2 47.6 49.9 Higher - -
Used a hospital health care service (l) 25.9 31.8 28.7 13246 29.1 26.1 27.6 - - -
Used an alternative health care service (m) 12.0 5.5 8.9 4082 11.4 6.3 8.9 - - -
Mean visits to primary health care service (i) 4.5 3.9 4.2 . 4.9 3.9 4.4 - - -
Mean visits to dental health care service 1.3 0.9 1.1 . 1.2 0.9 1.0 - - -
Mean visits to mental health care service (j) 0.6 0.3 0.4 . 0.6 0.5 0.6 - - -
Mean visits to allied health care service (k) 3.0 2.4 2.7 . 3.3 2.7 3.0 - - -
Mean visits to hospital based health care service (l) 0.9 0.7 0.8 . 0.5 0.5 0.5 - - -
Mean visits to alternative health care service (m) 0.5 0.2 0.4 . 0.5 0.3 0.4 - - -
Source: WA Health and Wellbeing Surveillance System, Epidemiology, DOH.This information is based on responses from 505 adults within the Great Southern health region and 6780 adults within the state.* Determined by comparing confidence intervals, where intervals that do not overlap are deemed significantly different.^ Estimated population refers to the estimated number of people with the risk factor/ condition. It is derived by multiplying the Estimated Resident Population by the persons prevalence estimate.(a) As a proportion of respondents who reported drinking alcohol. Drinks more than 2 standard drinks on any one day.(b) As a proportion of respondents who reported drinking alcohol. Drinks more than 4 standard drinks on any one day.(c) Did not do 150 minutes or more of moderate activity over five or more sessions.(d) Self-reported height and weight have been adjusted for under-reporting.(e) Often or always feels a lack of control over life in general.(f) Respiratory problem other than asthma that has lasted 6 months or more.(g) Injury in the last 12 months requiring treatment from a health professional.(h) Diagnosed with depression, anxiety, stress-related or other mental health problem in the past 12 months.(i) e.g. medical specialist, general practitioner, community health centre, community or district nurses.(j) e.g. psychiatrist, psychologist or counsellor.(k) e.g. optician, physiotherapist, chiropractor, podiatrist, dietician, nutritionist, occupational therapist, diabetes/other health educator.(l) e.g. overnight stay, accident and emergency department or outpatients.(m) e.g. acupuncturist, naturopath, homeopath or any other alternative health service.
8

Kimberley Population Profile, Health and Wellbeing Surveillance System (HWSS), January to December 2010Kimberley Population Profile, Health and Wellbeing Surveillance System (HWSS), January to December 2010
Kimberley Western Australia Significant differences*
Prevalence EstimateEstimated
Pop^Prevalence Estimate From WA
Female Male Persons Persons Female Male Persons Female Male Persons
Health Enhancing Behaviours - adults 16 years and over
Currently smokes 16.5 26.6 22.6 5860 11.7 17.9 14.9 - - -
Does not eat two or more serves of fruit daily 54.7 57.9 56.6 14690 41.3 48.3 44.8 Higher - Higher
Does not eat five or more serves of vegetables daily 82.9 91.0 87.8 22772 83.7 89.5 86.6 - - -
Drinks at risky/high risk levels for long-term harm (a) 39.5 81.9 67.0 14652 38.7 60.4 50.6 - Higher Higher
Drinks at risky/high risk levels for short-term harm (b) 12.0 42.6 31.8 6968 14.0 30.7 23.2 - - -
Insufficient physical activity (c) 49.7 49.0 49.3 12779 47.9 44.7 46.3 - - -
Risk Factors - adults 16 years and over
Current high blood pressure 8.7 16.2 13.2 3429 16.2 18.0 17.1 Lower - -
Current high cholesterol 17.1 10.6 13.0 3372 19.7 20.1 19.9 - Lower Lower
Overweight (d) 33.3 34.2 33.8 8775 32.2 47.0 39.8 - - -
Obese (d) 23.9 35.8 31.3 8114 26.2 26.7 26.5 - - -
High or very high psychological distress 11.9 3.3 6.7 1731 9.8 7.5 8.7 - - -
Lack of control over life in general (e) 4.4 1.1 2.4 627 4.9 3.3 4.1 - - -
Prevalence of National Health Priority Area Health Conditions and Injury - adults 16 years and over
Diabetes 5.8 4.2 4.8 1249 6.3 6.7 6.5 - - -
Heart disease 1.5 3.6 2.7 710 4.5 7.4 5.9 Lower - Lower
Cancer 4.1 3.9 4.0 1032 5.8 4.8 5.3 - - -
Current asthma 11.1 4.7 7.2 1875 11.0 6.6 8.8 - - -
Current respiratory problem (f) 1.4 1.0 1.2 303 1.9 1.7 1.8 - - -
Stroke 0.6 0.8 0.7 177 1.4 2.0 1.7 - - -
Arthritis 15.2 18.7 17.3 4500 22.3 17.8 20.0 - - -
Osteoporosis 0.3 1.4 1.0 250 7.5 2.1 4.8 Lower - Lower
Injury (g) 27.7 37.9 33.9 8791 20.8 25.4 23.1 - - Higher
9

Kimberley Population Profile, Health and Wellbeing Surveillance System (HWSS), January to December 2010
Kimberley Western Australia Significant differences*
Prevalence EstimateEstimated
Pop^Prevalence Estimate From WA
Female Male Persons Persons Female Male Persons Female Male Persons
Current mental health problem (h) 23.1 10.2 15.3 3973 18.2 11.3 14.7 - - -
Health Service Utilisation in the last 12 months - adults 16 years and over
Used a primary health care service (i) 89.8 84.7 86.7 22497 91.9 84.9 88.3 - - -
Used a dental health care service 43.8 31.6 36.5 9457 57.0 49.1 53.0 Lower Lower Lower
Used a mental health care service (j) 14.3 2.5 7.2 1861 7.9 5.9 6.9 - - -
Used an allied health care service (k) 55.8 44.2 48.8 12661 52.2 47.6 49.9 - - -
Used a hospital health care service (l) 45.8 29.8 36.1 9372 29.1 26.1 27.6 Higher - -
Used an alternative health care service (m) 15.2 9.6 11.8 3065 11.4 6.3 8.9 - - -
Mean visits to primary health care service (i) 4.8 4.1 4.4 . 4.9 3.9 4.4 - - -
Mean visits to dental health care service 0.8 0.5 0.6 . 1.2 0.9 1.0 Lower Lower Lower
Mean visits to mental health care service (j) 1.0 0.6 0.8 . 0.6 0.5 0.6 - - -
Mean visits to allied health care service (k) 4.9 2.0 3.2 . 3.3 2.7 3.0 - - -
Mean visits to hospital based health care service (l) 1.2 0.5 0.8 . 0.5 0.5 0.5 Higher - -
Mean visits to alternative health care service (m) 0.9 0.2 0.5 . 0.5 0.3 0.4 - - -
Source: WA Health and Wellbeing Surveillance System, Epidemiology, DOH.This information is based on responses from 257 adults within the Kimberley health region and 6780 adults within the state.* Determined by comparing confidence intervals, where intervals that do not overlap are deemed significantly different.^ Estimated population refers to the estimated number of people with the risk factor/ condition. It is derived by multiplying the Estimated Resident Population by the persons prevalence estimate.(a) As a proportion of respondents who reported drinking alcohol. Drinks more than 2 standard drinks on any one day.(b) As a proportion of respondents who reported drinking alcohol. Drinks more than 4 standard drinks on any one day.(c) Did not do 150 minutes or more of moderate activity over five or more sessions.(d) Self-reported height and weight have been adjusted for under-reporting.(e) Often or always feels a lack of control over life in general.(f) Respiratory problem other than asthma that has lasted 6 months or more.(g) Injury in the last 12 months requiring treatment from a health professional.(h) Diagnosed with depression, anxiety, stress-related or other mental health problem in the past 12 months.(i) e.g. medical specialist, general practitioner, community health centre, community or district nurses.(j) e.g. psychiatrist, psychologist or counsellor.(k) e.g. optician, physiotherapist, chiropractor, podiatrist, dietician, nutritionist, occupational therapist, diabetes/other health educator.(l) e.g. overnight stay, accident and emergency department or outpatients.(m) e.g. acupuncturist, naturopath, homeopath or any other alternative health service.
10

Midwest Population Profile, Health and Wellbeing Surveillance System (HWSS), January to December 2010Midwest Population Profile, Health and Wellbeing Surveillance System (HWSS), January to December 2010
Midwest Western Australia Significant differences*
Prevalence EstimateEstimated
Pop^Prevalence Estimate From WA
Female Male Persons Persons Female Male Persons Female Male Persons
Health Enhancing Behaviours - adults 16 years and over
Currently smokes 20.3 19.1 19.7 9762 11.7 17.9 14.9 Higher - -
Does not eat two or more serves of fruit daily 41.2 49.9 45.7 22667 41.3 48.3 44.8 - - -
Does not eat five or more serves of vegetables daily 82.2 91.5 87.0 43123 83.7 89.5 86.6 - - -
Drinks at risky/high risk levels for long-term harm (a) 43.2 57.7 51.7 20539 38.7 60.4 50.6 - - -
Drinks at risky/high risk levels for short-term harm (b) 18.0 27.2 23.4 9295 14.0 30.7 23.2 - - -
Insufficient physical activity (c) 49.6 47.4 48.4 24002 47.9 44.7 46.3 - - -
Risk Factors - adults 16 years and over
Current high blood pressure 19.8 21.6 20.7 10280 16.2 18.0 17.1 - - -
Current high cholesterol 24.5 18.9 21.4 10608 19.7 20.1 19.9 - - -
Overweight (d) 40.1 45.6 43.1 21353 32.2 47.0 39.8 - - -
Obese (d) 27.7 26.3 26.9 13336 26.2 26.7 26.5 - - -
High or very high psychological distress 8.1 6.0 7.0 3476 9.8 7.5 8.7 - - -
Lack of control over life in general (e) 4.5 3.7 4.0 2000 4.9 3.3 4.1 - - -
Prevalence of National Health Priority Area Health Conditions and Injury - adults 16 years and over
Diabetes 7.9 4.0 5.8 2892 6.3 6.7 6.5 - - -
Heart disease 3.9 5.3 4.7 2306 4.5 7.4 5.9 - - -
Cancer 4.8 6.3 5.6 2787 5.8 4.8 5.3 - - -
Current asthma 9.9 2.6 6.0 2980 11.0 6.6 8.8 - - -
Current respiratory problem (f) 2.1 2.4 2.3 1128 1.9 1.7 1.8 - - -
Stroke 1.1 2.2 1.7 828 1.4 2.0 1.7 - - -
Arthritis 22.5 21.1 21.8 10778 22.3 17.8 20.0 - - -
Osteoporosis 6.2 2.1 4.0 1999 7.5 2.1 4.8 - - -
Injury (g) 17.7 31.9 25.2 12498 20.8 25.4 23.1 - - -
11

Midwest Population Profile, Health and Wellbeing Surveillance System (HWSS), January to December 2010
Midwest Western Australia Significant differences*
Prevalence EstimateEstimated
Pop^Prevalence Estimate From WA
Female Male Persons Persons Female Male Persons Female Male Persons
Current mental health problem (h) 12.7 12.9 12.8 6353 18.2 11.3 14.7 - - -
Health Service Utilisation in the last 12 months - adults 16 years and over
Used a primary health care service (i) 88.4 88.6 88.5 43862 91.9 84.9 88.3 - - -
Used a dental health care service 46.3 51.4 49.0 24297 57.0 49.1 53.0 Lower - -
Used a mental health care service (j) 7.3 3.3 5.2 2563 7.9 5.9 6.9 - - -
Used an allied health care service (k) 48.2 51.4 49.9 24711 52.2 47.6 49.9 - - -
Used a hospital health care service (l) 34.8 32.2 33.4 16550 29.1 26.1 27.6 - - -
Used an alternative health care service (m) 10.4 4.0 7.0 3472 11.4 6.3 8.9 - - -
Mean visits to primary health care service (i) 4.3 3.9 4.1 . 4.9 3.9 4.4 - - -
Mean visits to dental health care service 0.8 0.9 0.8 . 1.2 0.9 1.0 Lower - -
Mean visits to mental health care service (j) 0.7 0.3 0.5 . 0.6 0.5 0.6 - - -
Mean visits to allied health care service (k) 2.6 2.8 2.7 . 3.3 2.7 3.0 - - -
Mean visits to hospital based health care service (l) 0.6 0.6 0.6 . 0.5 0.5 0.5 - - -
Mean visits to alternative health care service (m) 0.5 0.3 0.4 . 0.5 0.3 0.4 - - -
Source: WA Health and Wellbeing Surveillance System, Epidemiology, DOH.This information is based on responses from 471 adults within the Midwest health region and 6780 adults within the state.* Determined by comparing confidence intervals, where intervals that do not overlap are deemed significantly different.^ Estimated population refers to the estimated number of people with the risk factor/ condition. It is derived by multiplying the Estimated Resident Population by the persons prevalence estimate.(a) As a proportion of respondents who reported drinking alcohol. Drinks more than 2 standard drinks on any one day.(b) As a proportion of respondents who reported drinking alcohol. Drinks more than 4 standard drinks on any one day.(c) Did not do 150 minutes or more of moderate activity over five or more sessions.(d) Self-reported height and weight have been adjusted for under-reporting.(e) Often or always feels a lack of control over life in general.(f) Respiratory problem other than asthma that has lasted 6 months or more.(g) Injury in the last 12 months requiring treatment from a health professional.(h) Diagnosed with depression, anxiety, stress-related or other mental health problem in the past 12 months.(i) e.g. medical specialist, general practitioner, community health centre, community or district nurses.(j) e.g. psychiatrist, psychologist or counsellor.(k) e.g. optician, physiotherapist, chiropractor, podiatrist, dietician, nutritionist, occupational therapist, diabetes/other health educator.(l) e.g. overnight stay, accident and emergency department or outpatients.(m) e.g. acupuncturist, naturopath, homeopath or any other alternative health service.
12

North Metropolitan Population Profile, Health and Wellbeing Surveillance System (HWSS), January to December2010
North Metropolitan Population Profile, Health and Wellbeing Surveillance System (HWSS), January to December2010
North Metropolitan Western Australia Significant differences*
Prevalence EstimateEstimated
Pop^Prevalence Estimate From WA
Female Male Persons Persons Female Male Persons Female Male Persons
Health Enhancing Behaviours - adults 16 years and over
Currently smokes 9.0 14.9 12.1 89454 11.7 17.9 14.9 - - -
Does not eat two or more serves of fruit daily 38.9 45.3 42.2 312481 41.3 48.3 44.8 - - -
Does not eat five or more serves of vegetables daily 83.4 89.9 86.8 642599 83.7 89.5 86.6 - - -
Drinks at risky/high risk levels for long-term harm (a) 35.8 63.3 51.0 286114 38.7 60.4 50.6 - - -
Drinks at risky/high risk levels for short-term harm (b) 12.9 32.7 23.8 133707 14.0 30.7 23.2 - - -
Insufficient physical activity (c) 47.0 43.0 44.9 332558 47.9 44.7 46.3 - - -
Risk Factors - adults 16 years and over
Current high blood pressure 15.0 15.6 15.3 113479 16.2 18.0 17.1 - - -
Current high cholesterol 18.3 19.3 18.8 139185 19.7 20.1 19.9 - - -
Overweight (d) 32.4 47.3 40.3 298233 32.2 47.0 39.8 - - -
Obese (d) 23.2 25.4 24.4 180348 26.2 26.7 26.5 - - -
High or very high psychological distress 7.6 6.6 7.1 52477 9.8 7.5 8.7 - - -
Lack of control over life in general (e) 4.7 2.9 3.8 27867 4.9 3.3 4.1 - - -
Prevalence of National Health Priority Area Health Conditions and Injury - adults 16 years and over
Diabetes 5.6 6.3 6.0 44188 6.3 6.7 6.5 - - -
Heart disease 4.4 6.9 5.7 41939 4.5 7.4 5.9 - - -
Cancer 5.6 3.8 4.7 34736 5.8 4.8 5.3 - - -
Current asthma 11.4 5.2 8.2 60514 11.0 6.6 8.8 - - -
Current respiratory problem (f) 2.1 1.3 1.7 12586 1.9 1.7 1.8 - - -
Stroke 1.3 2.0 1.7 12255 1.4 2.0 1.7 - - -
Arthritis 21.2 16.8 18.9 140129 22.3 17.8 20.0 - - -
Osteoporosis 8.1 1.4 4.6 34388 7.5 2.1 4.8 - - -
13

North Metropolitan Population Profile, Health and Wellbeing Surveillance System (HWSS), January to December2010
North Metropolitan Western Australia Significant differences*
Prevalence EstimateEstimated
Pop^Prevalence Estimate From WA
Female Male Persons Persons Female Male Persons Female Male Persons
Injury (g) 19.3 27.0 23.3 172273 20.8 25.4 23.1 - - -
Current mental health problem (h) 18.5 10.0 14.1 104439 18.2 11.3 14.7 - - -
Health Service Utilisation in the last 12 months - adults 16 years and over
Used a primary health care service (i) 92.4 83.1 87.6 648428 91.9 84.9 88.3 - - -
Used a dental health care service 58.2 49.2 53.5 396398 57.0 49.1 53.0 - - -
Used a mental health care service (j) 9.0 6.0 7.5 55215 7.9 5.9 6.9 - - -
Used an allied health care service (k) 49.5 49.1 49.3 365106 52.2 47.6 49.9 - - -
Used a hospital health care service (l) 27.6 21.9 24.6 182265 29.1 26.1 27.6 - - -
Used an alternative health care service (m) 10.0 5.9 7.9 58614 11.4 6.3 8.9 - - -
Mean visits to primary health care service (i) 4.8 3.8 4.3 . 4.9 3.9 4.4 - - -
Mean visits to dental health care service 1.2 0.9 1.1 . 1.2 0.9 1.0 - - -
Mean visits to mental health care service (j) 0.8 0.4 0.6 . 0.6 0.5 0.6 - - -
Mean visits to allied health care service (k) 3.1 2.6 2.9 . 3.3 2.7 3.0 - - -
Mean visits to hospital based health care service (l) 0.5 0.5 0.5 . 0.5 0.5 0.5 - - -
Mean visits to alternative health care service (m) 0.5 0.5 0.5 . 0.5 0.3 0.4 - - -
Source: WA Health and Wellbeing Surveillance System, Epidemiology, DOH.This information is based on responses from 1627 adults within the North Metropolitan health region and 6780 adults within the state.* Determined by comparing confidence intervals, where intervals that do not overlap are deemed significantly different.^ Estimated population refers to the estimated number of people with the risk factor/ condition. It is derived by multiplying the Estimated Resident Population by the persons prevalence estimate.(a) As a proportion of respondents who reported drinking alcohol. Drinks more than 2 standard drinks on any one day.(b) As a proportion of respondents who reported drinking alcohol. Drinks more than 4 standard drinks on any one day.(c) Did not do 150 minutes or more of moderate activity over five or more sessions.(d) Self-reported height and weight have been adjusted for under-reporting.(e) Often or always feels a lack of control over life in general.(f) Respiratory problem other than asthma that has lasted 6 months or more.(g) Injury in the last 12 months requiring treatment from a health professional.(h) Diagnosed with depression, anxiety, stress-related or other mental health problem in the past 12 months.(i) e.g. medical specialist, general practitioner, community health centre, community or district nurses.(j) e.g. psychiatrist, psychologist or counsellor.(k) e.g. optician, physiotherapist, chiropractor, podiatrist, dietician, nutritionist, occupational therapist, diabetes/other health educator.(l) e.g. overnight stay, accident and emergency department or outpatients.(m) e.g. acupuncturist, naturopath, homeopath or any other alternative health service.
14

Pilbara Population Profile, Health and Wellbeing Surveillance System (HWSS), January to December 2010Pilbara Population Profile, Health and Wellbeing Surveillance System (HWSS), January to December 2010
Pilbara Western Australia Significant differences*
Prevalence EstimateEstimated
Pop^Prevalence Estimate From WA
Female Male Persons Persons Female Male Persons Female Male Persons
Health Enhancing Behaviours - adults 16 years and over
Currently smokes 17.8 28.6 23.4 8244 11.7 17.9 14.9 - - Higher
Does not eat two or more serves of fruit daily 51.6 65.3 58.4 20586 41.3 48.3 44.8 - Higher Higher
Does not eat five or more serves of vegetables daily 87.3 93.9 90.6 31945 83.7 89.5 86.6 - - -
Drinks at risky/high risk levels for long-term harm (a) 54.7 80.5 68.6 19744 38.7 60.4 50.6 Higher Higher Higher
Drinks at risky/high risk levels for short-term harm (b) 24.4 44.5 35.2 10144 14.0 30.7 23.2 - - Higher
Insufficient physical activity (c) 56.7 47.5 52.0 18335 47.9 44.7 46.3 - - -
Risk Factors - adults 16 years and over
Current high blood pressure 13.0 12.6 12.8 4503 16.2 18.0 17.1 - - -
Current high cholesterol 13.5 17.7 16.0 5642 19.7 20.1 19.9 - - -
Overweight (d) 36.9 40.9 39.0 13767 32.2 47.0 39.8 - - -
Obese (d) 29.6 28.1 28.8 10154 26.2 26.7 26.5 - - -
High or very high psychological distress 8.7 5.8 7.2 2538 9.8 7.5 8.7 - - -
Lack of control over life in general (e) 5.9 5.9 5.9 2082 4.9 3.3 4.1 - - -
Prevalence of National Health Priority Area Health Conditions and Injury - adults 16 years and over
Diabetes 5.0 7.1 6.0 2132 6.3 6.7 6.5 - - -
Heart disease 1.5 5.0 3.3 1172 4.5 7.4 5.9 Lower - -
Cancer 2.6 2.6 2.6 908 5.8 4.8 5.3 Lower - Lower
Current asthma 11.4 11.0 11.2 3950 11.0 6.6 8.8 - - -
Current respiratory problem (f) 0.5 0.8 0.7 234 1.9 1.7 1.8 - - Lower
Stroke . 2.1 1.1 386 1.4 2.0 1.7 Lower - -
Arthritis 10.8 8.0 9.4 3307 22.3 17.8 20.0 Lower Lower Lower
Osteoporosis 5.1 1.6 3.3 1169 7.5 2.1 4.8 - - -
Injury (g) 17.2 23.1 20.2 7131 20.8 25.4 23.1 - - -
15
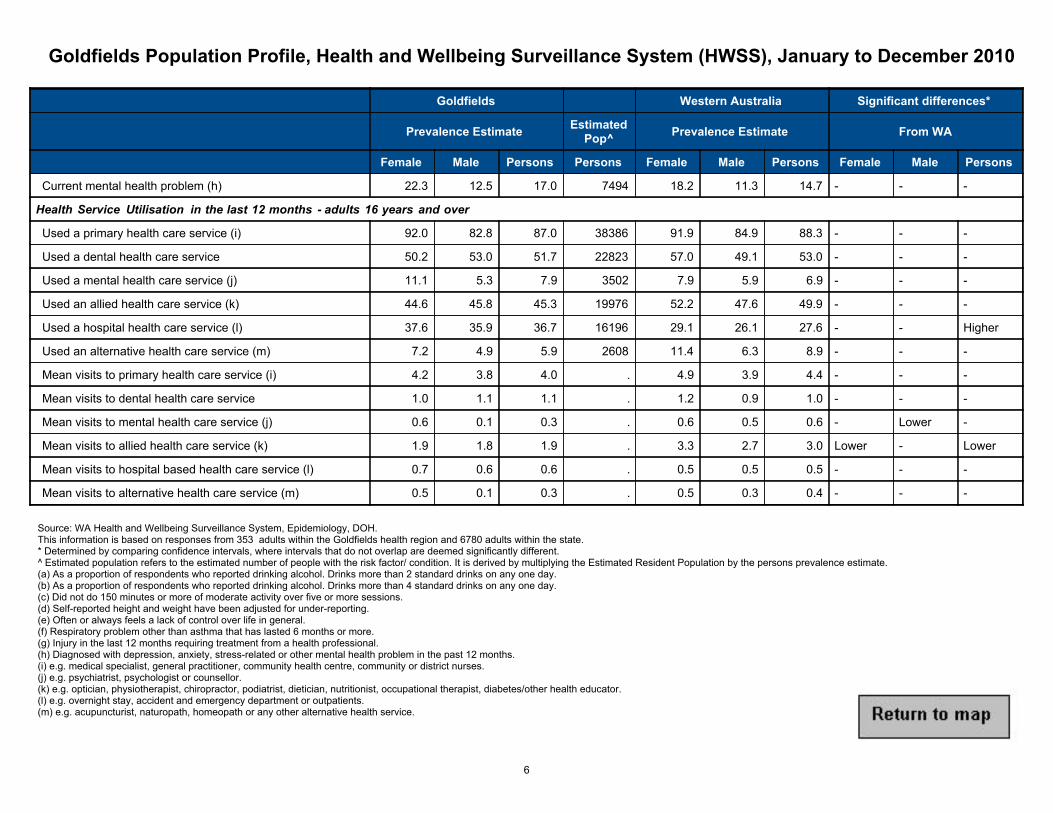
Pilbara Population Profile, Health and Wellbeing Surveillance System (HWSS), January to December 2010
Pilbara Western Australia Significant differences*
Prevalence EstimateEstimated
Pop^Prevalence Estimate From WA
Female Male Persons Persons Female Male Persons Female Male Persons
Current mental health problem (h) 19.9 9.3 14.4 5095 18.2 11.3 14.7 - - -
Health Service Utilisation in the last 12 months - adults 16 years and over
Used a primary health care service (i) 93.0 85.8 89.3 31487 91.9 84.9 88.3 - - -
Used a dental health care service 52.5 46.5 49.4 17426 57.0 49.1 53.0 - - -
Used a mental health care service (j) 12.3 6.0 9.0 3189 7.9 5.9 6.9 - - -
Used an allied health care service (k) 50.4 38.4 44.2 15603 52.2 47.6 49.9 - - -
Used a hospital health care service (l) 37.0 36.8 36.9 13014 29.1 26.1 27.6 - - Higher
Used an alternative health care service (m) 8.5 6.4 7.4 2617 11.4 6.3 8.9 - - -
Mean visits to primary health care service (i) 5.9 3.9 4.8 . 4.9 3.9 4.4 - - -
Mean visits to dental health care service 1.0 0.7 0.8 . 1.2 0.9 1.0 - - -
Mean visits to mental health care service (j) 0.6 0.3 0.5 . 0.6 0.5 0.6 - - -
Mean visits to allied health care service (k) 1.6 1.8 1.7 . 3.3 2.7 3.0 Lower - Lower
Mean visits to hospital based health care service (l) 0.6 0.9 0.7 . 0.5 0.5 0.5 - - -
Mean visits to alternative health care service (m) 0.3 0.1 0.2 . 0.5 0.3 0.4 - - Lower
Source: WA Health and Wellbeing Surveillance System, Epidemiology, DOH.This information is based on responses from 240 adults within the Pilbara health region and 6780 adults within the state.* Determined by comparing confidence intervals, where intervals that do not overlap are deemed significantly different.^ Estimated population refers to the estimated number of people with the risk factor/ condition. It is derived by multiplying the Estimated Resident Population by the persons prevalence estimate.(a) As a proportion of respondents who reported drinking alcohol. Drinks more than 2 standard drinks on any one day.(b) As a proportion of respondents who reported drinking alcohol. Drinks more than 4 standard drinks on any one day.(c) Did not do 150 minutes or more of moderate activity over five or more sessions.(d) Self-reported height and weight have been adjusted for under-reporting.(e) Often or always feels a lack of control over life in general.(f) Respiratory problem other than asthma that has lasted 6 months or more.(g) Injury in the last 12 months requiring treatment from a health professional.(h) Diagnosed with depression, anxiety, stress-related or other mental health problem in the past 12 months.(i) e.g. medical specialist, general practitioner, community health centre, community or district nurses.(j) e.g. psychiatrist, psychologist or counsellor.(k) e.g. optician, physiotherapist, chiropractor, podiatrist, dietician, nutritionist, occupational therapist, diabetes/other health educator.(l) e.g. overnight stay, accident and emergency department or outpatients.(m) e.g. acupuncturist, naturopath, homeopath or any other alternative health service.
16

South Metropolitan Population Profile, Health and Wellbeing Surveillance System (HWSS), January to December2010
South Metropolitan Population Profile, Health and Wellbeing Surveillance System (HWSS), January to December2010
South Metropolitan Western Australia Significant differences*
Prevalence EstimateEstimated
Pop^Prevalence Estimate From WA
Female Male Persons Persons Female Male Persons Female Male Persons
Health Enhancing Behaviours - adults 16 years and over
Currently smokes 11.9 20.3 15.9 104027 11.7 17.9 14.9 - - -
Does not eat two or more serves of fruit daily 42.6 49.5 46.0 299955 41.3 48.3 44.8 - - -
Does not eat five or more serves of vegetables daily 84.5 88.7 86.5 564433 83.7 89.5 86.6 - - -
Drinks at risky/high risk levels for long-term harm (a) 40.3 55.3 48.3 235383 38.7 60.4 50.6 - - -
Drinks at risky/high risk levels for short-term harm (b) 13.4 27.1 20.6 100550 14.0 30.7 23.2 - - -
Insufficient physical activity (c) 48.5 42.8 45.8 298493 47.9 44.7 46.3 - - -
Risk Factors - adults 16 years and over
Current high blood pressure 17.0 20.9 18.9 123133 16.2 18.0 17.1 - - -
Current high cholesterol 21.8 20.5 21.1 137662 19.7 20.1 19.9 - - -
Overweight (d) 30.2 47.3 38.6 251562 32.2 47.0 39.8 - - -
Obese (d) 26.5 27.1 26.8 174962 26.2 26.7 26.5 - - -
High or very high psychological distress 11.9 9.7 10.8 70656 9.8 7.5 8.7 - - -
Lack of control over life in general (e) 4.3 3.4 3.9 25210 4.9 3.3 4.1 - - -
Prevalence of National Health Priority Area Health Conditions and Injury - adults 16 years and over
Diabetes 6.9 7.0 6.9 45237 6.3 6.7 6.5 - - -
Heart disease 4.4 8.5 6.4 41823 4.5 7.4 5.9 - - -
Cancer 5.8 6.2 6.0 38952 5.8 4.8 5.3 - - -
Current asthma 10.1 6.4 8.4 54485 11.0 6.6 8.8 - - -
Current respiratory problem (f) 1.7 1.6 1.6 10682 1.9 1.7 1.8 - - -
Stroke 1.6 1.9 1.7 11275 1.4 2.0 1.7 - - -
Arthritis 23.1 18.5 20.9 136187 22.3 17.8 20.0 - - -
Osteoporosis 7.7 2.8 5.3 34799 7.5 2.1 4.8 - - -
17

South Metropolitan Population Profile, Health and Wellbeing Surveillance System (HWSS), January to December2010
South Metropolitan Western Australia Significant differences*
Prevalence EstimateEstimated
Pop^Prevalence Estimate From WA
Female Male Persons Persons Female Male Persons Female Male Persons
Injury (g) 22.0 23.4 22.7 147812 20.8 25.4 23.1 - - -
Current mental health problem (h) 17.7 13.4 15.6 101900 18.2 11.3 14.7 - - -
Health Service Utilisation in the last 12 months - adults 16 years and over
Used a primary health care service (i) 92.1 86.7 89.5 583767 91.9 84.9 88.3 - - -
Used a dental health care service 58.7 50.5 54.7 357014 57.0 49.1 53.0 - - -
Used a mental health care service (j) 6.6 6.6 6.6 43210 7.9 5.9 6.9 - - -
Used an allied health care service (k) 53.4 46.5 50.1 326659 52.2 47.6 49.9 - - -
Used a hospital health care service (l) 28.0 27.7 27.9 181818 29.1 26.1 27.6 - - -
Used an alternative health care service (m) 12.2 6.4 9.4 61568 11.4 6.3 8.9 - - -
Mean visits to primary health care service (i) 5.0 4.0 4.5 . 4.9 3.9 4.4 - - -
Mean visits to dental health care service 1.2 0.9 1.1 . 1.2 0.9 1.0 - - -
Mean visits to mental health care service (j) 0.4 0.7 0.6 . 0.6 0.5 0.6 - - -
Mean visits to allied health care service (k) 3.6 3.2 3.4 . 3.3 2.7 3.0 - - -
Mean visits to hospital based health care service (l) 0.5 0.5 0.5 . 0.5 0.5 0.5 - - -
Mean visits to alternative health care service (m) 0.6 0.2 0.4 . 0.5 0.3 0.4 - - -
Source: WA Health and Wellbeing Surveillance System, Epidemiology, DOH.This information is based on responses from 1639 adults within the South Metropolitan health region and 6780 adults within the state.* Determined by comparing confidence intervals, where intervals that do not overlap are deemed significantly different.^ Estimated population refers to the estimated number of people with the risk factor/ condition. It is derived by multiplying the Estimated Resident Population by the persons prevalence estimate.(a) As a proportion of respondents who reported drinking alcohol. Drinks more than 2 standard drinks on any one day.(b) As a proportion of respondents who reported drinking alcohol. Drinks more than 4 standard drinks on any one day.(c) Did not do 150 minutes or more of moderate activity over five or more sessions.(d) Self-reported height and weight have been adjusted for under-reporting.(e) Often or always feels a lack of control over life in general.(f) Respiratory problem other than asthma that has lasted 6 months or more.(g) Injury in the last 12 months requiring treatment from a health professional.(h) Diagnosed with depression, anxiety, stress-related or other mental health problem in the past 12 months.(i) e.g. medical specialist, general practitioner, community health centre, community or district nurses.(j) e.g. psychiatrist, psychologist or counsellor.(k) e.g. optician, physiotherapist, chiropractor, podiatrist, dietician, nutritionist, occupational therapist, diabetes/other health educator.(l) e.g. overnight stay, accident and emergency department or outpatients.(m) e.g. acupuncturist, naturopath, homeopath or any other alternative health service.
18
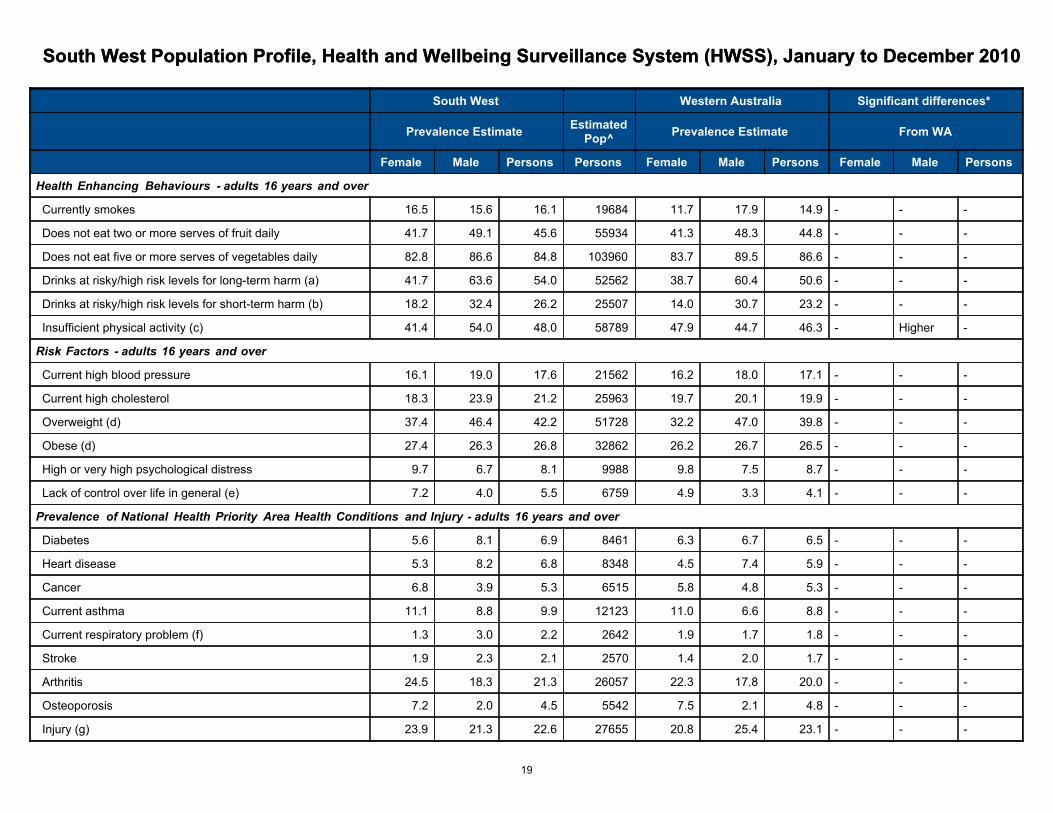
South West Population Profile, Health and Wellbeing Surveillance System (HWSS), January to December 2010South West Population Profile, Health and Wellbeing Surveillance System (HWSS), January to December 2010
South West Western Australia Significant differences*
Prevalence EstimateEstimated
Pop^Prevalence Estimate From WA
Female Male Persons Persons Female Male Persons Female Male Persons
Health Enhancing Behaviours - adults 16 years and over
Currently smokes 16.5 15.6 16.1 19684 11.7 17.9 14.9 - - -
Does not eat two or more serves of fruit daily 41.7 49.1 45.6 55934 41.3 48.3 44.8 - - -
Does not eat five or more serves of vegetables daily 82.8 86.6 84.8 103960 83.7 89.5 86.6 - - -
Drinks at risky/high risk levels for long-term harm (a) 41.7 63.6 54.0 52562 38.7 60.4 50.6 - - -
Drinks at risky/high risk levels for short-term harm (b) 18.2 32.4 26.2 25507 14.0 30.7 23.2 - - -
Insufficient physical activity (c) 41.4 54.0 48.0 58789 47.9 44.7 46.3 - Higher -
Risk Factors - adults 16 years and over
Current high blood pressure 16.1 19.0 17.6 21562 16.2 18.0 17.1 - - -
Current high cholesterol 18.3 23.9 21.2 25963 19.7 20.1 19.9 - - -
Overweight (d) 37.4 46.4 42.2 51728 32.2 47.0 39.8 - - -
Obese (d) 27.4 26.3 26.8 32862 26.2 26.7 26.5 - - -
High or very high psychological distress 9.7 6.7 8.1 9988 9.8 7.5 8.7 - - -
Lack of control over life in general (e) 7.2 4.0 5.5 6759 4.9 3.3 4.1 - - -
Prevalence of National Health Priority Area Health Conditions and Injury - adults 16 years and over
Diabetes 5.6 8.1 6.9 8461 6.3 6.7 6.5 - - -
Heart disease 5.3 8.2 6.8 8348 4.5 7.4 5.9 - - -
Cancer 6.8 3.9 5.3 6515 5.8 4.8 5.3 - - -
Current asthma 11.1 8.8 9.9 12123 11.0 6.6 8.8 - - -
Current respiratory problem (f) 1.3 3.0 2.2 2642 1.9 1.7 1.8 - - -
Stroke 1.9 2.3 2.1 2570 1.4 2.0 1.7 - - -
Arthritis 24.5 18.3 21.3 26057 22.3 17.8 20.0 - - -
Osteoporosis 7.2 2.0 4.5 5542 7.5 2.1 4.8 - - -
Injury (g) 23.9 21.3 22.6 27655 20.8 25.4 23.1 - - -
19

South West Population Profile, Health and Wellbeing Surveillance System (HWSS), January to December 2010
South West Western Australia Significant differences*
Prevalence EstimateEstimated
Pop^Prevalence Estimate From WA
Female Male Persons Persons Female Male Persons Female Male Persons
Current mental health problem (h) 21.5 10.0 15.5 19020 18.2 11.3 14.7 - - -
Health Service Utilisation in the last 12 months - adults 16 years and over
Used a primary health care service (i) 91.3 87.1 89.1 109230 91.9 84.9 88.3 - - -
Used a dental health care service 51.7 44.6 48.0 58844 57.0 49.1 53.0 - - -
Used a mental health care service (j) 7.2 5.6 6.4 7809 7.9 5.9 6.9 - - -
Used an allied health care service (k) 57.2 45.5 51.1 62618 52.2 47.6 49.9 - - -
Used a hospital health care service (l) 36.0 29.1 32.4 39754 29.1 26.1 27.6 Higher - -
Used an alternative health care service (m) 15.3 7.8 11.4 13957 11.4 6.3 8.9 - - -
Mean visits to primary health care service (i) 4.7 3.5 4.1 . 4.9 3.9 4.4 - - -
Mean visits to dental health care service 1.0 0.9 0.9 . 1.2 0.9 1.0 - - -
Mean visits to mental health care service (j) 0.4 0.4 0.4 . 0.6 0.5 0.6 - - -
Mean visits to allied health care service (k) 3.2 2.0 2.6 . 3.3 2.7 3.0 - - -
Mean visits to hospital based health care service (l) 0.7 0.5 0.6 . 0.5 0.5 0.5 - - -
Mean visits to alternative health care service (m) 0.7 0.3 0.5 . 0.5 0.3 0.4 - - -
Source: WA Health and Wellbeing Surveillance System, Epidemiology, DOH.This information is based on responses from 1144 adults within the South West health region and 6780 adults within the state.* Determined by comparing confidence intervals, where intervals that do not overlap are deemed significantly different.^ Estimated population refers to the estimated number of people with the risk factor/ condition. It is derived by multiplying the Estimated Resident Population by the persons prevalence estimate.(a) As a proportion of respondents who reported drinking alcohol. Drinks more than 2 standard drinks on any one day.(b) As a proportion of respondents who reported drinking alcohol. Drinks more than 4 standard drinks on any one day.(c) Did not do 150 minutes or more of moderate activity over five or more sessions.(d) Self-reported height and weight have been adjusted for under-reporting.(e) Often or always feels a lack of control over life in general.(f) Respiratory problem other than asthma that has lasted 6 months or more.(g) Injury in the last 12 months requiring treatment from a health professional.(h) Diagnosed with depression, anxiety, stress-related or other mental health problem in the past 12 months.(i) e.g. medical specialist, general practitioner, community health centre, community or district nurses.(j) e.g. psychiatrist, psychologist or counsellor.(k) e.g. optician, physiotherapist, chiropractor, podiatrist, dietician, nutritionist, occupational therapist, diabetes/other health educator.(l) e.g. overnight stay, accident and emergency department or outpatients.(m) e.g. acupuncturist, naturopath, homeopath or any other alternative health service.
20

Wheatbelt Population Profile, Health and Wellbeing Surveillance System (HWSS), January to December 2010Wheatbelt Population Profile, Health and Wellbeing Surveillance System (HWSS), January to December 2010
Wheatbelt Western Australia Significant differences*
Prevalence EstimateEstimated
Pop^Prevalence Estimate From WA
Female Male Persons Persons Female Male Persons Female Male Persons
Health Enhancing Behaviours - adults 16 years and over
Currently smokes 14.6 21.9 18.4 10981 11.7 17.9 14.9 - - -
Does not eat two or more serves of fruit daily 41.2 52.5 47.0 28030 41.3 48.3 44.8 - - -
Does not eat five or more serves of vegetables daily 78.1 88.1 83.2 49612 83.7 89.5 86.6 - - -
Drinks at risky/high risk levels for long-term harm (a) 39.4 53.7 47.5 22050 38.7 60.4 50.6 - - -
Drinks at risky/high risk levels for short-term harm (b) 17.5 29.6 24.3 11303 14.0 30.7 23.2 - - -
Insufficient physical activity (c) 51.2 48.3 49.7 29654 47.9 44.7 46.3 - - -
Risk Factors - adults 16 years and over
Current high blood pressure 21.7 15.2 18.3 10931 16.2 18.0 17.1 - - -
Current high cholesterol 19.1 28.0 23.6 14061 19.7 20.1 19.9 - - -
Overweight (d) 37.4 49.7 43.9 26172 32.2 47.0 39.8 - - -
Obese (d) 36.0 31.5 33.6 20053 26.2 26.7 26.5 Higher - Higher
High or very high psychological distress 8.3 3.9 6.0 3589 9.8 7.5 8.7 - - -
Lack of control over life in general (e) 5.0 3.8 4.4 2634 4.9 3.3 4.1 - - -
Prevalence of National Health Priority Area Health Conditions and Injury - adults 16 years and over
Diabetes 6.7 8.4 7.5 4498 6.3 6.7 6.5 - - -
Heart disease 7.0 6.3 6.6 3956 4.5 7.4 5.9 - - -
Cancer 6.0 3.7 4.8 2868 5.8 4.8 5.3 - - -
Current asthma 16.0 13.5 14.7 8768 11.0 6.6 8.8 - - Higher
Current respiratory problem (f) 3.1 3.6 3.4 2019 1.9 1.7 1.8 - - -
Stroke 1.3 2.9 2.1 1277 1.4 2.0 1.7 - - -
Arthritis 25.6 26.3 26.0 15493 22.3 17.8 20.0 - - Higher
Osteoporosis 5.6 1.9 3.7 2211 7.5 2.1 4.8 - - -
Injury (g) 19.6 25.4 22.6 13484 20.8 25.4 23.1 - - -
21

Wheatbelt Population Profile, Health and Wellbeing Surveillance System (HWSS), January to December 2010
Wheatbelt Western Australia Significant differences*
Prevalence EstimateEstimated
Pop^Prevalence Estimate From WA
Female Male Persons Persons Female Male Persons Female Male Persons
Current mental health problem (h) 13.6 9.6 11.5 6885 18.2 11.3 14.7 - - -
Health Service Utilisation in the last 12 months - adults 16 years and over
Used a primary health care service (i) 91.4 80.4 85.7 51146 91.9 84.9 88.3 - - -
Used a dental health care service 55.9 47.0 51.3 30610 57.0 49.1 53.0 - - -
Used a mental health care service (j) 5.9 4.1 5.0 2975 7.9 5.9 6.9 - - -
Used an allied health care service (k) 56.9 50.7 53.7 32018 52.2 47.6 49.9 - - -
Used a hospital health care service (l) 29.0 28.5 28.8 17155 29.1 26.1 27.6 - - -
Used an alternative health care service (m) 13.9 9.3 11.5 6857 11.4 6.3 8.9 - - -
Mean visits to primary health care service (i) 4.9 3.7 4.3 . 4.9 3.9 4.4 - - -
Mean visits to dental health care service 1.3 0.9 1.1 . 1.2 0.9 1.0 - - -
Mean visits to mental health care service (j) 0.5 0.1 0.3 . 0.6 0.5 0.6 - Lower -
Mean visits to allied health care service (k) 2.4 2.7 2.6 . 3.3 2.7 3.0 - - -
Mean visits to hospital based health care service (l) 0.7 1.0 0.8 . 0.5 0.5 0.5 - - -
Mean visits to alternative health care service (m) 0.6 0.5 0.5 . 0.5 0.3 0.4 - - -
Source: WA Health and Wellbeing Surveillance System, Epidemiology, DOH.This information is based on responses from 544 adults within the Wheatbelt health region and 6780 adults within the state.* Determined by comparing confidence intervals, where intervals that do not overlap are deemed significantly different.^ Estimated population refers to the estimated number of people with the risk factor/ condition. It is derived by multiplying the Estimated Resident Population by the persons prevalence estimate.(a) As a proportion of respondents who reported drinking alcohol. Drinks more than 2 standard drinks on any one day.(b) As a proportion of respondents who reported drinking alcohol. Drinks more than 4 standard drinks on any one day.(c) Did not do 150 minutes or more of moderate activity over five or more sessions.(d) Self-reported height and weight have been adjusted for under-reporting.(e) Often or always feels a lack of control over life in general.(f) Respiratory problem other than asthma that has lasted 6 months or more.(g) Injury in the last 12 months requiring treatment from a health professional.(h) Diagnosed with depression, anxiety, stress-related or other mental health problem in the past 12 months.(i) e.g. medical specialist, general practitioner, community health centre, community or district nurses.(j) e.g. psychiatrist, psychologist or counsellor.(k) e.g. optician, physiotherapist, chiropractor, podiatrist, dietician, nutritionist, occupational therapist, diabetes/other health educator.(l) e.g. overnight stay, accident and emergency department or outpatients.(m) e.g. acupuncturist, naturopath, homeopath or any other alternative health service.
22


![Barrett’s esophagus and new therapeutic modalitiesThe prevalence of Barrett’s esophagus in the adult population is 0.4–1.6% [1,3,12,13]. Assum-ing a US adult population in 2007](https://static.fdocuments.net/doc/165x107/5f4d5b4d6dfbad3c763bb443/barrettas-esophagus-and-new-therapeutic-modalities-the-prevalence-of-barrettas.jpg)
