Adenosine stress 64 and 256 row detector computed...
30
CIRCULATIONAHA/2008/813766 Adenosine stress 64 and 256 row detector computed tomography angiography and perfusion imaging: A pilot study evaluating the transmural extent of perfusion abnormalities to predict atherosclerosis causing myocardial ischemia Richard T. George, M.D., 1 Armin Arbab-Zadeh, M.D., 1 Julie M. Miller, M.D., 1 Kakuya Kitagawa, M.D., 1 Hyuk-Jae Chang, M.D., 1 David A. Bluemke, M.D., Ph.D., 1,3 Lewis Becker, M.D., 1 Omair Yousuf, M.D., 1 John Texter, PA-C, 1 Albert C. Lardo, Ph.D., 1,3 João A.C. Lima, M.D. 1,3 George, et al. 64 and 256 Row MDCT Myocardial Perfusion Imaging From the Department of Medicine, Division of Cardiology 1 Department of Biomedical Engineering 2 Department of Radiology 3 Johns Hopkins University School of Medicine, Baltimore, MD 21205 Address for Correspondence: João A.C. Lima, M.D. Professor of Medicine and Radiology Director of Cardiovascular Imaging Johns Hopkins University Department of Medicine Division of Cardiology 600 North Wolfe Street 524 Blalock Building Baltimore, MD 21287 (410) 614-1284 (410) 614-8222 (Fax) [email protected] Journal Subject Codes: [30] CT and MRI, [124] Cardiovascular imaging agents/Techniques, [87] Coronary circulation, [7] Chronic ischemic heart disease by guest on May 20, 2018 http://circimaging.ahajournals.org/ Downloaded from
Transcript of Adenosine stress 64 and 256 row detector computed...

CIRCULATIONAHA/2008/813766
Adenosine stress 64 and 256 row detector computed tomography
angiography and perfusion imaging: A pilot study evaluating the
transmural extent of perfusion abnormalities to predict atherosclerosis
causing myocardial ischemia
Richard T. George, M.D.,1 Armin Arbab-Zadeh, M.D.,1 Julie M. Miller, M.D.,1 Kakuya
Kitagawa, M.D.,1 Hyuk-Jae Chang, M.D.,1 David A. Bluemke, M.D., Ph.D., 1,3 Lewis Becker,
M.D.,1 Omair Yousuf, M.D.,1 John Texter, PA-C,1 Albert C. Lardo, Ph.D.,1,3 João A.C. Lima,
M.D.1,3
George, et al. 64 and 256 Row MDCT Myocardial Perfusion Imaging
From the Department of Medicine, Division of Cardiology1
Department of Biomedical Engineering2
Department of Radiology3
Johns Hopkins University School of Medicine, Baltimore, MD 21205
Address for Correspondence: João A.C. Lima, M.D. Professor of Medicine and Radiology Director of Cardiovascular Imaging Johns Hopkins University Department of Medicine Division of Cardiology 600 North Wolfe Street 524 Blalock Building Baltimore, MD 21287 (410) 614-1284 (410) 614-8222 (Fax) [email protected]
Journal Subject Codes: [30] CT and MRI, [124] Cardiovascular imaging agents/Techniques, [87] Coronary circulation, [7] Chronic ischemic heart disease
by guest on May 20, 2018
http://circimaging.ahajournals.org/
Dow
nloaded from

2
Abstract
Background: Multidetector computed tomography coronary angiography (CTA) is a robust
method for the non-invasive diagnosis of coronary artery disease. However, in its current form,
CTA is limited in its prediction of myocardial ischemia. The purpose of this study is to test if
adenosine stress computed tomography myocardial perfusion imaging (CTP), when added to
CTA, can predict perfusion abnormalities caused by obstructive atherosclerosis.
Methods and Results: Forty patients with a history of abnormal single photon emission
computed tomography myocardial perfusion imaging (SPECT-MPI) underwent adenosine stress
64-row (N=24) or 256-row (N=16) detector CTP and CTA. A subset of 27 patients had invasive
angiography available for quantitative coronary angiography (QCA). CTA and QCA were
evaluated for stenoses ≥ 50% and SPECT-MPI was evaluated for fixed and reversible perfusion
deficits using a 17-segment model. CTP images were analyzed for the transmural differences
in perfusion using the transmural perfusion ratio (TPR=subendocardial attenuation density
(AD)/subepicardial AD). The sensitivity, specificity, positive predictive value (PPV), and negative
predictive value (NPV) for the combination of CTA and CTP to detect obstructive
atherosclerosis causing perfusion abnormalities using the combination of QCA and SPECT as
the gold standard was 86%, 92%, 92%, and 85% in the per-patient analysis and 79%, 91%,
75%, and 92% in the per vessel/territory analysis; respectively.
Conclusions: The combination of CTA and CTP can detect atherosclerosis causing perfusion
abnormalities when compared with the combination of QCA and SPECT.
Key Words: Imaging, atherosclerosis, ischemia, perfusion, and myocardium.
by guest on May 20, 2018
http://circimaging.ahajournals.org/
Dow
nloaded from

3
Introduction
CT non-invasive coronary angiography (CTA) using 64-detector technology has been
shown to compare well with invasive coronary angiography1, and multiple studies have shown
that CTA has a NPV of 95-99%, therefore superseding all other non-invasive imaging modalities
in its ability to exclude coronary artery disease (CAD)2,3. However, multidetector computed
tomography angiography (CTA) provides no information on the physiologic significance of
coronary atherosclerosis. To date, several studies have shown that a 50% stenosis identified
by CTA is a poor predictor of reversible ischemia.4-6
For patients with moderate to severe coronary stenosis, it is thus desirable to measure
myocardial perfusion in conjunction with the extent of luminal stenosis. One approach is to
combine CTA with radionuclide myocardial perfusion imaging (MPI), a strategy that requires the
combination of two separate imaging technologies.4 Alternatively, we have previously
demonstrated in preclinical studies that CT technology alone is capable of simultaneous
atherosclerosis and myocardial perfusion measurements.7,8 Importantly, high resolution CT, in
contrast to radionuclide MPI, has the potential of assessing the transmural extent of myocardial
perfusion abnormalities similar to magnetic resonance imaging.9,10 Finally, the recent
introduction of dynamic volume CT with 256 and 320 detectors has enabled the performance of
CTA11,12 with temporal uniformity (ability to image the entire heart simultaneously) and lower
radiation, thus enabling combined measurements of anatomy and perfusion during rest and
stress as part of a single diagnostic examination.
The primary objective of this study was to determine if adenosine stress CT perfusion
(CTP) imaging, in conjunction with CTA, can detect atherosclerosis causing myocardial
perfusion abnormalities. Specifically, we tested the hypothesis that adenosine stress CT-
derived transmural perfusion measurements are predictive of myocardial perfusion
abnormalities in the setting of obstructive atherosclerosis.
Methods
by guest on May 20, 2018
http://circimaging.ahajournals.org/
Dow
nloaded from
4
Patient Selection
The study protocol was reviewed and approved by the Johns Hopkins University
Institutional Review Board and all patients signed written informed consent. Patients were
enrolled from January 2006 to August 2007. The study included men and non-pregnant women
with a clinical suspicion of CAD and a history of an abnormal SPECT MPI within the past 60
days. Exclusion criteria included: history of renal insufficiency, contraindications to iodinated
contrast, atrial fibrillation, bronchospastic lung disease, and 2nd or 3rd degree heart block.
Patients underwent CTA and perfusion imaging within 60 days following SPECT MPI. Twenty-
seven patients subsequently underwent invasive coronary angiography.
SPECT Imaging and Analysis
In all patients, stress-rest MPI (using either technetium-99m tetrofosmin or technetium-
99m sestamibi) was performed with symptom limited treadmill exercise or pharmacologic
(dipyridamole or adenosine) stress according to protocols endorsed by the American Society of
Nuclear Cardiology.13 Gated and non-gated SPECT image data was reconstructed in the
vertical long axis, horizontal long, and short axis projections. Using a 17-segment model, a
single blinded observer visually scored myocardial segments as normal, mild, moderate, or
severe and reversibility was determined. Perfusion deficits were assigned a culprit vessel14.
CTA and Perfusion Image Acquisition and Reconstruction
Baseline blood pressure (BP), heart rate (HR), and ECG were acquired prior to CT. Oral
and/or intravenous metoprolol was given if the resting HR was greater than 65 beats per minute.
IV access was obtained in the right and left antecubital veins for the administration of iodinated
contrast and adenosine, respectively. Patients were hydrated with 250 – 500 ml normal saline
prior to CT imaging.
64-Detector CT
by guest on May 20, 2018
http://circimaging.ahajournals.org/
Dow
nloaded from

5
Patients were placed supine in a 64-row detector CT (64-DCT) scanner (Aquilion 64TM,
Toshiba Medical Systems, Japan). Following the acquisition of scout images, adenosine (0.14
mg/kg/min, Adenoscan®, Astellas Pharma, Inc., Japan) was initiated with continuous ECG
monitoring. Five minutes into the adenosine infusion, iodinated contrast (Iopamidol, 370 mg I/ml,
Bracco Diagnostics, Princeton, NJ) was infused at a rate of 5 ml/sec for a total of 90-95 ml,
followed by 30 ml of normal saline. The contrast bolus was monitored using the automated
bolus tracking feature and CT imaging was initiated when a threshold of 150 Hounsfield units
(HU) was detected in the left ventricular blood pool according to a retrospective ECG-gated
protocol with the following parameters: detector collimation – 64 X 0.5 mm, tube current – 400
mA, tube voltage – 120 kV, gantry rotation time – 400 msec, beam pitch – variable depending
on HR, Figure 1. Effective radiation dose estimated using the dose length product method was
16.8 mSv for 64-DCT imaging.
CT raw data was reconstructed for angiographic analysis as previously described1. For
the analysis of perfusion, images were reconstructed in the cardiac short axis with a 3.0 mm
slice thickness at end diastole (phase 80-100%), selecting the phase with the least cardiac
motion using a standard body algorithm kernel (FC13) without edge enhancement.
256-Detector CT
Patients were placed supine in a 256-row detector CT (256-DCT) prototype scanner
(TSX-301A, Aquilion One CT System, Toshiba Medical Systems, Japan). Following the
acquisition of scout images, a test bolus of iodinated contrast (Iopamidol, 370 mg I/ml, Bracco
Diagnostics, Princeton, NJ) was infused at 5 ml/sec for a total of 20 ml and bolus tracking
imaging was performed in order to determine scan timing.
256-Stress CTP Imaging - Adenosine was initiated with continuous ECG monitoring.
Five minutes into the adenosine infusion, iodinated contrast was infused at a rate of 5 ml/sec in
two phases: 100% contrast for 50 ml, then a 50:50 mixture of contrast and saline for 20 ml,
followed by 30 ml of normal saline (total contrast - 60 ml). CT imaging was initiated at the
by guest on May 20, 2018
http://circimaging.ahajournals.org/
Dow
nloaded from

6
predicted peak of the contrast bolus. CT settings were: detector collimation – 128 X 1.0 mm,
tube current – 200 mA, tube voltage – 120 kV, gantry rotation time – 500 msec, scan time – 1.5
seconds.
Stress CTP images were reconstructed in the short axis with a 3 mm slice thickness at
end diastole (phase 80-100%), selecting the phase with the least cardiac motion. Images were
reconstructed with the same standard body algorithm kernel (FC13) with beam hardening
correction and without edge enhancement.
256-Rest CTA and Perfusion Imaging – Ten minutes following stress CTP imaging, the
CT angiogram and rest perfusion imaging were acquired. Iopamidol was infused using the
same protocol for stress CTP (total contrast - 60 ml). CT imaging was initiated at the predicted
peak of the contrast bolus. CT settings were: detector collimation – 256 X 0.5 mm, tube
current – 350 mA, tube voltage – 120 kV, gantry rotation time – 500 msec, scan time – 1.5
seconds. Effective radiation dose estimated using the dose length product method was 21.6
mSv for rest and stress 256-DCT imaging combined.
CT angiograms were reconstructed with a 0.5 mm slice thickness using half-scan
reconstruction with standard (FC43) CTA and sharp (FC05) kernels using the phase with least
cardiac motion.
For rest perfusion analysis in the 256-DCT group, images were reconstructed in the
short axis with a 3 mm slice thickness at end diastole (phase 80-100%), selecting the phase
with the least cardiac motion using the same standard body algorithm kernel (FC13) with beam
hardening correction and without edge enhancement.
CT Myocardial Perfusion Image Analysis
CT stress (64 and 256-DCT) and rest (256-CT only) images were transferred to a
custom myocardial perfusion analysis workstation (Toshiba Medical Systems, Japan). Using
images in the cardiac short axis with a 3 mm slice thickness, two independent and blinded
observers (1 cardiologist and 1 radiologist) analyzed the CTP images as follows: 1) Using an
by guest on May 20, 2018
http://circimaging.ahajournals.org/
Dow
nloaded from

7
automated border detection algorithm with manual hand planimetry input, the subendocardial
and subepicardial borders were defined; 2) the software automatically and equally divided the
myocardium into three myocardial layers – the subendocardial, mid-myocardial, and
subepicardial layers; 3) using a 16-segment model (apex was excluded), the software
calculated the mean attenuation density (AD) of each myocardial layer within each sector,
Figure 2.
In order to calculate the transmural extent of perfusion abnormalities in a quantitative
analysis, the transmural perfusion ratio was calculated as follows:
ialADSubepicarddialADSubendocarTPR =
Where TPR = Transmural Perfusion Ratio, Subendocardial AD is the sector specific
subendocardial attenuation, and Subepicardial AD is the mean attenuation of the entire
subepicardial layer of any given short axis slice. The TPR was calculated for each segment.
Interobserver variability in the measurement of the TPR was performed by comparing the
results from the two blinded readers on a segment-by-segment basis. The final TPR result used
in the analysis was the average TPR from both readers.
CT Coronary Angiography Analysis
CT angiographic images were transferred to a dedicated workstation (Vitrea v. 3.9, Vital
Images, Minnesota) for analysis by a level III certified CT angiographer. All segments ≥ 1.5 mm
were analyzed regardless of the presence of intracoronary stents or coronary calcification using
a 19-segment coronary model15. Each coronary segment was visually assessed for the percent
luminal stenosis and a vessel supplying a territory was considered obstructive if there was at
least one segment of a vessel with a ≥ 50% luminal stenosis.
Invasive Coronary Angiography Acquisition and Quantitative Coronary Analysis
Invasive coronary angiography (ICA) was performed using standard orthogonal views
and was clinically driven. Coronary angiographic images were transferred to an independent
by guest on May 20, 2018
http://circimaging.ahajournals.org/
Dow
nloaded from

8
angiographic core laboratory for analysis. The coronary tree was analyzed using a 19 segment
coronary model as previously described15. Quantitative coronary angiography (QCA) was
performed on all coronary segments >1.5mm in diameter (CAAS II QCA Research version 2.0.1
software, PIE Medical Imaging, Maastricht, the Netherlands) on the most significant stenosis ≥
30% severity within each coronary segment. A vessel supplying a territory was considered
obstructive if at least one segment of a vessel contained a ≥ 50% luminal stenosis.
Hybridization of Multimodality Imaging
Perfusion deficits noted on CTP and SPECT MPI were assigned a coronary artery
territory according to standard practice.14 In cases where variation of the coronary arterial
anatomy varied from standard practice, the CTA was used to reassign segments to the
appropriate vessel territory for both SPECT and CTP in the following way: 1) the anterolateral
wall was assigned to the left anterior descending artery (LAD) territory if there was a diagonal
vessel overlying the anterolateral wall, 2) the distal inferior wall was assigned to the LAD if the
LAD wrapped around the apex and supplied the distal inferior wall, 3) the inferolateral wall was
assigned to the right coronary artery (RCA) territory if the RCA supplied a posterolateral branch
overlying the inferolateral wall.
In the patient-based analysis, CTA/CTP, and QCA/SPECT was considered positive
when CTA or QCA showed a ≥ 50% luminal stenosis and a perfusion deficit. In the
vessel/territory-based analysis CTA/CTP and QCA/SPECT was considered positive when CTA
or QCA showed a ≥ 50% luminal stenosis in a vessel supplying a territory with a perfusion
deficit.
Since SPECT is limited in the evaluation of patients with 3-vessel and left main CAD, a
separate analysis was performed in order to avoid penalizing CTP for detecting multivessel
disease in the vessel/territory analysis16. In those patients with 3-vessel or left main disease
(confirmed by QCA), if CTA/CTP and QCA/SPECT showed one territory supplied by a ≥50%
stenosis in the presence of a matching perfusion deficit, yet CTA/CTP showed a second or third
by guest on May 20, 2018
http://circimaging.ahajournals.org/
Dow
nloaded from

9
territory to have a ≥50% stenosis in the presence of a matching perfusion deficit missed by
SPECT, CTA/CTP was not penalized for finding the second or third territories.
Statistical Analysis
Means were expressed ± standard deviation. Interobserver variability was compared using
Bland-Altman plots and the kappa statistic, respectively 17,18. The relationship between
percent luminal stenosis and TPR was compared using Pearson correlation. The mean TPR at
each level of stenosis was compared using one-way analysis of variance. The area under the
receiver operating characteristic (ROC) was calculated and reported with 95% confidence
intervals19. The threshold of significance was p < 0.05. Statistical analyses were performed
using MedCalc v. 8.2.1.0 (Meriakerke, Belgium).
Results
Forty-three consecutive patients underwent 64 (N=24) or 256 (N=19) CT imaging. The
first three patients from the 256 DCT group underwent developmental protocols and were
excluded from the analysis. Myocardial perfusion imaging by CT was compared with SPECT
MPI in a total of 40 patients, 120 territories, and 640 sectors. ICA was performed in 27 out of 40
patients. Baseline characteristics are shown in Table 1. Mean HR was 138.8±18.5, 101.7±9.5,
and 75.4±12.9 and mean systolic BP was 173.4±27.2, 134.3±14.3, and 123.1±18.2 during peak
exercise SPECT, pharmacologic SPECT, and stress CTP; respectively.
CT Transmural Perfusion Ratio and Percent Stenosis by QCA
Among 14 patients with no obstructive epicardial coronary disease on QCA (no stenoses
>30%), 224 myocardial segments were analyzed to define the normal distribution of the TPR,
Figure 3. The mean TPR ± standard deviation was 1.12±0.13 in these patients with no
obstructive CAD. The TPR was considered abnormal when it was <0.99 or more than 1
standard deviation below the mean TPR in this group of normal patients.
Interobserver variability for measuring segmental TPR was good, κ=0.72 (95% CI: 0.63 –
0.802) and κ=0.63 (95% CI: 0.56 – 0.70) for the rest and stress images, respectively17. The
by guest on May 20, 2018
http://circimaging.ahajournals.org/
Dow
nloaded from

10
agreement between measurements of segmental TPR was good on rest and stress imaging,
Figure 4.
The transmural perfusion ratio for stenoses of 30-49%, 50-69%, and 70-100% severity
on QCA was 1.09±0.11, 1.06±0.14, and 0.91±0.10 respectively (TPR for 70-100% stenoses was
significantly lower compared to stenoses of 30-49% and 50-69%, p<0.001). There was a
significant inverse linear correlation between the TPR and the percent diameter stenosis (R=-
0.63, p=0.001, Figure 5.
CT Angiography / CT Perfusion vs. QCA / SPECT Perfusion Imaging.
Figures 6 and 7 demonstrate examples of CTP imaging with 64 and 256-DCT,
respectively. One patient was excluded from the analysis secondary to an uninterpretable CT A.
The sensitivity, specificity, PPV and NPV for CTA/CTP detecting a stenosis causing a perfusion
deficit on QCA/SPECT was 86%, 92%, 92%, and 85% in the patient-based analysis and
75%,87%, 60%, and 93% in the vessel/territory based analysis; respectively (Table 2 and 3A).
QCA demonstrated one, two, and three vessel disease in 30.8%, 19.2%, and 7.7% of
patients; respectively. When taking into consideration that CTP detects perfusion deficits in a
second or third territory in patients with 3-vessel or left main disease the sensitivity, specificity,
PPV and NPV of CTA/CTP, when compared with QCA/SPECT was 79%, 91%, 75%, and 93%
in the per vessel/territory based analysis (Table 3B).
CT Perfusion vs. SPECT Perfusion and Reversibility
During stress imaging, perfusion deficit extent was 3.8±2.4 and 3.8±3.7 sectors on
SPECT and CTP imaging, respectively (p=0.91). On a territorial/vessel based analysis, the
sensitivity, specificity, PPV, and NPV for CTP detecting a SPECT perfusion deficit was 70%,
51%, 58%, and 63% respectively.
In the 256-row CT group, where both rest and stress perfusion on SPECT and CT
imaging were available, one patient with a normal SPECT study had a partially reversible defect
by guest on May 20, 2018
http://circimaging.ahajournals.org/
Dow
nloaded from

11
on CTP. There were six patients with reversible perfusion deficits on SPECT with CTP deficits
noted to be reversible in two patients, partially reversible in one patient, and fixed in three
patients. All seven patients noted to have partially reversible perfusion deficits on SPECT also
had partially reversible perfusion deficits on CT. Two patients with fixed deficits on SPECT had
partially reversible perfusion deficits on CTP.
Discussion
This study is the first to quantify transmural differences of myocardial perfusion by CT in
humans. Its main findings are: 1) adenosine stress CTP imaging can detect transmural
differences in myocardial perfusion; 2) these transmural differences in the subendocardial and
subepicardial attenuation can be quantified using the transmural perfusion ratio (TPR); 3) TPR
is inversely related to percent diameter stenosis measured by quantitative angiography; 4)
severe CTP deficits indicate the presence of severe stenoses detected by invasive angiography,
and; 5) CTP, when combined with CTA, can accurately predict coronary stenosis causing
perfusion deficits on QCA/SPECT.
Angiography vs. Myocardial Perfusion
Previous studies have established that coronary angiography and MPI provide quite
different, but complimentary, assessments of ischemic heart disease. While invasive coronary
angiography has the advantage of directly visualizing and quantifying the severity of coronary
stenoses caused by atherosclerosis, metrics such as percent diameter stenosis have been
shown to only moderately correlate with measurements of myocardial perfusion using PET and
fractional flow reserve20,21. Furthermore, radionuclide MPI has been shown to have incremental
prognostic value when used in conjunction with, and independent of, the coronary
angiogram22,23.
While CTA provides a non-invasive assessment of percent diameter stenosis and allows
for the identification of atherosclerotic plaque, it falls short of providing information on the
by guest on May 20, 2018
http://circimaging.ahajournals.org/
Dow
nloaded from

12
physiologic significance of coronary stenoses4-6. Furthermore, a recent study has demonstrated
that overall plaque burden on CTA, rather than plaque location, is a better predictor of territorial
ischemia on radionuclide MPI 24. Preferably, non-invasive testing for CAD would assess
atherosclerosis and perfusion imaging in one setting. There are several prospects for this
comprehensive evaluation of ischemic heart disease, including hybrid imaging systems that
combine CTA with SPECT or PET.4,6 However, these systems come with additional cost and, in
some instances, significant increases in the overall radiation dose.4 Our study, in conjunction
with several preclinical studies of CTP imaging by our group and others, propose the concept
that CT alone can provide simultaneous atherosclerosis and myocardial perfusion imaging.7,8,25
Transmural Distribution of Myocardial Perfusion
SPECT MPI using technetium and thallium based radionuclide tracers are well
established for the evaluation of myocardial perfusion. However, due to limited spatial
resolution, SPECT is not capable of detecting transmural differences in myocardial perfusion.
While improvements in spatial resolution are seen with positron emission tomography (PET)
which is actually capable of quantifying myocardial perfusion, PET still falls short of enabling
quantification of the transmural extent of myocardial perfusion. In this regard, magnetic
resonance (MR) imaging is the only other modality capable of visualizing transmural differences
in myocardial perfusion, even if limited in allowing for its accurate quantification.9,10,26
It is well established that the first manifestations of myocardial ischemia occur in the
subendocardium.27 Under resting conditions, in the absence of critical CAD, myocardial
perfusion is higher in the subendocardium than in the subepicardium.9,28 While this
endocardial/epicardial flow ratio is maintained in myocardium supplied by normal epicardial
arteries during the administration of vasodilators (ie. dipyridamole and adenosine), it is
decreased in myocardium supplied by stenosed epicardial arteries. Previously, Keijer et al used
gadolinium enhanced MR perfusion imaging to measure relative transmural differences in
myocardial perfusion clinically. During dipyridamole stress MR imaging, they demonstrated
by guest on May 20, 2018
http://circimaging.ahajournals.org/
Dow
nloaded from

13
subendocardial/subepicardial ratios of 1.08±0.23 in normal territories and 0.96±0.21 in abnormal
territories supplied by vessels with diameter stenoses ranging from 70-99%. These finding are
very similar to our findings of TPR = 1.12±0.13 in territories supplied by a normal coronary
arteries and our finding of TPR 0.91±0.10 in territories supplied by coronary arteries with 70-
100% diameter stenoses.
Helical vs. Dynamic Volume Computed Tomography
In this study, patients were imaged on either a 64-DCT or a 256-DCT system. It is
important to point out that the 256-DCT system used in this study was a prototype 256 system
and commercially available 320 row detector systems that provide similar dynamic volume CT
capabilities have since been introduced. While the current study was not designed to compare
the efficacy of 64 vs. 256-DCT scanners for CTP imaging, there are several potential
advantages that full cardiac coverage with dynamic volume (256-320 row detector) CT scanning
can provide. Current radiation and contrast doses limit the ability to perform rest and stress
studies. The ability to perform a rest study is important to ensure a high quality CTA and to
assess the reversibility of a perfusion deficit. The recent introduction of prospective ECG-gating
has significantly reduced the overall radiation dose for CTA and is currently available on 64 and
320 detector systems. However, prospective ECG-gating with 64-DCT is limited in temporal
resolution due to half scan reconstruction, limiting its use to patients with heart rates less than
63 beats per minute.29 In the current study, the mean HR during adenosine infusion was 75
beats per minute. Alternatively, prospective ECG-gating with dynamic volume CT is capable of
segmented reconstruction and thus will allow imaging at the higher heart rates commonly
experienced during adenosine infusion. 320-DCT is also capable of synchronous perfusion
imaging of the entire heart. At the present time, it is unclear whether imaging the base of the
heart at a different time than the apex may impact the evaluation of myocardial perfusion by CT
within a patient.
Limitations
by guest on May 20, 2018
http://circimaging.ahajournals.org/
Dow
nloaded from

14
There are several limitations to this study in regards to study design and inherent
limitations of CT technology for the assessment of myocardial perfusion. First, this was a study
of patients with mostly abnormal SPECT studies, therefore limited in its assessment of CTP
imaging in patients with normal perfusion. However, the study does show that the TPR in those
patients with normal coronary arteries on QCA did indeed have a normal TPR on CTP imaging.
Second, this study only used rest perfusion imaging in the 256-DCT group, therefore no
assessment of reversibility was available in the 64-DCT group. Further, this study used patients
from the study group to establish a cutoff for an abnormal TPR. Therefore, further validation
studies are required to confirm these promising results.
The 256-DCT scanner used in this study was a prototype scanner. This prototype
scanner was limited in temporal resolution and did not have prospective ECG-gating available.
Therefore, the radiation dose in this study was relatively high compared to the low-dose CT
protocols currently available on the 320-row detector scanner.
Moreover, CTA frequently uses beta-blockers to lower the HR. Beta-blockers have been
shown to increase hyperemic myocardial blood flow and this effect may reduce differences
between normally perfused and ischemic territories.30 In this regard, betablockers may have
‘hidden’ ischemia in one patient with significant CAD who’s HR remained below 60 beats per
minute during adenosine infusion. Lastly, beam hardening artifacts can be mistaken for
myocardial perfusion deficits. For the purposes of this study, we developed a beam hardening
correction which was implemented to correct for artifacts during reconstruction of the dynamic
volume CT studies.31
Conclusions
CTP imaging can detect transmural differences in myocardial perfusion which can be
accurately quantified as the transmural perfusion ratio (subendocardial/subepicardial
attenuation density). CTP imaging, when combined with CTA, can accurately predict
atherosclerosis causing perfusion abnormalities in comparison with combined QCA/SPECT.
by guest on May 20, 2018
http://circimaging.ahajournals.org/
Dow
nloaded from

15
The combination of CTA with CTP imaging could have ground-breaking implications to the
future diagnostic evaluation of patients with suspected CAD.
Acknowledgements
The authors would like to thank Jorge Guzman, Theresa Caton, and Katherine Hannon
for their technical assistance.
Funding Sources
American College of Cardiology Foundation Career Development Award
Donald W. Reynolds Foundation Clinical Cardiovascular Research Center Award
Toshiba Medical Systems Corporation
Astellas Pharma, Inc.
PJ Schafer Memorial Research Grant
Disclosures
Drs. George, Arbab-Zadeh, Miller, Lardo, and Lima are, in part, funded by a research grant from
Toshiba Medical Systems, Inc. Drs. George, Lardo, and Kitagawa report receiving honoraria
from Toshiba to lecture on cardiovascular CT. The terms of this arrangement are being
managed by the Johns Hopkins University in accordance with its conflict of interest policies.
by guest on May 20, 2018
http://circimaging.ahajournals.org/
Dow
nloaded from

16
References
1. Miller JM, Rochitte CE, Dewey M, Arbab-Zadeh A, Niinuma H, Gottlieb I, Paul N, Clouse ME, Shapiro EP, Hoe J, Lardo AC, Bush DE, de Roos A, Cox C, Brinker J, Lima JA. Diagnostic performance of coronary angiography by 64-row CT. N Engl J Med 2008;359:2324-36. 2. Budoff MJ, Dowe D, Jollis JG, Gitter M, Sutherland J, Halamert E, Scherer M, Bellinger R, Martin A, Benton R, Delago A, Min JK. Diagnostic performance of 64-multidetector row coronary computed tomographic angiography for evaluation of coronary artery stenosis in individuals without known coronary artery disease: results from the prospective multicenter ACCURACY (Assessment by Coronary Computed Tomographic Angiography of Individuals Undergoing Invasive Coronary Angiography) trial. J Am Coll Cardiol 2008;52:1724-32. 3. Vanhoenacker PK, Heijenbrok-Kal MH, Van Heste R, Decramer I, Van Hoe LR, Wijns W, Hunink MG. Diagnostic performance of multidetector CT angiography for assessment of coronary artery disease: meta-analysis. Radiology 2007;244:419-28. 4. Rispler S, Keidar Z, Ghersin E, Roguin A, Soil A, Dragu R, Litmanovich D, Frenkel A, Aronson D, Engel A, Beyar R, Israel O. Integrated single-photon emission computed tomography and computed tomography coronary angiography for the assessment of hemodynamically significant coronary artery lesions. J Am Coll Cardiol 2007;49:1059-67. 5. Schuijf JD, Wijns W, Jukema JW, Atsma DE, de Roos A, Lamb HJ, Stokkel MP, Dibbets-Schneider P, Decramer I, De Bondt P, van der Wall EE, Vanhoenacker PK, Bax JJ. Relationship between noninvasive coronary angiography with multi-slice computed tomography and myocardial perfusion imaging. J Am Coll Cardiol 2006;48:2508-14. 6. Di Carli MF, Dorbala S, Curillova Z, Kwong RJ, Goldhaber SZ, Rybicki FJ, Hachamovitch R. Relationship between CT coronary angiography and stress perfusion imaging in patients with suspected ischemic heart disease assessed by integrated PET-CT imaging. J Nucl Cardiol 2007;14:799-809. 7. George RT, Jerosch-Herold M, Silva C, Kitagawa K, Bluemke DA, Lima JA, Lardo AC. Quantification of myocardial perfusion using dynamic 64-detector computed tomography. Invest Radiol 2007;42:815-22. 8. George RT, Silva C, Cordeiro MA, DiPaula A, Thompson DR, McCarthy WF, Ichihara T, Lima JA, Lardo AC. Multidetector computed tomography myocardial perfusion imaging during adenosine stress. J Am Coll Cardiol 2006;48:153-60. 9. Keijer JT, van Rossum AC, van Eenige MJ, Bax JJ, Visser FC, Teule JJ, Visser CA. Magnetic resonance imaging of regional myocardial perfusion in patients with single-vessel coronary artery disease: quantitative comparison with (201)Thallium-SPECT and coronary angiography. J Magn Reson Imaging 2000;11:607-15. 10. Christian TF, Rettmann DW, Aletras AH, Liao SL, Taylor JL, Balaban RS, Arai AE. Absolute myocardial perfusion in canines measured by using dual-bolus first-pass MR imaging. Radiology 2004;232:677-84. 11. Motoyama S, Anno H, Sarai M, Sato T, Sanda Y, Ozaki Y, Mochizuki T, Katada K, Hishida H. Noninvasive coronary angiography with a prototype 256-row area detector computed tomography system: comparison with conventional invasive coronary angiography. J Am Coll Cardiol 2008;51:773-5. 12. Rybicki FJ, Otero HJ, Steigner ML, Vorobiof G, Nallamshetty L, Mitsouras D, Ersoy H, Mather RT, Judy PF, Cai T, Coyner K, Schultz K, Whitmore AG, Di Carli MF. Initial evaluation of coronary images from 320-detector row computed tomography. Int J Cardiovasc Imaging 2008;24:535-46.
by guest on May 20, 2018
http://circimaging.ahajournals.org/
Dow
nloaded from

17
13. Imaging guidelines for nuclear cardiology procedures, part 2. American Society of Nuclear Cardiology. J Nucl Cardiol 1999;6:G47-84. 14. Cerqueira MD, Weissman NJ, Dilsizian V, Jacobs AK, Kaul S, Laskey WK, Pennell DJ, Rumberger JA, Ryan T, Verani MS. Standardized myocardial segmentation and nomenclature for tomographic imaging of the heart: a statement for healthcare professionals from the Cardiac Imaging Committee of the Council on Clinical Cardiology of the American Heart Association. Circulation 2002;105:539-42. 15. Miller JM, Dewey M, Vavere AL, Rochitte CE, Niinuma H, Arbab-Zadeh A, Paul N, Hoe J, de Roos A, Yoshioka K, Lemos PA, Bush DE, Lardo AC, Texter J, Brinker J, Cox C, Clouse ME, Lima JA. Coronary CT angiography using 64 detector rows: methods and design of the multi-centre trial CORE-64. Eur Radiol 2008. 16. Boden WE, O'Rourke RA, Teo KK, Hartigan PM, Maron DJ, Kostuk WJ, Knudtson M, Dada M, Casperson P, Harris CL, Chaitman BR, Shaw L, Gosselin G, Nawaz S, Title LM, Gau G, Blaustein AS, Booth DC, Bates ER, Spertus JA, Berman DS, Mancini GB, Weintraub WS. Optimal medical therapy with or without PCI for stable coronary disease. N Engl J Med 2007;356:1503-16. 17. Altman DG. Practical statistics for medical research. London ; New York: Chapman and Hall, 1991:xii, 611 p. 18. Bland JM, Altman DG. Statistical methods for assessing agreement between two methods of clinical measurement. Lancet 1986;1:307-10. 19. Zweig MH, Campbell G. Receiver-operating characteristic (ROC) plots: a fundamental evaluation tool in clinical medicine. Clin Chem 1993;39:561-77. 20. Uren NG, Melin JA, De Bruyne B, Wijns W, Baudhuin T, Camici PG. Relation between myocardial blood flow and the severity of coronary-artery stenosis. N Engl J Med 1994;330:1782-8. 21. Pijls NH, De Bruyne B, Peels K, Van Der Voort PH, Bonnier HJ, Bartunek JKJJ, Koolen JJ. Measurement of fractional flow reserve to assess the functional severity of coronary-artery stenoses. N Engl J Med 1996;334:1703-8. 22. Hachamovitch R, Hayes SW, Friedman JD, Cohen I, Berman DS. Comparison of the short-term survival benefit associated with revascularization compared with medical therapy in patients with no prior coronary artery disease undergoing stress myocardial perfusion single photon emission computed tomography. Circulation 2003;107:2900-7. 23. Iskandrian AS, Chae SC, Heo J, Stanberry CD, Wasserleben V, Cave V. Independent and incremental prognostic value of exercise single-photon emission computed tomographic (SPECT) thallium imaging in coronary artery disease. J Am Coll Cardiol 1993;22:665-70. 24. Lin F, Shaw LJ, Berman DS, Callister TQ, Weinsaft JW, Wong FJ, Szulc M, Tandon V, Okin PM, Devereux RB, Min JK. Multidetector computed tomography coronary artery plaque predictors of stress-induced myocardial ischemia by SPECT. Atherosclerosis 2008;197:700-9. 25. Daghini E, Primak AN, Chade AR, Zhu X, Ritman EL, McCollough CH, Lerman LO. Evaluation of porcine myocardial microvascular permeability and fractional vascular volume using 64-slice helical computed tomography (CT). Invest Radiol 2007;42:274-82. 26. Hsu LY, Rhoads KL, Holly JE, Kellman P, Aletras AH, Arai AE. Quantitative myocardial perfusion analysis with a dual-bolus contrast-enhanced first-pass MRI technique in humans. J Magn Reson Imaging 2006;23:315-22. 27. Hoffman JI. Transmural myocardial perfusion. Prog Cardiovasc Dis 1987;29:429-64.
by guest on May 20, 2018
http://circimaging.ahajournals.org/
Dow
nloaded from

18
28. Stoll M, Quentin M, Molojavyi A, Thamer V, Decking UK. Spatial heterogeneity of myocardial perfusion predicts local potassium channel expression and action potential duration. Cardiovasc Res 2008;77:489-96. 29. Husmann L, Valenta I, Gaemperli O, Adda O, Treyer V, Wyss CA, Veit-Haibach P, Tatsugami F, von Schulthess GK, Kaufmann PA. Feasibility of low-dose coronary CT angiography: first experience with prospective ECG-gating. Eur Heart J 2008;29:191-7. 30. Koepfli P, Wyss CA, Namdar M, Klainguti M, von Schulthess GK, Luscher TF, Kaufmann PA. Beta-adrenergic blockade and myocardial perfusion in coronary artery disease: differential effects in stenotic versus remote myocardial segments. J Nucl Med 2004;45:1626-31. 31. Kitagawa K, George RT, Chang H, Lima JA, Lardo AC. Myocardial Perfusion Assessment Using Dynamic-mode 256-Row Multidetector Computed Tomography: Influence of Beam Hardening Correction. JCCT 2008;2:S24.
by guest on May 20, 2018
http://circimaging.ahajournals.org/
Dow
nloaded from

19
Tables
Table 1: Baseline Characteristics
Table 2: Accuracy parameters of CT angiography/CT perfusion in the per-patient
analysis. Reference gold standard = Quantitative coronary angiography + SPECT MPI ;
n, % (95% Confidence Interval).
28 (65)Male15 (35)Female
28.1±11.9Body Mass Index – kg/m2
No. (%)
22 (51)Chronic Beta-blocker Use34 (79)Hypertension36 (84)Hyperlipidemia4 (9)Prior PTCA with Stent2 (5)Known Prior MI
10 (23)Prior CAD12 (28)Diabetes Mellitus12 (28)Family History of Premature CAD24 (56)Tobacco Use (Current or Prior)
60.9±10.1Age - years
With Nonevaluable With Nonevaluable Evaluable Vessels Categorized Vessels Categorized Vessels Only
as Negative (n=27) as Positive (n=27) (n=26)Prevalence 15/27, 56% 16/27, 59% 14/26, 54% Sensitivity 12/15, 80% (51-95) 14/16, 88% (60-98) 12/14, 86% (57-97)Specificity 11/12, 92% (60-100) 10/11, 91% (57-100) 11/12, 92% (61-98)
PPV 12/13, 92% (62-100) 14/15, 93% (66-100) 14/15, 92% (62-100)NPV 11/14, 79% (49-94) 10/12, 83% (51-97) 11/13, 85% (54-97)AUC 0.84 (0.77 - 0.90) 0.89 (0.71 - 0.97) 0.88 (0.70 - 0.97)
by guest on May 20, 2018
http://circimaging.ahajournals.org/
Dow
nloaded from

20
Table 3: Accuracy parameters of CT angiography/CT perfusion in the per-vessel
/territory analysis. Reference gold standard = Quantitative coronary angiography +
SPECT MPI; n, % (95% Confidence Interval). Panel A shows data without correction for
multivessel disease. Panel B shows data with correction for multivessel disease.
With Nonevaluable With Nonevaluable Evaluable Vessels Categorized Vessels Categorized Vessels Only
as Negative (n=81) as Positive (n=81) (n=76)Prevalence 18/81, 22% 18/81, 22% 16/76, 21%Sensitivity 12/18, 67% (41-86) 14/18, 78% (52-93) 12/16, 75% (47-92)Specificity 53/63, 84% (72-92) 51/63, 81% (69-89) 52/60, 87% (75-94)
PPV 12/22, 55% (33-75) 14/26, 54% (34-73) 12/20, 60% (36-80)NPV 53/59, 90% (79-96) 51/55, 93% (82-98) 52/56, 93% (82-98)AUC 0.75 (0.64 - 0.84) 0.79 (0.68 - 0.87) 0.80 (0.70 - 0.89)
With Nonevaluable With Nonevaluable Evaluable Vessels Categorized Vessels Categorized Vessels Only
as Negative (n=81) as Positive (n=81) (n=76)Prevalence 21/81, 26% 21/81, 26% 19/76, 25%Sensitivity 15/21, 71% (48-88) 17/21, 81% (57-94) 15/19, 79% (54-93)Specificity 53/60, 88% (77-95) 51/60, 85% (73-92) 52/57, 91% (80-97)
PPV 15/22, 68% (45-85) 17/26, 65% (44-82) 15/20, 75% (51-90)NPV 53/59, 90% (79-96) 51/55, 93% (82-98) 52/56, 93% (82-98)AUC 0.79 (0.69 - 0.88) 0.83 (0.73 - 0.90) 0.85 (0.75 - 0.92)
Corrected for Multivessel Disease
A
B
With Nonevaluable With Nonevaluable Evaluable Vessels Categorized Vessels Categorized Vessels Only
as Negative (n=81) as Positive (n=81) (n=76)Prevalence 18/81, 22% 18/81, 22% 16/76, 21%Sensitivity 12/18, 67% (41-86) 14/18, 78% (52-93) 12/16, 75% (47-92)Specificity 53/63, 84% (72-92) 51/63, 81% (69-89) 52/60, 87% (75-94)
PPV 12/22, 55% (33-75) 14/26, 54% (34-73) 12/20, 60% (36-80)NPV 53/59, 90% (79-96) 51/55, 93% (82-98) 52/56, 93% (82-98)AUC 0.75 (0.64 - 0.84) 0.79 (0.68 - 0.87) 0.80 (0.70 - 0.89)
With Nonevaluable With Nonevaluable Evaluable Vessels Categorized Vessels Categorized Vessels Only
as Negative (n=81) as Positive (n=81) (n=76)Prevalence 21/81, 26% 21/81, 26% 19/76, 25%Sensitivity 15/21, 71% (48-88) 17/21, 81% (57-94) 15/19, 79% (54-93)Specificity 53/60, 88% (77-95) 51/60, 85% (73-92) 52/57, 91% (80-97)
PPV 15/22, 68% (45-85) 17/26, 65% (44-82) 15/20, 75% (51-90)NPV 53/59, 90% (79-96) 51/55, 93% (82-98) 52/56, 93% (82-98)AUC 0.79 (0.69 - 0.88) 0.83 (0.73 - 0.90) 0.85 (0.75 - 0.92)
Corrected for Multivessel Disease
A
B
by guest on May 20, 2018
http://circimaging.ahajournals.org/
Dow
nloaded from

21
Figures
Figure 1: Computed tomography imaging protocols for 64 and 256 detector CT (CTA:
Computed tomography angiography, CTP: computed tomography perfusion imaging).
Figure 2: Left ventricular segmentation of CT perfusion images. Panels A-C demonstrate 16-
segment analysis of the subendocardial, mid-myocardial, and subepicardial layers, excluding
only the most distal apex.
Figure 3: Relative frequency distribution plot (solid line) of the transmural perfusion ratio (x-
axis) measurements in patients with no obstructive atherosclerosis determined with invasive
coronary angiography (N = 224 myocardial segments). The dotted line represents the normal
distribution.
Figure 4: Bland-Altman Plot demonstrating the agreement in the measurement of the
transmural perfusion ratio (TPR) between observer A and B on the rest (Panel A) and stress
(Panel B) images.
Figure 5: Transmural perfusion ratio (TPR) versus percent diameter stenosis on quantitative
coronary angiography performed on invasive coronary angiograms in patients with stenoses ≥
30%.
Figure 6: Sixty-four row detector computed tomography perfusion (CTP) imaging. Panel A
demonstrates a partially reversible perfusion deficit in the territory of the left anterior descending
artery (LAD) and a primarily fixed perfusion deficit in the inferior wall on radionuclide myocardial
perfusion imaging with increased subdiaphragmatic tracer uptake (stress – upper panels, rest –
by guest on May 20, 2018
http://circimaging.ahajournals.org/
Dow
nloaded from
22
lower panels). Adenosine stress CTP shows a dense perfusion deficit in the LAD territory, as
well as a subendocardial perfusion deficit in the inferior and lateral walls, Panels B and C. The
invasive coronary angiogram is shown in Panel D and demonstrates a left dominant system with
a totally occluded LAD (black arrow) as well as intermediate and high grade stenoses in a large
ramus intermedius, the body of the left circumflex, an the ostium of the obtuse marginal artery
(white arrows).
Figure 7: 256-Row detector computed tomography perfusion (CTP) imaging. Panel A
demonstrates a partially reversible perfusion deficit in the inferior and inferolateral wall on
radionuclide myocardial perfusion imaging in this patient with exertional angina (stress – upper
panels, rest – lower panels). Rest (Panel B) and stress (Panel C) CTP imaging shows a
reversible subendocardial perfusion deficit in the inferior and inferolateral walls. Non-invasive
angiography confirms a significant stenoses (white arrows) in the proximal right coronary artery
(Panels D and E) and the proximal left circumflex artery (Panel F).
by guest on May 20, 2018
http://circimaging.ahajournals.org/
Dow
nloaded from

Stress CTA and CTP
IV AccessECG, VitalsHydrationΒ-Blocker
Time
Adenosine140 μg/kg/min
Initiated
RhythmMonitoring
Iopamidol 3705ml/sec X 90-100 ml
Pre-scan 5 Min
AdenosineOFF
Check ECG
64-DCT
Stress CTP
IV AccessECG, VitalsHydrationΒ-Blocker
Time
Adenosine140 μg/kg/min
Initiated
Iopamidol 3705ml/sec X 60 ml
RhythmMonitoring
Pre-scan 5 Min
AdenosineOFF
Check ECG
10 Min Rest CTA
Iopamidol 3705ml/sec X 60 ml
256-DCT
Figure 1
by guest on May 20, 2018 http://circimaging.ahajournals.org/ Downloaded from

A CB
Figure 2
by guest on May 20, 2018 http://circimaging.ahajournals.org/ Downloaded from

Transmural Perfusion Ratio
Mean = 1.12±0.13
Rel
ativ
e Fr
eque
ncy
(%)
Figure 3
by guest on May 20, 2018 http://circimaging.ahajournals.org/ Downloaded from

Figure 4
A B
by guest on May 20, 2018 http://circimaging.ahajournals.org/ Downloaded from
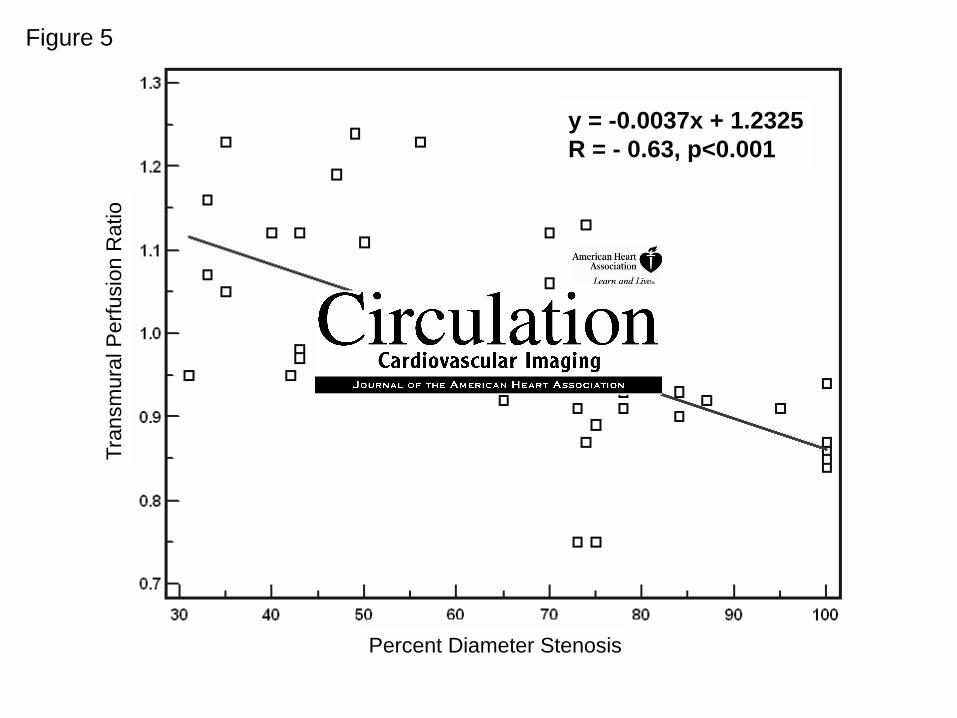
Figure 5
Percent Diameter Stenosis
y = -0.0037x + 1.2325R = - 0.63, p<0.001
Tran
smur
al P
erfu
sion
Rat
io
by guest on May 20, 2018 http://circimaging.ahajournals.org/ Downloaded from

Figure 6
by guest on May 20, 2018 http://circimaging.ahajournals.org/ Downloaded from

Figure 7
A
E
D
CB
A
E
D
CB
A
E
D
CBF
by guest on May 20, 2018 http://circimaging.ahajournals.org/ Downloaded from

A. Bluemke, Lewis Becker, Omair Yousuf, John Texter, Albert C. Lardo and João A.C. LimaRichard T. George, Armin Arbab-Zadeh, Julie M. Miller, Kakuya Kitagawa, Hyuk-Jae Chang, David
atherosclerosis causing myocardial ischemiaimaging: A pilot study evaluating the transmural extent of perfusion abnormalities to predict Adenosine stress 64 and 256 row detector computed tomography angiography and perfusion
Print ISSN: 1941-9651. Online ISSN: 1942-0080 Copyright © 2009 American Heart Association, Inc. All rights reserved.
TX 75231is published by the American Heart Association, 7272 Greenville Avenue, Dallas,Circulation: Cardiovascular Imaging
published online March 31, 2009;Circ Cardiovasc Imaging.
http://circimaging.ahajournals.org/content/early/2009/03/31/CIRCIMAGING.108.813766World Wide Web at:
The online version of this article, along with updated information and services, is located on the
http://circimaging.ahajournals.org//subscriptions/
is online at: Circulation: Cardiovascular Imaging Information about subscribing to Subscriptions:
http://www.lww.com/reprints Information about reprints can be found online at: Reprints:
document. Permissions and Rights Question and Answer this process is available in the
located, click Request Permissions in the middle column of the Web page under Services. Further information aboutnot the Editorial Office. Once the online version of the published article for which permission is being requested is
can be obtained via RightsLink, a service of the Copyright Clearance Center,Circulation: Cardiovascular Imaging Requests for permissions to reproduce figures, tables, or portions of articles originally published inPermissions:
by guest on May 20, 2018
http://circimaging.ahajournals.org/
Dow
nloaded from


![Contentsretailers.kalmbach.com/sitefiles/catalogsamples/67860...64 a b c 6 mm pearl 3 mm bicone crystal 110 seed bead Second row and joining [1] To begin the second row of the bracelet,](https://static.fdocuments.net/doc/165x107/5fb11be37d82987baf000f04/-64-a-b-c-6-mm-pearl-3-mm-bicone-crystal-110-seed-bead-second-row-and-joining.jpg)