Adecco USA Job Market Update -- April 2015 Report
17
• Job Market Update U.S. Economic Data Reflective of the Bureau of Labor Statistics “The Employment Situation – March 2015” As of April 2015
-
Upload
adecco-staffing-usa -
Category
Recruiting & HR
-
view
1.131 -
download
1
Transcript of Adecco USA Job Market Update -- April 2015 Report

•
Job Market UpdateU.S. Economic Data
Reflective of the Bureau of Labor Statistics “The Employment Situation – March 2015”
As of April 2015
•
Overview of “The Employment Situation”
• The March report showed an overall monthly gain of 126,000 jobs – lower than the expected gains of 245,000.
• The unemployment rate remained unchanged at 5.5%
• Revisions to prior months:- The January number was revised from +239,000
to +201,000
- The February number was revised from +295,000 to +264,000
- That makes 69,000 fewer jobs than previously reported
- Over the past 3 months, job gains have averaged 197,000 per month
2
•
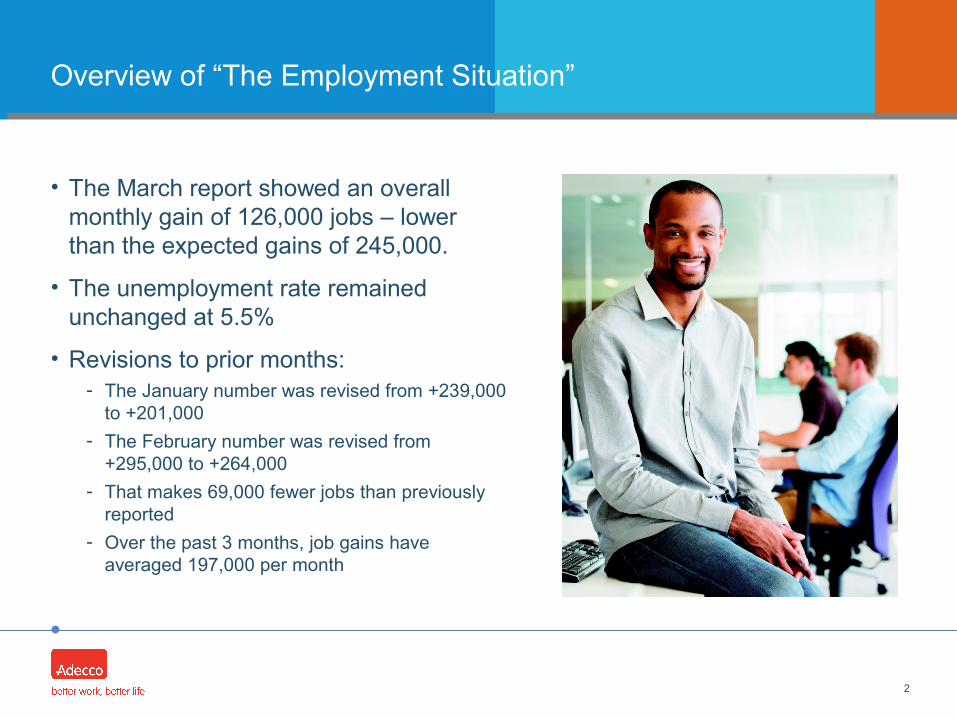
126,000 new jobs added in March
203
304
229
267
212 203
271 261
423
329
201
264
126
MAR-14 APR MAY JUN JUL AUG SEPT OCT NOV DEC JAN FEB 15-MAR
In T
ho
usa
nd
s
3
* Numbers are seasonally adjusted. Source: BLS

•
Unemployment rate in March
• Total nonfarm payroll employment increased by 126,000 in March
- Unemployment rate remained at 5.5%- The number of long-term unemployed
persons (2.7 million) was little changed in March. These individuals make up 29.8% of all unemployed persons
- Over the year, the number of unemployed has declined by 1.1 million
• Discouraged workers in March was 738,000 (little different from a year earlier)
4
JOBS GAINED IN MARCH
UNEMPLOYMENT RATE
LOWEST UNEMPLOYMENT RATE SINCE
126,000
5.5%
July 2008

•
March’s job creation statistics
• United States private sector generated over 129,000 jobs in March
- Highest increase in employment seen within professional and business services, healthcare and retail trade
5
Source: BLS

•
Industry Breakdown
6
Source: BLS

•
Industry Breakdown
7

•
Employment in total nonfarm
-11.0
-1
-1
5.8
25.9
9.5
2
8
40
38
13
11.4
0
-3
-20.0 -10.0 0.0 10.0 20.0 30.0 40.0 50.0
Mining and logging
Construc on
Manufacturing
Wholesale trade
Retail trade
Transporta on and warehousing
Informa on
Financial ac vi es
Professional and Business services
Educa on and health services
Leisure and hospitality
Temporary help services
Other services
Government
Over-the-monthchange, March2015
8
* Numbers are seasonally adjusted in thousands. Source: BLS, Current Employment Statistics Survey, March 2015

•
State & Regional Unemployment – February, 2015
• State and Regional unemployment rates were little changed in February.
- 26 states had unemployment rate decreases from January, 6 states and the District of Columbia had increases and 18 states had no change.
• The states with the highest over-the-month job growth were California, Georgia and New York.
• The states with the lowest over-the-month job growth were Connecticut, Rhode Island and West Virginia.
• In February, the Midwest had the lowest regional unemployment rate at 5.1%.
• The West had the highest unemployment rate at 6.1%.
9
Metropolitan employment data from previous month. Source: BLS

•
Mid-Atlantic Region – February, 2015
10
Metropolitan employment data from previous month. Source: BLS

•
Midwest Region – February, 2015
11
Metropolitan employment data from previous month. Source: BLS

•
Mountain-Plains Region – February, 2015
12
Metropolitan employment data from previous month. Source: BLS

•
New England Region – February, 2015
13
Metropolitan employment data from previous month. Source: BLS

•
New York, New Jersey Region – February, 2015
14
Metropolitan employment data from previous month. Source: BLS

•
Southeast Region – February, 2015
15
Metropolitan employment data from previous month. Source: BLS

•
Southwest Region – February, 2015
16
Metropolitan employment data from previous month. Source: BLS

•
West Region – February, 2015
17
Metropolitan employment data from previous month. Source: BLS