Adaptive optics enables 3D STED microscopy in aberrating specimens
12
Adaptive optics enables 3D STED microscopy in aberrating specimens Travis J. Gould, 1 Daniel Burke, 4 Joerg Bewersdorf, 1,2,3,6 and Martin J. Booth 4,5,* 1 Department of Cell Biology, Yale University School of Medicine, New Haven, CT 06520, USA 2 Department of Biomedical Engineering, Yale University School of Medicine, New Haven, CT 06520, USA 3 Kavli Institute for Neuroscience, Yale University School of Medicine, New Haven, Connecticut 06520, USA 4 Centre for Neural Circuits and Behaviour, University of Oxford, Mansfield Road, Oxford OX1 3SR, UK 5 Department of Engineering Science, University of Oxford, Parks Road, Oxford OX1 3PJ, UK 6 [email protected] * [email protected] Abstract: Stimulated emission depletion (STED) microscopy allows fluorescence far-field imaging with diffraction-unlimited resolution. Unfortunately, extending this technique to three-dimensional (3D) imaging of thick specimens has been inhibited by sample-induced aberrations. Here we present the first implementation of adaptive optics in STED microscopy to allow 3D super-resolution imaging in strongly aberrated imaging conditions, such as those introduced by thick biological tissue. ©2012 Optical Society of America OCIS codes: (180.2520) Fluorescence microscopy; (180.6900) Three-dimensional microscopy; (110.1080) Active or adaptive optics; (350.5730) Resolution. References and links 1. D. Toomre and J. Bewersdorf, “A new wave of cellular imaging,” Annu. Rev. Cell Dev. Biol. 26(1), 285–314 (2010). 2. S. W. Hell, “Microscopy and its focal switch,” Nat. Methods 6(1), 24–32 (2009). 3. S. W. Hell and J. Wichmann, “Breaking the diffraction resolution limit by stimulated emission: stimulated- emission-depletion fluorescence microscopy,” Opt. Lett. 19(11), 780–782 (1994). 4. E. Betzig, G. H. Patterson, R. Sougrat, O. W. Lindwasser, S. Olenych, J. S. Bonifacino, M. W. Davidson, J. Lippincott-Schwartz, and H. F. Hess, “Imaging intracellular fluorescent proteins at nanometer resolution,” Science 313(5793), 1642–1645 (2006). 5. S. T. Hess, T. P. Girirajan, and M. D. Mason, “Ultra-high resolution imaging by fluorescence photoactivation localization microscopy,” Biophys. J. 91(11), 4258–4272 (2006). 6. M. J. Rust, M. Bates, and X. Zhuang, “Sub-diffraction-limit imaging by stochastic optical reconstruction microscopy (STORM),” Nat. Methods 3(10), 793–796 (2006). 7. J. B. Ding, K. T. Takasaki, and B. L. Sabatini, “Supraresolution imaging in brain slices using stimulated- emission depletion two-photon laser scanning microscopy,” Neuron 63(4), 429–437 (2009). 8. N. T. Urban, K. I. Willig, S. W. Hell, and U. V. Nägerl, “STED Nanoscopy of Actin Dynamics in Synapses Deep Inside Living Brain Slices,” Biophys. J. 101(5), 1277–1284 (2011). 9. B. R. Rankin, G. Moneron, C. A. Wurm, J. C. Nelson, A. Walter, D. Schwarzer, J. Schroeder, D. A. Colón- Ramos, and S. W. Hell, “Nanoscopy in a living multicellular organism expressing GFP,” Biophys. J. 100(12), L63–L65 (2011). 10. S. Berning, K. I. Willig, H. Steffens, P. Dibaj, and S. W. Hell, “Nanoscopy in a living mouse brain,” Science 335(6068), 551 (2012). 11. S. Deng, L. Liu, Y. Cheng, R. Li, and Z. Xu, “Investigation of the influence of the aberration induced by a plane interface on STED microscopy,” Opt. Express 17(3), 1714–1725 (2009). 12. R. Schmidt, C. A. Wurm, S. Jakobs, J. Engelhardt, A. Egner, and S. W. Hell, “Spherical nanosized focal spot unravels the interior of cells,” Nat. Methods 5(6), 539–544 (2008). 13. T. A. Klar, S. Jakobs, M. Dyba, A. Egner, and S. W. Hell, “Fluorescence microscopy with diffraction resolution barrier broken by stimulated emission,” Proc. Natl. Acad. Sci. U.S.A. 97(15), 8206–8210 (2000). 14. M. J. Booth, M. A. Neil, R. Juskaitis, and T. Wilson, “Adaptive aberration correction in a confocal microscope,” Proc. Natl. Acad. Sci. U.S.A. 99(9), 5788–5792 (2002). 15. N. Ji, D. E. Milkie, and E. Betzig, “Adaptive optics via pupil segmentation for high-resolution imaging in biological tissues,” Nat. Methods 7(2), 141–147 (2010). 16. M. Rueckel, J. A. Mack-Bucher, and W. Denk, “Adaptive wavefront correction in two-photon microscopy using coherence-gated wavefront sensing,” Proc. Natl. Acad. Sci. U.S.A. 103(46), 17137–17142 (2006). 17. X. D. Tao, O. Azucena, M. Fu, Y. Zuo, D. C. Chen, and J. Kubby, “Adaptive optics microscopy with direct wavefront sensing using fluorescent protein guide stars,” Opt. Lett. 36(17), 3389–3391 (2011).
Transcript of Adaptive optics enables 3D STED microscopy in aberrating specimens


in Eq. (1) (in STED imaging mode). Figure 3 shows xz-images of fluorescent beads before and after aberration correction. It can be clearly seen that the aberrated depletion focus (PSF shown in Fig. 3(a)) had a detrimental effect on both the image intensity and resolution. By correcting system aberrations, the axial STED resolution could be improved by a factor of 2 from ~280 nm to ~140 nm while at the same time the signal intensity increased by a factor of ~1.6. This quality improvement can also be seen when measuring the depletion focus directly: Figs. 3(a) and 3(b) show the intensity distribution of the depletion focus measured in reflection mode by scanning a 150 nm diameter gold bead through the focal region without and with the obtained aberration correction, respectively. As shown in this figure, aberration correction leads to a far more symmetric depletion focus with a more pronounced intensity minimum.
To demonstrate correction of aberrations induced by a strongly aberrating sample, we next imaged fluorescent beads through a layer of glycerol (n = 1.47). Samples with fluorescent beads were prepared by attaching 100 nm crimson beads to the microscope slide coated with poly-L-lysine and beads were imaged through a #1.5 coverglass and ~55 µm of glycerol which was used as the embedding medium. Figure 4 shows the bead images before and after aberration correction in regular confocal and in STED imaging modes. The aberration correction routine began by correcting the excitation beam path using the image brightness B as the metric in confocal imaging mode. The resulting correction values were then used as the starting point for correction of the depletion beam path using the combined metric defined in Eq. (1) in STED imaging mode. Figures 4(a) and 4(b) illustrate the benefits of using a second SLM to correct aberrations in the excitation beam path (for confocal imaging). As shown in Fig. 4(c), the non-corrected STED image exhibits moderately improved resolution compared to the confocal image, but at the expense of a significant decrease in the signal level as the non-zero central intensity depletes the fluorescence. On the other hand, correction of aberrations significantly enhances both the intensity and resolution of the STED image (Fig. 4(d)). Comparing the axial profiles of the STED and AO STED images (Fig. 4(e)) reveals a ~5-fold increase in the peak signal as well as a ~3.2-fold improvement in resolution.
Fig. 3. Adaptive correction of residual system aberrations. (A, B) STED PSF using the central λ/2 phase mask before (A) and after (B) correction for system aberrations with corresponding phase patterns used on SLM2. (C, D) xz STED images of 100 nm fluorescent bead attached to coverglass and imaged (C) before and (D) after correction of system aberrations. (E) Axial line profiles of pixels summed across horizontal dimension of dashed boxes in (C) and (D). Fitted curves give FWHM of 280 nm (Gaussian fit) for the uncorrected STED image and 140 nm (Lorentzian fit) when adaptive optics is used to compensate for system-induced aberrations in the STED beam path.

Fig. 4. Images of 100 nm fluorescent beads through ~55 µm layer of glycerol. xz images were acquired in confocal mode (A) before and (B) after correction of sample induced aberrations, and STED mode with (C) correction to the excitation beam only and (D) correction to excitation and depletion beam paths. (E) Axial line profiles of pixels summed across horizontal dimension of dashed boxes in (C) in (D) show improvement in both resolution and signal when aberrations are corrected in the STED beam path.
To further test the correction procedure using aberrations encountered in biological specimens, 200 nm crimson beads were added on top of zebrafish retina sections attached to #1.5 coverglass and then mounted in PBS (to mimic the aqueous embedding conditions of live sample imaging) onto a microscope slide. Figures 5(a)-5(l) show xy and xz images of an individual bead after focusing ~14 µm or ~25 µm through the retina sections. In this application all aberration correction was performed solely on the STED beam path to demonstrate that correction of the depletion beam path is possible without prior knowledge of corrections made to the excitation path. These data also demonstrate that the quality of the depletion focus is the dominating factor in achieving sub-diffraction resolution in the STED images. While correction of relatively few aberration modes was sufficient to obtain ~200 nm and ~250 nm axial resolution for imaging depths of ~14 µm and ~25 µm, respectively, we expect that including higher order aberrations in the correction routine should further improve the STED resolution. Figures 5(m)-5(o) show volume renderings of the data depicted in Figs. 5(a)-5(f) and represent the first 3D super-resolution STED image recorded through scattering tissue.
We note that the STED images shown in Figs. 3-5 before and after aberration correction are of the same beads on which the correction routine was performed, thus demonstrating that photobleaching was not significant in these experiments. Labeling conditions in biological imaging applications are likely to use less photostable fluorophores, which in some instances may not tolerate the acquisition of 5-7 STED images per aberration mode. However, it has been demonstrated that only 2N + 1 images are required to correct for N aberration modes [25] and we expect this approach to be compatible with methods presented here. Furthermore, applications otherwise inhibited by photobleaching may benefit from the implementation of triplet-state-relaxation during STED imaging [20] either by increasing scan rates or using lower repetition rate lasers.
#171616 - $15.00 USD Received 29 Jun 2012; revised 31 Jul 2012; accepted 2 Aug 2012; published 29 Aug 2012(C) 2012 OSA 10 September 2012 / Vol. 20, No. 19 / OPTICS EXPRESS 21007
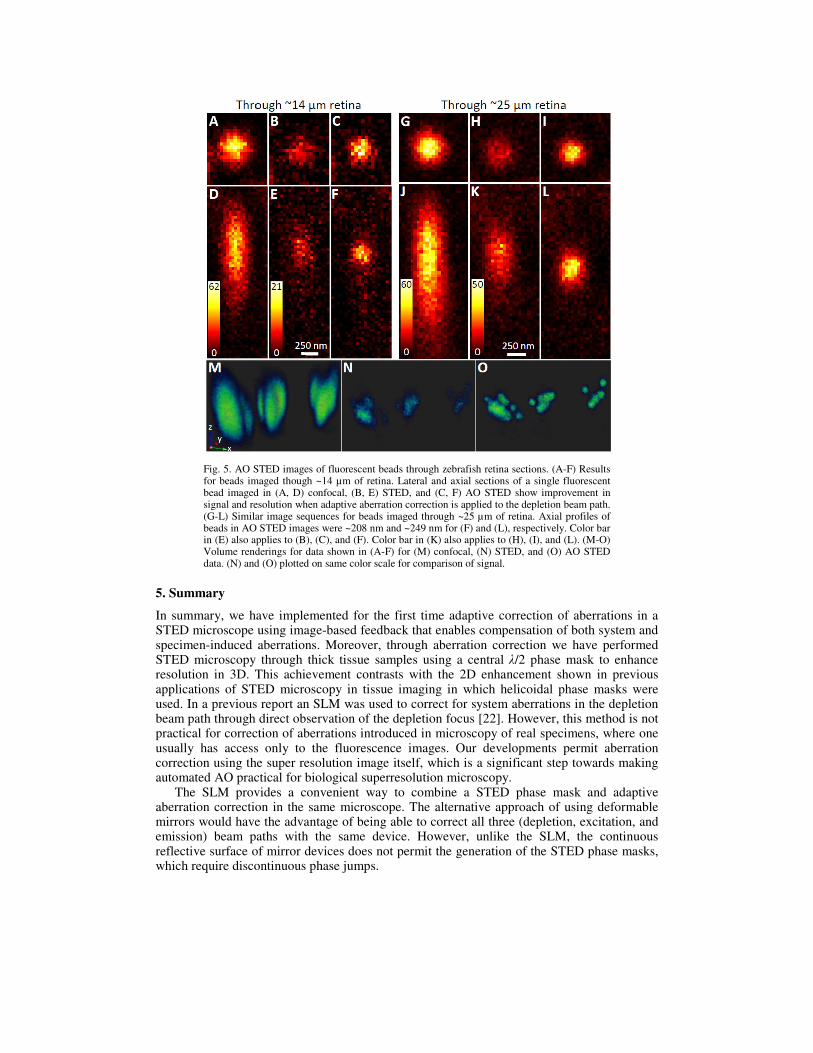
Fig. 5. AO STED images of fluorescent beads through zebrafish retina sections. (A-F) Results for beads imaged though ~14 µm of retina. Lateral and axial sections of a single fluorescent bead imaged in (A, D) confocal, (B, E) STED, and (C, F) AO STED show improvement in signal and resolution when adaptive aberration correction is applied to the depletion beam path. (G-L) Similar image sequences for beads imaged through ~25 µm of retina. Axial profiles of beads in AO STED images were ~208 nm and ~249 nm for (F) and (L), respectively. Color bar in (E) also applies to (B), (C), and (F). Color bar in (K) also applies to (H), (I), and (L). (M-O) Volume renderings for data shown in (A-F) for (M) confocal, (N) STED, and (O) AO STED data. (N) and (O) plotted on same color scale for comparison of signal.
5. Summary
In summary, we have implemented for the first time adaptive correction of aberrations in a STED microscope using image-based feedback that enables compensation of both system and specimen-induced aberrations. Moreover, through aberration correction we have performed STED microscopy through thick tissue samples using a central λ/2 phase mask to enhance resolution in 3D. This achievement contrasts with the 2D enhancement shown in previous applications of STED microscopy in tissue imaging in which helicoidal phase masks were used. In a previous report an SLM was used to correct for system aberrations in the depletion beam path through direct observation of the depletion focus [22]. However, this method is not practical for correction of aberrations introduced in microscopy of real specimens, where one usually has access only to the fluorescence images. Our developments permit aberration correction using the super resolution image itself, which is a significant step towards making automated AO practical for biological superresolution microscopy.
The SLM provides a convenient way to combine a STED phase mask and adaptive aberration correction in the same microscope. The alternative approach of using deformable mirrors would have the advantage of being able to correct all three (depletion, excitation, and emission) beam paths with the same device. However, unlike the SLM, the continuous reflective surface of mirror devices does not permit the generation of the STED phase masks, which require discontinuous phase jumps.
#171616 - $15.00 USD Received 29 Jun 2012; revised 31 Jul 2012; accepted 2 Aug 2012; published 29 Aug 2012(C) 2012 OSA 10 September 2012 / Vol. 20, No. 19 / OPTICS EXPRESS 21008

Aberrations were corrected using a sensorless AO scheme in which aberration modes were sequentially corrected through a process of image optimization. The definition of a new image quality metric, combining both image sharpness and brightness, was necessary to account for the way in which aberrations affect STED images. We have implemented the correction using images of beads through tissue specimens. We expect, however, that our correction scheme is applicable to any arrangement of fine scale objects.
The implementation of AO in STED microscopy is a critical step towards achieving 3D super-resolution inside strongly aberrating samples. This is especially important when imaging living samples where matching the refractive indices of immersion liquids and mounting media is not practical. In addition to the demonstrations of superresolution STED microscopy in tissue, there have recently been applications of stochastic switching-based nanoscopy approaches to the imaging of multi-cellular structures [28]. AO has also recently been used in this branch of nanoscopy to correct for instrument-induced aberrations [29]. We expect that AO will be instrumental in extending correction of sample-induced aberrations to all superresolution modalities using an approach similar to that presented here. This implementation of AO has the potential to advance 3D diffraction-unlimited microscopy to a new imaging frontier in (living) tissue and intact specimens.
Acknowledgments
We thank Caixia Lv and David Zenisek for the preparation of the zebrafish tissue sections and Manuel Juette and Lena Schroeder for helpful discussions. This work was supported by the Wellcome Trust (095927/A/11/Z, 095927/B/11/Z) and the Kavli Foundation. T.J.G. was supported by the National Institute of General Medical Sciences (F32GM096859). M.J.B. was supported by the Engineering and Physical Sciences Research Council, UK (EP/E055818/1). JB discloses significant financial interest in Vutara, Inc.
#171616 - $15.00 USD Received 29 Jun 2012; revised 31 Jul 2012; accepted 2 Aug 2012; published 29 Aug 2012(C) 2012 OSA 10 September 2012 / Vol. 20, No. 19 / OPTICS EXPRESS 21009