
ACTUATORS LAB 2018/2019 LABORATORY MANUAL
45
2018/2019 ACTUATORS LAB LABORATORY MANUAL By: Prof. Lutfi Al-Sharif Eng. Osama Fuad Eng. Nazmi Ashour
Transcript of ACTUATORS LAB 2018/2019 LABORATORY MANUAL

2018/2019
ACTUATORS LAB LABORATORY MANUAL
By: Prof. Lutfi Al-Sharif Eng. Osama Fuad
Eng. Nazmi Ashour

1
Table of Contents INTRODUCTION TO THE LAB ................................................................................................................................2
LABORATORY SAFETY RULES ...............................................................................................................................3
INTRODUCTION TO LAB EQUIPMENT ..................................................................................................................4
EXPERIMENT 1: THE SINGLE PHASE TRANSFORMER ..........................................................................................6
EXPERIMENT 2: THREE PHASE INDUCTION MOTOR, PART 1 .......................................................................... 14
EXPERIMENT 3: THREE PHASE INDUCTION MOTOR, PART 2: NO LOAD, BLOCKED ROTOR & LOAD TESTS .. 22
EXPERIMENT 4: SEPARATELY EXCITED DC MOTOR .......................................................................................... 30
EXPERIMENT 5: SPEED TORQUE CURVES FOR DIFFERENT DC MOTORS ......................................................... 33
EXPERIMENT 6: PLOTTING THE BH CURVE FOR THE DC MOTOR .................................................................... 38
EXPERIMENT 7: SYNCHRONOUS MOTOR ......................................................................................................... 40

2
INTRODUCTION TO THE LAB
This practical course of Electrical Actuators is provided by the Department of
Mechatronics Engineering. It is designed to achieve the following objectives:
Provide the student with the basic skills and proficiency of implementing the
wiring diagrams required to conduct the testing procedures of transformers, AC
and DC generators and motors.
Provide the student with the basic skills of conducting different testing procedures
of the different types of electrical machines.
Allow the student to benefit from the testing results of the testing procedures to
calculate the parameters of the tested machine equivalent circuit.
Provide the student with the proficiency of constructing the experimental
performance characteristics of the different types of machines and correlate
practical and theoretical results.

3
LABORATORY SAFETY RULES
Emergency Response
1. It is your responsibility to read safety and fire alarm posters and follow the instructions during an
emergency.
2. Know the location and function of all lab safety equipment including First Aid box and fire
extinguisher.
3. Notify your instructor immediately after any injury, fire or explosion.
General Safety Rules
1. Read all directions for an experiment and follow the directions exactly as they are written, if in
doubt, ask the teacher.
2. Always obtain permission before experimenting on your own.
3. Never handle any equipment unless you have specific permission.
4. Pay particular attention to moving or rotating objects like motors, gears and pistons.
5. Never eat, drink, or smoke while working in the laboratory.
6. You have long hair or loose clothes, make sure it is tied back or confined.
Electrical Safety
1. Obtain permission before operating any high voltage equipment.
2. Make sure electronic equipment is OFF when plugging or unplugging from an outlet.
3. Make sure the working area for electrical equipment is clean and dry.
4. Avoid using extension cords whenever possible. If you must use one, obtain a heavy- duty one
that is electrically grounded, with its own fuse, and install it safely. Never, ever modify, attach
or otherwise change any high voltage equipment.
5. Always make sure all capacitors are discharged before touching high voltage leads or the
"inside" of any equipment even after it has been turned off. Capacitors can hold charge for
many hours after the equipment has been turned off.
End of Laboratory activity rules
1. Clean all laboratory equipment and return to their locations
2. Unplug and store properly any electrical device.
3. Wash your hands after every experiment.
4. Clean up your work area before leaving.

4
INTRODUCTION TO LAB EQUIPMENT
Three-phase 2-speed SCI Motor:
Technical features: Power: 0.9/1.1 kW ,
Voltage: 380 V , Current: 2.5/3.3 A , Speed
: 1420/2830 rpm, 50 Hz
Three-phase Synchronous Machine
Machine with smooth inductor and three-
phase stator armature winding for operation
either as an alternator or as a synchronous
motor.
Technical features: As alternator: Power
1.1 KVA, As motor: Power 1 kW, Voltage:
220/380 V Δ /Y, Current: 2.9/1.7 A Δ /Y,
Speed: 3000 rpm, Excitation: 180 V / 0.47
A
DC Motor Series Excitation
Technical features: Power: 1.1 kW ,
Voltage: 220 V , Speed: 2800 rpm
DC Motor Compound Excitation
Technical features: Power: 1.1 kW ,
Voltage: 220 V , Speed: 3600 rpm ,
Excitation: 180 V / 0.27 A
DC Motor Shunt Excitation
Technical features: Power: 1.1 kW ,
Voltage: 220 V , Speed: 3000 rpm ,
Excitation: 190 V / 0.28 A

5
Power Supply
Output voltages: Variable AC 3x0‐430 V, 5
A/ 3x0‐240 V, 8 A Fixed AC 3x380 V + N,
16 A / 3x220 V, 8 A Standard fixed AC 220
V, 10 A Variable DC 0‐240 V, 10 A /0‐225
V, 1 A Fixed DC 220 V, 10 A Power supply
3x380 V + N, 50/60 Hz
Brake
Smooth roll rotor and salient pole stator.
Provided with arms, weight and balance
weight for measuring the output torque of
the motor.. Technical features: Maximum
supply voltage: 250 Vdc, Maximum speed:
4000 rpm, Maximum power 1.4
Mechanical Power Measuring Unit
Direct measurement of motor output torque
through load cell and of rotating speed
through optical transducer, with mechanical
power display.
Starting And Synchronization
Rotor starter for three‐phase slip ring motors
and excitation device for synchronization
with the mains.
Starting rheostat
Step-variable rheostat for the half torque
starting of the dc motors of the laboratory.

6
EXPERIMENT 1: THE SINGLE PHASE TRANSFORMER
OBJECTIVES
To understand the basic working principle of a transformer.
To obtain the equivalent circuit parameters from OC and SC tests, and to estimate efficiency
& regulation at various loads.
THEORY
Transformers are arguably the most universally applied pieces of electrical equipment. As
such, they range in size from miniature units weighing ounces to huge units weighing tons. All
transformers, however, exhibit the same basic properties.
When mutual induction is permitted between two coils or windings, a change in current flowing
through one coil induces a voltage upon the other coil. All transformers have a primary winding and
one or more secondary windings. The electromagnetic coupling between the primary and secondary
windings allows electrical energy to be transferred from the primary winding to the secondary winding.
Electrical current entering the primary winding appears as an electromotive force (emf) at the
secondary. Connecting the secondary winding to a load allows the energy to be transferred to the load.
Since there is no electrical connection between primary and secondary windings (only a magnetic
connection), the source and load can be electrically isolated from each other by means of a transformer.
When a transformer is energized and loaded, AC current flowing in its windings creates an
alternating magnetic field in its iron core. A small portion of the current, called the magnetizing
current, is dedicated to the magnetic circuit in the creation of the magnetic field. Losses associated
with the magnetizing current are reactive power (VARs). In addition, there are real power losses
(Watts) in the transformer, associated with the inherent resistance in the windings (copper losses) and
with eddy currents and hysteresis in the core (iron losses). For these reasons, the total power delivered
to the primary side of the transformer is always larger than the total power available at the secondary
The University of Jordan
School of Engineering
Mechatronics Engineering Department
Actuators Lab

7
side. Even so, it is still reasonable to say that energy is conserved in the transformer and that the real,
reactive and apparent power applied to the primary of almost any transformer equals the real, reactive
and apparent power available at the secondary.
When the voltage applied to the primary winding is raised above rated value, the iron core begins
to saturate, which leads to a rapid increase in the magnitude of the magnetizing current. Saturation of
the core also distorts the sinusoidal voltage and current waveforms. The resulting harmonics can lead
to mechanical resonances which, in large transformers, can be damaging. Transformers are also very
susceptible to damage from short circuit currents.
APPARATUS:
Power Supply Module
Transformer Module 550 VA, 1ϕ Transformer
AC Ammeter (0-10A)
AC Voltmeter (0-1000V)
Wattmeter 2KW ---
PROCEDURE
CAUTION! – High voltages are present in this Experiment. DO NOT make any
connections with the power supply ON. Get in the habit of turning OFF the power
supply after every measurement.
1. Examine the construction of the Transformer Module, its terminals and Input/output voltages.
2. List the rated voltage between each of the identified connection terminals, and list the rated
current for connections.
3. Find the turn ratio between the windings.
8
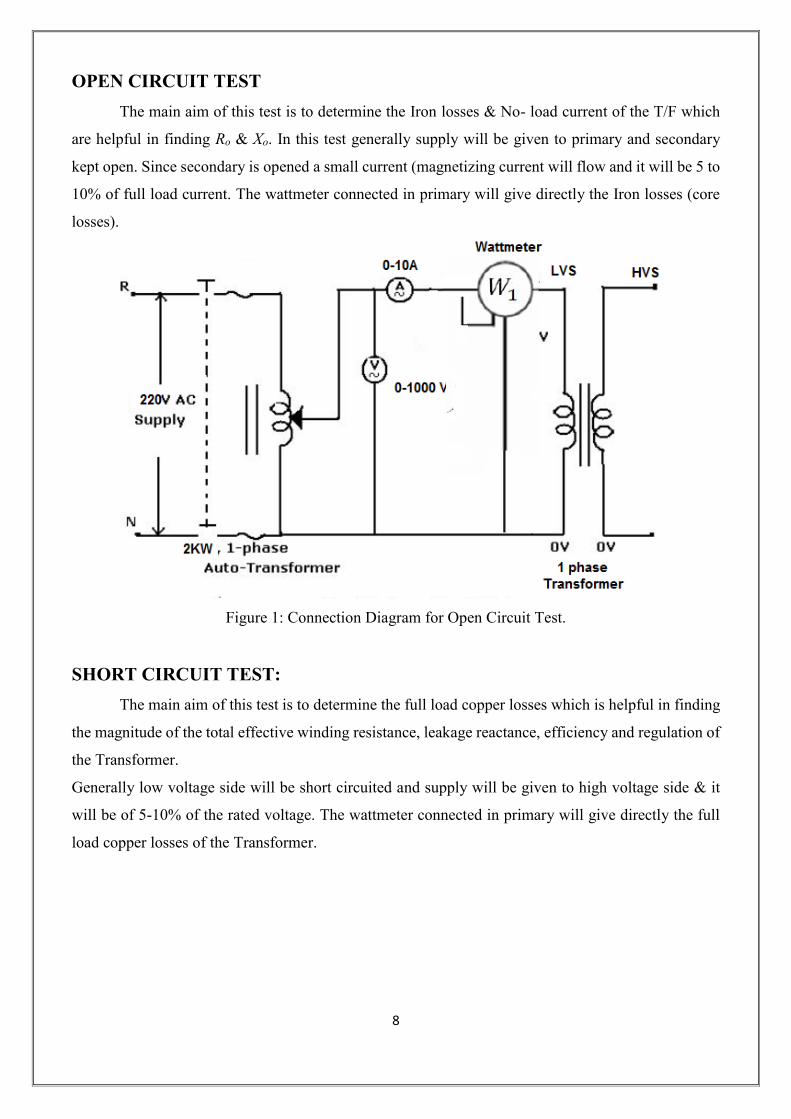
OPEN CIRCUIT TEST
The main aim of this test is to determine the Iron losses & No- load current of the T/F which
are helpful in finding Ro & Xo. In this test generally supply will be given to primary and secondary
kept open. Since secondary is opened a small current (magnetizing current will flow and it will be 5 to
10% of full load current. The wattmeter connected in primary will give directly the Iron losses (core
losses).
Figure 1: Connection Diagram for Open Circuit Test.
SHORT CIRCUIT TEST:
The main aim of this test is to determine the full load copper losses which is helpful in finding
the magnitude of the total effective winding resistance, leakage reactance, efficiency and regulation of
the Transformer.
Generally low voltage side will be short circuited and supply will be given to high voltage side & it
will be of 5-10% of the rated voltage. The wattmeter connected in primary will give directly the full
load copper losses of the Transformer.

9
Figure 2: Connection Diagram for Short Circuit Test.
PROCEDURE
(a) Open Circuit Test:
1. Connect the circuit diagram as shown in the Figure 1.
2. Gradually increase the voltage using the auto-transformer till the voltmeter reads 220V.
3. Record the voltmeter, ammeter and wattmeter readings. The ammeter indicates the no-load
current and wattmeter indicates the iron losses.
4. Switch off the supply and set the auto-transformer at zero position.
5. Find the values of the equivalent core loss resistance Rc and magnetizing reactance Xm.
6. Calculate cosθ , the angle θ, Ic and Im, from the test results recorded. Then construct the phasor
diagram.
7. Plot the no-load current Ioc, magnetizing current IM and core loss W0 and no-load power factor
cosθ, against the applied voltage Voc on the same graph paper.
Open Circuit Test Readings
Voc (Volt) Ioc (Amp) Woc (Watt) IC IM cosθ

10
(b) Short Circuit Test:
1. Connect the circuit diagram as shown in the Figure 2.
2. Gradually increase the voltage using the auto-transformer till the ammeter reads the rated
current of the transformer on HV side.
3. Record the voltmeter, ammeter and wattmeter readings. The ammeter indicates Isc, voltmeter
indicates Vsc and wattmeter indicates Wsc copper losses of the transformer at full load condition.
4. Switch off the supply and set the auto-transformer at zero position.
Short Circuit Test Readings
Voc (Volt) Isc (Amp) Wsc (Watt)
5. Compute the equivalent circuit parameter Rs and Xs at the rated high voltage winding current.
6. Draw the equivalent circuit of the transformer in the form having all impedances on the primary
side of the ideal transformer. Mark in the values calculated in this practical and include all the
calculated parameters.
Notes:
1. It may seem that it would be far simpler to measure the winding resistance with an ohm meter,
and the leakage reactance may seem rather uncertain from your measurements. But consider
the situation with a very large transformer.
2. Large transformers have thick conductors in order to pass large currents without excessive
heating. The resistance is often too low to measure with an ordinary ohmmeter and in any case
may differ between AC and DC values, so it is better determined by the ammeter and
electrodynamic wattmeter method using AC.
3. You may have found the reactance uncertain because its calculation involved a small difference
between two large quantities. But in a large transformer, the reactance is usually much larger
than the resistance and, in this case, the errors of the measurement matter far less.

11
LOAD TEST
The load on a large power transformer in a sub-station will vary from a very small value in the
early hours of the morning to a very high value during the heavy peaks of maximum industrial and
commercial activity. The transformer secondary voltage will vary somewhat with the load, and because
motors, incandescent lamps, and heating devices are all quite sensitive to voltage changes, transformer
regulation is of considerable importance. The secondary voltage also depends upon whether the power
factor of the load is leading, lagging, or unity. Therefore, it should be known how the transformer will
behave (its voltage regulation) when connected to a capacitive, an inductive, or a resistive load.
This test is performed to determine the efficiency and regulation of a transformer at different load
conditions. Usually, this test is performed for low, power, rating of transformers. This test gives
accurate results as compared to the above tests. In this test, measurements are taken on HV side and
LV side at different load conditions.
PROCEDURE
1. Make the connections as the circuit diagram in Figure 3.
2. Keep the switch on secondary side open so that load is zero to measure no load voltage.
Also keep knob of auto transformer at zero output voltage position.
3. Now increase the voltage through autotransformer until the voltage at secondary winding
at its rated value.
4. Adjust the switches on the Resistive Load module to successively increase the loading
factor.
5. For each resistance value, record the readings from Wattmeter, Voltmeter, & Ammeter.
6. Switch off the AC-Supply.

12
Figure 3: Connection Diagram for Load Test.
OBSERVATION TABLE (Load Test):
Loading
Factor %
Wprim
(Watts)
Vprim
(volts)
Iprim
(Amp)
Isec
(Amp)
Output Power
Efficiency
Regulation
7. Fill the table with your measurements and calculate the efficiency and regulation of the
transformer.
8. Plot the output power versus the regulation and the efficiency.

13
FORMULAS
Open Circuit Test
Short Circuit Test

14
EXPERIMENT 2: THREE PHASE INDUCTION MOTOR, PART 1
OBJECTIVES
To understand the principle of operation and the construction of the three phase induction
motor.
Start the three phase induction motor via star-delta connection using Contactors, Start and
reverse the direction of the three phase induction motor via star-delta connection using
contactors
THEORY
An induction motor is one in which alternating current is supplied to the stator directly and to
the rotor by induction or transformer action from the stator. When excited from a balanced three-phase
source, the stator winding will produce a magnetic field in the air gap rotating at synchronous speed
as determined by the number of stator poles and the applied stator frequency. The rotor of a three-
phase induction machine may be one of two types. A wound rotor is built with a three-phase winding
similar to, any wound with the same number of poles as, the stator. The terminals of the rotor winding
are connected to insulated slip rings mounted on the shaft as shown in Figure 1(a). Carbon brushes
bearing on these rings make the rotor terminals available external to the motor. The second type is
squirrel-cage rotor with a winding consisting of conducting bars embedded in slots in the rotor iron
and short circuited at each end by conducting end rings. The three-phase induction motor with squirrel-
cage rotor is shown in Figure 1(b).
The University of Jordan
School of Engineering
Mechatronics Engineering Department
Actuators Lab

15
(a)
(b)
Figure 1: Cutaway view of a three-phase (a) wound-rotor and (b) squirrel-cage induction motor.
DIRECT ON LINE OPERATION
The direct-on-line (DOL) motor start is the easiest method for starting up three-phase
asynchronous motors. The stator windings are directly connected to the mains supply in a single
switching process. Large starting currents (surge currents) result by applying the full mains voltage,
which in turn cause troublesome voltage changes on the mains supply. For small size motor (less than
2 HP) where starting torque is about twice the full-load torque and starting period lasts only a few
seconds, this type starter is used. The schematic diagram for DOL starter is shown in the Figure below.

16
Figure 2: Direct on line motor starter.
STAR DELTA CONNECTION
With a star-delta motor start, the start-up of the three-phase asynchronous motor is
implemented by a changeover of the windings. During the operating connection, the windings of the
motor are connected in delta. The winding voltage must therefore be equal to the phase voltage of the
three-phase system. For example, at a mains supply voltage of 3ϕ AC 400 V the voltage ratings on the
rating plate of te motor must be specified as 400/690 V. In a star connection, the mains voltage on the
individual motor windings is reduced by a factor of 1/ 3 For example: 400/ 3 V = 230 V.
Starting torque and inrush current are (in the star connection) reduced to about a third of the
values for the delta connection.. Due to the reduced starting torque, the star-delta configuration is only
suitable for drives with smaller load torques or load torques that increase with speed, such as is the
case with pumps and fans (ventilators/blowers). They are also used where the drive is only subject to
a load after it has accelerated up to speed, for example, with presses and centrifuges.
With the changeover of the circuit configuration from star to delta, the current drops to zero,
and the speed of the motor reduces depending on the load. The changeover to delta then causes a
dramatic rise in the current, as the full mains voltage is now applied to the motor windings. Voltage
dips will result on unreliable or weak supply systems. The motor torque also jumps to a higher value
during changeover, which causes additional loading on the entire drive system. If, for example, pumps

17
are operated with star-delta starters, a mechanical damper is often used to provide system damping and
to prevent a critical “water hammer” to the system. Automatic changeover from star to delta is usually
controlled by a timing relay on the contactor circuit. The time required for starting in the star
connection is dependent on the load on the motor and should continue until the motor has reached
about 75 to 80 % of its operating speed to ensure that the least possible post-acceleration is necessary
after changeover to delta. This post-acceleration is associated in delta configuration with high currents
just as is the case with direct-on-line starting. Switching over too quickly between star and delta can
result in disconnection arcing (on the switching contacts) and can cause a short circuit. The changeover
time interval should be selected so that it is long enough to quench the arcs. At the same time, the
speed of the drive should be reduced as little as possible. The correct phase sequence for the
changeover from star to delta must be observed when connecting the conductors to the motor and
starter. The operating direction of the motor must be considered and observed. Incorrect connection of
the phases can cause very high peak currents at restart, because of the slight drop in speed during the
de-energized changeover interval. The current peaks endanger the motor windings and stress the
switchgear contacts unnecessarily.
CONTACTORS
Contactor is a basic component that functions as a switch rather they are advanced form of
switches. They are commonly used to control motors and to perform opening/closing operations.. It
consists of two contact parts- stationary and movable. Whole circuit is connected to the stationary part
and the movable part consists of a coil. When the coil is energized the movable contacts are closed
against the stationary contacts, and the circuit gets completed. Ordinary relays are normally used for
low current but contactors are used for switching operations at higher values of currents. Three
contactors 16 Amp, 415V are used in the lab. The coil specifications are 220 V, 50 Hz. Here the
contactors are operated through push buttons.
APPARATUS
Power Supply Module
3ϕ induction Motor
AC Ammeter (0-10A)
AC Voltmeter (0-1000V)
Wattmeter 2KW
Contactors 16A, 415V (230V, 50 Hz coil)

18
PROCEDURE
CAUTION! – High voltages are present in this Experiment. DO NOT make any
connections with the power supply ON. Get in the habit of turning OFF the power
supply after every measurement.
1) MOTOR SPECIFICATIONS
1. Refer to the nameplate of the 3ϕ induction motor and list the rated voltage, the rated current,
the power and frequency.
Rated Voltage Rated
Current
Power Rated speed Rated
Torque
Starting
Torque
Frequency
2) DIRECT ON LINE STARTER
1) Make the connection as shown in Figure 3.
2) Connect the motor in Delta and switch ON the DOL starter and instantly note down the initial
current.
3) When motor attain the rated speed note down the voltage, current and speed of the motor.
4) Switch OFF the power supply and disconnect the motor.
5) Connect the motor in Star and re do the steps b-d.
Figure 3: Connection Diagram for DOL starter.
When starting in the star connection, the star contactor first of all connects the winding ends
U2, V2, W2. Then the main contactor applies the mains voltage (ULN) to the winding ends U1, V1,
W1. After the set starting time has timed out, the timing relay switches off the star contactor, and the
delta contactor connects terminals U2, V2 and W2 to the mains voltage.

19
Figure: Motor terminal for star delta connections.
Voltage Starting
Current
No Load
Current
Speed Slip
Delta
Star
3) FORWARD / REVERSE OPERATION
When a squirrel-cage rotor is placed inside a rotating magnetic field, it is pulled around in the
same direction as the rotating field. Interchanging the power connections to two of the stator
windings (interchanging A with B for example) interchanges two of the three currents and reverses
the phase sequence. This causes the rotating field to reverse direction. As a result, the direction of
rotation of the motor is also reversed. The power diagram for reversing the direction of rotation of
the motor and the associated control circuits are shown in Fig. 4.
1. Using two push buttons, build the circuit that controlling the direction of rotation of the three
phase induction motor.
2. Draw the electrical diagram of your circuit.

20
Figure 4: Reversing direction of rotation of a three phase induction motor, Power diagram
4) DELTA - STAR STARTER
1. Make the connections as shown in the circuit diagram.
2. Set the timer at suitable value.
3. Check the three phase supply at the voltmeter.
4. Check the sequence of the operations of the contactors after switching the start button.
5. Record the no-load current at starting and at rated speed.

21
Figure 5: Power diagram for star-delta starter,

22
EXPERIMENT 3: THREE PHASE INDUCTION MOTOR, PART 2: NO LOAD,
BLOCKED ROTOR & LOAD TESTS
OBJECTIVES
To draw the circle diagram of a 3-phase squirrel cage Induction motor.
To conduct the direct load test on a 3 phase induction motor and to determine and plot its
performance characteristics.
THEORY
Performance of three phase induction motor is determined by indirect tests including the no
load and the blocked rotor test .From these tests one can find the equivalent circuit parameters of the
induction motor.
EQUIVALENT CIRCUIT
The per phase equivalent circuit of Induction Motor is given in Figure 1, it serves as an
approximate circuit model for one phase of the induction motor.
Figure 1. Per phase Equivalent Circuit of Induction Motor
Where:
The University of Jordan
School of Engineering
Mechatronics Engineering Department
Actuators Lab

23
V1 = line-to-neutral terminal voltage. The phase windings are considered to be in a Y
configuration.
R1 = stator resistance per phase.
X1 = stator leakage reactance per phase.
R2 = per phase rotor resistance referred to the stator.
X2 = per phase rotor leakage reactance referred to the stator.
Xm = a shunt reactance supplied to provide a path for the magnetizing component of the
current flowing in the stator which produces the revolving field in the motor.
In this model it is assumed that R2 is constant. However, in most general purpose motors, R2
varies with the frequency of the rotor currents and it is also affected by the change on temperature. In
addition to that, the equivalent circuit model does not account for core losses and rotational losses.
Omitting core losses causes small but negligible errors. The mechanical power and torque calculated
using the equivalent circuit are the generated values. Rotational losses may be subtracted to obtain
actual output values.
DC RESISTANCE TEST
This test aims to calculate stator resistance by connecting two terminals of the induction motor
to a DC, ammeter and a load box that is used to limit the current through the motor, its resistance is
adjusted to bring the current to roughly the rated value, and the voltage across the two terminals of the
motor is measured.
Then
1
1
2
DCDC
DC
VR R
I
Since V1 (Figure 1) is DC, X1 = Xm = 0, and the rotor impedance is not coupled to the stator.
NO LOAD TEST
In this test, rated voltages are applied to the stator terminals at the rated frequency with the
rotor uncoupled from any mechanical load. Current, voltage and power are measured at the motor
input. The losses in the no-load test are those due to core losses, winding losses, wind age and friction.
Since the slip is nearly zero, R2/s is very large and thus the outer branch of the equivalent circuit can
be considered open circuited. This assumption can be employed for calculations. We have, then,
24
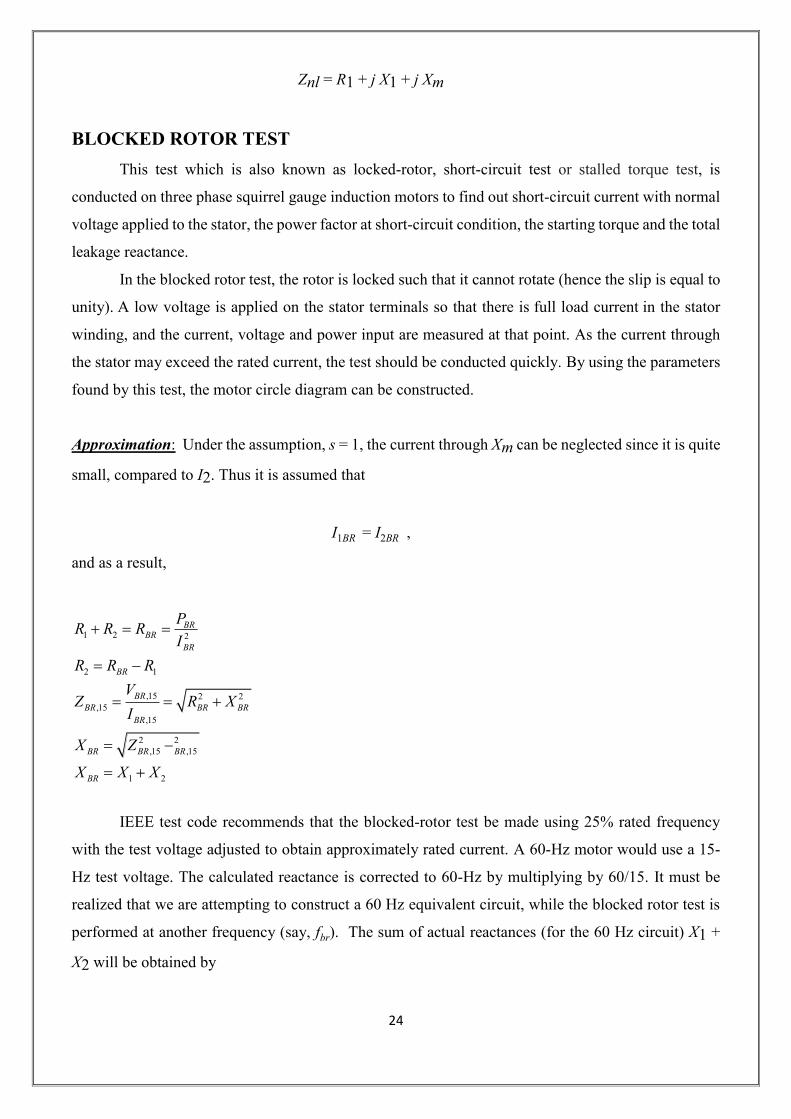
Znl = R1 + j X1 + j Xm
BLOCKED ROTOR TEST
This test which is also known as locked-rotor, short-circuit test or stalled torque test, is
conducted on three phase squirrel gauge induction motors to find out short-circuit current with normal
voltage applied to the stator, the power factor at short-circuit condition, the starting torque and the total
leakage reactance.
In the blocked rotor test, the rotor is locked such that it cannot rotate (hence the slip is equal to
unity). A low voltage is applied on the stator terminals so that there is full load current in the stator
winding, and the current, voltage and power input are measured at that point. As the current through
the stator may exceed the rated current, the test should be conducted quickly. By using the parameters
found by this test, the motor circle diagram can be constructed.
Approximation: Under the assumption, s = 1, the current through Xm can be neglected since it is quite
small, compared to I2. Thus it is assumed that
I1BR = I2BR ,
and as a result,
1 2 2
2 1
,15 2 2
,15
,15
2 2
,15 ,15
1 2
BRBR
BR
BR
BR
BR BR BR
BR
BR BR BR
BR
PR R R
I
R R R
VZ R X
I
X Z
X X X
IEEE test code recommends that the blocked-rotor test be made using 25% rated frequency
with the test voltage adjusted to obtain approximately rated current. A 60-Hz motor would use a 15-
Hz test voltage. The calculated reactance is corrected to 60-Hz by multiplying by 60/15. It must be
realized that we are attempting to construct a 60 Hz equivalent circuit, while the blocked rotor test is
performed at another frequency (say, fbr). The sum of actual reactances (for the 60 Hz circuit) X1 +
X2 will be obtained by

25
x1 x2
xbr
60
fbr
Speed = ns (1 - s) , where:
Ns = 120 f / p, rpm., and p is the number of poles.
Pg = Rotor Power Input = 2 2
23R
Is
(W)
Developed Mechanical Power = 2 2
23 (1 )R
I ss
(W)
Stator Copper Loss = 2
13 I R (W)
Power Factor (PF)= cos I1
Input Power Pin = 3|V1| |I1| (PF) (W)
Efficiency = Pout
Pin
LOAD TEST
By conducting the load test on induction motor, the performance of the motor can be studied
by finding out various quantities including torque, slip, efficiency, power factor etc. at different loading
conditions. In this test supply voltage is applied to motor and variable mechanical load is applied to
the shaft of motor. Mechanical load can be provided by means of mechanical brakes or DC generators.
The input current, input voltage, input power and speed of motor are observed from the experiment
and various performance quantities are calculated.
APPARATUS
Power Supply Module
3ϕ induction Motor
AC Ammeter (0-10A)
AC Voltmeter (0-1000V)
Wattmeter 2KW
Break
PROCEDURE
CAUTION! – High voltages are present in this Experiment. DO NOT make any
connections with the power supply ON. Get in the habit of turning OFF the power
supply after every measurement.

26
1) MOTOR SPECIFICATIONS
1. Refer to the name plate of the 3ϕ induction motor and list the rated voltage, the rated current,
the power and frequency.
Rated Voltage Rated
Current
Power Rated speed Rated
Torque
Starting
Torque
Frequency
2) DC TEST
1. Connect any two stator terminals of the induction motor to the two leads from the DC
supply as shown Figure 2.
2. Bring the DC current through the two stator phase windings up to approximately the
rated AC value.
3. Read and record Vdc and Idc.
4. Turn off the power at the main power panel, and disconnect the circuit.
Vdc Idc R1
Figure 2. Schematic for DC Stator Resistance Test

27
6. NO LOAD TEST
1. Make sure that the motor is uncoupled from any load.
2. Connect the circuit as shown in Figure 3.
3. Increase the voltage gradually, till the line voltage reaches to the rated value.
4. Read and record the line currents, line voltage, and wattmeter readings.
1) Switch off the power supply.
7. BLOCKED ROTOR TEST
1. Clamp the shaft of the motor as explained by your instructor.
2. Connect the circuit as given as in Figure 3.
3. Increase the voltage gradually, till the line current reaches to the rated value.
4. Read and record the line currents, line voltage, and wattmeter readings.
5. Switch off the power supply.
Vnl Inl Pnl
6. Determine the impedances (resistances and inductances) of the equivalent circuit model using
the DC test, Blocked Rotor test, and No-Load test data.
7. Draw the circle diagram of the motor.

28
Figure 3: Experimental set-up for performing no load
and blocked rotor test of induction motor.
8. LOAD TEST
1. Connect the circuit as given as in Figure 3.
2. Adjust the auto transformer to get the rated voltage.
3. A set of no load readings are noted down.
4. Apply the load gradually and note down ammeter, voltmeter and wattmeter readings
simultaneously, care should be taken that load current should not exceed the rated current.
Figure 4: Experimental set-up for performing Load Test.

29
Input Voltage Input Current Input Power Load Torque Speed
From the results above fill the table below:
Input Power Output Power Power Factor Slip% Efficiency
5. Draw the following curves of 3-phase squirrel gauge induction motor
Output Power vs Efficiency
Output Power vs Torque
Output Power vs Speed
Output Power vs % slip
6. Explain the nature of above curve mathematically.
Figure 5: Typical performance curves for the three phase induction motor.

30
EXPERIMENT 4: SEPARATELY EXCITED DC MOTOR
OBJECTIVES
This experiment allows you to understand the principle of operation of the dc motor. You will
plot the speed torque curves for a separately excited dc motor.
MEASUREMENTS
Using the ohmmeter, measure the resistance of the armature of the dc motor (between terminals A1
and B2).
Ra=……………………… ohms
Measure the resistance of the shunt field (E1 and E2) and record it.
Measure the resistance of the series field (D1 and D2) and record it.
Comment on these results.
CONNECTIONS
The dc motor will be mechanically coupled to the dc power brake. The brake will be used to load the
motor and hence allow the speed to vary.
Figure 1: Wiring diagram of the dc motor.
The University of Jordan
School of Engineering
Mechatronics Engineering Department
Actuators Lab

31
1. Connect the dc motor as shown in Figure 1.
2. Apply the rated armature voltage to the armature terminals (A1 and B2): 220 V dc.
3. Apply the rated field voltage to the shunt field terminals (E1 and E2): 175 V dc.
4. Measure the filed current. Measure the armature current.
CAUTION! – High voltages are present in this Experiment. DO NOT make any
connections with the power supply ON. Get in the habit of turning OFF the power
supply after every measurement.
READINGS
Starting with an armature voltage of 220 V dc, fill the following table and then plot the resulting speed-
torque curve. The field excitation voltage must be kept constant at 175 V dc.
Armature voltage: 220 V dc.
# Speed (rpm) Armature current
(Ia)
Torque (Nm) Power Brake
Current
1 0 0
2 3100
3 3000
4 2900
5 2800
Now change the armature voltage to 165 V dc and then vary the load.
Armature voltage: 165 V dc.
# Speed (rpm) Armature current (Ia) Torque (Nm) Power Brake
Current
1 0 0
2 2400
3 2350
4 2300
5 2250
6 2200
7 2150
Now change the armature voltage to 110 V dc and then vary the load.
Armature voltage: 110 V dc.

32
# Speed (rpm) Armature current (Ia) Torque (Nm) Power Brake
Current
1 0 0
2 1550
3 1500
4 1450
5 1400
6 1350
7 1300
Now change the armature voltage to 62.5 V dc and then vary the load.
Armature voltage: 62.5 V dc.
# Speed (rpm) Armature current (Ia) Torque (Nm) Power Brake
Current
1 0 0
2 850
3 800
4 750
REPORT
1. Plot the speed torque curves for the dc motor at the four different armature voltages (220 V dc;
165 V dc; 110 V dc; 62.5 V dc).
2. Analyse the performance of the motor, finding K (the constant). Calculate the expected torque
and compare it to the measured values.

33
EXPERIMENT 5: SPEED TORQUE CURVES FOR DIFFERENT DC MOTORS
INTRODUCTION
In this experiment you further explore the characteristics of other types of dc motor. You will
plot the speed torque curves for the following arrangements:
1. Separately excited DC motor.
2. Cumulatively compound DC motor.
3. Differentially compound DC motor.
4. Series DC motor.
MEASUREMENTS
Using the ohmmeter, measure the resistance of the armature of the dc motor (between terminals A1
and B2).
Ra=……………………… ohms
Measure the resistance of the shunt field (E1 and E2) and record it.
Measure the resistance of the series field (D1 and D2) and record it.
Comment on these results.
CONNECTIONS AND READINGS
The dc motor will be mechanically coupled to the dc power brake. The brake will be used to
load the motor and hence allow the speed to vary.
Connect the dc motor as shown below.
CAUTION! – High voltages are present in this Experiment. DO NOT make any
connections with the power supply ON. Get in the habit of turning OFF the power
supply after every measurement.
The University of Jordan
School of Engineering
Mechatronics Engineering Department
Actuators Lab

34
Figure 2: Wiring diagram of the dc motor.
1) SEPARATELY EXCITED CONNECTION
Connection the motor as shown in Figure 1. Apply the rated armature voltage to the armature
terminals (A1 and B2): 220 V dc. Apply the rated field voltage to the shunt field terminals (E1 and
E2): 175 V dc. Measure the field current. Measure the armature current. Fill in the table below.
Separately Excited Connection: Va=220 V (dc); Vf= 175 V (dc)
# Speed (rpm) Armature current (Ia) Torque (Nm) Powder Brake Current
1 0 0
2 0.5
3 1.0
4 1.5
5 2.0
6 2.5
7 3.0
8 3.5
N.B.: The rated torque of the motor is 3.4 Nm. So it is not advisable to exceed a torque of 3.5 Nm.
2) CUMULATIVELY COMPOUND CONNECTION
Connect the motor as shown in Figure 2. Fill in the table below. By changing the load torque and
measuring the speed and torque.
Cumulatively Compound Connection: Va=220 V (dc); Vf= 175 V (dc)

35
Figure 3: Cumulatively compound connection.
Now fill in the table below by changing the torque settings and recording the armature current and the
speed.
# Speed (rpm) Armature current (Ia) Torque (Nm) Powder Brake Current
1 0 0
2 0.5
3 1.0
4 1.5
5 2.0
6 2.5
7 3.0
8 3.5
3) DIFFERENTIALLY COMPOUND CONNECTION
Connect the motor as shown in Figure 3. Fill in the table below. By changing the load torque and
measuring the speed and torque, fill in the table.

36
Figure 4: Differentially compound connection.
Differentially Compound Connection: Va=220 V (dc); Vf= 175 V (dc)
# Speed (rpm) Armature current (Ia) Torque (Nm) Power Brake Current
1 0 0
2 0.5
3 1.0
4 1.5
5 2.0
6 2.5
7 3.0
8 3.5
4) SERIES CONNECTION
Warning: The series connected motor cannot be run without any load. So you have to be sure that
a load is applied to the motor before starting it. Do this by setting the powder brake current such
that it produces a load torque of 1.5 Nm.
1. Apply the rated armature voltage to the armature terminals (A1 and B2): 220 V dc.
2. Apply the rated field voltage to the shunt field terminals (E1 and E2): 175 V dc.
3. Make sure the connection rotates the motor in the correct marked direction.
4. Measure the field current. Measure the armature current.

37
Series Field Connection: Va=220 V (dc)
# Speed (rpm) Armature current (Ia) Torque (Nm) Power Brake Current
1 0.0
2 0.5
3 1.0
4 1.5
5 2.0
6 2.5
7 3.0
8 3.5
REPORT
1. Read the following sections from Stephen Chapman’s textbook:
“Electric Machinery Fundamentals, 4th edition, Stepen J. Chapman
Section 9.4: Separately Excited and Shunt DC Motors.
Section 9.6: The Series DC Motor
Section 9.7: The Compounded DC Motor.
2. Plot the speed torque curves for the dc motor for the four connections on the same speed torque
curve. Comment on the shape of the four curves.

38
EXPERIMENT 6: PLOTTING THE BH CURVE FOR THE DC MOTOR
INTRODUCTION
In this experiment you will plot the BH curve of the DC motor. The BH curve plotted will be
representative the magnetic circuit of the Shunt field. It will be assumed that the field current (If) is
representative of the magnetomotive force (mmf) and the back-emf is representative of the magnetic
flux.
CONNECTIONS
The dc motor will be mechanically coupled to a three phase squirrel cage induction motor. The three
phase squirrel cage induction motor will act as a prime mover. The dc motor will operate as a dc
generator.
1. Connect the squirrel cage induction motor (SCIM) as shown below in a delta connection.
Figure 5: Wiring diagram of the SCIM and the dc motor.
The University of Jordan
School of Engineering
Mechatronics Engineering Department
Actuators Lab

39
CAUTION! – High voltages are present in this Experiment. DO NOT make any
connections with the power supply ON. Get in the habit of turning OFF the power
supply after every measurement.
2. Keep the armature terminals open. Connect a dc voltmeter to measure Ea.
3. Apply the rated field voltage to the shunt field terminals (E1 and E2): This voltage will be
varied from 0 V to 175 V dc (maximum).
4. Measure the field current. Measure the back emf from the armature terminals (A1 and B2).
Up direction (increasing field current).
# Shunt Field Voltage (V) Field Current (A) Back EMF (V), Ea
1 0 (open circuit)
2 25 V
3 50 V
4 75 V
5 100 V
6 125 V
7 150 V
8 175 V
Now carry out the same measurement but moving in the down direction.
Down direction (decreasing field current).
# Shunt Field Voltage (V) Field Current (A) Back EMF (V), Ea
1 175 V
2 150 V
3 125 V
4 100 V
5 75 V
6 50 V
7 25 V
8 0 (open circuit)
REPORT
1. Plot the BH curve in both increasing and decreasing modes.
2. Comment on the resulting curve.

40
EXPERIMENT 7: SYNCHRONOUS MOTOR
INTRODUCTION
This experiment will help you understand the tests carried out on a synchronous motor in order
to find its parameters, as well as the characteristics and behaviour of the synchronous motor.
PREPARATION
In order to prepare for this experiment, you need to prepare by reading and revising the concepts
contained in the following sections of the textbook:
“Electric Machinery and Fundamentals” by Stephen J. Chapman, 4th Edition, McGraw Hill
Sections:
Section 5.7: Measuring the Synchronous Generator Operating Parameters.
Section 6.2: Synchronous Motor Steady State Operation.
Section 6.3: Starting Synchronous Motors
MEASUREMENTS
Using the ohmmeter, measure the resistance of the armature between terminals U2 and U1 (or V2 and
V1 or W2 and W1). Alternatively use a dc source and a measure the dc current flowing in it..
Ra=……………………… ohms
Measure the resistance of the field circuit (F1 and F2).
Comment on these results.
CAUTION! – High voltages are present in this Experiment. DO NOT make any
connections with the power supply ON. Get in the habit of turning OFF the power
supply after every measurement.
The University of Jordan
School of Engineering
Mechatronics Engineering Department
Actuators Lab

41
1) OPEN CIRCUIT CHARACTERISTICS
1. Connect the Synchronous machine as shown below.
Figure 6: Wiring diagram to plot the Open Circuit Characteristics (OCC) curve.
2. Connect the circuit as shown above in Figure 1. Now vary the field excitation voltage and
record the output generated voltage (Ea).
# Field Voltage (V dc) Field Current (A dc) Output Phase Voltage (V ac)
1 25 V
2 50 V
3 75 V
4 100 V
5 125 V
6 150 V
7 175 V
8 190 V
3. Plot the measured voltage Ea against the field current and comment on the resulting curve.
2) Finding the Value of the Synchronous Reactance (Xs) using the Short Circuit
Characteristic (SCC)
Connect the Synchronous Machine as shown below. Now starting with zero field current, put
the switch in position 1, make a slight increase in the value of the filed current, measure the open
circuit voltage with the switch in position 1. Then move the switch to position 2 and measure the short
circuit current. Repeat this process for increasing values of field current, but without exceeding the
value of the rated armature current.

42
Figure 7: Wiring diagram to find the value of the Synchronous Reactance (Xs).
The value of the Synchronous Reactance is equal to the ratio of the Open Circuit Voltage to the Short
Circuit Current.
Synchronous Reactance Xs =…………………………….ohms
1) Effect of Load Changes on the Synchronous Motor and the Phasor Diagrams
The final step is to analyse the effect of load changes on the synchronous motor. Connect the
synchronous motor and its field circuit as shown below in Figure 3.
43
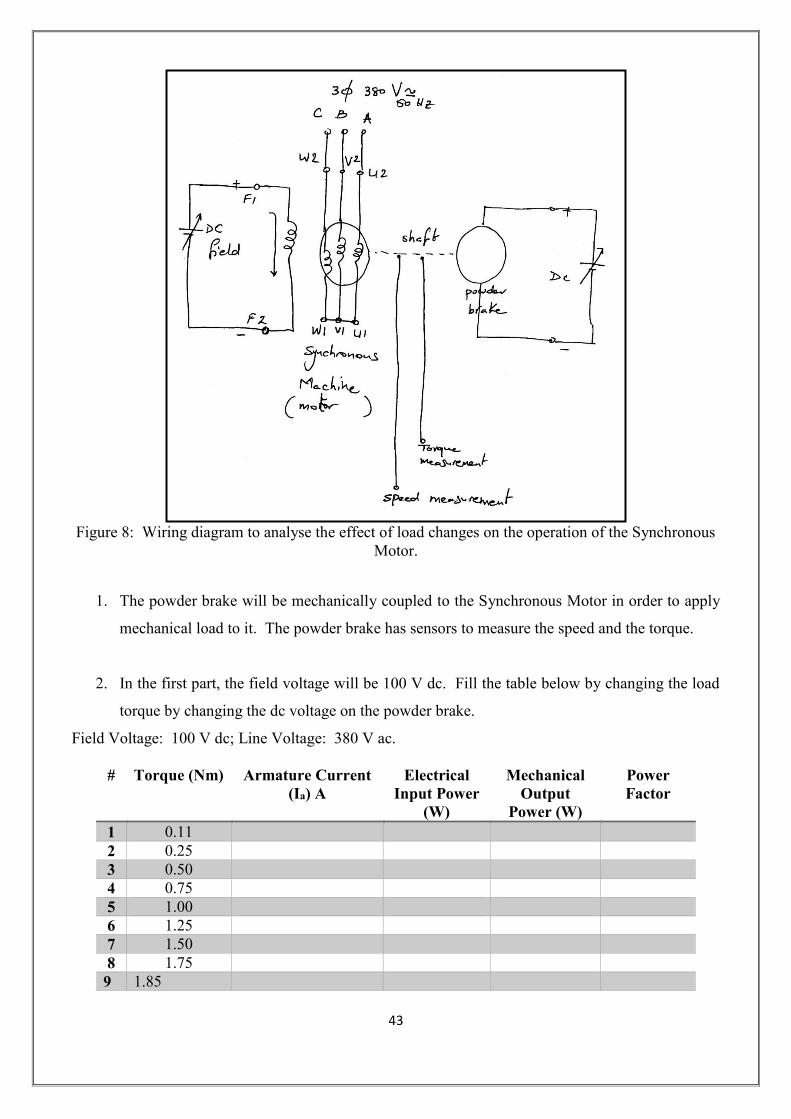
Figure 8: Wiring diagram to analyse the effect of load changes on the operation of the Synchronous
Motor.
1. The powder brake will be mechanically coupled to the Synchronous Motor in order to apply
mechanical load to it. The powder brake has sensors to measure the speed and the torque.
2. In the first part, the field voltage will be 100 V dc. Fill the table below by changing the load
torque by changing the dc voltage on the powder brake.
Field Voltage: 100 V dc; Line Voltage: 380 V ac.
# Torque (Nm) Armature Current
(Ia) A
Electrical
Input Power
(W)
Mechanical
Output
Power (W)
Power
Factor
1 0.11
2 0.25
3 0.50
4 0.75
5 1.00
6 1.25
7 1.50
8 1.75
9 1.85

44
Now change the field voltage to 190 V dc and repeat the tests.
Field Voltage: 190 V dc; line voltage: 380 V ac.
# Torque
(Nm)
Armature Current
(Ia) A
Electrical
Input Power
(W)
Mechanical
Output
Power (W)
Power
Factor
1 0.11
2 0.25
3 0.50
4 0.75
5 1.00
6 1.25
7 1.50
8 1.75
9 2.00
10 2.25
11 2.50
12 2.75
13 3.00
14 3.25
3. For each of the two tables above, find the value of Ea.
4. Then plot the phasor diagrams that represent Ia, Ea, and the power factor angle for every load
condition (an example of such a phasor diagram can be found in Figure 6-6 from Stephen
J. Chapman textbook, 4th Edition). Notice how the power factor starts leading, then becomes
unity and then changes to lagging.
REPORT
In addition to the items that you have been asked to do within this sheet, do the additional
following items:
1. Plot the different curves and comment on them.
2. Calculate the Pull-Out Torque.


