Active Mode Demand and Economic Assessment: Report
76
Westhaven to Akoranga Active Mode Demand and Economic Assessment: Report August 2021
Transcript of Active Mode Demand and Economic Assessment: Report

Westhaven to Akoranga
Active Mode Demand and
Economic Assessment:
Report
August 2021

Project: Westhaven to Akoranga
Title: Active Mode Demand and Economic Assessment
Document Reference: P:\NZTA\195 Westhaven to Akoranga Economics Update\4.0
Reporting\R1D210806 Westhaven to Akoranga.docx
Prepared by:
Project Manager
Reviewed by:
Revisions:
Date Status Reference Approved by Initials
5 July 2021 Internal Review R1A210705 IC
20 July 2021 Second Draft R1B210720 IC
6 August 2021 Third Draft R1C210806 IC
6 August 2021 Final R1D210806 IC
The drawings, information and data recorded in this document (the information) are the property of Flow Transportation Specialists
Ltd. This document and the information are solely for the use of the authorised recipient and this document may not be used, copied
or reproduced in whole or part for any purpose other than that for which it was supplied by Flow Transportation Specialists Ltd. Flow
Transportation Specialists Ltd makes no representation, undertakes no duty and accepts no responsibility to any third party who may
use or rely upon this document or the information.
s 9(2)(a)
s 9(2)(a)
s 9(2)(a)
s 9(2)(a)
s 9(2)(a)
s 9(2)(a)
s 9(2)(a)

Westhaven to Akoranga Active Mode Demand and Economic Assessment i
EXECUTIVE SUMMARY
Flow Transportation Specialists (Flow) has been commissioned by Waka Kotahi the NZ Transport Agency
(Waka Kotahi) to assess the proposed Westhaven to Akoranga section of the Northern Pathway project,
in terms of
the predicted number of people who may use the project
the economic effects of the project based on Waka Kotahi’s procedures
This work follows earlier assessments carried out between 2014 and 2020. Since then, a number of
changes have affected the project’s potential use, and its benefit cost ratio (BCR). The most significant
of those changes include
a growing body of evidence that micro mobility (e-bikes, e-scooters and other motorised personal
transport devices) will have a larger impact on the forecast demand for the project than previously
thought
a revised design for the bridge component of the project, with a new standalone active mode
bridge now proposed that has significantly increased expected costs
updated economic evaluation procedures introduced by Waka Kotahi in 2020, through the new
Monetised Benefits and Costs Manual (MBCM), which has now replaced the former Economic
Evaluation Manual (EEM).
Forecast trips of Westhaven to Akoranga
Table ES1 below summarises the future daily active mode trips we estimate will use the bridge
component of Westhaven to Akoranga. We also compare these forecasts to those previously made in
March 2020, as well as the main reasons for the change.
Table ES1: Annual average daily trips on bridge component of Westhaven to Akoranga
Previous assessment
(2020)
Current assessment
(August 2021) Main reasons for change
Trips by people walking, jogging, on e-scooters or other wheeled pedestrian devices
2028 1,760 1,600 Lower population and employment growth forecasts,
lower tourism expectations 2038 2,060 1,900
Trips by people on bikes and e-bikes
2028 2,690 3,400 As above, but conversely greater impact expected of
e-bikes on travel behaviour 2038 3,190 5,200

Westhaven to Akoranga Active Mode Demand and Economic Assessment ii
Benefit cost ratio (BCR) of Westhaven to Akoranga
Previous BCRs for the Westhaven to Akoranga project have included
a BCR of 1.2 assessed in January 2020, based on discounted benefits of $326 million and
discounted costs of $262 million ($302 million undiscounted, plus maintenance costs)
an interim updated BCR range of 0.4 to 0.6 in June 2021, based on the above discounted benefits
but the increased cost of a new, standalone bridge structure ($713 million undiscounted, plus
maintenance costs).
We have revised the expected benefits of the project in light of our updated demands and Waka Kotahi’s
updated economic procedures. Both the discounted benefits and costs are summarised in Table ES2,
comparing these to the figures from the January 2020 evaluation.
Table ES2: Updated economic evaluation, compared to January 2020 evaluation (discounted)
Previous assessment
(January 2020)
Current assessment
(August 2021) Main reasons for change
Discounted benefits $326 million $530 million Set out in Table ES3
Discounted costs $262 million $588 million New bridge structure now proposed
BCR 1.2 0.90
Table ES3 provides further detail on the source of the changes to the project’s expected benefits.
Table ES3: Summary of changes that have affected the updated economic benefits
Approximate
discounted
economic
impact
Main reasons for change
Discount rate + $195 million Waka Kotahi’s MBCM advises the use of a lower annual discount rate
(4%, previously 6% under the EEM)
Cycle demands + $135 million Revised demand estimates that account for growing trend in e-bikes
Evaluation period + $68 million MBCM now allows a 60-year evaluation period for projects with a long
lifespan (previously 40-years, according to the EEM)
Health benefits - $112 million Health benefits from increased physical activity now capped by
MBCM, and a lower benefit rate now applies to micro mobility trips
Long term growth
of benefits - $36 million
Zero growth in both demand and benefits assumed from 2048
(ongoing linear growth previously assumed beyond 2048)
Other - $46 million Other minor changes and the cumulative effects of the above
We have reviewed the most significant assumptions behind the active mode demand estimates and the
economic evaluation and tested the impact of these through a series of sensitivity tests. The resulting
sensitivity test BCRs generally range from 0.8 to 1.0 (with the full range including one test as low as 0.71
and one at 1.06).
Westhaven to Akoranga Active Mode Demand and Economic Assessment iii
CONTENTS 1 BACKGROUND TO THIS STUDY ......................................................................................................... 1
2 CHANGES SINCE THE 2018 AND 2020 ASSESSMENTS ...................................................................... 1
2.1 Changes that have affected the demand estimates .............................................................. 1
Micro mobility .............................................................................................................. 1
Auckland Council’s land use forecasts ......................................................................... 3
Tourism estimates ........................................................................................................ 4
2.2 Changes that have affected the economic evaluation .......................................................... 4
3 REVISED DEMAND ASSESSMENT ...................................................................................................... 6
3.1 Estimated active mode trips on the project ........................................................................... 6
3.2 Estimated cycling mode shares .............................................................................................. 7
4 REVISED ECONOMIC EVALUATION ................................................................................................... 8
4.1 Economic benefits of Westhaven to Akoranga ...................................................................... 8
4.2 Economic costs of Westhaven to Akoranga ........................................................................... 9
4.3 Benefit cost ratio .................................................................................................................... 9
4.4 Sensitivity tests ..................................................................................................................... 10
4.5 Economic evaluation peer review ........................................................................................ 14
APPENDICES APPENDIX A
APPENDIX B
APPENDIX C
APPENDIX D
APPENDIX E
APPENDIX F
PEDESTRIAN DEMAND ESTIMATES
CYCLING DEMAND ESTIMATES
CYCLE TRIP DISTRIBUTION PLOTS
TOURISM ESTIMATES
ECONOMIC EVALUATION METHODOLOGY
ECONOMIC EVALUATION PEER REVIEW

Westhaven to Akoranga Active Mode Demand and Economic Assessment 1
1 BACKGROUND TO THIS STUDY
Flow Transportation Specialists (Flow) has been commissioned by Waka Kotahi the NZ Transport Agency
(Waka Kotahi) to assess the predicted walking and cycling demands on the proposed Westhaven to
Akoranga section of the Northern Pathway project and to carry out an economic evaluation of the
proposed facility. This work follows earlier assessments carried out between 2014 and 2020, and a now
revised design that has significantly increased the project’s construction costs.
Previous active mode demand and economic assessments of the Westhaven to Akoranga project (or
sections of it) have included
An October 2014 assessment of the likely use of the bridge component1
An October 2018 assessment of the likely use and an economic assessment of the landward
component2
A January 2020 assessment of the likely use and an economic assessment of the bridge
component3
A more detailed assessment of the likely use of the bridge and landward components in March
20204
The October 2018 and January 2020 studies were independently peer reviewed by Quality Transport
Planning (QTP) and Ernst & Young, respectively. This included a peer review of the Auckland Cycle Model
which we developed and have used to predict active mode use for several projects in Auckland.
Our evaluation has relied on the processes established by the October 2018 and January 2020 studies,
and has updated each to reflect changes in cycle demand estimation processes and economic evaluation
procedures.
2 CHANGES SINCE THE 2018 AND 2020 ASSESSMENTS
2.1 Changes that have affected the estimates of the number of people using the
facility
Micro mobility
Forecast demands were previously developed in January 2020, with that assessment predicting 1,700
pedestrian trips per day across the proposed bridge in 2026, and 2,800 cycle trips per day (a total of
1 Traffic Design Group. (August 2014). SkyPath Resource Consent – Transportation Assessment Report. 2 Flow Transportation Specialists. (October 2018). SeaPath Shared Path – Demand Assessment and Economic Benefit Evaluation. 3 Flow Transportation Specialists. (January 2020). Cross Harbour Walking and Cycling Connection – Transport Modelling and Economic Evaluation. 4 Flow Transportation Specialists. (March 2020). Northern Pathway Section 1, Westhaven to Akoranga – Walking and Cycling Forecasts and Level of Service Assessment.

Westhaven to Akoranga Active Mode Demand and Economic Assessment 2
4,500 trips per day). These demand estimates were developed assuming there would be no significant
changes in walking or cycling technologies.
Specifically, the cycle demand component was based on outputs from the Auckland Cycle Model (ACM),
calibrated based on observed cycle data from 2016. In the period since, e-bikes have gained in popularity
significantly. Evidence to support this includes
Waka Kotahi’s Research Report 674 “Mode shift to micromobility” (February 2021), which
concluded that if appropriate infrastructure is provided, e-bike trips could account for up to 8% of
all trips within a 5 km radius of Auckland’s city centre, and 5% in more suburban areas of the city
2018 data collected by the University of Auckland5, which observed that 31% of peak period trips
on the Northwestern Cycleway were by e-bike (but only 15% on Tamaki Drive, which did not have
safe cycle infrastructure at that time)
Waka Kotahi’s research6 indicating that 11% of bikes sold in New Zealand in 2019 were e-bikes
Data collected by Auckland Transport7 indicating that in 2020, 25% of regular bike riders in
Auckland used e-bikes
Most micro-mobility hire companies that have launched in Auckland in recent years have e-bikes
and e-scooters, rather than pedal bikes/scooters.
The evidence points to a rapidly increasing rate of e-bike ownership and use, from near-zero in 2016
when the ACM was calibrated, to the observed rates above. E-bikes are also particularly suited for longer
distance trips on the strategic cycle network, such as on Westhaven to Akoranga. Reflecting this, we
have made the following assumptions in updating our demand assessment
40% of cycle trips in Auckland will be by e-bike in 2028
60% of cycle trips in Auckland will be by e-bike in 2038
Waka Kotahi’s Research Report 674 reviewed both New Zealand and international literature to consider
the effect of e-bikes on trip lengths. Waka Kotahi’s conclusion was that e-bikes enable trip lengths two
to three times longer than traditional pedal bikes. We have taken the low end of this range, and assumed
that e-bikes enable trips that are double (two times) the length of traditional pedal bike trips.
Similar trends have been observed for e-scooters and other ‘wheeled pedestrian modes’, however there
is less data available to support this. Data collected by Flow on Tamaki Drive in 2018 found that
approximately 20% of pedestrian trips on this route during the peak periods were by ‘wheeled
pedestrians’. Waka Kotahi’s Research Report 674 concluded that given appropriate infrastructure, e-
scooters could account for 1% to 3% of all trips outside of Auckland’s city centre (and approximately
double that within the city centre).
Research Report 674 also concluded that average e-scooter trip lengths were in the order of 1 to 2 km,
based on data from dockless shared e-scooter providers. This is too short a distance to have an impact
5 Wild, K. & Woodward, A. (2018). Electric city: E-bikes and the future of cycling in New Zealand. University of Auckland Medical and Health Sciences 6 7 TRA for Auckland Transport. (June 2021). Measuring and growing active modes of transport in Auckland
Westhaven to Akoranga Active Mode Demand and Economic Assessment 3
on Westhaven to Akoranga. This conclusion conflicts however with anecdotal evidence of commuters
using privately owned e-scooters to commute significantly longer distances.
Given the uncertainty around e-scooters, we have not made any adjustments to our pedestrian demand
estimates on the bridge component of Westhaven to Akoranga. However, we have assumed that an
increasing proportion of pedestrian trips on the project would be by wheeled pedestrian devices, with
the following assumptions being applied in the evaluation:
40% of pedestrian trips on the facility will be by e-scooter (or other wheeled pedestrian device) in
2028
60% of pedestrian trips on the facility will be by e-scooter (or other wheeled pedestrian device) in
2038
This assumption has affected the economic assessment of pedestrian health benefits (refer Section 2.2),
and also affected the proportion of pedestrian trips across the proposed bridge assumed to continue
northward on the landward section of the Westhaven to Akoranga.
Auckland Council’s land use forecasts
The ACM was developed based on Auckland Council’s I11.5 land use forecast scenario. In 2020 these
forecasts were replaced by Scenario I11.6, and the updated land use forecasts have generally resulted
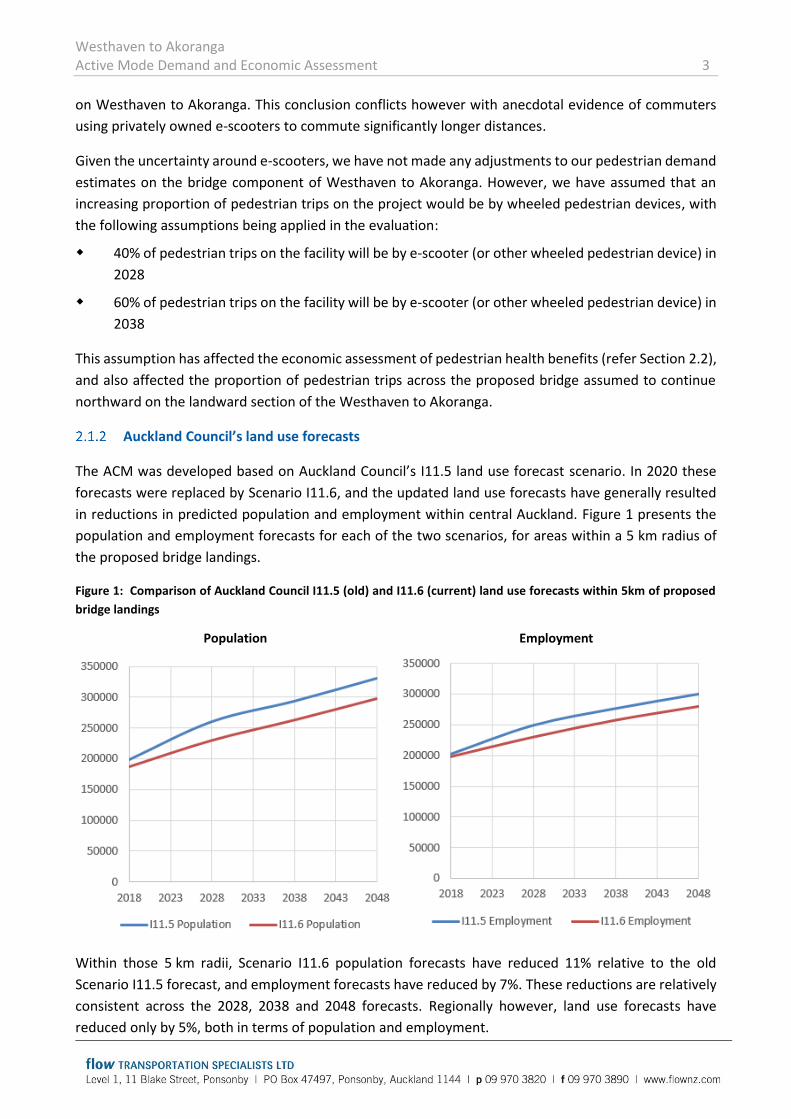
in reductions in predicted population and employment within central Auckland. Figure 1 presents the
population and employment forecasts for each of the two scenarios, for areas within a 5 km radius of
the proposed bridge landings.
Figure 1: Comparison of Auckland Council I11.5 (old) and I11.6 (current) land use forecasts within 5km of proposed
bridge landings
Population Employment
Within those 5 km radii, Scenario I11.6 population forecasts have reduced 11% relative to the old
Scenario I11.5 forecast, and employment forecasts have reduced by 7%. These reductions are relatively
consistent across the 2028, 2038 and 2048 forecasts. Regionally however, land use forecasts have
reduced only by 5%, both in terms of population and employment.

Westhaven to Akoranga Active Mode Demand and Economic Assessment 4
The ACM remains based on the older Scenario I11.5 land use forecasts. While land use forecasts are not
the only factor that affect potential walking and cycling trips, they play a significant part. To reflect the
lower land use forecasts now predicted however, we have factored down forecast demands for the
project by a blanket 5%.
Tourism estimates
The tourism potential of the Westhaven to Akoranga was estimated in the January 2020 assessment.
Since that time, Covid 19 has disrupted international tourism dramatically. There are currently no post-
Covid forecasts for tourism within New Zealand, and it remains unclear how the industry will respond
long term.
Nonetheless, 82% of the tourist trips on Westhaven to Akoranga were estimated to be domestic tourists,
and this market is expected to continue in the future, and might well be greater, if people are limited in
their overseas tourist destinations.
However, we have updated the 2020 tourism estimates by assuming zero growth in tourism (previously
estimated to grow at 1.2% per annum), rather than predict higher local tourism numbers.
2.2 Changes that have affected the economic evaluation
Previous economic assessments that we have carried out for Westhaven to Akoranga (or sections of the
project) have included the following
October 2018
a BCR of 1.2 for the landward section, based on discounted benefits of $72 million and discounted
costs of $61 million ($72 million undiscounted construction costs, plus maintenance costs)
January 2020
a BCR of 1.3 for the bridge component, based on discounted benefits of $254 million and
discounted costs of $201 million ($230 million undiscounted construction costs, plus maintenance
costs)
a BCR of 1.2 for Westhaven to Akoranga overall, based on the sum of the above costs and benefits
June 2021
an interim updated BCR range of 0.4 to 0.6, based on the above discounted benefits but applying
the revised construction cost estimate ($713 million undiscounted construction costs, plus
maintenance costs)
The interim updated BCR released in June 2021 was estimated based on the 2018/2020 benefit
assessments, but applied the revised cost estimate for the new bridge. It did not update the evaluation
to account for other changes that have affected the economic evaluation. These changes include
new economic evaluation procedures, with Waka Kotahi’s Monetised Benefits and Costs Manual
replacing the now superseded Economic Evaluation Manual (EEM) in 2020
new demand estimates, as documented in Section 2.1.

Westhaven to Akoranga Active Mode Demand and Economic Assessment 5
The above changes, and their respective impacts on Westhaven to Akoranga’s discounted benefits, are
summarised in Table 1 below.
Table 1: Summary of changes that have affected the updated economic benefits
Item Change since 2018/2020 assessment
Approximate
impact on
discounted benefits
Discounted benefits from previous assessment $326 million
Discount rate MBCM applies a lower annual discount rate (4%, previously 6%
according to the EEM)
+ $195 million
Cyclist demands New demand estimates account for growing trend in e-bikes
(refer Section 2.1)
+ $135 million
Evaluation period MBCM allows a 60-year evaluation for projects with a long
lifespan (previously 40-years, according to the EEM)
+ $68 million
Cycling health
benefits
MBCM applies a higher health rate for cycling ($2.20 per cycle-
km, previously $1.30 per cycle-km) but a lower rate for e-cycling
($1.00 per e-bike-km, also previously $1.30 per cycle-km).
MBCM also now requires health benefits to be capped.
- $94 million
Long term growth
of benefits
Zero growth in benefits assumed from 2048 (linear growth
previously assumed beyond 2048)
- $36 million
Pedestrian health
benefits
MBCM applies a higher health rate for walking ($4.40 per ped-
km, previously $2.60 per ped-km).
MBCM also now requires health benefits to be capped.
- $19 million E-scooters Increasing proportion of pedestrian trips assumed to be by e-
scooter, or some other micro mobility device. Reduced health
benefits are assumed to apply to this proportion ($1.00 per ped-
km, previously $2.60 per ped-km).
Land use forecasts Current Auckland Council I11.6 land use forecasts predict lower
population and employment growth in central Auckland and the
lower North Shore, relative to previous forecasts
- $16 million
Traffic effects Zero growth in general traffic reduction benefits assumed from
2038. Linear growth previously assumed to 2048.
- $11 million
Other minor changes, and cumulative effects of above changes - $19 million
Discounted benefit for current assessment $530 million

Westhaven to Akoranga Active Mode Demand and Economic Assessment 6
3 REVISED DEMAND ASSESSMENT
3.1 Estimated active mode trips on the project
The following tables present the predicted annual average daily trips on each section of Westhaven to
Akoranga. The trips include utility trips (ie people travelling to a destination, such as to work),
recreational trips and tourist trips.
The methodology we have applied to develop these demand estimates is included in Appendices A to D.
Table 2: Predicted annual average daily trips on Westhaven to Akoranga, 2028
Section
Trips by people
walking, jogging, on
e-scooters or other
wheeled pedestrian
devices
Trips by people on
bikes and e-bikes Total daily trips
Akoranga Drive to Exmouth Road 350 1,450 1,800
Exmouth Road to Stafford Road 350 1,500 1,850
Stafford Road to Sulphur Beach Road 350 1,450 1,800
Sulphur Beach Road to Princes Street 400 1,450 1,850
Waitemata Harbour Bridge 1,600 3,400 5,000
Table 3: Predicted annual average daily trips on Westhaven to Akoranga, 2038
Section
Trips by people
walking, jogging, on
e-scooters or other
wheeled pedestrian
devices
Trips by people on
bikes and e-bikes Total daily trips
Akoranga Drive to Exmouth Road 400 2,900 3,300
Exmouth Road to Stafford Road 400 2,900 3,300
Stafford Road to Sulphur Beach Road 400 2,900 3,300
Sulphur Beach Road to Princes Street 450 2,900 3,350
Waitemata Harbour Bridge 1,900 5,200 7,100
Previous estimates for the bridge section of Westhaven to Akoranga, from the March 2020 assessment,
were
1,750 daily pedestrians in 2028, increasing to 2,050 in 2038. The new forecasts are slightly lower
due to reductions in forecast land use growth, and lower tourism expectations
2,700 daily cyclists in 2028, and 3,200 in 2038. The new forecasts are higher, due to the predicted
impacts of e-bikes.

Westhaven to Akoranga Active Mode Demand and Economic Assessment 7
3.2 Estimated cycling mode shares
The following table presents estimated cycle to work mode shares for the Auckland region, as well as
for the four Auckland Council Local Boards most affected by the proposed project. Forecast mode shares
are compared to existing mode shares, for reference.
Table 4: Estimate commute to work mode shares by bike and e-bike
Area
Existing 2028 predicted 2038 predicted
2016 base
model
2018
census8
Without
project
With
project
Without
project
With
project
Devonport-Takapuna Local Board 2.2% 1.8% 2.4% 2.9% 3.2% 3.9%
Kaipatiki Local Board 0.9% 0.5% 1.5% 2.7% 2.7% 4.3%
Waitemata Local Board 3.2% 2.7% 4.7% 5.0% 7.6% 8.0%
Albert-Eden Local Board 3.3% 2.9% 4.6% 4.7% 5.1% 5.2%
Auckland region 1.3% 1.0% 2.2% 2.3% 3.7% 3.9%
Increases in cycle mode shares between 2018 and 2028 are predicted for the above areas due to
background investment in cycling, including completion of the Auckland Urban Cycleways programme,
the Northcote Safe Routes, and cycling components of the Northern Corridor Improvements. Further
increases are predicted to 2038 due to assumed ongoing investment in cycle infrastructure.
However, the forecast commute to work mode shares by bike fall below the targets set by Te Tāruke-ā-
Tāwhiri: Auckland’s Climate Plan. Those regional targets are
7% bike and e-bike mode share by 2030
9% bike and e-bike mode share by 2050
Similarly, the forecast mode shares fall below the e-bike mode shares predicted by Waka Kotahi’s
Research Report 674, of
8% e-bike mode share for urban areas within 5 km of the city centre
5% e-bike mode share for suburban Auckland locations
These comparisons provide some level of confidence that the model is not predicting unrealistically
inflated cycle mode shares, relative to Te Tāruke-ā-Tāwhiri: Auckland’s Climate Plan, or to previous Waka
Kotahi research. Conversely though, our estimates may be too low for Auckland to achieve the outcomes
anticipated by the Council in the Climate Plan.
Considered from a different perspective, if Auckland was to meet its climate change goals and achieve
the cycling mode share targets set out in Te Tāruke-ā-Tāwhiri: Auckland’s Climate Plan, the cycling
estimates on the facility would be significantly higher.
8 The 2018 census is thought to have underestimated actual bike mode shares, as the wording of the question excluded respondents who cycle to work less than 50% of the time

Westhaven to Akoranga Active Mode Demand and Economic Assessment 8
4 REVISED ECONOMIC EVALUATION
4.1 Economic benefits of Westhaven to Akoranga
The economic evaluation has been carried out in accordance to Waka Kotahi’s Monetised Benefits and
Costs Manual (MBCM).
The following benefit streams have been assessed for the project
health benefits for cyclists – the public health benefits associated with increased physical activity
health benefits for pedestrians – the public health benefits associated with increased physical
activity
emissions benefits – the economic impact of reduced emissions, when some users shift from
driving to walking or cycling
agglomeration benefits – the increased productivity and economic growth from improving
connectivity between the city centre and the North Shore (Takapuna in particular)
perceived travel time benefits for cyclists – travel time savings, weighted by the MBCM’s Relative
Attractiveness scale, which accounts for cyclist perceptions of comfort/time on cycle
infrastructure
general traffic reduction benefits – the travel time and vehicle operating cost benefits to general
traffic that remains on the road network, when some users shift from driving to walking or cycling.
Our assessment of the project has not included safety benefits, as we haven’t considered the alternate
destinations, routes and modes of travel that the people using the facility would otherwise take. The
facility itself will provide a safe route for pedestrians and cyclists, free from conflict with general traffic.
For people using the facility, this portion of their trip will be safer than the route or mode of travel that
they had used previously.
Our base assessment excludes tourism benefits, in accordance with MBCM guidance.
Table 5 presents a summary of the discounted benefits. Further detail of how these have been
developed is included in Appendix E.
Westhaven to Akoranga Active Mode Demand and Economic Assessment 9
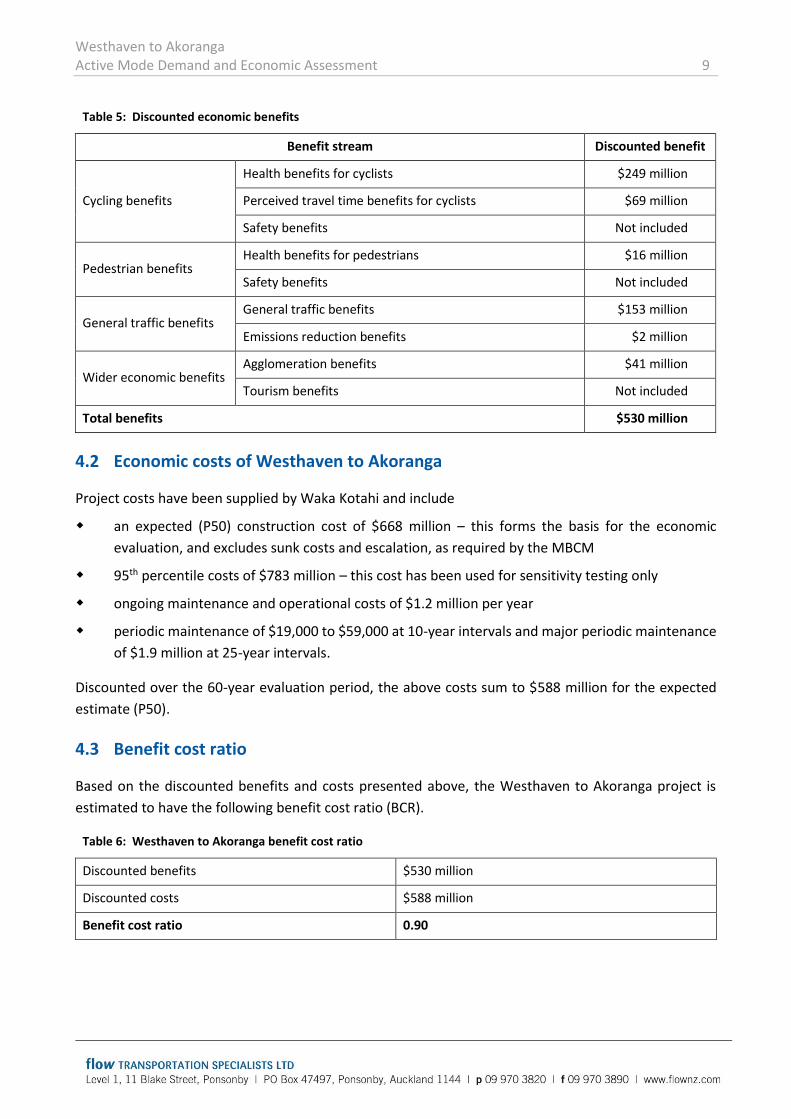
Table 5: Discounted economic benefits
Benefit stream Discounted benefit
Cycling benefits
Health benefits for cyclists $249 million
Perceived travel time benefits for cyclists $69 million
Safety benefits Not included
Pedestrian benefits Health benefits for pedestrians $16 million
Safety benefits Not included
General traffic benefits General traffic benefits $153 million
Emissions reduction benefits $2 million
Wider economic benefits Agglomeration benefits $41 million
Tourism benefits Not included
Total benefits $530 million
4.2 Economic costs of Westhaven to Akoranga
Project costs have been supplied by Waka Kotahi and include
an expected (P50) construction cost of $668 million – this forms the basis for the economic
evaluation, and excludes sunk costs and escalation, as required by the MBCM
95th percentile costs of $783 million – this cost has been used for sensitivity testing only
ongoing maintenance and operational costs of $1.2 million per year
periodic maintenance of $19,000 to $59,000 at 10-year intervals and major periodic maintenance
of $1.9 million at 25-year intervals.
Discounted over the 60-year evaluation period, the above costs sum to $588 million for the expected
estimate (P50).
4.3 Benefit cost ratio
Based on the discounted benefits and costs presented above, the Westhaven to Akoranga project is
estimated to have the following benefit cost ratio (BCR).
Table 6: Westhaven to Akoranga benefit cost ratio
Discounted benefits $530 million
Discounted costs $588 million
Benefit cost ratio 0.90

Westhaven to Akoranga Active Mode Demand and Economic Assessment 10
4.4 Sensitivity tests
The following table documents the main assumptions made in the demand assessment and economic
evaluation. It presents a range of sensitivity tests, based on changes to these assumptions. The
sensitivity test BCRs generally range from 0.8 to 1.0 (with the full range being from 0.71 to 1.06)

Westhaven to Akoranga Active Mode Demand and Economic Assessment 11
Table 7: Benefit cost ratio sensitivity testing
Input Assumption Sensitivity test Sensitivity test BCR
Evaluation
period
60-year evaluation period, permitted by MBCM for long-life infrastructure Standard 40-year period 0.74
Demand
growth
2028 & 2038 forecasts developed. Linear growth assumed up to 2048. All benefits (and
therefore demands) assumed to be capped after 2048.
No cap 0.98
2038 cap 0.83
Micro mobility Increasing e-bike uptake assumed (40% of bike trips in 2028, 60% in 2038) Fewer e-bikes (30% 2028, 40% 2038) 0.88
More e-bikes (50% 2028, 80% 2038) 0.91
Walking and cycling health benefits capped by factoring down by 50% (50% of NZ population
already meets Ministry of Health exercise guidelines)
60% cap (40% of Auckland population
meets MoH guidelines)
0.99
E-scooters assumed to be 40% of pedestrian trips in 2028, 60% in 2038. However, pedestrian
demands have not been adjusted to account for future wheeled pedestrian modes.
E-scooter health benefits assumed to be same as e-bike benefits ($1 per km, no MBCM rate
available).
50% capped as above.
Impacts of lower proportion of e-
scooter trips (30% 2028, 40% 2038)
0.91
Impacts of higher proportion of e-
scooter trips (50% in 2028, 80% in 2038)
0.89
Impact of higher pedestrian demands
due to micro mobility (+20%)
0.91
Land use
forecasts
Demand forecasts based on I11.5 forecasts. The latest I11.6 land use forecasts have been
represented by factoring walking and cycling demands down (-5%)
Lower land use growth (-10% factor
applied)
0.86
Higher land use growth (-5% factor
removed)
0.94
Te Tāruke-ā-
Tāwhiri:
Auckland’s
Climate Plan
Forecast cycling travel to work mode shares are in the order of 2% to 4%, for the Auckland
region. This is significantly lower than the targets set by Te Tāruke-ā-Tāwhiri: Auckland’s
Climate Plan, of 7% by 2030 and 9% by 2050.
Consider impact on the BCR if Auckland
was to meet the cycling mode share
targets of Te Tāruke-ā-Tāwhiri:
Auckland’s Climate Plan.
Not assessed, but
likely to result in a
BCR well above 1

Westhaven to Akoranga Active Mode Demand and Economic Assessment 12
Table 7: Benefit cost ratio sensitivity testing
Input Assumption Sensitivity test Sensitivity test BCR
Wind and
weather
effects
Demand forecasts are annual averages and account for typical seasonal and daily variation on
Auckland cycleways
Effect of high winds closing bridge 20
days per year
0.85
CO2 emissions Economic evaluation includes emissions benefits from car trips directly removed from the
network (direct emissions benefits).
Economic evaluation of traffic benefits includes travel time and operating costs only (excludes
indirect emissions benefits due to reduced congestion)
Including CO2 benefits equal to 4% of
vehicle operating costs, for vehicles that
remain on the network
0.90
General traffic
benefits
Economic evaluation applies $/km benefit rate for car trips removed, obtained from 2026 &
2036 Upper Harbour SATURN models
Apply MBCM default $/km rate (and
zero interpeak benefits)
0.71
Traffic benefits calculated for weekday commuter and interpeak periods only Include weekend peak benefits 0.91
Bus benefits No benefits calculated for trips diverted from public transport, or for deferring upgrades to
the Northern Busway
Noted, but no sensitivity test n/a
Additional
Waitemata
Harbour
Crossing
Economic evaluation caps general traffic benefits after 2038, in response to potential
Additional Waitemata Harbour Crossing
Cap general traffic benefits from 2048 0.96
Cap general traffic benefits from 2028 0.80
Congestion
charging and
other changes
in generalised
costs
Cycle demand modelling assumes no future changes in generalised costs of travel by public
transport or car. In practice, generalised costs may increase due to changes such as congestion
charging, increased parking and public transport costs, or increased fuel costs. In these cases,
cycle demands would be expected to increase. Conversely, generalised costs may decrease
due to improvements in infrastructure such as future light rail to the North Shore. In this
instance, cycle demands may reduce.
Sensitivity test higher demand (+20% by
2048), reflecting higher generalised cost
of travel by car and public transport
1.06
Sensitivity lower higher demand (-20%
by 2048), reflecting higher generalised
cost of travel by car and public
transport
0.74

Westhaven to Akoranga Active Mode Demand and Economic Assessment 13
Table 7: Benefit cost ratio sensitivity testing
Input Assumption Sensitivity test Sensitivity test BCR
Cycle
infrastructure
2028 forecasts assume completion of currently committed projects (Auckland Urban
Cycleways programme)
2038 forecasts assume ongoing background investment in cycle infrastructure (Akoranga to
Constellation, Lake Rd/Esmonde Rd cycleways, Glenfield Rd, Queen St and Victoria St)
Cap demands from 2038 Refer to Demand
Growth sensitivity
test
Agglomeration
benefits
Agglomeration benefits provided by MRC in 2018 report, and factored up to account for new
discount rate and evaluation period
Low agglomeration benefit estimate
from MRC
0.88
High agglomeration benefit estimate
from MRC
0.92
Tourism
benefits
Evaluation excludes tourism benefits, in accordance with the MBCM Include tourism benefits 0.91
Construction
costs
Costs supplied by Waka Kotahi. Evaluation based on expected (P50) cost estimate Apply P95 costs 0.82
Sunk costs excluded, including $4 million in design fees and $21 million in property Include sunk costs 0.87
Escalation excluded (estimated by Waka Kotahi to be 2% per annum) Include cost escalation 0.88

Westhaven to Akoranga Active Mode Demand and Economic Assessment 14
4.5 Economic evaluation peer review
The economic update (August 2021) to the Westhaven to Akoranga project has been independently peer
reviewed. The elements of the evaluation that have specifically been reviewed include
Overview of the previous economic evaluations and peer review documents, specifically that of
the ACM and the demand predictions of the previous assessments
The updated assumptions applied to the August 2021 economic update
The economic worksheets used to translate demand predictions into benefits, according to the
procedures set out in the MBCM
The sensitivity tests completed and the assumptions behind these
We note that the peer review concluded that
“the economic assessment presented to WSP is considered robust
most peer review comments are minor in nature and any points raised are unlikely to change the
benefit cost ratio (BCR) significantly, or pertain to sensitivity testing rather than the base BCR
the economics author, Flow Transportation Specialists, have provided adequate responses to all
peer review comments”
A copy of the peer review document issued by WSP is included at Appendix F.

Westhaven to Akoranga Active Mode Demand and Economic Assessment 15

Westhaven to Akoranga Active Mode Demand and Economic Assessment
APPENDIX A pedestrian demand estimates

Westhaven to Akoranga Active Mode Demand and Economic Assessment 17

Westhaven to Akoranga Active Mode Demand and Economic Assessment 18
The following text has been copied from the January 2020 demand assessment. We note that the
methodology refers to land use forecasts that have now been superseded. The high level comparisons
however remain valid, as do the conclusions drawn from them.
Comparisons with Tamaki Drive
The evaluation draws significantly on the comparisons between the proposed cross harbour facility, and
the existing causeway section of Tamaki Drive. These comparisons are presented below.
Table 8: Auckland Harbour Bridge and Tamaki Drive Comparisons
Tamaki Drive Causeway
(Hobson Point to Judges Bay)
Auckland Harbour Bridge
Location
General
description
1.6 km coastal route across Hobson Bay 1.3 km coastal route across Waitemata
Harbour
Use Popular with utility and recreational cyclists
and pedestrians.
Expected to be popular with utility and
recreational cyclists and pedestrians, as well as
tourists.
Connections City connections:
Harbour side route to city centre, via
Quay Street cycleway
Steep uphill routes to Parnell, via St
Stephens Avenue (pedestrians only) or
via St Georges Bay Road
City connections:
Harbour side route to city centre, via
Westhaven Boardwalk shared use path
Steep uphill route to Ponsonby, via Curran
Street
Eastern connections:
Inland local road route to Orakei, via
Ngapipi Road (and in future via Glen
Innes to Tamaki Drive shared use path)
Coastal route to Eastern Bays, via
Tamaki Drive
Northern connection:
Inland local road route to Northcote, via
Northcote Safe Routes
Coastal route to Takapuna, via proposed
SeaPath shared use path
Key Distances From Hobson Point:
1.4 km to Parnell Baths
2.9 km walk to Parnell via St Stephens
Avenue
From Northern Landing:
1.3 km to southern landing
2.9 km to Wynyard Quarter
3.1 km to Ponsonby (Three Lamps)

Westhaven to Akoranga Active Mode Demand and Economic Assessment 19
Table 8: Auckland Harbour Bridge and Tamaki Drive Comparisons
Tamaki Drive Causeway
(Hobson Point to Judges Bay)
Auckland Harbour Bridge
3.5 km cycle to Parnell via St Georges
Bay Road
3.7 km to City Centre (Queen Street/
Customs Street)
4.4 km to City Centre (Queen Street/
Customs Street)
Adjacent
Land Uses
Very few – Auckland Outboard Boat Club,
minigolf course and pedestrian footbridge
to St Stephens Avenue on southern side
None (harbour both sides)
Residential
catchment
Refer Figure 2
Active Mode
Infrastructure
Two existing shared use paths, both
approximately 2.5 m wide. Generally poor
standard with uneven surface due to tree
roots, low branches, street furniture and
pinch points.
Future two-way separated cycleway
proposed by Auckland Transport.
Proposed shared use path, minimum 4 m
width.
Figure 2 illustrates the existing and forecast 2026 residential populations within 5 km radii of the Hobson
Point landing of Tamaki Drive, and of the northern landing of the Auckland Harbour Bridge. It can be
seen that both the Tamaki Drive causeway and the Auckland Harbour Bridge have very comparable
residential catchments for pedestrian trips (ie within 1 to 2 km). In terms of cycling catchments however
(ie within 5 km), the proposed cross harbour walking and cycling connection would have a residential
catchment approximately double that of the Tamaki Drive causeway.

Westhaven to Akoranga Active Mode Demand and Economic Assessment 20
Figure 2: Tamaki Drive and Northern Auckland Harbour Bridge Residential Catchments
Overall, we consider the existing Tamaki Drive causeway provides a very useful comparison to the
proposed cross harbour walking and cycling connection, with the only significant differentiator being
the residential catchments and gradients.
Estimating pedestrian demands
Given the similarities between the proposed cross harbour walking and cycling connection and the
existing Tamaki Drive causeway, the two facilities are anticipated to operate with comparable pedestrian
demands. Flow carried out manual surveys of pedestrians on Tamaki Drive on Wednesday 14th
November 2018 and on Saturday 17th November 2018. The surveys were carried out immediately east
of the pedestrian footbridge connecting Tamaki Drive to Parnell Baths. The weather was fine on both
occasions, and the following pedestrian volumes were recorded:
245 pedestrians in the weekday morning period (6 to 9 am)
253 pedestrians in the weekday interpeak period (12 to 2 pm)
294 pedestrians in the weekday evening period (4 to 7 pm)
1,210 pedestrians throughout a Saturday (6 am to 7 pm).
Notably, approximately 20% of the surveyed pedestrians were wheeled pedestrians, including electric
scooters.
Automated pedestrian count data from four shared path sites across Auckland9 has been used to factor
the above counts into annual average daily pedestrians, correcting for weather and season. The
resulting estimated 2018 annual average daily pedestrian volume on Tamaki Drive is 1,190 daily
pedestrian trips. The same “existing” pedestrian demand of 1,190 daily pedestrians has been assumed
9 Orewa shared path, Twin Streams shared path Henderson, Mangere Harbour bridge and Waterview Unitec shared path

Westhaven to Akoranga Active Mode Demand and Economic Assessment 21
to apply to a walking and cycling facility across the Auckland Harbour Bridge, if it were available today,
given both facilities have comparable population catchments within 2 km of their northern/eastern
landings, and have comparable connections to the city centre.
The above figure relates to 2018 pedestrians, and this would be expected to grow over time. There are
multiple drivers behind future growth in pedestrian trips across the harbour, including land use changes
and the future cost of travel by other modes. Land use growth has been used as a proxy for pedestrian
demand growth as documented below.
From the land use data presented in Figure 2 previously, very little land use growth is anticipated within
a 2 km radius of the proposed northern landing of the Auckland Harbour Bridge. Significant growth is
forecast however near the southern landing, and Table 9 presents the existing and forecast 2026 land
uses within a 2 km radius of the bridge’s southern landing.
Table 9: Auckland Harbour Bridge Southern Landing Land Use Catchments
Area
Population Employment
2016 2026 Annual
growth
2016 2026 Annual
growth
1 km radius of landing 1,035 1,203 +2% 1,584 1,582 -
2 km radius of landing 7,073 8,851 +2% 26,106 34,598 +3%
A 2% annual growth in pedestrian demands has been assumed to apply, that is:
1,350 daily pedestrian trips are predicted in 2028 (1,190 in 2018 plus 2% annual growth for 10
years, less 5% to account for reduced land use forecasts from Section 2.1.2)
1,600 daily pedestrian trips in 2038 (as above, plus a further 2% annual growth)

Westhaven to Akoranga Active Mode Demand and Economic Assessment
APPENDIX B cycling demand estimates
Westhaven to Akoranga Active Mode Demand and Economic Assessment 23

Westhaven to Akoranga Active Mode Demand and Economic Assessment 24
Utility and Recreational Cyclists
Methodology
The Auckland Cycle Model (ACM) has been used to develop estimates of average weekday peak period
cyclist trips on Westhaven to Akoranga (both utility and recreational trips). The ACM estimates future
cycling demand and
reflects predicted land use (according to Auckland Council’s scenario I11.5 land use forecasts)
reflects cyclists’ route choice – with cyclists generally opting to travel via a slightly longer route if
it provides a higher standard of infrastructure, or less adverse gradients
reflects realistic cycling trip lengths – with longer trips less likely to be undertaken by bicycle
than shorter trips, with a probability distribution applied that is based on the existing Auckland
cycle trip length distribution
reflects realistic cycle trip types – with trip types such as home-to-work and home-to-education
more likely to be undertaken by bicycle than trip types such as trips for employer’s business
reflects anticipated future growth in e-bikes
is responsive to changes in cycle infrastructure (in terms of both demands and trip assignment),
in that high quality cycle infrastructure between any two nodes will result in more trips between
those nodes being undertaken by bicycle, than a scenario with poorer quality cycle
infrastructure
reflects both utility and recreational cyclist components, but not tourist trips.
The ACM is informed by the Auckland Macro Strategic Model (MSM), and its development is
documented more fully in a Model Development Report. The model was independently peer reviewed
by QTP for the purpose of forecasting cross-harbour cycle trips in 2018.
For the economic evaluation of the project, 2028 and 2038 forecast models have been used.
The model represents morning and evening peak period (two hour) cyclist demands for each forecast
year. Estimates of daily cyclist demands have been derived by factoring the morning and evening peak
period forecasts. A factor of 2.3 has been used in this process in order to replicate the off-peak and
weekend profiles currently observed on Tamaki Drive and anticipated to similarly apply to a future cross
harbour walking and cycling connection. We note that lower factors tend to apply to cycle routes that
have a lower proportion of recreational trips, such as the Northwestern Cycleway.
2016 Base Model
A 2016 ACM base has been developed, based on 2016 scenario I9 land use forecasts10. Figure 2 presents
a plot of forecast daily cyclists from the 2016 model.
10 Scenario I9 was the last land use forecast scenario that was modelled by a 2016 regional transport model (ART or the MSM).

Westhaven to Akoranga Active Mode Demand and Economic Assessment 25
Figure 3: 2016 Modelled Daily Cyclist Plot
The ACM is relatively coarse grained, in that it does not include local street links nor the detailed land
uses and accesses that result in cyclist volumes varying along a given section of road. A factor of 2.3 has
been used to calibrate the estimated daily cyclist demands against the 2016 observations. It should be
recognised that applying a network-wide factor as such will result in some demands being under-
estimated on routes that attract a high proportion of off peak and recreational users, such as Tamaki
Drive and Te Wero Bridge. Conversely, demands will be over-estimated on routes with a commuter
focus, such as the Northwestern Cycleway. It is also important to recognise that this approach has
produced differing estimated daily demands relative to those in the Model Development Report, where
route-specific factors were applied to each cycleway.
A comparison of the 2016 model’s outputs was undertaken using historic cycle count data. Counts in
Northcote were manual surveys carried out by Auckland Transport in November 2016 and March 2017,
and average counts are presented where there were multiple count sites and dates. The remaining
counts are annual average counts for 2016 obtained from Auckland Transport’s automatic counters.

Westhaven to Akoranga Active Mode Demand and Economic Assessment 26
Table 10: Comparison of 2016 Model and Count Data
Road Section 2016 Daily
Count
2016 Model
Daily Cyclists Difference
North Shore Count Data
Northcote Road SH1 to Akoranga Road 75 66 -9
Akoranga Road to Lake Road 51 68 +17
Lake Road (Northcote) Northcote Road to Exmouth Road 36 42 +6
Exmouth Road to Onewa Road 24 72 +48
Queen Street North of Belle Vue Avenue 25 55 +30
South of King Street 107 37 -70
Lake Road (Takapuna) South of Eversleigh Road 281 369 +87
City Centre Count Data
Curran Street North of Sarsfield Street 252 132 -120
Te Wero Bridge Te Wero Bridge 550 342 -208
Quay Street Spark Arena 738 755 +17
Tamaki Drive East of Solent Street 1,176 1,032 -144
Lightpath South of Union Street 529 524 -5
Northwestern Cycleway Kingsland 657 774 +117
The 2016 forecast model generally predicts an appropriate quantum of cyclists on each route, given the
following considerations:
the morning and evening commuter peak cycle model outputs were factored to develop the
daily estimates above, as documented previously. The blanket factoring of all routes by the
same factor will have over-estimated daily demands on commuter-oriented routes such as the
Northwestern Cycleway, and under-estimated demands on routes with significant
sports/recreational use such as Tamaki Drive and Te Wero Bridge.
the model underestimates the number of cyclists using Queen Street to access the Northcote
Ferry, and predicts that more cyclists will instead join this ferry service at Birkenhead. The total
number of cyclists estimated to use the Birkenhead/Northcote ferry is 94 per day, and this
agrees with Auckland Transport data from 2013 which provided a figure of 83 daily cyclists. As a
result, the quantum of cyclists predicted to cross the Waitemata Harbour via the
Birkenhead/Northcote ferry is considered appropriate.
Future Scenarios Assessed
The Project has been benchmarked against a future Reference Case that includes all existing cycle
infrastructure, in addition to future infrastructure either currently proposed, or expected to be
implemented in the future. The projects assumed within the future Reference Case for 2028 and 2038
are identified below.

Westhaven to Akoranga Active Mode Demand and Economic Assessment 27
2028 Future Reference Case:
The 2028 future Reference Case includes all existing cycle infrastructure, as well as all future projects
either currently under construction or with committed funding. These include:
completion of the Northcote Safe Routes (a combination of shared use paths and on street cycle
facilities on Northcote Road, Lake Road and Queen Street),
completion of the Auckland Urban Cycleways programme
the Waka Kotahi’s proposed cycle infrastructure included in the Northern Corridor
Improvements project, which include shared paths parallel to SH1 (Oteha Valley Road to
Constellation Drive) and SH18 (SH1 to Albany Highway).
2038 Future Reference Case:
The 2038 future Reference Case includes all infrastructure included in the 2028 Reference Case. It also
includes limited future cycle infrastructure that, while not committed, is considered the ‘bare minimum’
level of ongoing cycle investment over the next 20-year period. This is consistent with the Auckland
Cycling Programme Business Case which proposes significant future investment in cycle infrastructure
across Auckland, but does not yet identify where that investment will be. If no further background
investment was assumed, this would unrealistically limit the long-term connectivity of the proposed
Project. Infrastructure included is:
the Akoranga to Constellation section of the Northern Pathway project
cycling improvements to Lake Road and Esmonde Road, as proposed by Auckland Transport in
2020 but subsequently put on hold
assumed future cycle infrastructure on lower North Shore arterials, including on Glenfield Road,
Birkenhead Avenue and Albany Highway
future cycle infrastructure on Queen Street, Victoria Street, Ponsonby Road, Jervois Road,
College Hill, West End Road and Richmond Road, the latter where not already provided by the
Waitemata Safe Routes project.
Demand Estimates
Approximately 3,200 daily cyclist trips are forecast on the proposed cross harbour walking and cycling
connection in 2028, and 5,000 in 2038. The following figures illustrates the 2028 and 2038 average
annual daily cyclist trips (utility and recreational trips) predicted by the ACM.

Westhaven to Akoranga Active Mode Demand and Economic Assessment 28
Figure 4: 2028 forecast daily cycle trips (utility and recreational trips)
Figure 5: 2038 forecast daily cycle trips (utility and recreational trips)
Appendix D includes plots showing the origins of forecast morning peak trips on the project.

Westhaven to Akoranga Active Mode Demand and Economic Assessment 29
The following table summarises the forecast 2028 daily demand on the proposed facility, as well as on
related infrastructure, both with and without the facility:
Table 11: Summary of forecast 2028 average annual daily cyclists (utility and recreational)
2028 Without Project 2028 With Project
Waitemata Harbour Bridge n/a 3,200
Bridge to Sulphur Beach Road n/a 1,450
Sulphur Beach Road to Stafford Road n/a 1,450
Stafford Road to Exmouth Road n/a 1,500
Exmouth Road to Akoranga Drive n/a 1,450
Queen Street, Northcote 170 1,550
Curran Street, Ponsonby 150 900
Westhaven Drive/Boardwalk 240 2,400
Northcote Ferry 170 0
Bayswater Ferry 80 0
Devonport Ferry 250 100
Upper Harbour Bridge 250 220
Cycling trip lengths
The following section presents the forecast cycling trip lengths from the 2016 base model and 2028
forecast models.

Westhaven to Akoranga Active Mode Demand and Economic Assessment 30
Figure 6: Modelled 2016 and 2028 bike (and e-bike) trip length distributions
The predicted average trip bike lengths include
2016 base model: 5.6 km
2028 without project: 6.1 km
2028 with project: 6.4 km
The average trip length on the project itself in 2028 is predicted to be 11.1 km (and median trip length
10.3 km).
Auckland Comparisons
The 3,200 daily cyclist trips forecast across the proposed cross harbour walking and cycling connection
in 2028 can be benchmarked against existing, historic and forecast daily cyclist volumes on other
significant Auckland cycleways. This comparison is presented below. The historic and existing data is
from Auckland Transport’s automated cycle counters unless otherwise stated, and the forecasts are
from the same ACM scenario that produced the estimated 3,200 trips across the harbour connection.

Westhaven to Akoranga Active Mode Demand and Economic Assessment 31
Table 12: Comparison of demand estimates with other major Auckland cycle routes
Cycleway
2019 11 2028 ACM Forecasts
Average Daily Cyclists Forecast Average
Daily Cyclists
Forecast
Annual Growth
2019-2028
Cross Harbour Connection n/a 3,200 n/a
Tamaki Drive 1,250 12 2,000 9%
Quay Street totem 1,270 1,700 4%
Northwestern Cycleway, Kingsland 1,080 1,950 7%
The above comparisons show that while the forecast 3,200 daily cyclist trips on the proposed cross
harbour walking and cycling connection is high relative to existing counts on Auckland’s major cycle
routes, it is a sensible estimate relative to the future forecasts for these other routes. Understandably
the forecast for Westhaven to Akoranga is higher than the forecasts for Tamaki Drive and the
Northwestern Cycleway, as the proposed facility will be the only cycling connection to the North Shore
other than the Upper Harbour Bridge. By contrast, the Northwestern Cycleway has multiple alternative
parallel corridors, while Tamaki Drive serves a smaller catchment.
The existing Upper Harbour Bridge has not been used as a comparator facility however, as this bridge
serves a significantly smaller catchment than any of the four routes compared above. The Upper
Harbour Bridge is also not considered a realistic alternative to the proposed cross harbour facility, due
to the significant distances involved in routing via the former.
International Comparisons
The 3,200 daily cyclist trips and the 1,350 daily pedestrian trips forecast on the proposed cross harbour
walking and cycling facility in 2028 can also be benchmarked against existing volumes on significant
international bridges. This comparison is presented below.
11 The last complete year of data prior to Covid 19 disruptions to travel patterns 12 2018 data, prior to construction of Tamaki Drive cycleway
Westhaven to Akoranga Active Mode Demand and Economic Assessment 32
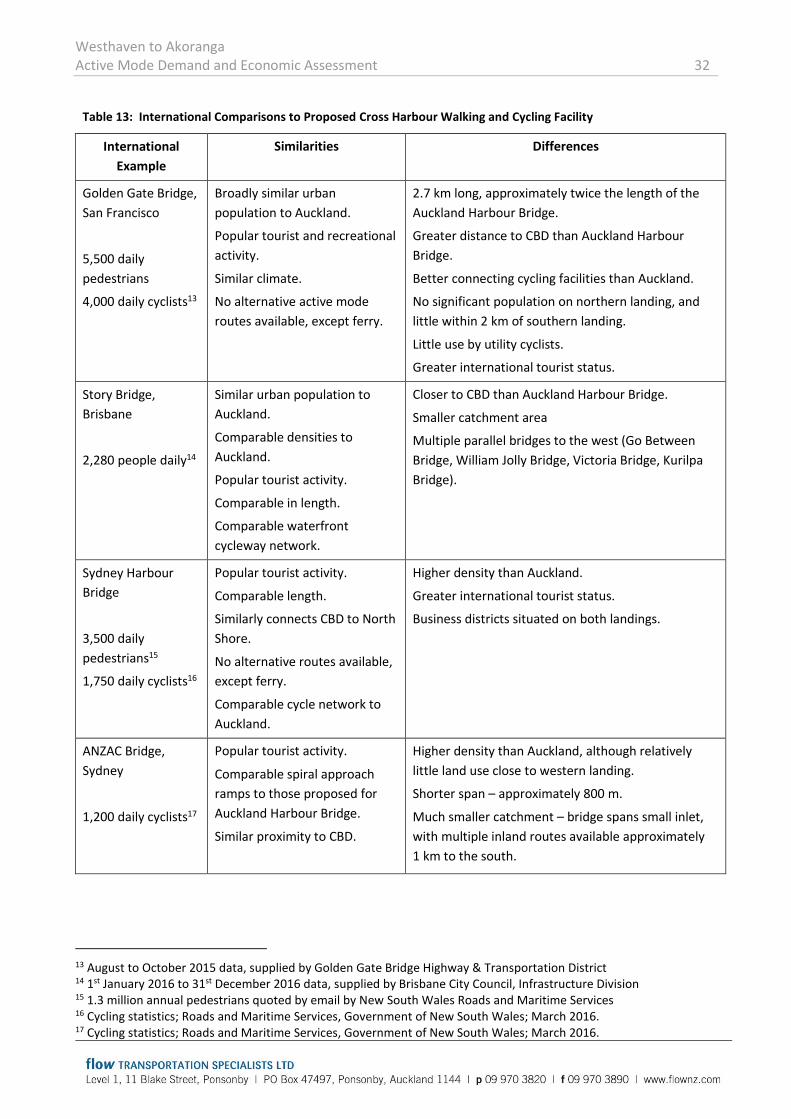
Table 13: International Comparisons to Proposed Cross Harbour Walking and Cycling Facility
International
Example
Similarities Differences
Golden Gate Bridge,
San Francisco
5,500 daily
pedestrians
4,000 daily cyclists13
Broadly similar urban
population to Auckland.
Popular tourist and recreational
activity.
Similar climate.
No alternative active mode
routes available, except ferry.
2.7 km long, approximately twice the length of the
Auckland Harbour Bridge.
Greater distance to CBD than Auckland Harbour
Bridge.
Better connecting cycling facilities than Auckland.
No significant population on northern landing, and
little within 2 km of southern landing.
Little use by utility cyclists.
Greater international tourist status.
Story Bridge,
Brisbane
2,280 people daily14
Similar urban population to
Auckland.
Comparable densities to
Auckland.
Popular tourist activity.
Comparable in length.
Comparable waterfront
cycleway network.
Closer to CBD than Auckland Harbour Bridge.
Smaller catchment area
Multiple parallel bridges to the west (Go Between
Bridge, William Jolly Bridge, Victoria Bridge, Kurilpa
Bridge).
Sydney Harbour
Bridge
3,500 daily
pedestrians15
1,750 daily cyclists16
Popular tourist activity.
Comparable length.
Similarly connects CBD to North
Shore.
No alternative routes available,
except ferry.
Comparable cycle network to
Auckland.
Higher density than Auckland.
Greater international tourist status.
Business districts situated on both landings.
ANZAC Bridge,
Sydney
1,200 daily cyclists17
Popular tourist activity.
Comparable spiral approach
ramps to those proposed for
Auckland Harbour Bridge.
Similar proximity to CBD.
Higher density than Auckland, although relatively
little land use close to western landing.
Shorter span – approximately 800 m.
Much smaller catchment – bridge spans small inlet,
with multiple inland routes available approximately
1 km to the south.
13 August to October 2015 data, supplied by Golden Gate Bridge Highway & Transportation District 14 1st January 2016 to 31st December 2016 data, supplied by Brisbane City Council, Infrastructure Division 15 1.3 million annual pedestrians quoted by email by New South Wales Roads and Maritime Services 16 Cycling statistics; Roads and Maritime Services, Government of New South Wales; March 2016. 17 Cycling statistics; Roads and Maritime Services, Government of New South Wales; March 2016.
Westhaven to Akoranga Active Mode Demand and Economic Assessment 33
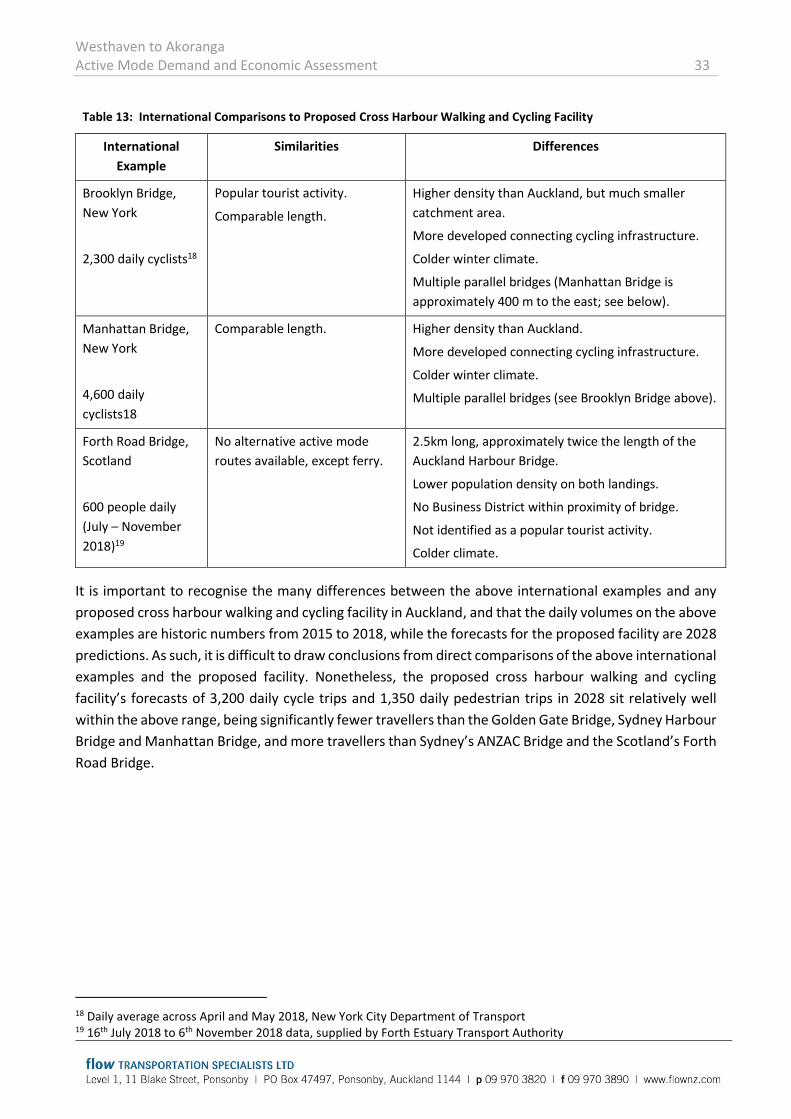
Table 13: International Comparisons to Proposed Cross Harbour Walking and Cycling Facility
International
Example
Similarities Differences
Brooklyn Bridge,
New York
2,300 daily cyclists18
Popular tourist activity.
Comparable length.
Higher density than Auckland, but much smaller
catchment area.
More developed connecting cycling infrastructure.
Colder winter climate.
Multiple parallel bridges (Manhattan Bridge is
approximately 400 m to the east; see below).
Manhattan Bridge,
New York
4,600 daily
cyclists18
Comparable length.
Higher density than Auckland.
More developed connecting cycling infrastructure.
Colder winter climate.
Multiple parallel bridges (see Brooklyn Bridge above).
Forth Road Bridge,
Scotland
600 people daily
(July – November
2018)19
No alternative active mode
routes available, except ferry.
2.5km long, approximately twice the length of the
Auckland Harbour Bridge.
Lower population density on both landings.
No Business District within proximity of bridge.
Not identified as a popular tourist activity.
Colder climate.
It is important to recognise the many differences between the above international examples and any
proposed cross harbour walking and cycling facility in Auckland, and that the daily volumes on the above
examples are historic numbers from 2015 to 2018, while the forecasts for the proposed facility are 2028
predictions. As such, it is difficult to draw conclusions from direct comparisons of the above international
examples and the proposed facility. Nonetheless, the proposed cross harbour walking and cycling
facility’s forecasts of 3,200 daily cycle trips and 1,350 daily pedestrian trips in 2028 sit relatively well
within the above range, being significantly fewer travellers than the Golden Gate Bridge, Sydney Harbour
Bridge and Manhattan Bridge, and more travellers than Sydney’s ANZAC Bridge and the Scotland’s Forth
Road Bridge.
18 Daily average across April and May 2018, New York City Department of Transport 19 16th July 2018 to 6th November 2018 data, supplied by Forth Estuary Transport Authority

Westhaven to Akoranga Active Mode Demand and Economic Assessment 35
APPENDIX C cycle trip distribution plots

Westhaven to Akoranga Active Mode Demand and Economic Assessment 36

Sources: Esri, HERE, Garmin, Intermap, increment P Corp., GEBCO, USGS, FAO, NPS, NRCAN, GeoBase, IGN, Kadaster NL, Ordnance Survey, Esri Japan, METI, Esri China (Hong Kong), (c) OpenStreetMap contributors, and the GIS UserCommunity
Total Trips2 - 5
5 - 10
10 - 20
20 - 30
30 - 40
40 - 50
50 - 60
60 - 70
70 - 80
>80Westhaven to Akoranga Cycle Trip Distribution
2028 AM Cycle Trips
O
Drawn By:
Checked by:
Date:
0 31.5
Kilometers
ST
MJ
05/08/2021

Sources: Esri, HERE, Garmin, Intermap, increment P Corp., GEBCO, USGS, FAO, NPS, NRCAN, GeoBase, IGN, Kadaster NL, Ordnance Survey, Esri Japan, METI, Esri China (Hong Kong), (c) OpenStreetMap contributors, and the GIS UserCommunity
Total Trips2 - 10
10 - 20
20 - 30
30 - 40
40 - 50
50 - 60
60 - 70
70 - 80
80 - 90
90 - 100
>100
Westhaven to Akoranga Cycle Trip Distribution
2038 AM Cycle Trips
O
Drawn By:
Checked by:
Date:
0 31.5
Kilometers
ST
MJ
05/08/2021

Westhaven to Akoranga Active Mode Demand and Economic Assessment
APPENDIX D tourism estimates

Westhaven to Akoranga Active Mode Demand and Economic Assessment 38

Westhaven to Akoranga Active Mode Demand and Economic Assessment
The following text has been copied from the January 2020 demand assessment. In the period since,
the Covid 19 pandemic has significantly disrupted international tourism. Post Covid tourism forecasts
are not yet available however, and in lieu of this, we consider the below assessment to remain valid.
We have however revised our annual growth forecasts (refer post Covid section below).
Demand Estimates
San Francisco’s Golden Gate Bridge provides a useful comparison for a walking and cycling tourist facility
across the Waitemata Harbour. The Golden Gate Bridge connects San Francisco to the small village of
Sausalito. On the southern (San Francisco) side the bridge lands at the base of an extensive public park
(Presidio of San Francisco) and as a result there is very little urban land use within 2 km of the bridge’s
southern landing. Beyond this, the CBD is an approximately 10 km cycle from the southern bridge
landing. To the north, Sausalito has a population of approximately 7,000, and is a 3 to 6 km cycle from
the bridge’s northern abutment.
As a result of this geography, the Golden Gate Bridge connects very few urban land uses within a
walkable or cycle-able distance. Relatively few walking and cycling trips across the bridge are considered
to be utility trips (ie commute to work or education trips), and the bridge is instead used primarily as a
recreational and tourist connection. In August to October 2015, the bridge carried on average 4,000
daily cyclist trips and 5,500 daily pedestrian trips.
Key factors when comparing the tourism potential of a future walking and cycling connection on
Auckland Harbour Bridge and the Golden Gate Bridge include:
Golden Gate Bridge has a significantly higher international profile than the Auckland Harbour
Bridge
San Francisco received 25.1 million tourists20 in 2016, while Auckland received 2.72 million visitor
arrivals21 in the year to March 2018, a ratio of approximately ten-to-one22
San Francisco has a broadly comparable climate and topography to Auckland, similarly amenable
to walking and cycling
San Francisco has a more developed cycle network and bicycle culture than Auckland generally,
but Auckland will have a comparable network within the city centre on completion of the Urban
Cycleways Programme
20 https://www.sftravel.com/article/san-francisco-travel-reports-record-breaking-tourism-2016; retrieved 20 October 2018 21 https://www.stats.govt.nz/news/annual-visitor-arrivals-up-more-than-1-2-million-in-five-years; retrieved 20 October 2018 22 The San Francisco figure includes both domestic and international arrivals, while the Auckland figure includes only international. The latter however also includes international arrivals transiting through Auckland en route to other destinations in New Zealand. As a result, the use of the two figures to form a broad comparison is considered appropriate

Westhaven to Akoranga Active Mode Demand and Economic Assessment 40
The Auckland Harbour Bridge is significantly closer to Auckland’s city centre than the Golden Gate
Bridge is to San Francisco’s city centre, and will be connected by an appealing harbourside route
(the Westhaven Boardwalk)
A proposed cross harbour walking and cycling connection would form part of a cohesive and
continuous waterfront walking and cycling route consisting of SeaPath, the Auckland Harbour
Bridge, the Westhaven Boardwalk, the Wynyard Quarter, Te Wero Bridge, Quay Street and Tamaki
Drive. This presents greater leveraging opportunities for walking and cycling tourism along the
waterfront, relative to the Golden Gate Bridge, which is a more isolated tourist attraction.
An estimate of annual average daily tourist trips on the proposed facility has been developed by the
following process:
Assuming that half of those using the Golden Gate Bridge are tourists, either domestic or
international, with the remainder being local recreational trips
Acknowledging the Auckland Harbour Bridge’s lesser international reputation than the Golden
Gate Bridge, but assuming that this will be offset by:
o The Auckland Harbour Bridge’s better proximity to hotels, international cruise terminal
and tourist facilities in the city centre
o Opportunities presented by Auckland’s more cohesive and continuous waterfront
walking and cycling route
Assuming that tourists visiting the facility are proportional to overall city visitor numbers, with
Auckland broadly receiving 10% of San Francisco’s visitors.
On the basis of the above, the proposed facility is estimated to receive approximately 200 tourist cycle
trips and 275 tourist pedestrian trips per day, averaged across a year. Assuming 50% of those would
make a return trips across the facility, and the remaining 50% would complete only a one-way trip and
return by ferry, this is broadly equivalent to 130 daily tourists on bicycles plus 180 pedestrians, or
approximately 115,000 visitors annually. This estimate can be compared to other Auckland tourist
attractions that include 931,000 visitors to Auckland Museum23, 698,000 visitors to Auckland Zoo24, and
155,000 visitors to the New Zealand Maritime Museum25.
The above estimates are based on existing tourist data however, and must be inflated to account for
growth in tourism to 2026.
This growth has been estimated based on the following:
An estimated 18%/82% split between international and domestic tourists, based on research
carried out by MRCagney26
23 Auckland Museum Annual Review 2017/2018 24 Auckland Council Summary Annual Report 2017/2018 25 NZ Maritime Museum Annual Report; 2015/2016 26 Wider Economic Benefits of a New Walking and Cycling Link Across the Waitemata Harbour; MRCagney; December 2018

Westhaven to Akoranga Active Mode Demand and Economic Assessment 41
Forecast annual growth in international tourists from Auckland Tourism, Events and Economic
Development (ATEED), who estimate that international tourist visitors to Auckland will increase
39% between 2017 and 2023 – a 6.5% annual increase27
Annual growth in domestic tourists based on the forecast New Zealand population of growth of
1.2%28 per annum.
The above growth rates have been applied to the estimated daily trips to arrive at an estimated 230
daily tourist cyclist trips and 320 daily tourist pedestrian trips on the proposed facility in 2026 (550 daily
tourist trips in total). This is broadly equivalent to 150 individual daily tourists by bicycle, plus 210
pedestrian tourists, or 130,000 annual visitors.
Local Comparison
The peer reviewer of this study has recommended investigating other local walking and cycling trails
that may be able to benchmark the estimated tourist trip forecasts for the proposed cross harbour
walking and cycling facility. A useful New Zealand comparison to the proposed cross-harbour walking
and cycling facility is the Queenstown trail. This trail network received an estimated 332,400 annual
users in 2017, with 58% being visitors to Queenstown29. This corresponds to approximately 530 daily
tourist users, averaged across the calendar year. On the surface, this presents a useful comparison to
the 550 daily tourist users estimated to use the proposed cross-harbour walking and cycling facility in
2026.
These tourist daily numbers must be considered against the similarities and differences between the
two facilities and their context:
Visitor numbers: Auckland receives a significantly higher number of tourists than Queenstown,
with 2.72 million recorded at Auckland airport in the year to March 2018 and 272,000 at
Queenstown airport over the same period30. Auckland received a further 211,000 cruise ship
visitors31, although there will be some overlap between Auckland’s airport and cruise ship visitors
Visitor type: Queenstown is generally known as an adventure tourism destination, which differs
from Auckland’s more general tourist visitors. This suggests that visitors to Queenstown may be
more amenable to cycle tourism. The Queenstown Trail however attracts a relatively older profile
of tourists, with 70% of users being over 40 years old32, and 50-60 being the most popular ten-
year age bracket
Facility type: The Queenstown Trail is a network with approximately 120 km of off-road mountain
bike trails. As a result, 75% of the Queenstown Trail’s users are cyclists, with 23% on foot33.
27 Destination Auckland 2025: Supplementary Report; Auckland Tourism, Events and Economic Development 28 Stats NZ median projection to 2028 29 Review of Queenstown Trails – Economic Impacts and User Satisfaction; Queenstown Trails Trust; July 2017 30 https://www.stats.govt.nz/news/annual-visitor-arrivals-up-more-than-1-2-million-in-five-years; retrieved 20 October 2018 31 Cruise ship traveller and expenditure statistics: Year ended June 2018; Statistics New Zealand 32 Review of Queenstown Trails – Economic Impacts and User Satisfaction; Queenstown Trails Trust; July 2017 33 ibid

Westhaven to Akoranga Active Mode Demand and Economic Assessment 42
Auckland’s cross harbour facility would be 2 km long, and part of an approximately 17 km long
waterfront route of paved and sealed cycleways and shared use paths
Climate: Queenstown’s climate features more extreme winter weather events, with snow and
frost likely to reduce tourist use of the Queenstown Trail over winter. Cycle tourist numbers in
Auckland’s winter climate, while warmer and snow free, will be affected by higher rainfall.
It is not practicable to develop estimates of daily tourist users on the proposed cross-harbour walking
and cycling facility based on the 530 average daily tourist users of the Queenstown Trail, given the
differences between these two facilities and their context. However, the latter provides some
confidence that the separately estimated 550 daily tourist users of the proposed cross-harbour walking
and cycling facility is sensible.
Other New Zealand cycle trails, such as the Hauraki Rail Trail and the Central Otago Rail Trail, tend to be
in less accessible locations and provide a less useful comparison to the proposed cross harbour walking
and cycling facility.
Post Covid considerations
In the time since the above, January 2020 assessment, Covid 19 has disrupted international tourism
dramatically. There are currently however no post-Covid forecasts for tourism within New Zealand, and
it remains unclear how the industry will respond long term.
We note that 82% of the tourist trips on Westhaven to Akoranga were estimated to be domestic tourists,
and this market is expected to continue into the future. However, the international tourism market
remains unclear.
We have updated the January 2020 tourism estimates by assuming zero growth in tourism (previously
estimated to grow at 1.2% per annum). Our revised tourism estimates, and the previous estimates, are:
Table 14: Westhaven to Akoranga tourist trips forecast
Previous assessment
(January 2020)
Current assessment
(August 2021)
2026 2046 2028 2038
Trips by people walking, jogging, on e-scooters
or other wheeled pedestrian devices
320 440 275 275
Trips by people on bikes and e-bikes 230 320 200 200

Westhaven to Akoranga Active Mode Demand and Economic Assessment 43
APPENDIX E economic evaluation methodology

Westhaven to Akoranga Active Mode Demand and Economic Assessment 44

Westhaven to Akoranga Active Mode Demand and Economic Assessment 45
General methodology
This section quantifies the transportation economic benefits of the proposed cross harbour walking and
cycling connection; a separate assessment by MR Cagney considers non-transportation benefits of the
project.
The economic evaluation has been based on procedures from Waka Kotahi’s Monetised Benefits and
Costs Manual (MBCM). It has used forecast 2028 and 2038 cycle demands from the Auckland Cycle
Model (ACM), in addition to estimated pedestrian demands. ACM outputs from both the future
Reference Case scenario (ie without project) and Project scenario have been used. Benefits for
intermediate years have been interpolated and extrapolated from the two forecast years.
The project has been assessed with a 60-year evaluation period. While standard economic evaluations
apply a 40-year evaluation period, the MBCM permits a 60-year evaluation in the case of infrastructure
with a long lifespan, “to ensure that the whole-of-life costs and benefits of long-lived infrastructure
activities are captured”. The project’s proposed new Waitemata Harbour Bridge is expected to have a
lifespan far in excess of 60 years, and the longer evaluation period is considered appropriate in this
instance.
The evaluation applies a 5-year construction period beginning in January 2022. During this period, no
benefits accrue. This may be a conservative approach, if the landward section of Westhaven to Akoranga
can be delivered earlier, releasing early benefits.
The economic evaluation has been carried out using the MBCM’s most recent update factors
(1 December 2018), including:
1.57 for travel time benefits
1.04 for walking and cycling benefits
Benefit streams
The following benefit streams have been assessed for the project:
perceived travel time benefits for cyclists – calculated using ACM outputs and applying MBCM
travel time cost rates
health benefits for cyclists – calculated using outputs from the ACM, and applying MBCM health
benefit rates
health benefits for pedestrians – calculated using estimated pedestrian demands, and applying
MBCM health benefit rates
general traffic reduction benefits – calculated using standard economic evaluation procedures to
quantify vehicle travel time, congestion and operating cost benefits, informed by the Northern
Corridor Improvements SATURN models
emissions benefits – the economic impact of reduced emissions, when some users shift from
driving to walking or cycling
agglomeration benefits – provided by MRCagney
Westhaven to Akoranga Active Mode Demand and Economic Assessment 46
Further detail on each of the above benefit streams is provided in the following sections.
Cyclist perceived travel time cost savings
Perceived cyclist travel time cost savings associated with the project have been evaluated, based on
outputs from the ACM. The evaluation has applied the MBCM’s Relative Attractiveness rating to weight
travel time by the perceived cost on each route according to that route’s infrastructure standard. The
travel time costs on each modelled link included in the ACM have been aggregated across the Reference
Case and Project networks, using fixed trip matrices, and compared to determine user cost savings for
existing users. These have then been applied to predicted new users of the facility, using the rule of half.
We have applied average cycle speeds of 17 km/hr across the network, based on the existing average
cycle speed recorded in the NZ Household Travel Survey. An average speed of 25 km/h has been applied
to the project, which will be free of intersection delay.
In 2028 for example:
The ACM predicts cyclists will travel 246,775 daily cyclist-km across the 2028 Reference Case
network. When adjusting this for Relative Attractiveness on each link and the average speed
above, the daily perceived travel time is 9,178 cyclist-hr
With the project, and with fixed Do Minimum cycle demands, the perceived travel time reduces
to 9,081 cyclist-hr, a saving of 97 daily cyclist-hr, shared by the 485 existing daily users that are
predicted to use the project (ie cyclists that divert from ferries or the Upper Harbour Bridge)
A further 3,126 new daily users are predicted to use the facility. To these users, half of the above
perceived travel time cost savings, per user, have been applied. Ie: 97 / 485 x 3,126 x 0.5 = 313
cyclist-hr per day
The total perceived travel time saving is 97 + 313 = 410 cyclist-hr per day
The above 410 daily cyclist-hr has been monetised, by applying a weighted travel time cost of
$7.35/hour34, the relevant MBCM update factor of 1.57, and multiplying by 365 days per year: 410
x $7.35 x 1.57 x 365 = $1,639,645 per year in 2028.
When also applied to the 2038 model outputs and discounted, the net discounted travel time cost
savings are $69 million, or approximately 13% of the overall project benefits.
Health benefits for people on bikes and e-bikes
This benefit stream calculates the health benefits gained from additional cycling activity. Cyclist health
benefits have been calculated for the full length of each new cyclist’s trip. This quantity has been
obtained directly from the model, with the total length of cyclist-km travelled under the Reference Case
and Project scenarios compared, and the difference being the total distance of new cyclist-km trips.
The MBCM applies cycling health rates of
34 $7.80/hr for cycle commuting purposes and $6.90 for other cycling purposes, applying a 50%/50% utility/recreational split

Westhaven to Akoranga Active Mode Demand and Economic Assessment 47
$2.20 per cycle-km, for traditional pedal bicycles
$1.00 per e-bike-km
The economic evaluation has applied a composite value of the above, based on the following estimated
e-bike proportions
40% of bike trips estimated to be by e-bike (or similar device) by 2028
60% of bike trips estimated to be by e-bike (or similar device) by 2038
This benefit stream has been calculated for utility and recreational cyclists using the proposed facility
forecast by the ACM, and also for the estimated domestic cycle tourists. Health benefits have not been
calculated for the international tourist trips.
For domestic cycle tourists, the calculation of health benefits has assumed that these users will cycle on
average 3 km – the distance from the Wynyard Quarter to Northcote Point. This is considered
conservative in that while some tourists will only cross the bridge itself and no further (ie 1.3 km), others
will cycle across the proposed facility as part of a much longer waterfront trip (Northcote Point to
Mission Bay for example being 13 km).
The MBCM requires cycling health benefits to be capped, with maximum annual benefits of $2,500 per
year for pedal bike riders. This cap was developed on the basis that 50% of New Zealanders already
achieve Ministry of Health physical exercise guidelines, so this 50% would not gain additional health
benefits from cycling more. The cap is accordingly equal to 50% of the estimated $5,000 benefit of
making an inactive person active. A lower cap of $2,000 per e-bike riders is given by the MBCM.
The above caps are not practical to apply however, as they apply to people, from a public health
perspective. Transport planning generally however deals with trips, and the two (people versus trips) do
necessarily align. In the case of a street with on average 100 daily cycle trips, these may be undertaken
by several hundred individual people, some cycling twice a day and others only very occasionally.
Instead, we have capped the cycling health benefits by simply factoring these down by 50%, reflecting
the 50% of New Zealanders who already meet daily exercise guidelines. We note that this is a potentially
conservative approach, as we understand only 40% of Aucklanders meet these physical activity guideline
(so a higher, 60% cap could be justified).
Discounted over the 60-year evaluation period of the project, this benefit stream equates to $249
million, or approximately 47% of the overall benefits.
Health benefits for pedestrians and wheeled pedestrians
The MBCM also allows health benefits to be calculated for new pedestrian trips, at a rate of $4.40 per
new pedestrian-km travelled. As with the cycling health benefits above, this benefit stream reflects the
health benefit gained by increased walking activity. The MBCM does not however provide a health
benefit rate for wheeled pedestrian trips, such as e-scooter trips. In lieu of this, we have applied the e-
bike health benefit rate of $1.00 per km. We have weighted the two benefit rates assuming 40% of
pedestrian trips will be via wheeled modes in 2028, and 60% in 2038. This assumption is on the basis of
20% of pedestrian trips on Tamaki Drive being via wheeled modes when surveyed in 2018, and the

Westhaven to Akoranga Active Mode Demand and Economic Assessment 48
expectation that access and availability of e-scooters and other wheeled pedestrian devices will increase
over the coming years.
The MBCM also applies a cap to pedestrian benefits, of $1,250 per person per year. We have again
applied this by capping pedestrian health benefits by 50%.
Pedestrian health benefits have been calculated for utility, recreational and domestic tourists, but
excluded for international tourists. The average domestic tourist trip has been assumed to be 1.4 km,
which is the length of the proposed Waitemata Harbour Bridge (ie one one-way trip, or a return trip to
the summit and back).
Not all predicted pedestrian trips on the project are expected to be new trips. Some will be existing
recreational trips that shift from some other route to the new facility. To account for this, we have
assumed that only 50% of utility and recreational pedestrian trips are new. All domestic tourist trips are
assumed to be new trips, that contribute toward health benefits.
In total, discounted pedestrian health benefits (utility, recreational and tourist) are estimated to be
$16 million, or approximately 3% of the overall project benefits.
Safety benefits
Walking and cycling safety benefits typically accrue where new or improved infrastructure reduces the
crash risk for pedestrians or cyclists on a given route, or at a specific location. In the case of the proposed
facility, the existing crash risk for active modes crossing the Waitemata is low, as those people either
travel on ferries, travel via other modes, or don’t travel at all. As a result, safety benefits for the proposed
facility have been assumed to be zero.
In reality, there will likely be some safety gains, and some losses, as:
people transferring from private car travel will reduce the risk and therefore incidence of vehicle
crashes
people transferring to active modes will result in increased walking and cycling on the routes
leading to the proposed facility, resulting in an increased risk of active mode crashes on these
unimproved routes
there could be crashes between active mode users on the proposed facility itself that wouldn’t
otherwise have occurred
depending on their origin, some existing cycle trips across the Waitemata Harbour via the
Bayswater and Devonport ferry services will transfer to the project, which may be a safer route
for cyclists than those connecting to the Bayswater or Devonport ferry terminals (or equally may
be a less safe option, if the new route requires them to cycle on a greater length of Lake Road
without safe cycle infrastructure).
We note that the MBCM places a very modest value on the safety benefits of cycle infrastructure – at
$0.05 per new and existing cyclist-km travelled on the facility. As a result, safety benefits typically
account for only 1% to 2% of the overall project benefits, for new cycle infrastructure.

Westhaven to Akoranga Active Mode Demand and Economic Assessment 49
When considering the above, the net effect of the above safety gains and losses are considered
negligible, within the context of the other, much larger benefit streams. We have omitted safety benefits
accordingly.
General traffic reduction benefits
Decongestion benefits are expected to be a significant portion of the overall project benefits, as the
proposed facility would provide an alternative to private car travel on currently congested road
corridors, including the Northern Motorway, Onewa Road and Esmonde Road. As a result, any mode
shift in favour of active modes will reduce existing (or forecast future) congestion on the road network.
The MBCM decongestion value for Auckland is $1.97 per vehicle-km removed from the network (Table
42, updated to current values). This region-wide value was developed in 2008 and does not however
recognise the high levels of congestion currently experienced on the Northern Motorway and its
approaches during the commuter peak periods, nor does it reflect how this congestion is expected to
change over time.
The evaluation has instead used the Upper Harbour SATURN models to quantify the benefits of each
cross-harbour car trip removed from the road network. To quantify these benefits per vehicle-km, a
small number of cross-harbour vehicle trips35 have been removed from the morning peak, evening peak
and interpeak period Upper Harbour SATURN models. The Upper Harbour model runs with and without
these trips have then been compared, and standard economic evaluation methodologies have been
used to quantify the vehicle travel time, congestion and operating cost benefits per peak period, with
cross-harbour vehicle trips removed from the network. The assessment conservatively omits CO2
emission benefits, which are typically a very small component of general traffic benefits.
This process has resulted in the following decongestion values:
2026 Decongestion Rates
$5.03 per vehicle-km removed from the road network during the commuter peaks
$1.43 per vehicle-km during the weekday interpeak period
2036 Decongestion Rates
$7.38 per vehicle-km removed from the road network during the commuter peaks
$1.53 per vehicle-km during the weekday interpeak period
The above outputs from the 2026 and 2036 Upper Harbour SATURN models have been applied to the
2028 and 2038 general traffic benefit assessments, respectively.
The peak period values derived above are higher than the MBCM’s default rate of $1.97 per vehicle-km
removed from the road network, and reflect that the proposed facility would remove vehicle trips from
an area of the network that is significantly more congested than the Auckland average. Conversely, the
interpeak values are lower than the MBCM default rate.
35 Cross harbour trips between Northcote/Takapuna and the CBD/Inner west have been removed only.

Westhaven to Akoranga Active Mode Demand and Economic Assessment 50
Weekend and off-peak decongestion values have conservatively been assumed to be zero, and general
traffic reduction benefits have been capped beyond 2038. This reflects the conflicting factors of
increasing land use and traffic volumes, but the decongestion expected following construction of the
Additional Waitemata Harbour Crossing.
The above assessment was carried out in 2018 for the assessment of the landward component of the
Westhaven to Akoranga (at that time known as SeaPath). It used the Upper Harbour SATURN models
available at that time. We have not updated this assessment to reflect current land use forecasts,
expected traffic conditions, or current MBCM update factors.
Forecasts of new commuter peak cycle trips have been obtained directly from the ACM, with daily cyclist
count profiles obtained from Tamaki Drive used to develop estimates of new interpeak cycle trips.
Estimates of new pedestrian trips have been developed based on the earlier assumption that 50% of the
proposed facility’s forecast daily pedestrian trips will be new trips, with commuter peak and interpeak
proportions based on pedestrian profiles obtained from Tamaki Drive.
It is important to recognise that not every new cross-harbour active mode trip on the proposed facility
would otherwise take place by private car. Recognising this, the number of new active mode trips has
been factored down to reflect:
the forecast car mode share between the model zones where new cycle trips are predicted,
from the regional transport model (Macro Strategic Model, MSM)
the forecast average car occupancy among car trips between the model zones where new cycle
trips are predicted, again from the MSM
non-utility cycling trips – some new cross-harbour trips will be recreational trips and therefore
not replace a trip by any other mode. 80% of new cycle trips are estimated to be utility trips
during the commuter peaks, based on survey data collected on Tamaki Drive
The above process has resulted in ‘diversion rates’ from car to active modes of 0.30 and 0.24 in the 2028
and 2038 commuter peaks, respectively. The MBCM does not provide diversion rates for walking or
cycling trips, but provides a rate of 0.725 for public transport trips in Auckland. The rates developed are
appropriately lower than the MBCM’s public transport diversion rate, and reflect that new walking and
cycling trips are more likely to come from an existing public transport trip, than from a car trip.
We have assumed 50% lower car diversion rates apply in the interpeak, recognising that a higher
proportion of new active mode trips are expected to be recreational trips during this period, and
therefore not replace a car trip. This is a conservative assumption, as conversely, car mode shares are
higher during this period.
The resulting general traffic reduction benefits have been estimated to be $152 million, discounted over
the 60-year evaluation period. This accounts for approximately 29% of the overall project benefits.
Emissions reduction benefits
Emissions reductions associated with the project can from two sources:

Westhaven to Akoranga Active Mode Demand and Economic Assessment 51
Direct emission reductions, where a private car driver chooses not to drive, but to walk or cycle
instead
Indirect emission reductions accrued by general traffic that continues to drive, but who
experience reduced congestion due to the reduction in traffic from the above
We have calculated benefits associated with the first source only.
The second emission reduction source will be negligible, as they tend to make up a very small component
of general traffic travel time and vehicle operating cost savings (ie general traffic reduction benefits).
We consider the benefit rate associated with this small emissions component to be within the margin of
error for the main general traffic decongestion benefits, already derived.
Direct emission benefits have been calculated based on the forecast reduction in daily general traffic km
travelled, as already described in the general traffic reduction benefit section above. Off-peak and
weekend traffic reductions have been estimated assuming a 50% lower car diversion rate than during
the commuter peak period.
Emissions reduction benefits have been calculated for CO2, PM10, NOx, CO and HC emissions. Economic
rates for each emission have been obtained from the MBCM, while emissions rates per car-km have
been obtained from Waka Kotahi’s Vehicle Emissions Prediction Model. Our assessment has assumed
that CO2, NOx and CO emissions per veh-km will fall over time, due to the electrification of New Zealand’s
private car fleet over time.
Other Benefit Streams
In a separate 2018 study36, MRCagney have estimated the agglomeration and tourism benefits of the
proposed cross harbour walking and cycling connection. These discounted benefits have been
determined to be $23 million and $2 million, respectively, over the 40-year evaluation period.
We have factored these benefit streams up to account for the extended 60-year evaluation period and
MBCM update factors to bring these 2018 costs up to current dollar terms. We have also factored the
tourism benefits down by 50%, to reflect revised international tourism expectations post Covid 19.
The resulting updated discounted agglomeration benefits have been determined to be $41 million, or
approximately 8% of the overall project benefits.
The tourism benefits have been omitted from the default economic analysis, and included only in a
sensitivity test, as per MBCM procedures.
36 Wider Economic Benefits of a New Walking and Cycling Link Across the Waitemata Harbour; MRCagney; December 2018

Westhaven to Akoranga Active Mode Demand and Economic Assessment 52
APPENDIX F economic evaluation peer review

Project Number: 1-C2214.00
Northern Pathway Economics Peer Review
16 July 2021 CONFIDENTIAL

©WSP New Zealand Limited 2021 i
Contact Details
Nerissa Harrison
WSP Level 3, The Westhaven 100 Beaumont Street Auckland 1011 +64 3 355 9311 +64 27 250 7926 [email protected]
Document Details:
Date: 16 July 2021 Reference: 1-C2214.00 Status: Final
Prepared by
Chris Morahan and Michael Topp
Reviewed by
Nerissa Harrison
Technical Principal Transportation

©WSP New Zealand Limited 2021 ii
Document History and Status
Revision Date Author Reviewed by Approved by Status
1 16/07/2021 Chris Morahan
and Michael
Topp
Nerissa
Harrison
Nerissa
Harrison
Final
Revision Details
Revision Details
1 Final version after receiving economics author comments to review

©WSP New Zealand Limited 2021 iii
Contents
Disclaimers and Limitations .................................................................................................................................................................................. 1
1 Introduction ........................................................................................................................................................................................................ 2
2 General Comments ...................................................................................................................................................................................... 2
3 Specific Comments ...................................................................................................................................................................................... 2
3.1 Conformity ............................................................................................................................................................................................. 2
3.2 Credibility ................................................................................................................................................................................................ 2
3.3 Choice of do-minimum option............................................................................................................................................ 3
3.4 Identification and selection of alternatives and options ............................................................................... 3
3.5 Cost estimate ....................................................................................................................................................................................... 3
3.6 Cost-benefit appraisal .................................................................................................................................................................. 3
4 Summary ............................................................................................................................................................................................................... 3

1-C2214.00 Northern Pathway Economics – Peer Review
©WSP New Zealand Limited 2021 1
Disclaimers and Limitations This report (‘Report’) has been prepared by WSP exclusively for Waka Kotahi (‘Client’) in relation to
the Northern Pathway Economics Peer Review (‘Purpose’) and in accordance with the Short form
agreement for consultant engagement signed and dated with the client on 23rd June 2021. The
findings in this Report are based on and are subject to the assumptions specified in the Report
and our Offer of Service dated 22nd June 2021. WSP accepts no liability whatsoever for any reliance
on or use of this Report, in whole or in part, for any use or purpose other than the Purpose or any
use or reliance on the Report by any third party.

1-C2214.00 Northern Pathway Economics – Peer Review
©WSP New Zealand Limited 2021 2
1 Introduction
Waka Kotahi has commissioned WSP to undertake a peer review for the economic assessment of
the proposed option for the Northern Pathway in Auckland between Westhaven and Akoranga.
The peer review checked that the economics for the preferred option met the requirements of
the Waka Kotahi prescribed business case approach process, particularly the Waka Kotahi
Monetised Benefits and Costs Manual (MBCM) procedures.
2 General Comments
The economic assessment presented to WSP is considered robust. Most peer review comments
are minor in nature and any points raised are unlikely to change the benefit cost ratio (BCR))
significantly,. or pertain to sensitivity testing rather than the base BCR. The economics author, Flow
Transportation Specialists, have provided adequate responses to all peer review comments. The
full list of peer review comments is included in Appendix A.
3 Specific Comments
3.1 Conformity
Conformity was not specifically assessed, and we understand the activity, as a separate walking
and cycling bridge, complies with the requirements for the activity class it seeks funding from.
3.2 Credibility
Table 1summarises the credibility criteria, pertaining to economics that Waka Kotahi require, to be
met by the business case:
Table 1: Credibility criteria summary
Criteria Met/Not Met WSP Review Comment
Critically assess the results of each
stage for economic efficiency
evaluation of the project.
Met (for
preferred
option only)
The economics are for a single option
only, which is understood to be the
preferred option - a separate walking
and cycling bridge. We understand that
assessment of other options has taken
place in previous stages of the project,
and these are not part of the scope for
this peer review. The economics have
been reviewed and all review comment
have adequate responses from the
economics author.
Identify the key benefits and
determine whether they are
realistic (e.g. are the travel time
savings realistic or are excessive
delays forecast under the
congested conditions in the do-
minimum option?).
Met The monetised benefits claimed are
generally conservative.
Identify the factors or
assumptions, particularly
Met Cycle, micromobility, and pedestrian
demand forecasts were provided. The

1-C2214.00 Northern Pathway Economics – Peer Review
©WSP New Zealand Limited 2021 3
Criteria Met/Not Met WSP Review Comment
forecasted estimates that have a
major influence on the
evaluation. Describe each of
these factors/ assumptions and
include commentary on the
sensitivity of the evaluation to
each factor or assumption.
method used to determine the demands
is considered reasonable and adequate
sensitivity testing has been undertaken.
Highlight any significant areas of
risk for costs and benefits.
Met Robust sensitivity testing has been
undertaken and addressed areas of
higher risk to benefits and costs.
3.3 Choice of do-minimum option1
The choice of a do-minimum option is appropriate economically.
3.4 Identification and selection of alternatives and options
No alternatives or options have been assessed in the economics provided, and we understand
alternatives and options were assessed in previous stages of the project. Peer review of these
alternatives and options was not part of the scope for this peer review.
3.5 Cost estimate
This peer review has not undertaken a parallel cost estimate (i.e. is excluded from the scope of the
peer review).co
3.6 Cost-benefit appraisal
The cost-benefit appraisal generally conforms with the MBCM. We have noted some points of
clarification and suggestions in the attached review register, and they are mostly minor in nature
(i.e. unlikely to affect the BCR). The economics author has provided acceptable reposes to the peer
review comments.
3.6.1 Sensitivity analysis
The cost-benefit appraisal has undertaken enough sensitivity testing. We have provided
commentary in the review register and the economics author has undertaken additional sensitivity
tests in response..
4 Summary
This peer review has identified several issues and points for clarification, most of which were minor
in nature, and unlikely to affect the economics result. The issues identified by our peer review are
noted in detail within the review register (Appendix A) and responses from the authors are
recorded.
Based on the responses to the issues identified, we confirm that the economics are credible and
conform to the Waka Kotahi Business Case Approach requirements.
1 https://www.nzta.govt.nz/planning-and-investment/learning-and-resources/business-case-approach-guidance/supporting-material/glossary/#D

1-C2214.00 Northern Pathway Economics – Peer Review
©WSP New Zealand Limited 2021 4

1-C2214.00 Northern Pathway Economics – Peer Review
©WSP New Zealand Limited 2021 5
Appendix A - Review Register
# Reference Description WSP Comment/ Feedback Flow Response
1 Assumptions Cost sensitivity testing
(P95 cost)
Carry out sensitivity test of upper bound cost using P95 (95th percentile) cost
estimate rather than +25% cost. Accept
2 Assumptions Analysis period of 60
years
An analysis period of 60 years is permitted by the MBCM. The MBCM
recommends that the business case includes emphasis on comprehensive
optioneering and sensitivity testing on demand forecasts.
No change needed
3 Assumptions Demand forecast
maps (SATURN)
WSP requested cycle demand catchment maps in the form of SATURN
model outputs.
WSP agree with the general methodology and note that the review does
not cover review of the SATURN modelling.
Extrapolation of demands beyond modelled years need careful
consideration and it may be appropriate to cap them.
WSP agree with sense checking the demand forecast.
Accept - demand select
link supplied for review
4 Assumptions Micro-mobility WSP agree with the general approach and sensitivity tests for e-bikes and e-
scooters. No change needed
5 Assumptions Land use forecasts
(I11.5 and I11.6)
WSP agree that changes between the I11.5 and I11.6 models need to be
checked.
WSP suggest considering development that is not included in the I11.6
model, such as the brownfield development in Northcote.
Accept – demand
sensitivity testing is
undertaken
6 Sensitivity Congestion charging No need to sensitivity test for congestion charging needed and could test
increased cycling – Agree to sensitivity test
with +/- cycle demand

1-C2214.00 Northern Pathway Economics – Peer Review
©WSP New Zealand Limited 2021 6
# Reference Description WSP Comment/ Feedback Flow Response
Elasticity of walking and cycling with congestion charging is low because
congestion charge is looking to only be about the cost of a PT fare and the
trips within the walkable and cyclable catchment that choose to use car
with the northern pathway open would be more likely to switch to PT with
congestion charging than walking and cycling.
Internationally where congestion charging has resulted in uptake of walking
and cycling it seems to have been paired with investment in walking and
cycling infrastructure (i.e. it is likely the infrastructure invests had a part to
play in the uptake).
There is an OECD report that looked at congestion charging impact on bike
mode share that found it increased bike mode share by 5%, so that could
be an upper sensitivity test
(OECD report link – add reference elsewhere?)
I’m just not convinced its directly applicable to the Northern Pathway
example.
(and not rerun cycle
model)
7 Sensitivity
Additional Waitemata
Harbour Crossing
Sensitivity test using simple +/- cycle demand and comment on AWHC in
reporting.
If AWHC was rail / light rail from Takapuna - then this option would take
away walking and cycling from that zoning.
(i.e. sensitivity test by removing walking and cycling demand from Takapuna
catchment, which leaves you with Northcote and other catchments only for
walking and cycling)
If AWHC was a road link: The road crossing would make very little difference
to walking and cycling demand compared with test above, so better to
sensitivity test above as the worst-case scenario.
Agree to sensitivity test
with +/- cycle demand
(and not rerun cycle
model)
8 Assumptions
Bridge closure due to
inclement weather
conditions
WSP suggest carrying out sensitivity tests for bridge closures during high
wind and significant weather events. Sensitivity test added
considering effects should

1-C2214.00 Northern Pathway Economics – Peer Review
©WSP New Zealand Limited 2021 7
# Reference Description WSP Comment/ Feedback Flow Response
the bridge be closed 20
days per year
9 Assumptions
Greenhouse gas
emissions calculation
basis
Consider using Ministry of Transport fleet composition predictions for
greenhouse gas emissions.
WSP agree with sensitivity testing for different greenhouse gas emission
scenarios.
Sensitivity testing on demand forecasts can reflect different legislative
environments relating to this (ETS, ICE vehicle bans, etc.).
GHG benefits make up
$2m of the total $516m
benefits, and these have
been calculated applying
falling emissions rates in
line with the VEPM.
Sensitivity testing the GHG
benefits is unlikely to
affect the BCR.
10 Assumptions Traffic benefits
WSP agree with the method and sensitivity tests proposed for traffic
benefits, with the understanding that this is based on the SP9 decongestion
benefits method.
No change needed.
11 Assumptions Bus benefits WSP agree with carrying out a sensitivity test with fewer bus services to
determine the impact on the economics. No change needed.
12 Assumptions
Congestion charging
and other changes in
generalised costs
WSP agree with the approach of changing generalised costs.
WSP suggest consideration of effects from the Emissions Trading Scheme
(ETS) in this sensitivity test.
Agree to sensitivity test
with +/- cycle demand
(and not rerun cycle
model)
13 Assumptions Agglomeration
benefits data
Check that 2018 agglomeration benefits data is not out of date and that
there is not a more recent version available (e.g. from MR Cagney). Agree to check
14 Assumptions Cycle demand
catchment (SATURN)
The SATURN catchment does not appear to show cycle trips on the
Northern Pathway between the Northern Corridor improvements and the
Seapath/ Skypath links.
The 2028 scenario
modelled excludes the
Akoranga to Constellation
section of Northern

1-C2214.00 Northern Pathway Economics – Peer Review
©WSP New Zealand Limited 2021 8
# Reference Description WSP Comment/ Feedback Flow Response
WSP suggest testing the demand/ catchment with the Northern Pathway
link in the model, if the link is not part of the do-minimum model scenario.
Pathway, as this project is
currently unfunded.
The 2038 scenario
includes this project. A
plot showing cycle
demand on this project is
now included in the
report (Figure 5).
Cycle trip origin
distribution maps are also
included in Appendix C.
15
Economics
(multiple
sheets)
Multiple references to
Economic Evaluation
Manual (EEM)
The EEM references need to be updated to the corresponding MBCM
references and checked that they are still valid. Agree
16
Economics
(Model
Summary)
Assumed pedestrian
growth
This is not in the EEM or the MBCM and is considered reasonable in the
absence of any other information.
AHB demands appears to forecast increasing volumes out to 2078 -
consider using those?
Local population
catchments are
considered a more
appropriate measure to
benchmark pedestrian
trips by.
Traffic forecasts on the
AHB are likely to be
affected by very distant
land use, such as in
Silverdale.
17 Economics
(Model
Summary,
Average cycle speed Confirm basis of 25km/h assumed speed.
The speed applied is
based on an average of 7
on-road cycle tube counts
made in Northcote in

1-C2214.00 Northern Pathway Economics – Peer Review
©WSP New Zealand Limited 2021 9
# Reference Description WSP Comment/ Feedback Flow Response
Cyclist Travel
Time)
2018. Mean speeds in
those locations ranged
from 17 to 33 km/h, with
an average of 24 km/h.
18
Economics
(Model
Summary,
Health)
Different annual
growth rate for
pedestrians – utility
and recreational
WSP suggest using a consistent rate for pedestrian growth, for utility and
recreational purposes, or provide justification for using different rates.
2% growth rate has been
applied to both utility and
recreational pedestrian
trips, based on local land
use growth.
Zero growth has
conservatively been
applied to tourist trips,
due to the post-Covid
uncertainty in the future
of tourism.
19 Economics
(Health)
Tourist pedestrian and
cycle volumes Confirm the source or basis for tourist pedestrian and cyclist volumes.
Refer Appendix D of
report
20 Economics
(Health)
Higher e-scooter
uptake reduces
health benefits for
pedestrians
Confirm that the modelled pedestrian volumes are based on faster speeds
(because 40% of pedestrians are assumed to be on e-scooters). If they are
not, consider using full pedestrian health benefits.
The MBCM does not
provide a benefit rate for
e-scooters, so the
evaluation has applied the
$1/km rate for e-bikes and
applied this to a portion of
the new pedestrian trips.
The sensitivity test
assumes a higher
proportion of e-scooters
and hence, a lower
average benefit rate.

1-C2214.00 Northern Pathway Economics – Peer Review
©WSP New Zealand Limited 2021 10
# Reference Description WSP Comment/ Feedback Flow Response
A separate sensitivity test
now considers the effect
of increased pedestrian
demands, due to
increased access to e-
scooters.
21
Economics
(Model
Summary
and
Decongestio
n)
Effective diversion
rate from veh-km to
cycle-km
'Confirm basis of diversion rates used and document that they are lower
than Waka Kotahi have accepted on other cycling infrastructure projects
(e.g. Christchurch Major Cycleways), and therefore potentially conservative.
Consider using less conservative diversion rate.
Diversion rates are
documented in Appendix
E (road traffic reduction
benefits). They are lower
than those applied in
Christchurch as cross
harbour trips in Auckland
have a much higher PT
mode share than
Christchurch does (and
therefore, a higher portion
of new cycle trips are
expected to have
switched from PT)
22
Economics
(Decongestio
n)
Average pedestrian
trip length
1km is recommended by the MBCM for typical projects, however in this case
a higher value would be expected given that the bridge is longer than 1km.
The modelled average cycle trip length is significantly longer than the
MBCM recommendation (10km versus 3km). Consider using a similar ratio
for the pedestrian average distance.
The project in its entirety is
~4.5 km long, from
Akoranga to Westhaven.
Not all pedestrian trips will
be across the 1.3 km
bridge component, and
some will be shorter local
trips.
1 km is considered a
reasonable average.
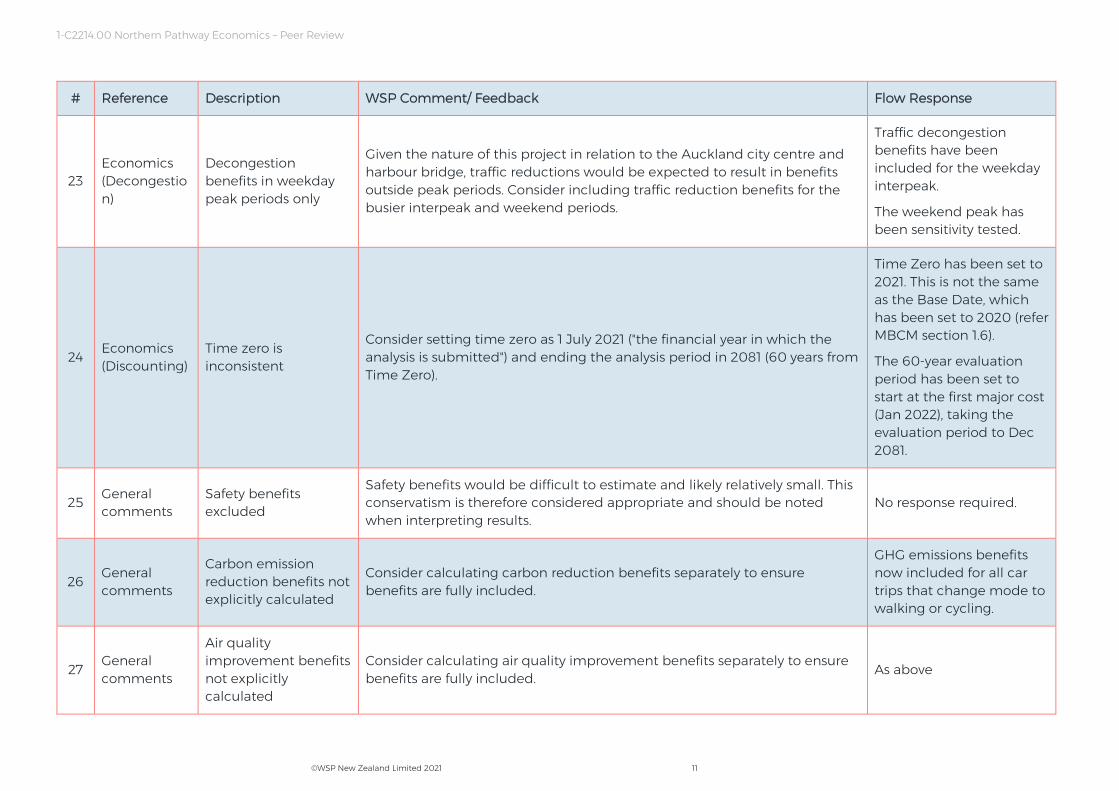
1-C2214.00 Northern Pathway Economics – Peer Review
©WSP New Zealand Limited 2021 11
# Reference Description WSP Comment/ Feedback Flow Response
23
Economics
(Decongestio
n)
Decongestion
benefits in weekday
peak periods only
Given the nature of this project in relation to the Auckland city centre and
harbour bridge, traffic reductions would be expected to result in benefits
outside peak periods. Consider including traffic reduction benefits for the
busier interpeak and weekend periods.
Traffic decongestion
benefits have been
included for the weekday
interpeak.
The weekend peak has
been sensitivity tested.
24 Economics
(Discounting)
Time zero is
inconsistent
Consider setting time zero as 1 July 2021 ("the financial year in which the
analysis is submitted") and ending the analysis period in 2081 (60 years from
Time Zero).
Time Zero has been set to
2021. This is not the same
as the Base Date, which
has been set to 2020 (refer
MBCM section 1.6).
The 60-year evaluation
period has been set to
start at the first major cost
(Jan 2022), taking the
evaluation period to Dec
2081.
25 General
comments
Safety benefits
excluded
Safety benefits would be difficult to estimate and likely relatively small. This
conservatism is therefore considered appropriate and should be noted
when interpreting results.
No response required.
26 General
comments
Carbon emission
reduction benefits not
explicitly calculated
Consider calculating carbon reduction benefits separately to ensure
benefits are fully included.
GHG emissions benefits
now included for all car
trips that change mode to
walking or cycling.
27 General
comments
Air quality
improvement benefits
not explicitly
calculated
Consider calculating air quality improvement benefits separately to ensure
benefits are fully included. As above

1-C2214.00 Northern Pathway Economics – Peer Review
©WSP New Zealand Limited 2021 12
# Reference Description WSP Comment/ Feedback Flow Response
28 General
comments
Capping of benefits at
2038 or 2048.
Confirm basis for capping benefits beyond 2038/48. Consider not capping
these.
Cycle demand forecasts
for the AHB include 3,700
in 2028 and 5,300 in
2038. Extrapolating these
linearly gets us to 11,800
cycle trips in 2078 and
regional modes shares of
around 10%, which seems
a stretch.
When we test a “complete
cycle network” using the
2038 cycle model, AHB
cycle demands are 7,600,
if we assume a very high
e-bike adoption rate.
That’s roughly where the
above linear extrapolation
would get us by 2048.
29 General
comments
Single option
assessed only
Consider incremental analysis on a range of options so make it clear why
only one option considered
Refer comment back to
business case, as only one
options was considered
for economic evaluation.
30 GHG
Emissions
Number of days for
GHG emissions
inconsistent with
decongestion benefits
Change to only weekdays when the GHG emission benefits are considered.
While there would be car
users that transfer to
walking/cycling every day
of the year, those car trips
removed from the
network will

1-C2214.00 Northern Pathway Economics – Peer Review
©WSP New Zealand Limited 2021 13
# Reference Description WSP Comment/ Feedback Flow Response
- reduce GHG emissions all
365 days/year
- reduce congestion only
on weekday commuter
peaks
Hence the different
number of days/years
applied.
31 Report (Table
ES3)
Not explicitly clear
that net present
values are annual
I assume the values are NPV, and this should be stated so it is clear. Correct. Clarified in report
32 Report
(Section 2.1.1)
Assume e-scooters
will not increase
pedestrian uptake.
Sensitivity test uptake of pedestrian demand based on increased e-scooter
use New sensitivity test added

wsp.com/nz


![On Demand CMOFor L Inked In [Compatibility Mode]](https://static.fdocuments.net/doc/165x107/548b190db479590a0d8b613b/on-demand-cmofor-l-inked-in-compatibility-mode.jpg)


![Demand and Supply_Concepts and Applications (2)(1) [Compatibility Mode]](https://static.fdocuments.net/doc/165x107/577d24621a28ab4e1e9c5b28/demand-and-supplyconcepts-and-applications-21-compatibility-mode.jpg)


