ACTION PLAN-SVEEP-II FOR LOKSABHA...
43
Transcript of ACTION PLAN-SVEEP-II FOR LOKSABHA...
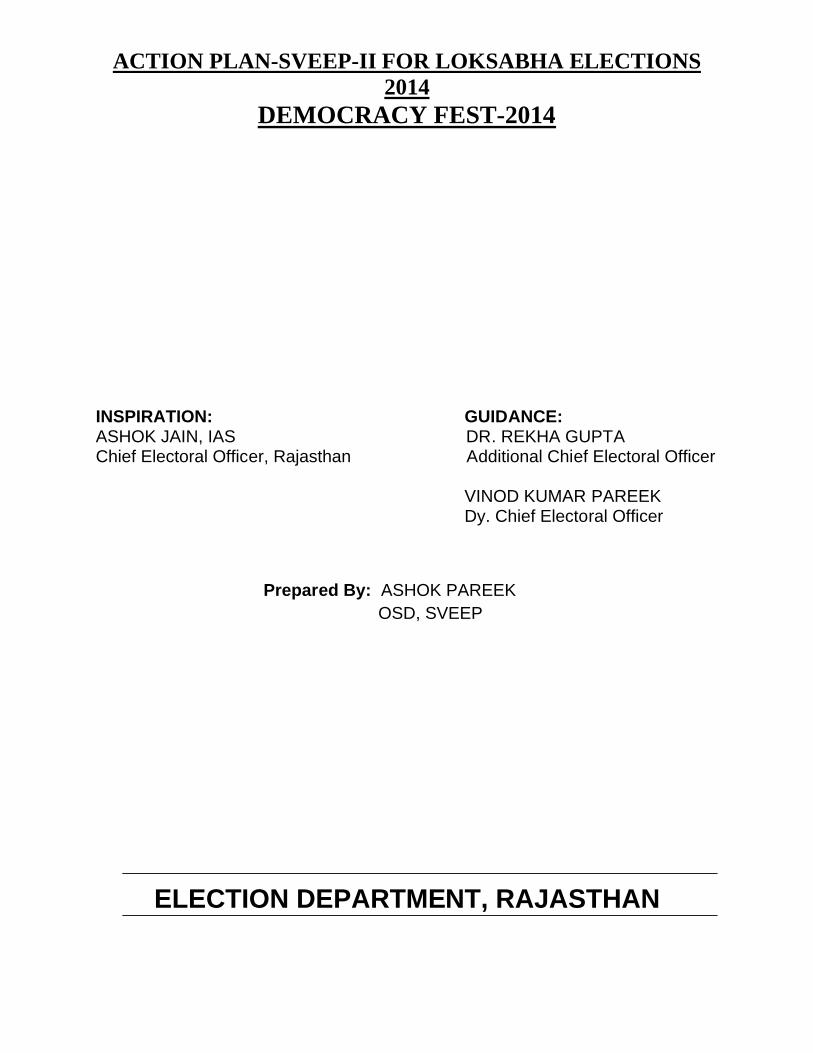
ACTION PLAN-SVEEP-II FOR LOKSABHA ELECTIONS 2014
DEMOCRACY FEST-2014
INSPIRATION: GUIDANCE: ASHOK JAIN, IAS DR. REKHA GUPTA Chief Electoral Officer, Rajasthan Additional Chief Electoral Officer
VINOD KUMAR PAREEK Dy. Chief Electoral Officer
Prepared By: ASHOK PAREEK OSD, SVEEP
ELECTION DEPARTMENT, RAJASTHAN
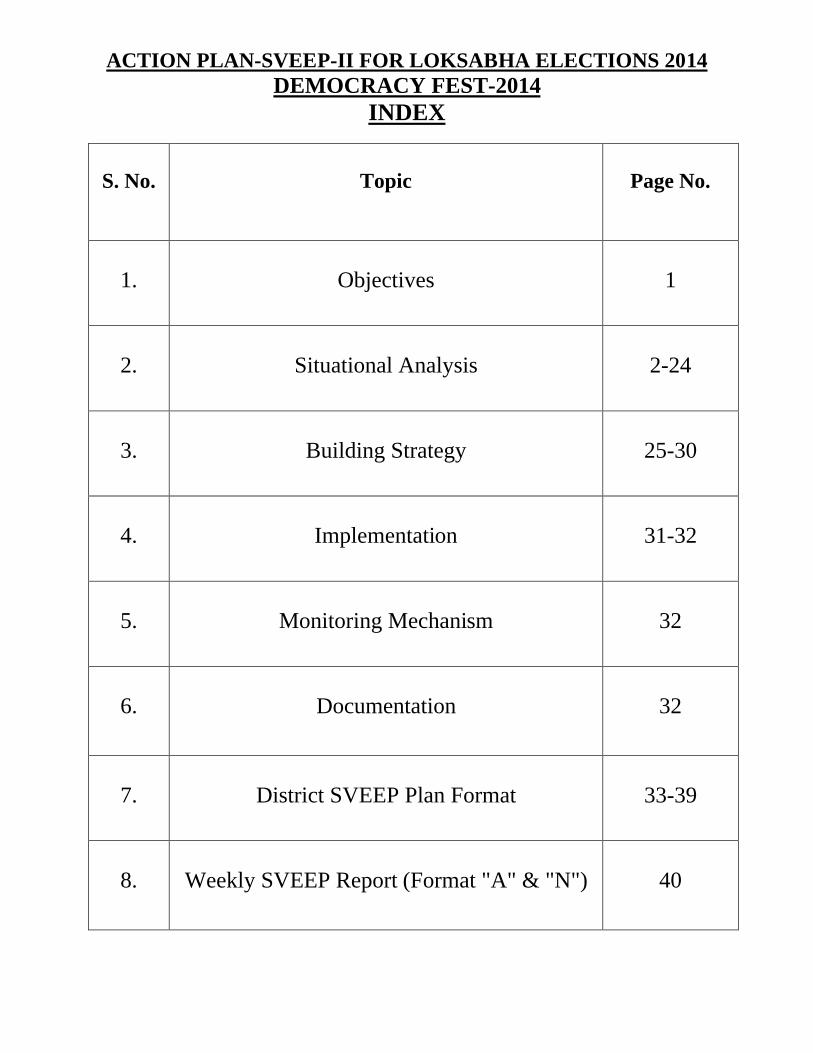
ACTION PLAN-SVEEP-II FOR LOKSABHA ELECTIONS 2014DEMOCRACY FEST-2014
INDEX
S. No. Topic Page No.
1. Objectives 1
2. Situational Analysis 2-24
3. Building Strategy 25-30
4. Implementation 31-32
5. Monitoring Mechanism 32
6. Documentation 32
7. District SVEEP Plan Format 33-39
8. Weekly SVEEP Report (Format "A" & "N") 40
- 1 -
ACTION PLAN-SVEEP-II FOR LOKSABHA ELECTIONS 2014
DEMOCRACY FEST-2014
A. Objectives
1. To understand the socio-economic and demographic context of the state in
order to design effective voter information and education campaign specially
for female voters.
2. To analyze the profile of voters & identifying the EP ratio gap, gender gap at
Parliamentary/Assembly Constituency and Polling Station level in order to
find the major thrust places for voters education programme and also
identifying.
3. To understand local cultural milieu so that they can be capitalized on for
voters education.
4. To identify the excluded communities and to design programmes making
them inclusive in the electoral process and participation.
GOALS FOR PARLIAMENTARY ELECTION-2014
1. Cent % registration of eligible voters.
2. To increase the overall voter turnout by at least 15% over the LokSabha
election-2009.
3. To design targeted strategy for youth, female, excluded group and urban
voters.
4. To enhance in the quality of electoral participation & Ethical voting.
- 2 -
B. Situation Analysis
B1. Electoral Profile
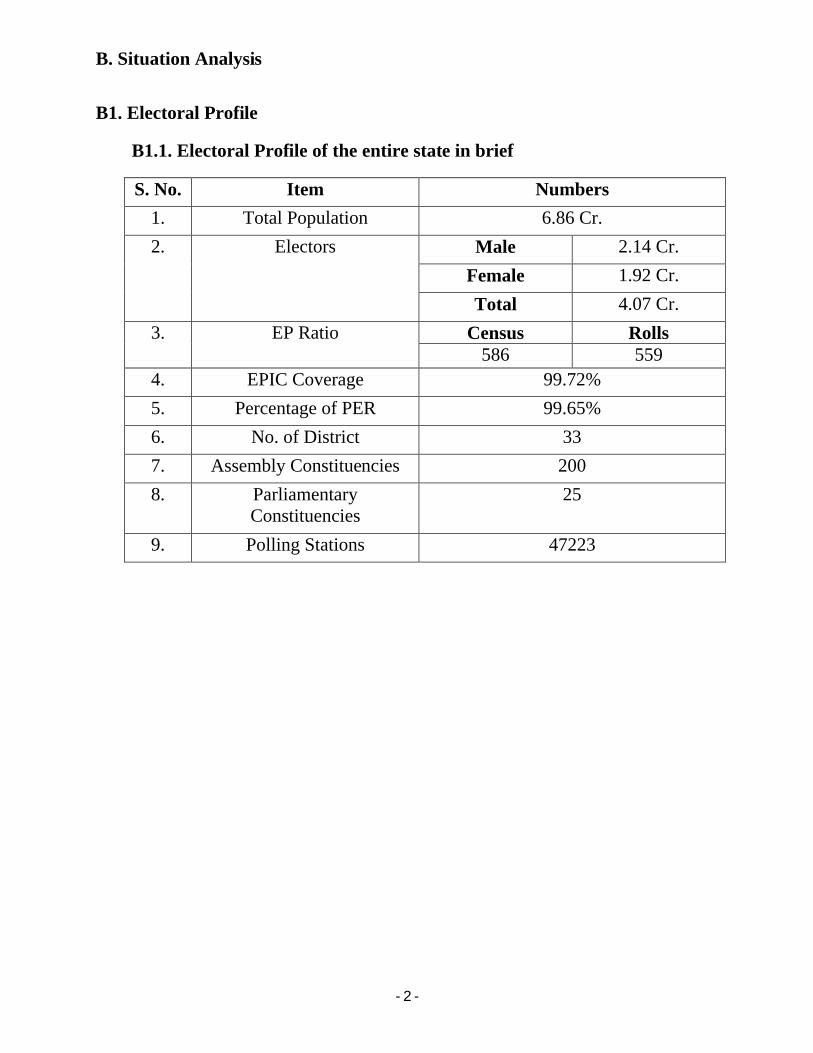
B1.1. Electoral Profile of the entire state in brief
S. No. Item Numbers
1. Total Population 6.86 Cr.
2. Electors Male 2.14 Cr.
Female 1.92 Cr.
Total 4.07 Cr.
3. EP Ratio Census Rolls586 559
4. EPIC Coverage 99.72%
5. Percentage of PER 99.65%
6. No. of District 33
7. Assembly Constituencies 200
8. Parliamentary Constituencies
25
9. Polling Stations 47223
- 3 -
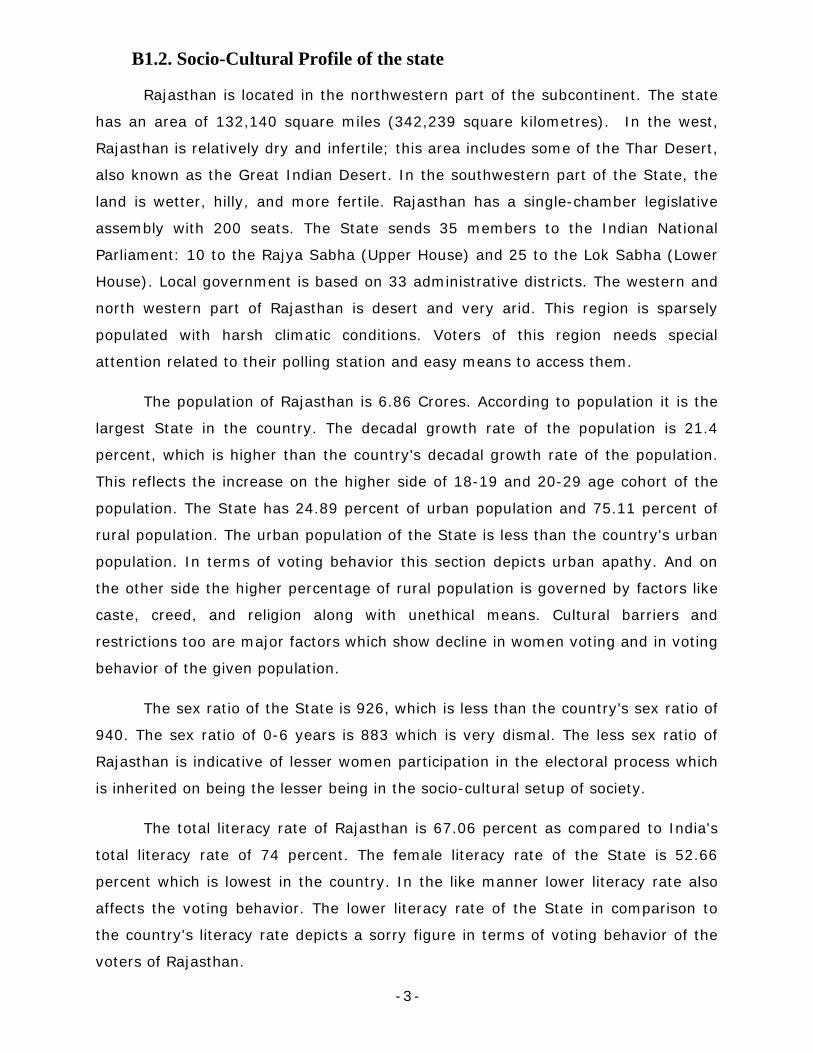
B1.2. Socio-Cultural Profile of the state
Rajasthan is located in the northwestern part of the subcontinent. The state
has an area of 132,140 square miles (342,239 square kilometres). In the west,
Rajasthan is relatively dry and infertile; this area includes some of the Thar Desert,
also known as the Great Indian Desert. In the southwestern part of the State, the
land is wetter, hilly, and more fertile. Rajasthan has a single-chamber legislative
assembly with 200 seats. The State sends 35 members to the Indian National
Parliament: 10 to the Rajya Sabha (Upper House) and 25 to the Lok Sabha (Lower
House). Local government is based on 33 administrative districts. The western and
north western part of Rajasthan is desert and very arid. This region is sparsely
populated with harsh climatic conditions. Voters of this region needs special
attention related to their polling station and easy means to access them.
The population of Rajasthan is 6.86 Crores. According to population it is the
largest State in the country. The decadal growth rate of the population is 21.4
percent, which is higher than the country's decadal growth rate of the population.
This reflects the increase on the higher side of 18-19 and 20-29 age cohort of the
population. The State has 24.89 percent of urban population and 75.11 percent of
rural population. The urban population of the State is less than the country's urban
population. In terms of voting behavior this section depicts urban apathy. And on
the other side the higher percentage of rural population is governed by factors like
caste, creed, and religion along with unethical means. Cultural barriers and
restrictions too are major factors which show decline in women voting and in voting
behavior of the given population.
The sex ratio of the State is 926, which is less than the country's sex ratio of
940. The sex ratio of 0-6 years is 883 which is very dismal. The less sex ratio of
Rajasthan is indicative of lesser women participation in the electoral process which
is inherited on being the lesser being in the socio-cultural setup of society.
The total literacy rate of Rajasthan is 67.06 percent as compared to India's
total literacy rate of 74 percent. The female literacy rate of the State is 52.66
percent which is lowest in the country. In the like manner lower literacy rate also
affects the voting behavior. The lower literacy rate of the State in comparison to
the country's literacy rate depicts a sorry figure in terms of voting behavior of the
voters of Rajasthan.
- 4 -
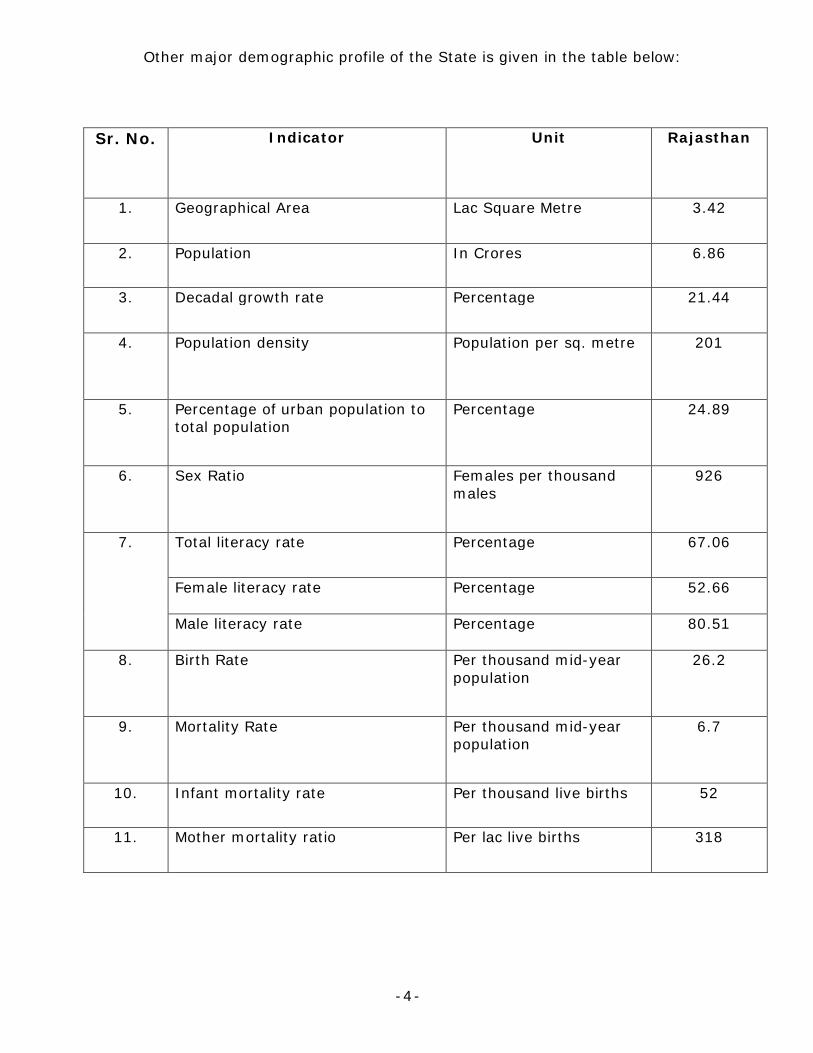
Other major demographic profile of the State is given in the table below:
Sr. No. Indicator Unit Rajasthan
1. Geographical Area Lac Square Metre 3.42
2. Population In Crores 6.86
3. Decadal growth rate Percentage 21.44
4. Population density Population per sq. metre 201
5. Percentage of urban population to total population
Percentage 24.89
6. Sex Ratio Females per thousand males
926
7. Total literacy rate Percentage 67.06
Female literacy rate Percentage 52.66
Male literacy rate Percentage 80.51
8. Birth Rate Per thousand mid-year population
26.2
9. Mortality Rate Per thousand mid-year population
6.7
10. Infant mortality rate Per thousand live births 52
11. Mother mortality ratio Per lac live births 318
- 5 -
Cultural Profile of Rajasthan
Rajasthan is well known for its vibrant, exotic and colorful folk culture.
This is the State where the royal glory meets the traditions in rainbow of
colors. Set against the enormous natural backdrop of desert and sand one
comes across unusual diversity. This diversity is in different forms of
customs, traditions, costumes, language, music, dance and cuisine that
people follow across the State.
The land of Rajasthan is endowed with magnificent palaces, havelis and
invincible forts. The natural resources here are cultural preservations of the locals.
The true culture of rajasthan is reflected in its arts and paintings. Rajasthan has
one of the most colorful and vibrant deserts in the world. The great Thar desert
has a plethora of celebrations. Festivals and fairs, music and dance are a part of
life in the State. Festivals hold an unusual lure for the people here and they have
number of reasons to celebrate.
Fairs and Festivals -
Some important festivals and fairs of Rajasthan - Baneshwar Fair, Bundi
Utsav, Camel festival, Chandrabhaga Fair, Desert festival, Dusherra festival,
Elephant festival, Jodhpur folk festival, Kaila Devi fair, Kumbhalgarh festival,
Marwar festival, Shekhawati festival, Winter festival-Mount Abu, Matsya festival,
Nagaur festival, Banganga fair, Chambal festival-Kota, Karni mata fair, Kapil muni
fair, Ganesh Chaturthi festival, Jambheswar fair and Khethla fair.
Folk Music -
There is a great tradition of folk music which is written under the banners of
Turra and Kalangi this is sung in groups in a Jikri, Kanhaiyya or Geet (of the
Meenas), Hele-ke-Khyaland and Bam-Rasiyaof Eastern Rajasthan. Group singing
of classical bandishes, called the Dangalor Taalbandi is also unique to this region.
Bhopas are singing priests of various deities or warrior wear red costumes and
play the Mashak.
The Jogis were well-known for their recitation of the great ballad Nihalde
sultan,Shivji-ka-byawala and songs about Gopi Chand and Bhartrihari. Most of
these musical communities have rural base and function as wandering minstrels
travelling from village to village. There are many other artists in different art forms
- 6 -
who use music as an accompaniment. The Dholies, also known as Mirasis,
Dhadhies, Manganiyars and Langas are known for their distinct musical styles.
State and royal patronage elevated some of these musicians into Kalawants
in the royal courts. Their music had acquired a sophistication that was absent from
the rustic tones of the others. The famous Maand of Rajasthan, which is a unique
style of singing and a core melody, is their creation. True to its desert environment,
the Maandspeaks of love, separation, chivalry and revelry. Balladsare an integral
part of professional repertoire and Dhola Maru, Moomal-Mhendra, Doongji-
Jawarji, Galaleng, Jala-Boobna, Nagji-Nagwantiare the more popular ones.
Folk Dances -
Dance is often part of the musical tradition and the Thories or Nayaks who
are pabu Bhopas, have female accompanist; together they recite the Phad(a
painted ballad). The Phad itself is an elaborately painted work of art and deeply
venerated. The chipas or Joshisare famous phad painters.
Folk Opera -
Folk opera is another field which has been made immensely popular by the
professionals, often in association with amateurs. The Chairawiand Kuchmani
Khyals, Maach of Chittaugarh area, Tamasha of Jaipurand Rammat of
Bikaner are famous. The Nautankiand Raas-leela are also seen in western Uttar
Pradesh, but sadly, the Alibakshi Khyal, the original Bhawai plays (which still have a
strong presence in Gujarat) and the musical traditions of the Rasadharies and
Rawals are now extinct.
- 7 -
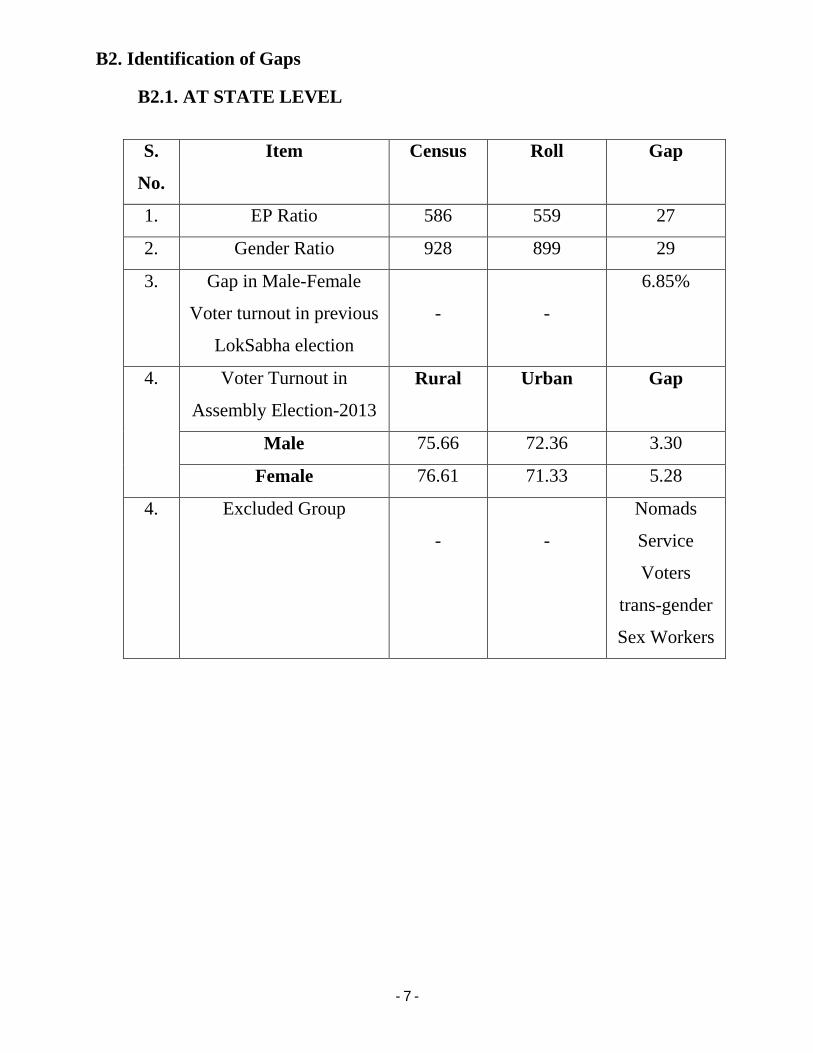
B2. Identification of Gaps
B2.1. AT STATE LEVEL
S.
No.
Item Census Roll Gap
1. EP Ratio 586 559 27
2. Gender Ratio 928 899 29
3. Gap in Male-Female
Voter turnout in previous
LokSabha election
- -
6.85%
4. Voter Turnout in
Assembly Election-2013
Rural Urban Gap
Male 75.66 72.36 3.30
Female 76.61 71.33 5.28
4. Excluded Group
- -
Nomads
Service
Voters
trans-gender
Sex Workers
- 8 -
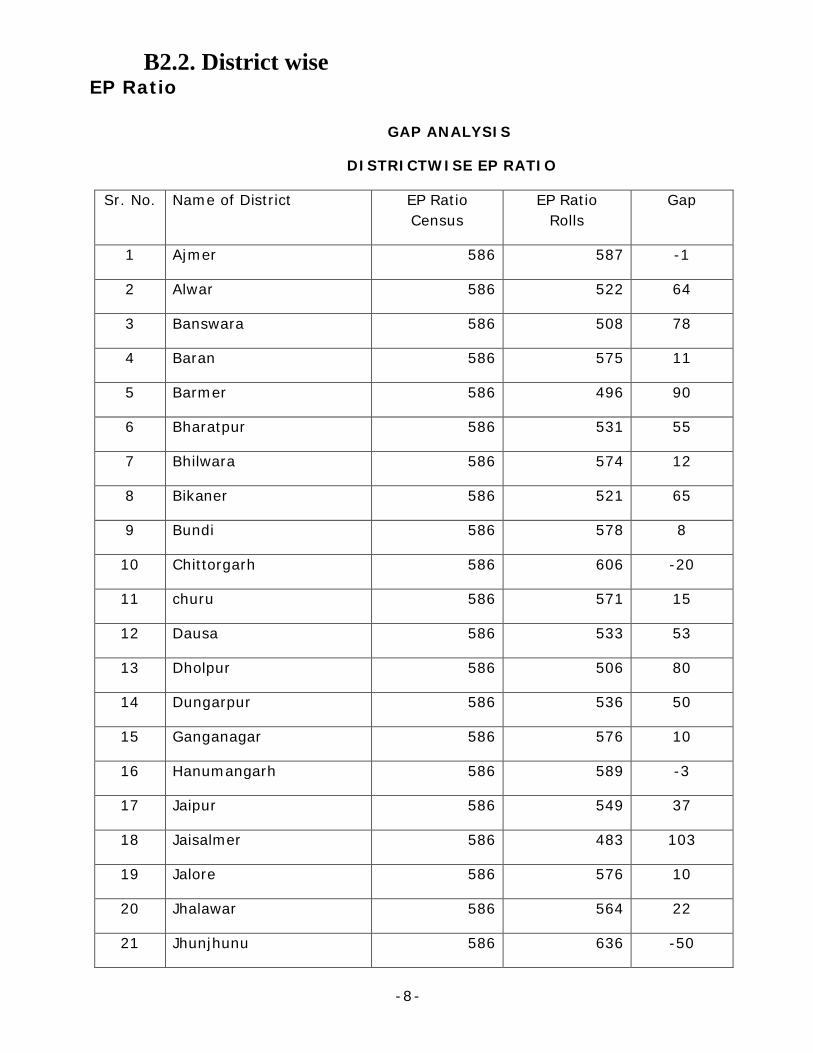
B2.2. District wiseEP Ratio
GAP ANALYSIS
DISTRICTWISE EP RATIO
Sr. No. Name of District EP Ratio Census
EP Ratio Rolls
Gap
1 Ajmer 586 587 -1
2 Alwar 586 522 64
3 Banswara 586 508 78
4 Baran 586 575 11
5 Barmer 586 496 90
6 Bharatpur 586 531 55
7 Bhilwara 586 574 12
8 Bikaner 586 521 65
9 Bundi 586 578 8
10 Chittorgarh 586 606 -20
11 churu 586 571 15
12 Dausa 586 533 53
13 Dholpur 586 506 80
14 Dungarpur 586 536 50
15 Ganganagar 586 576 10
16 Hanumangarh 586 589 -3
17 Jaipur 586 549 37
18 Jaisalmer 586 483 103
19 Jalore 586 576 10
20 Jhalawar 586 564 22
21 Jhunjhunu 586 636 -50
- 9 -
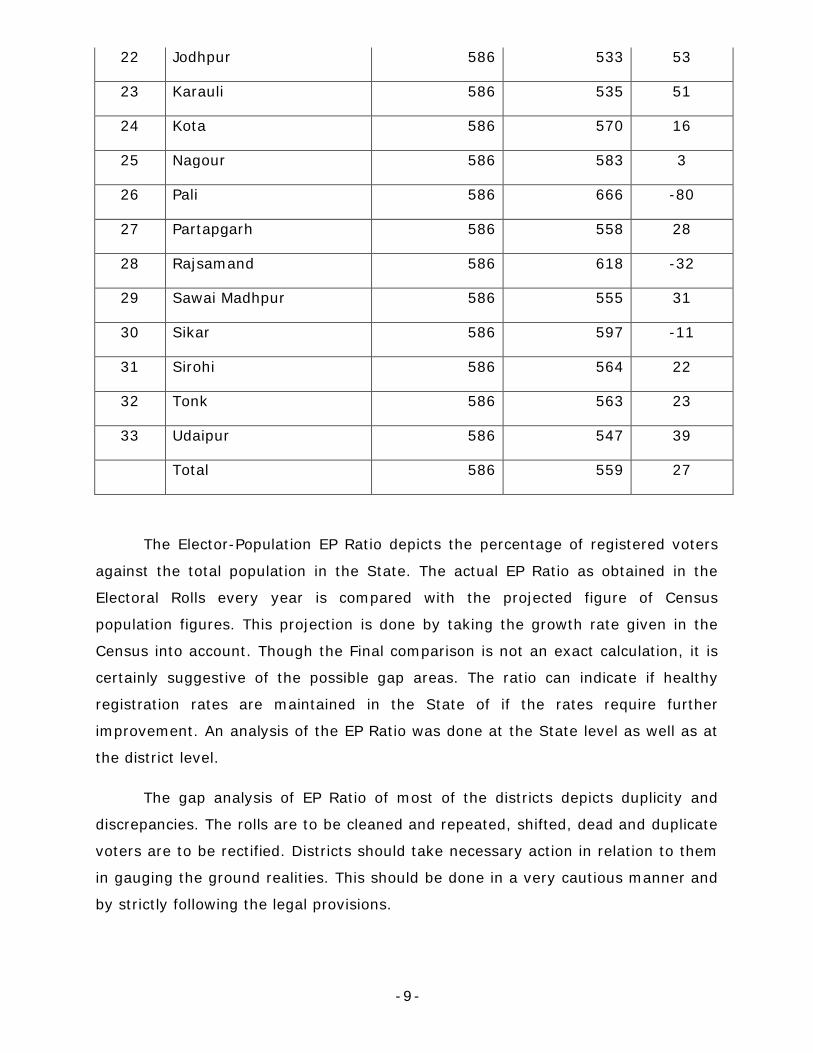
22 Jodhpur 586 533 53
23 Karauli 586 535 51
24 Kota 586 570 16
25 Nagour 586 583 3
26 Pali 586 666 -80
27 Partapgarh 586 558 28
28 Rajsamand 586 618 -32
29 Sawai Madhpur 586 555 31
30 Sikar 586 597 -11
31 Sirohi 586 564 22
32 Tonk 586 563 23
33 Udaipur 586 547 39
Total 586 559 27
The Elector-Population EP Ratio depicts the percentage of registered voters
against the total population in the State. The actual EP Ratio as obtained in the
Electoral Rolls every year is compared with the projected figure of Census
population figures. This projection is done by taking the growth rate given in the
Census into account. Though the Final comparison is not an exact calculation, it is
certainly suggestive of the possible gap areas. The ratio can indicate if healthy
registration rates are maintained in the State of if the rates require further
improvement. An analysis of the EP Ratio was done at the State level as well as at
the district level.
The gap analysis of EP Ratio of most of the districts depicts duplicity and
discrepancies. The rolls are to be cleaned and repeated, shifted, dead and duplicate
voters are to be rectified. Districts should take necessary action in relation to them
in gauging the ground realities. This should be done in a very cautious manner and
by strictly following the legal provisions.
- 10 -
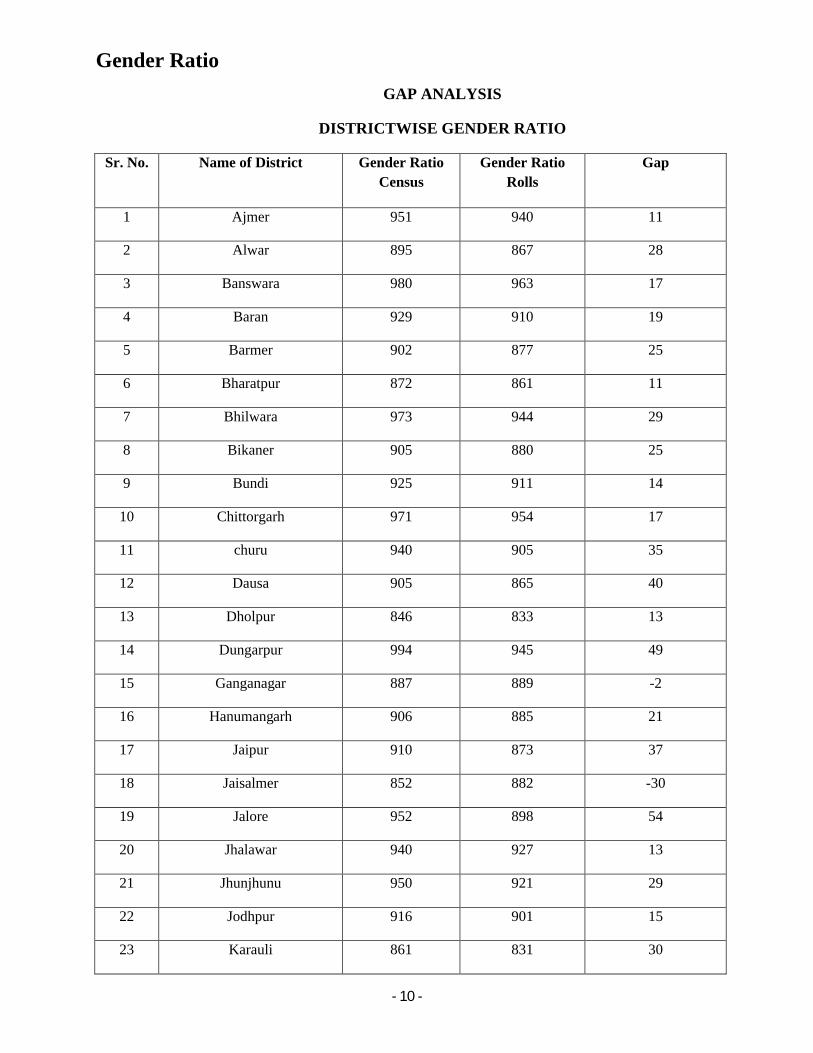
Gender Ratio
GAP ANALYSIS
DISTRICTWISE GENDER RATIO
Sr. No. Name of District Gender Ratio Census
Gender Ratio Rolls
Gap
1 Ajmer 951 940 11
2 Alwar 895 867 28
3 Banswara 980 963 17
4 Baran 929 910 19
5 Barmer 902 877 25
6 Bharatpur 872 861 11
7 Bhilwara 973 944 29
8 Bikaner 905 880 25
9 Bundi 925 911 14
10 Chittorgarh 971 954 17
11 churu 940 905 35
12 Dausa 905 865 40
13 Dholpur 846 833 13
14 Dungarpur 994 945 49
15 Ganganagar 887 889 -2
16 Hanumangarh 906 885 21
17 Jaipur 910 873 37
18 Jaisalmer 852 882 -30
19 Jalore 952 898 54
20 Jhalawar 940 927 13
21 Jhunjhunu 950 921 29
22 Jodhpur 916 901 15
23 Karauli 861 831 30

- 11 -
24 Kota 912 905 7
25 Nagour 950 897 53
26 Pali 987 906 81
27 Partapgarh 987 961 26
28 Rajsamand 990 948 42
29 Sawai Madhpur 897 841 56
30 Sikar 947 875 72
31 Sirohi 940 886 54
32 Tonk 952 911 41
33 Udaipur 955 947 8
Total 928 899 29
The sex ratio in the ratio of males to the females in a population and
calculated as the number of females per 1000 males. It is a sort of socio-
demographic pointer on the balance between men and women in the population.
Rajasthan, like most of the other States in India has a lower sex ratio than national
average.
The gender ratio of rolls is less than the gender ratio of census by 29 points.
This shows that a good numbers of female voters is still left out of the rolls. The
same trend is seen in all districts except Ganganagar and Jaisalmer which shows
more female voter registration than female population of districts. But, this cannot
be seen in isolation it has socio-economic and cultural context. The gap has shown
female as the group who registered his least present in the electoral process for
various pertaining reasons. Our plan would give a major thrust to tuning this in the
inclusive circumference of voter registration and in voter turnout.
- 12 -
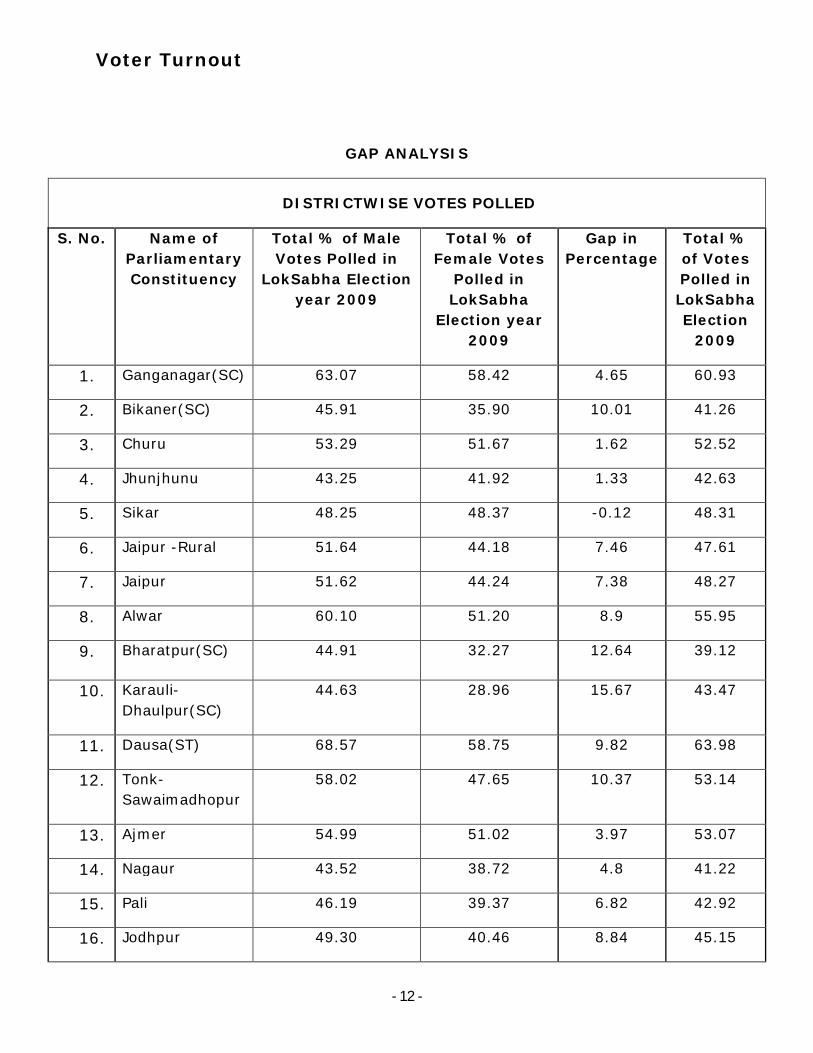
Voter Turnout
GAP ANALYSIS
DISTRICTWISE VOTES POLLED
S. No. Name of Parliamentary Constituency
Total % of Male Votes Polled in
LokSabha Election year 2009
Total % of Female Votes
Polled in LokSabha
Election year 2009
Gap in Percentage
Total % of Votes Polled in LokSabha Election
2009
1. Ganganagar(SC) 63.07 58.42 4.65 60.93
2. Bikaner(SC) 45.91 35.90 10.01 41.26
3. Churu 53.29 51.67 1.62 52.52
4. Jhunjhunu 43.25 41.92 1.33 42.63
5. Sikar 48.25 48.37 -0.12 48.31
6. Jaipur -Rural 51.64 44.18 7.46 47.61
7. Jaipur 51.62 44.24 7.38 48.27
8. Alwar 60.10 51.20 8.9 55.95
9. Bharatpur(SC) 44.91 32.27 12.64 39.12
10. Karauli-Dhaulpur(SC)
44.63 28.96 15.67 43.47
11. Dausa(ST) 68.57 58.75 9.82 63.98
12. Tonk-Sawaimadhopur
58.02 47.65 10.37 53.14
13. Ajmer 54.99 51.02 3.97 53.07
14. Nagaur 43.52 38.72 4.8 41.22
15. Pali 46.19 39.37 6.82 42.92
16. Jodhpur 49.30 40.46 8.84 45.15
- 13 -
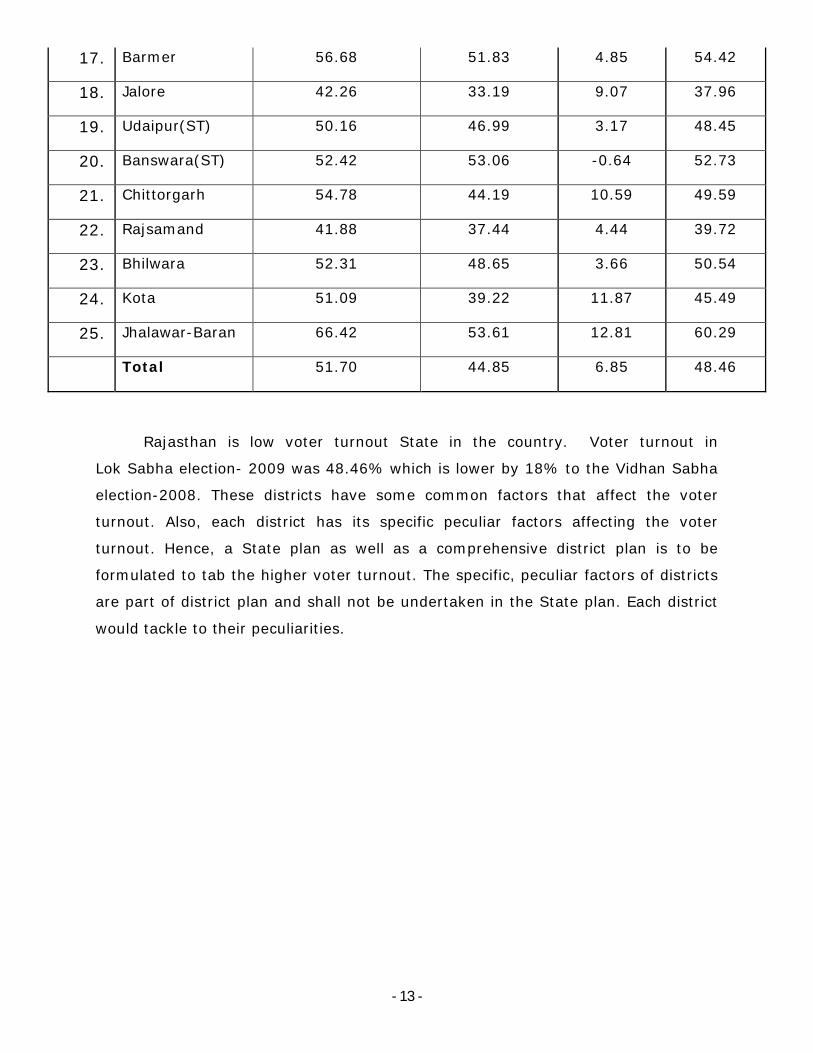
Rajasthan is low voter turnout State in the country. Voter turnout in
Lok Sabha election- 2009 was 48.46% which is lower by 18% to the Vidhan Sabha
election-2008. These districts have some common factors that affect the voter
turnout. Also, each district has its specific peculiar factors affecting the voter
turnout. Hence, a State plan as well as a comprehensive district plan is to be
formulated to tab the higher voter turnout. The specific, peculiar factors of districts
are part of district plan and shall not be undertaken in the State plan. Each district
would tackle to their peculiarities.
17. Barmer 56.68 51.83 4.85 54.42
18. Jalore 42.26 33.19 9.07 37.96
19. Udaipur(ST) 50.16 46.99 3.17 48.45
20. Banswara(ST) 52.42 53.06 -0.64 52.73
21. Chittorgarh 54.78 44.19 10.59 49.59
22. Rajsamand 41.88 37.44 4.44 39.72
23. Bhilwara 52.31 48.65 3.66 50.54
24. Kota 51.09 39.22 11.87 45.49
25. Jhalawar-Baran 66.42 53.61 12.81 60.29
Total 51.70 44.85 6.85 48.46
- 14 -
Literacy Rate
As per census of India 2011, the literacy rate of India is 74.04% with a vast
gap between male and female literacy rates and between rural and urban literacy
rates as well. In rural India, the literacy rate is 68.91% and in urban India, it is
84.98%.
The literacy rate of the State is 67.06%, male literacy rate is 80.51% female.
However, the rural-urban gap and male-female gap exists in Rajasthan too. The
gap between male and female literacy rate is 27.85% which effects the democratic
participation of the females. Rajasthan falls in the low literacy rate which reflects on
the electoral participation and behavioral pattern of the voters. The literacy rate
does have an impact on the democratic participation process. Therefore, an
assessment of literacy rate is necessary to understand what kind of interventions
for voters' education is required in districts with comparatively low literacy rates.
SVEEP activities in such districts have to be designed in a manner that they are
understood by voters who are illiterate or semi-literate.
12 districts of the State where higher literacy rate than the State literacy
rate. More than 58% of the State lacks behind in the literacy rate. So, major thrust
area related to voters behavior and awareness is to be harnessed by stressing the
voter information, awareness and education programmes.
The lower higher literacy rates both affects the pattern and behavior of the
voters in their respective moulds. This factor should be taken by districts while
preparing their plans.
- 15 -
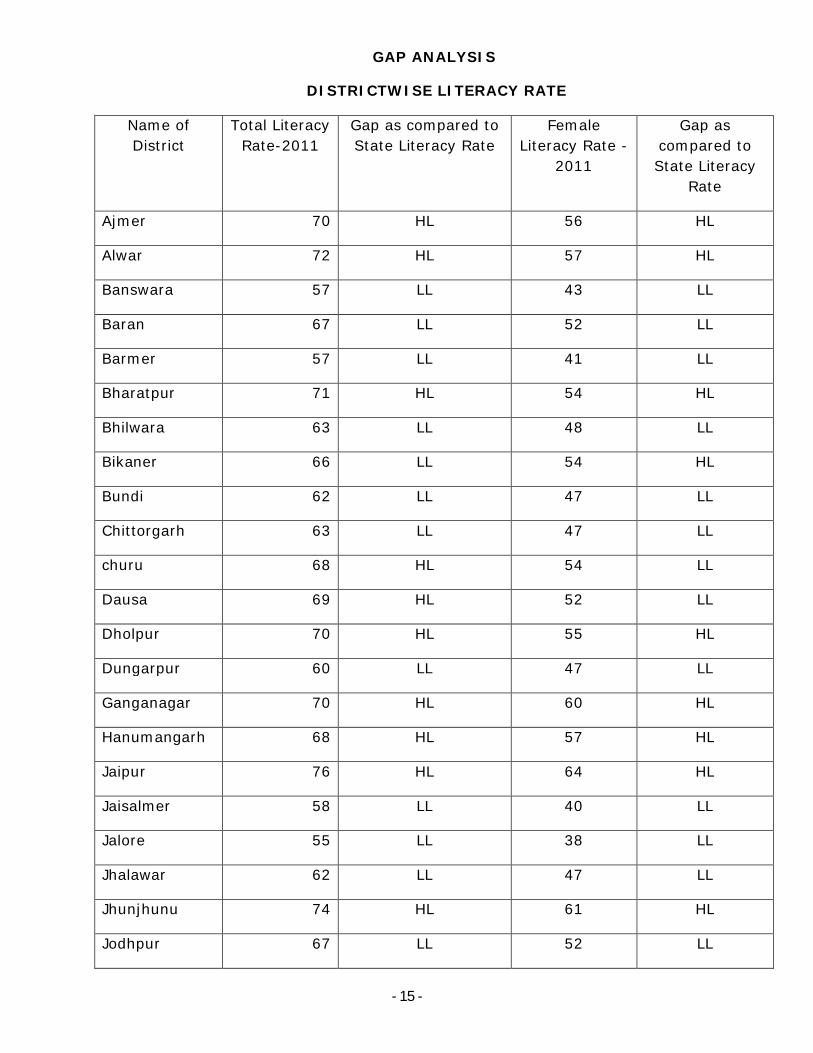
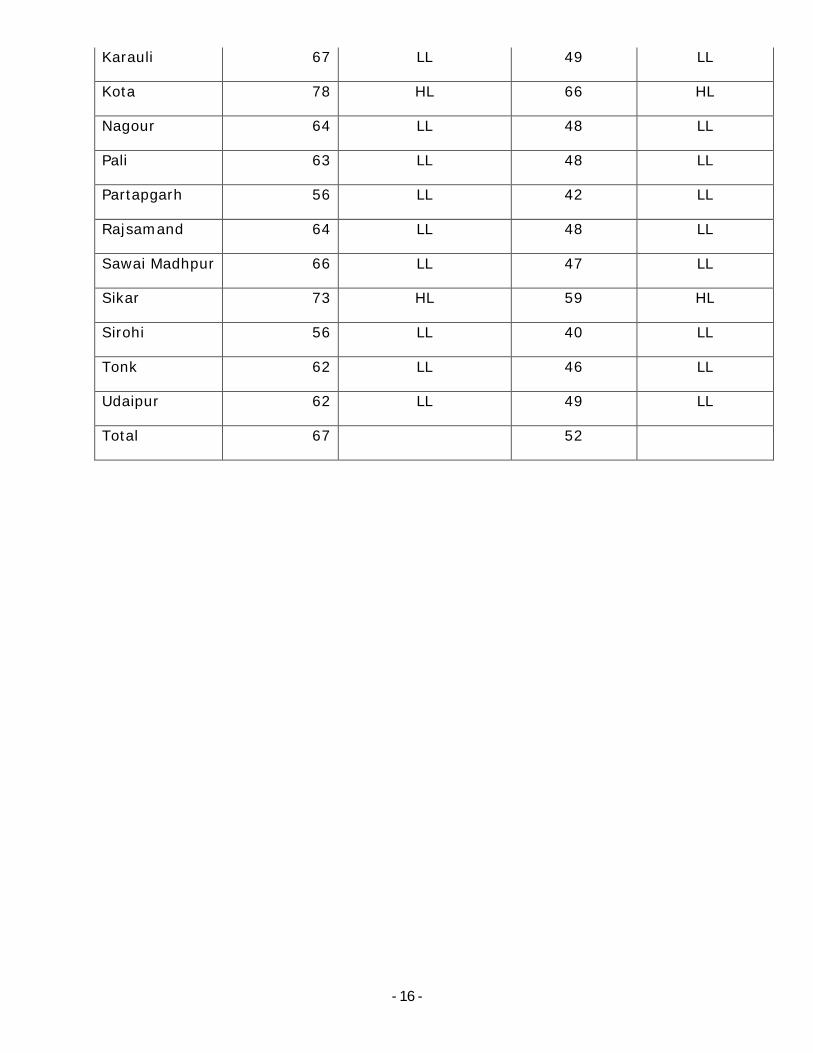
GAP ANALYSIS
DISTRICTWISE LITERACY RATE
Name of District
Total Literacy Rate-2011
Gap as compared to State Literacy Rate
Female Literacy Rate -
2011
Gap as compared to State Literacy
Rate
Ajmer 70 HL 56 HL
Alwar 72 HL 57 HL
Banswara 57 LL 43 LL
Baran 67 LL 52 LL
Barmer 57 LL 41 LL
Bharatpur 71 HL 54 HL
Bhilwara 63 LL 48 LL
Bikaner 66 LL 54 HL
Bundi 62 LL 47 LL
Chittorgarh 63 LL 47 LL
churu 68 HL 54 LL
Dausa 69 HL 52 LL
Dholpur 70 HL 55 HL
Dungarpur 60 LL 47 LL
Ganganagar 70 HL 60 HL
Hanumangarh 68 HL 57 HL
Jaipur 76 HL 64 HL
Jaisalmer 58 LL 40 LL
Jalore 55 LL 38 LL
Jhalawar 62 LL 47 LL
Jhunjhunu 74 HL 61 HL
Jodhpur 67 LL 52 LL
- 16 -
Karauli 67 LL 49 LL
Kota 78 HL 66 HL
Nagour 64 LL 48 LL
Pali 63 LL 48 LL
Partapgarh 56 LL 42 LL
Rajsamand 64 LL 48 LL
Sawai Madhpur 66 LL 47 LL
Sikar 73 HL 59 HL
Sirohi 56 LL 40 LL
Tonk 62 LL 46 LL
Udaipur 62 LL 49 LL
Total 67 52
- 17 -
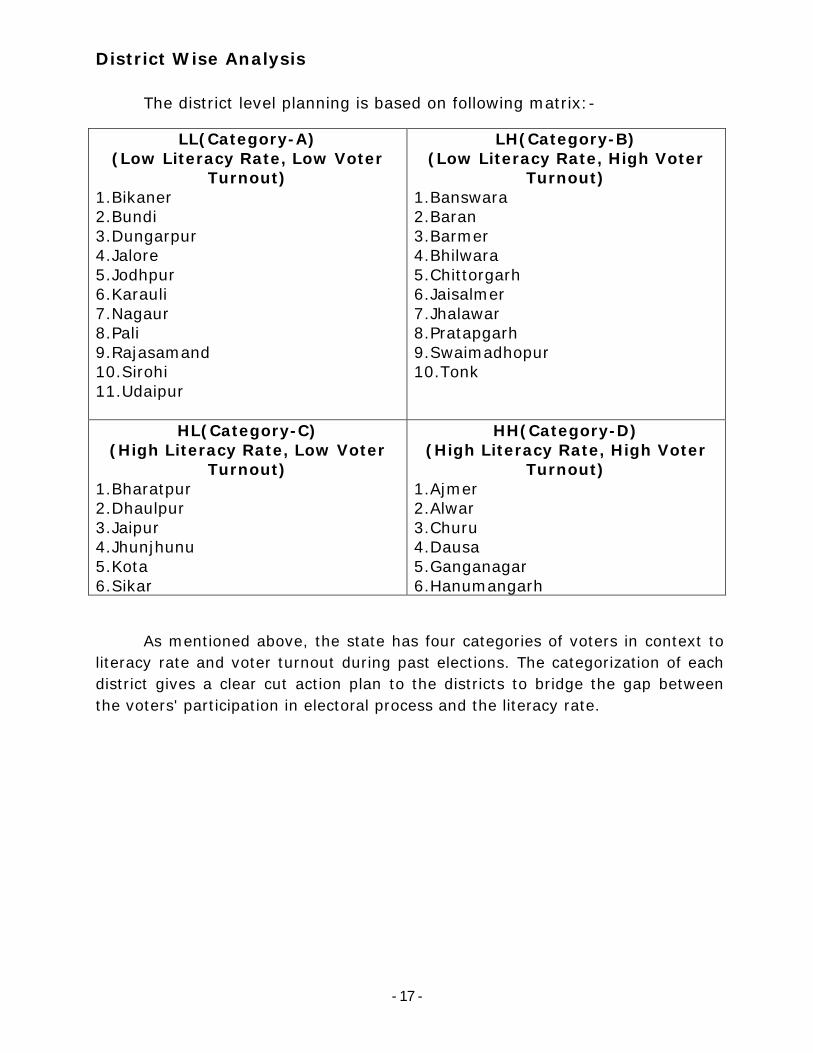
District Wise Analysis
The district level planning is based on following matrix:-
LL(Category-A)(Low Literacy Rate, Low Voter
Turnout)1.Bikaner2.Bundi3.Dungarpur4.Jalore5.Jodhpur6.Karauli7.Nagaur8.Pali9.Rajasamand10.Sirohi11.Udaipur
LH(Category-B)(Low Literacy Rate, High Voter
Turnout)1.Banswara2.Baran3.Barmer4.Bhilwara5.Chittorgarh6.Jaisalmer7.Jhalawar8.Pratapgarh9.Swaimadhopur10.Tonk
HL(Category-C)(High Literacy Rate, Low Voter
Turnout)1.Bharatpur2.Dhaulpur3.Jaipur4.Jhunjhunu5.Kota6.Sikar
HH(Category-D)(High Literacy Rate, High Voter
Turnout)1.Ajmer2.Alwar3.Churu4.Dausa5.Ganganagar6.Hanumangarh
As mentioned above, the state has four categories of voters in context to literacy rate and voter turnout during past elections. The categorization of each district gives a clear cut action plan to the districts to bridge the gap between the voters' participation in electoral process and the literacy rate.
- 18 -
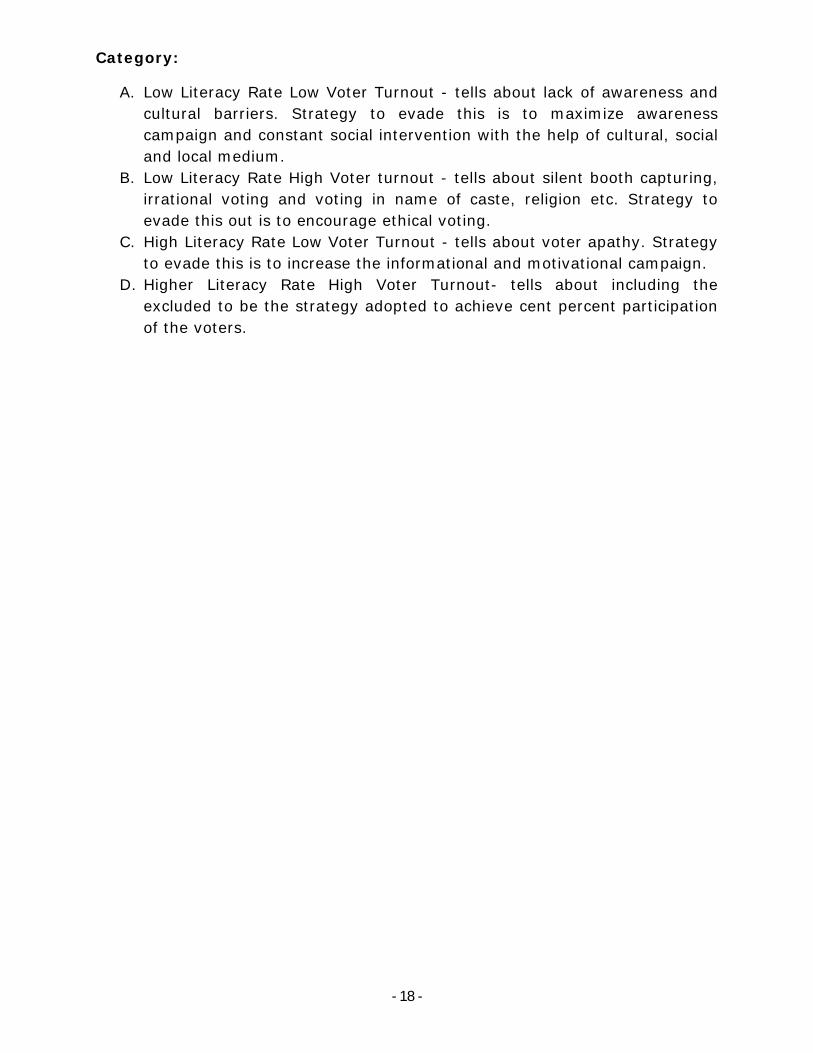
Category:
A. Low Literacy Rate Low Voter Turnout - tells about lack of awareness and cultural barriers. Strategy to evade this is to maximize awareness campaign and constant social intervention with the help of cultural, social and local medium.
B. Low Literacy Rate High Voter turnout - tells about silent booth capturing, irrational voting and voting in name of caste, religion etc. Strategy to evade this out is to encourage ethical voting.
C. High Literacy Rate Low Voter Turnout - tells about voter apathy. Strategy to evade this is to increase the informational and motivational campaign.
D. Higher Literacy Rate High Voter Turnout- tells about including the excluded to be the strategy adopted to achieve cent percent participation of the voters.
- 19 -
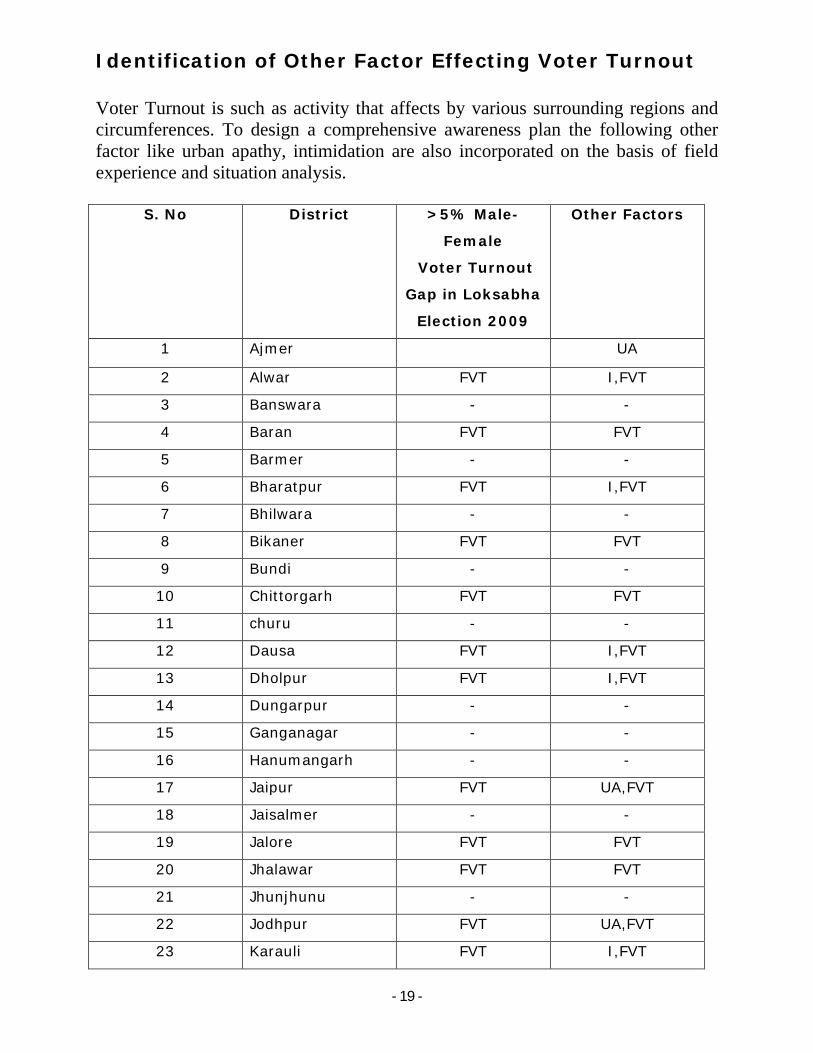
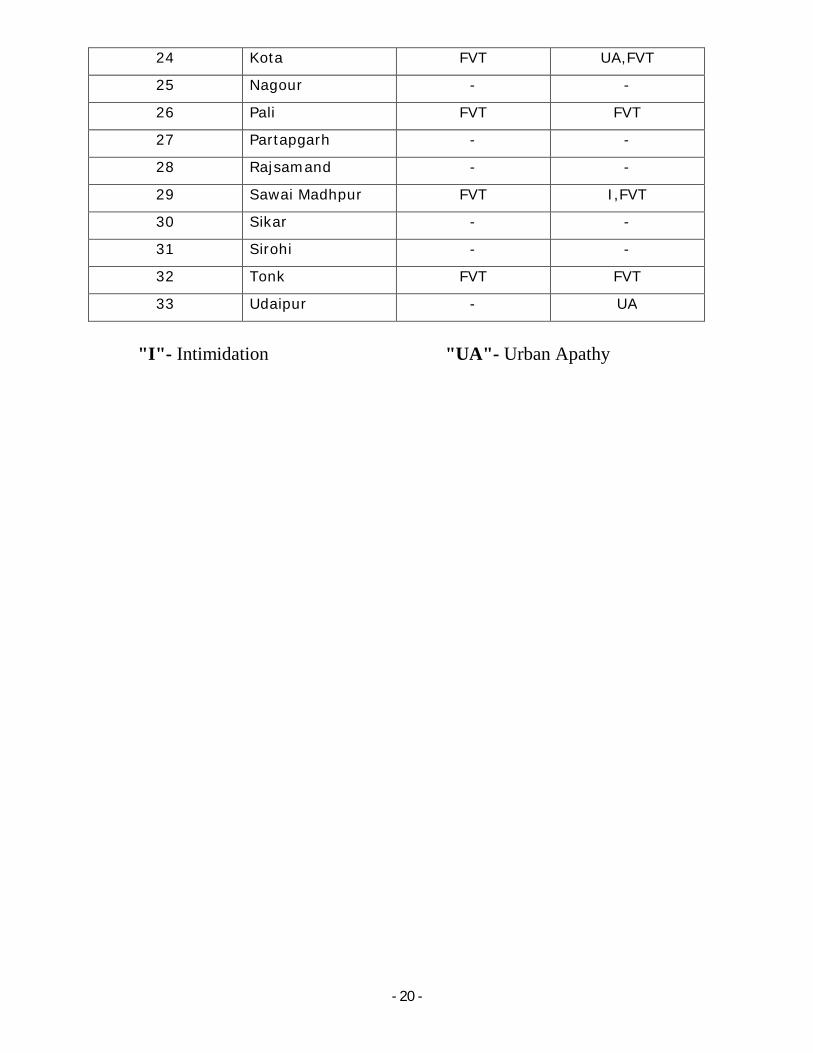
Identification of Other Factor Effecting Voter Turnout
Voter Turnout is such as activity that affects by various surrounding regions and circumferences. To design a comprehensive awareness plan the following other factor like urban apathy, intimidation are also incorporated on the basis of field experience and situation analysis.
S. No District >5% Male-
Female
Voter Turnout
Gap in Loksabha
Election 2009
Other Factors
1 Ajmer UA
2 Alwar FVT I,FVT
3 Banswara - -
4 Baran FVT FVT
5 Barmer - -
6 Bharatpur FVT I,FVT
7 Bhilwara - -
8 Bikaner FVT FVT
9 Bundi - -
10 Chittorgarh FVT FVT
11 churu - -
12 Dausa FVT I,FVT
13 Dholpur FVT I,FVT
14 Dungarpur - -
15 Ganganagar - -
16 Hanumangarh - -
17 Jaipur FVT UA,FVT
18 Jaisalmer - -
19 Jalore FVT FVT
20 Jhalawar FVT FVT
21 Jhunjhunu - -
22 Jodhpur FVT UA,FVT
23 Karauli FVT I,FVT
- 20 -
24 Kota FVT UA,FVT
25 Nagour - -
26 Pali FVT FVT
27 Partapgarh - -
28 Rajsamand - -
29 Sawai Madhpur FVT I,FVT
30 Sikar - -
31 Sirohi - -
32 Tonk FVT FVT
33 Udaipur - UA
"I"- Intimidation "UA"- Urban Apathy
- 21 -
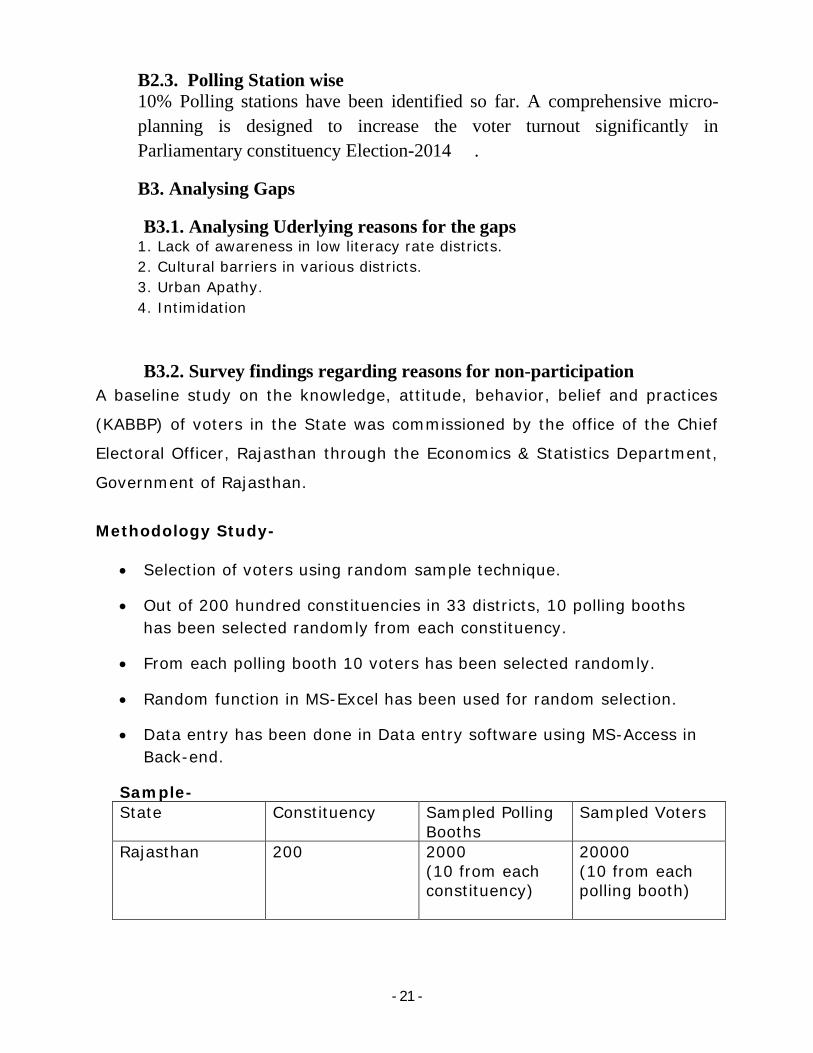
B2.3. Polling Station wise10% Polling stations have been identified so far. A comprehensive micro-planning is designed to increase the voter turnout significantly in Parliamentary constituency Election-2014 .
B3. Analysing Gaps
B3.1. Analysing Uderlying reasons for the gaps1. Lack of awareness in low literacy rate districts.2. Cultural barriers in various districts.3. Urban Apathy.4. Intimidation
B3.2. Survey findings regarding reasons for non-participationA baseline study on the knowledge, attitude, behavior, belief and practices
(KABBP) of voters in the State was commissioned by the office of the Chief
Electoral Officer, Rajasthan through the Economics & Statistics Department,
Government of Rajasthan.
Methodology Study-
Selection of voters using random sample technique.
Out of 200 hundred constituencies in 33 districts, 10 polling booths has been selected randomly from each constituency.
From each polling booth 10 voters has been selected randomly.
Random function in MS-Excel has been used for random selection.
Data entry has been done in Data entry software using MS-Access in Back-end.
Sample-State Constituency Sampled Polling
BoothsSampled Voters
Rajasthan 200 2000(10 from each constituency)
20000(10 from each polling booth)
- 22 -
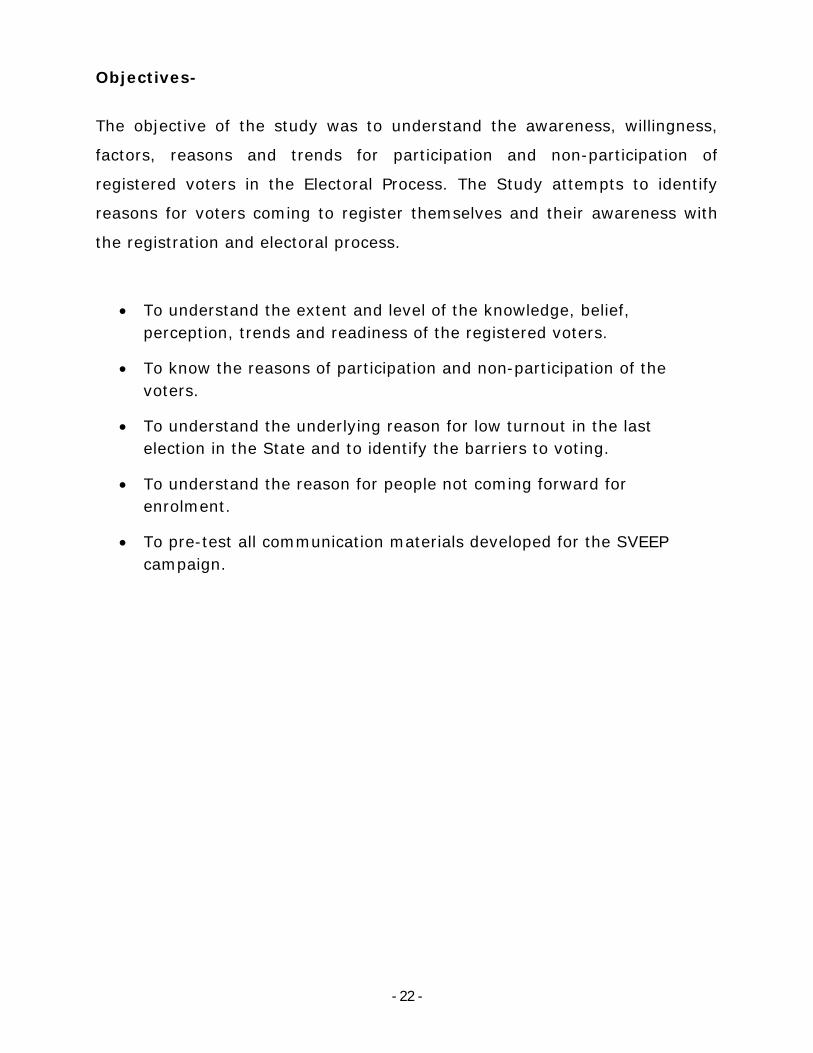
Objectives-
The objective of the study was to understand the awareness, willingness,
factors, reasons and trends for participation and non-participation of
registered voters in the Electoral Process. The Study attempts to identify
reasons for voters coming to register themselves and their awareness with
the registration and electoral process.
To understand the extent and level of the knowledge, belief, perception, trends and readiness of the registered voters.
To know the reasons of participation and non-participation of the voters.
To understand the underlying reason for low turnout in the last election in the State and to identify the barriers to voting.
To understand the reason for people not coming forward for enrolment.
To pre-test all communication materials developed for the SVEEP campaign.
- 23 -
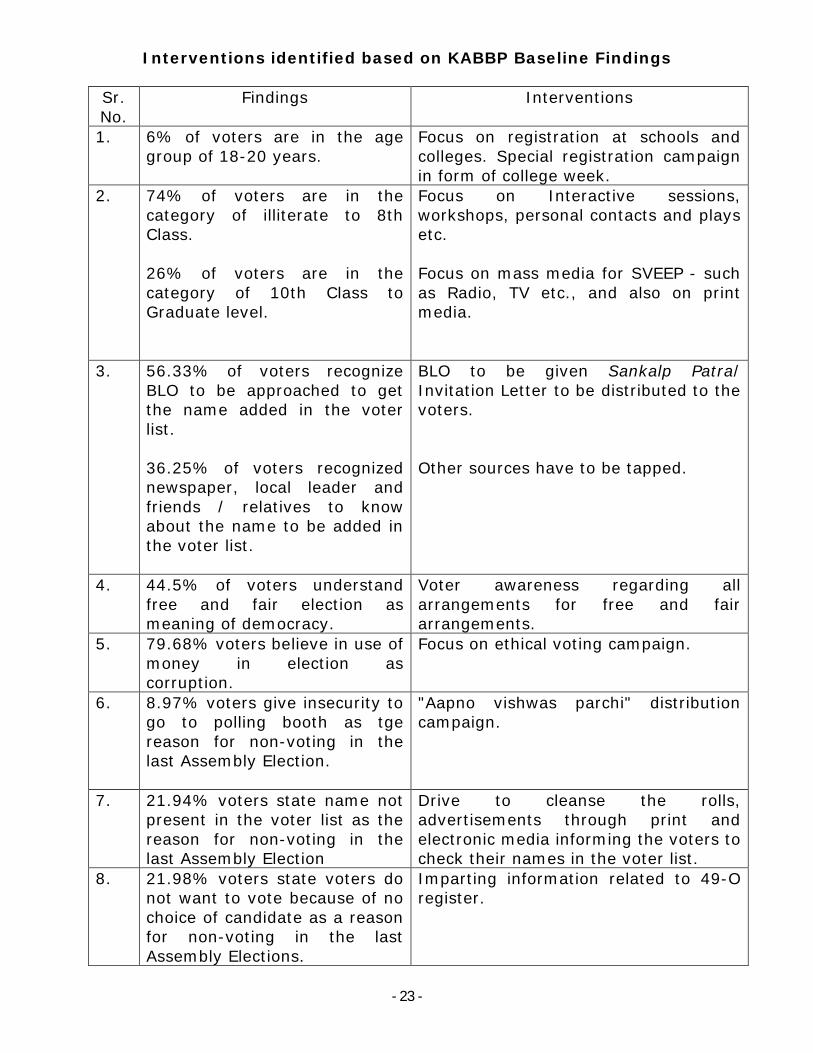
Interventions identified based on KABBP Baseline Findings
Sr. No.
Findings Interventions
1. 6% of voters are in the age group of 18-20 years.
Focus on registration at schools and colleges. Special registration campaignin form of college week.
2. 74% of voters are in the category of illiterate to 8th Class.
26% of voters are in the category of 10th Class to Graduate level.
Focus on Interactive sessions, workshops, personal contacts and plays etc.
Focus on mass media for SVEEP - such as Radio, TV etc., and also on print media.
3. 56.33% of voters recognize BLO to be approached to get the name added in the voter list.
36.25% of voters recognized newspaper, local leader and friends / relatives to know about the name to be added in the voter list.
BLO to be given Sankalp Patra/ Invitation Letter to be distributed to the voters.
Other sources have to be tapped.
4. 44.5% of voters understand free and fair election as meaning of democracy.
Voter awareness regarding all arrangements for free and fair arrangements.
5. 79.68% voters believe in use of money in election as corruption.
Focus on ethical voting campaign.
6. 8.97% voters give insecurity to go to polling booth as tgereason for non-voting in the last Assembly Election.
"Aapno vishwas parchi" distribution campaign.
7. 21.94% voters state name not present in the voter list as the reason for non-voting in the last Assembly Election
Drive to cleanse the rolls, advertisements through print and electronic media informing the voters to check their names in the voter list.
8. 21.98% voters state voters do not want to vote because of no choice of candidate as a reason for non-voting in the last Assembly Elections.
Imparting information related to 49-O register.
- 24 -
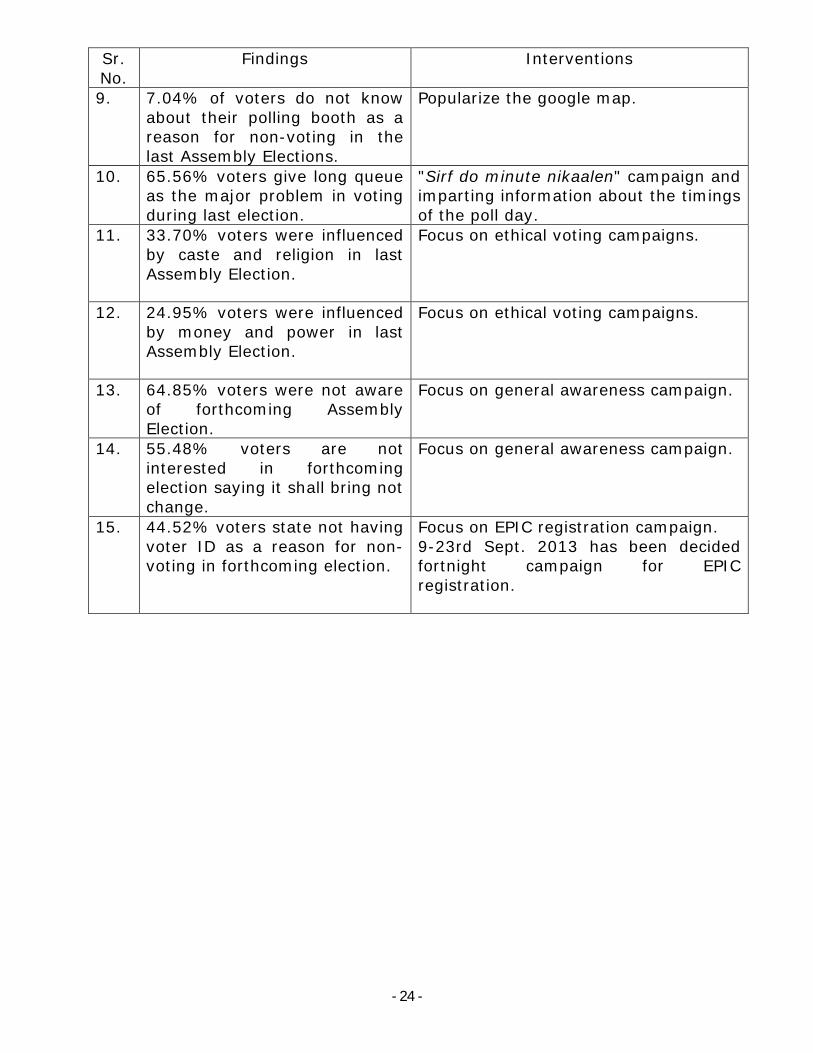
Sr. No.
Findings Interventions
9. 7.04% of voters do not know about their polling booth as a reason for non-voting in the last Assembly Elections.
Popularize the google map.
10. 65.56% voters give long queue as the major problem in voting during last election.
"Sirf do minute nikaalen" campaign and imparting information about the timings of the poll day.
11. 33.70% voters were influenced by caste and religion in last Assembly Election.
Focus on ethical voting campaigns.
12. 24.95% voters were influenced by money and power in last Assembly Election.
Focus on ethical voting campaigns.
13. 64.85% voters were not aware of forthcoming Assembly Election.
Focus on general awareness campaign.
14. 55.48% voters are not interested in forthcoming election saying it shall bring not change.
Focus on general awareness campaign.
15. 44.52% voters state not having voter ID as a reason for non-voting in forthcoming election.
Focus on EPIC registration campaign. 9-23rd Sept. 2013 has been decided fortnight campaign for EPIC registration.
- 25 -
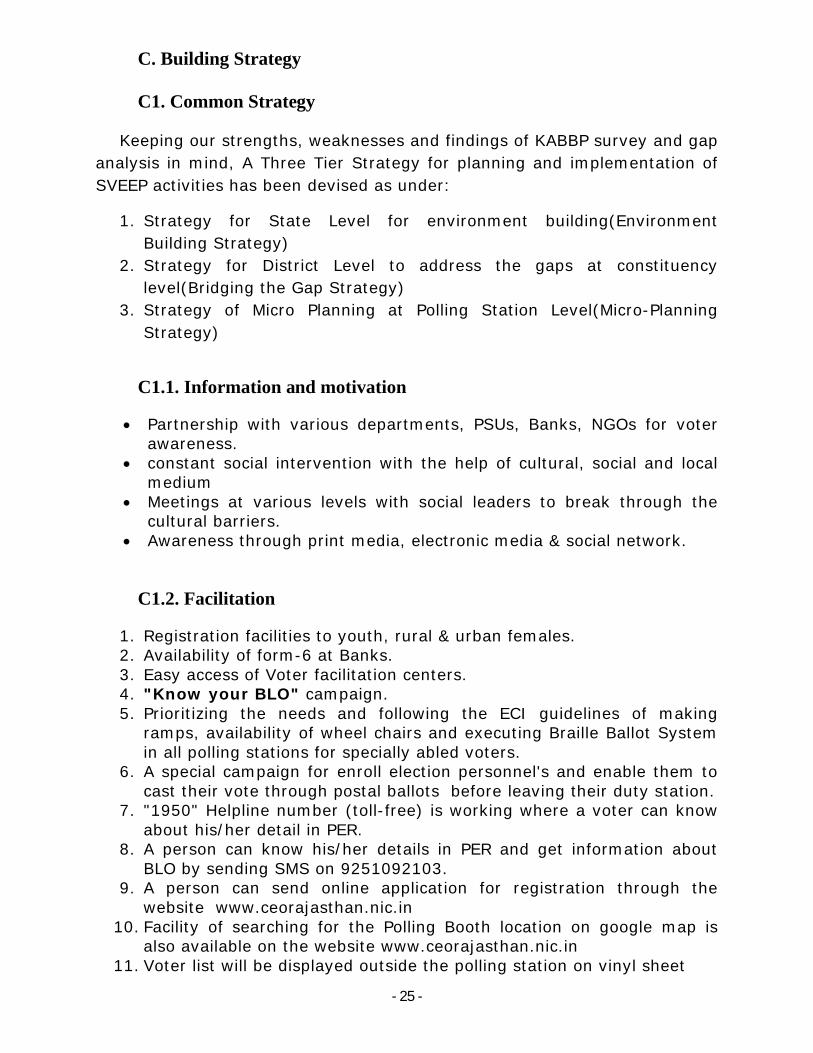
C. Building Strategy
C1. Common Strategy
Keeping our strengths, weaknesses and findings of KABBP survey and gap analysis in mind, A Three Tier Strategy for planning and implementation of SVEEP activities has been devised as under:
1. Strategy for State Level for environment building(Environment Building Strategy)
2. Strategy for District Level to address the gaps at constituency level(Bridging the Gap Strategy)
3. Strategy of Micro Planning at Polling Station Level(Micro-Planning Strategy)
C1.1. Information and motivation
Partnership with various departments, PSUs, Banks, NGOs for voter awareness.
constant social intervention with the help of cultural, social and local medium
Meetings at various levels with social leaders to break through the cultural barriers.
Awareness through print media, electronic media & social network.
C1.2. Facilitation
1. Registration facilities to youth, rural & urban females.2. Availability of form-6 at Banks.3. Easy access of Voter facilitation centers.4. "Know your BLO" campaign.5. Prioritizing the needs and following the ECI guidelines of making
ramps, availability of wheel chairs and executing Braille Ballot System in all polling stations for specially abled voters.
6. A special campaign for enroll election personnel's and enable them to cast their vote through postal ballots before leaving their duty station.
7. "1950" Helpline number (toll-free) is working where a voter can know about his/her detail in PER.
8. A person can know his/her details in PER and get information about BLO by sending SMS on 9251092103.
9. A person can send online application for registration through the website www.ceorajasthan.nic.in
10. Facility of searching for the Polling Booth location on google map is also available on the website www.ceorajasthan.nic.in
11. Voter list will be displayed outside the polling station on vinyl sheet
- 26 -
12. Distribution of EPIC cards to the newly registered voters on National Voters Day.
13. Display of EVMs at polling stations.14. 4013 voter facilitation centers are providing various facilities to the
voters across the state.
- 27 -
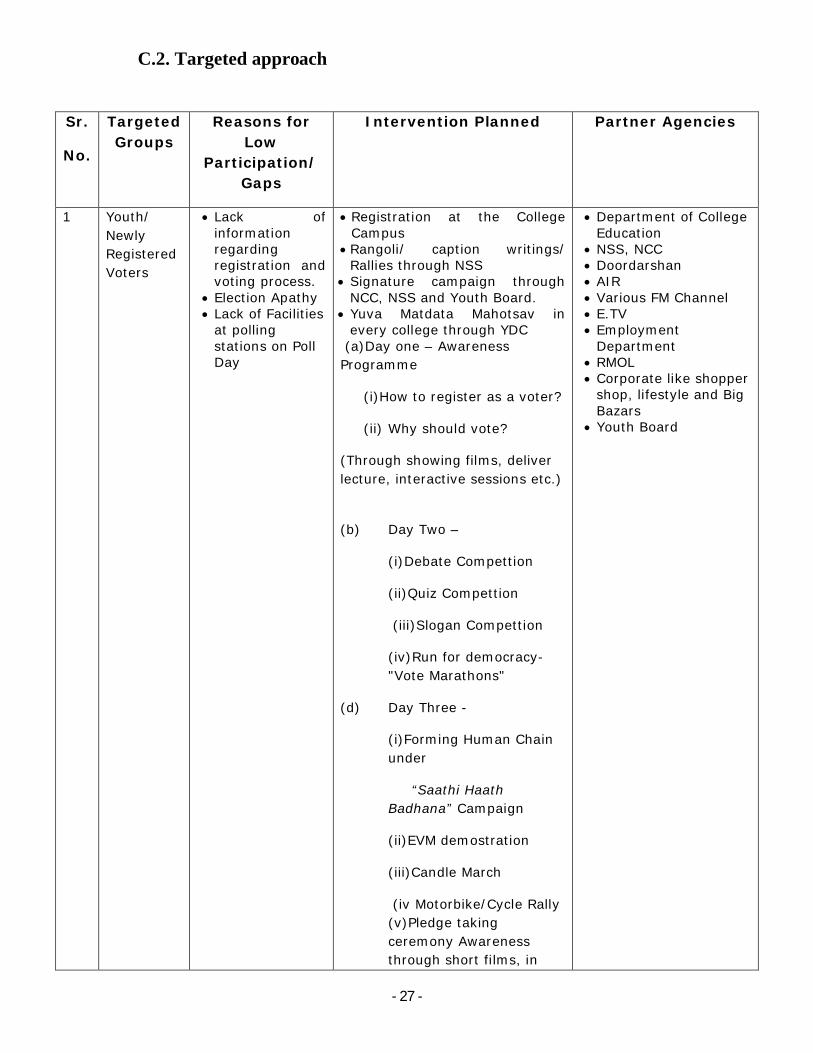
C.2. Targeted approach
Sr.
No.
TargetedGroups
Reasons for Low
Participation/ Gaps
Intervention Planned Partner Agencies
1 Youth/Newly Registered Voters
Lack of information regarding registration and voting process.
Election Apathy Lack of Facilities
at polling stations on Poll Day
Registration at the College Campus
Rangoli/ caption writings/ Rallies through NSS
Signature campaign through NCC, NSS and Youth Board.
Yuva Matdata Mahotsav in every college through YDC
(a)Day one – Awareness Programme
(i)How to register as a voter?
(ii) Why should vote?
(Through showing films, deliver lecture, interactive sessions etc.)
(b) Day Two –
(i)Debate Compettion
(ii)Quiz Compettion
(iii)Slogan Compettion
(iv)Run for democracy-"Vote Marathons"
(d) Day Three -
(i)Forming Human Chain under
“Saathi Haath Badhana” Campaign
(ii)EVM demostration
(iii)Candle March
(iv Motorbike/Cycle Rally (v)Pledge taking ceremony Awareness through short films, in
Department of College Education
NSS, NCC Doordarshan AIR Various FM Channel E.TV Employment
Department RMOL Corporate like shopper
shop, lifestyle and Big Bazars
Youth Board

- 28 -
various channels.
Facilitations through employment exchange and RMOL.
Various activities in Malls like Puppet Shows, interaction sessions with the customers, etc. to be conducted at malls in metropolitan cities under "Your vote counts" programme.
Various Mela's in Rajasthan with kiosk displaying EVM, Voter Registration Forms etc.
Activities. Advertisements in newspapers. Partnership with FM channel
specially targeting the youth population.
Display of posters (Youth Chala Booth), banners at Colleges, Schools, ATMs, Parks, Cinema Halls, Malls etc.
Film show, display of banner, posters of students at each SDCs (material shall be provided by SVEEP committee of concerned districts)
2. Women Cultural barriers Low literacy rate Women
inequality & apathy
Massive campaign taking into account the cultural and economic barriers through participation of SHG, UtthanSansthan, ... Women Federations.
A door-to-door campaign through AshaWorkers, ANGANWADI workers etc. as Matdata Sakhi.
Jagrati Rallies, workshops, quiz with in association with various women civil societies.
Advertisement in newspaper Display of Posters, Banners at
Subbji Mandi, Shopping Complexes, PHCs, CHCs, Anganwari Kendra etc.
Jingles on FM channels Films in popular in channels Fixing of posters/
stickers/slogan on fare price shops
Campaign through ANMs/ Aganwari workers on every MCHN day targeting women voters
Women rallies Street plays/ Folk Arts
competition
RGAVP Women
EmpowermentDeptt.
ICDS Rotary Club Women
Association Lions Club Women
Association CII Women
Association CA's Women
Association Jewelers women
Association Female voter rallies
through SHGs
- 29 -
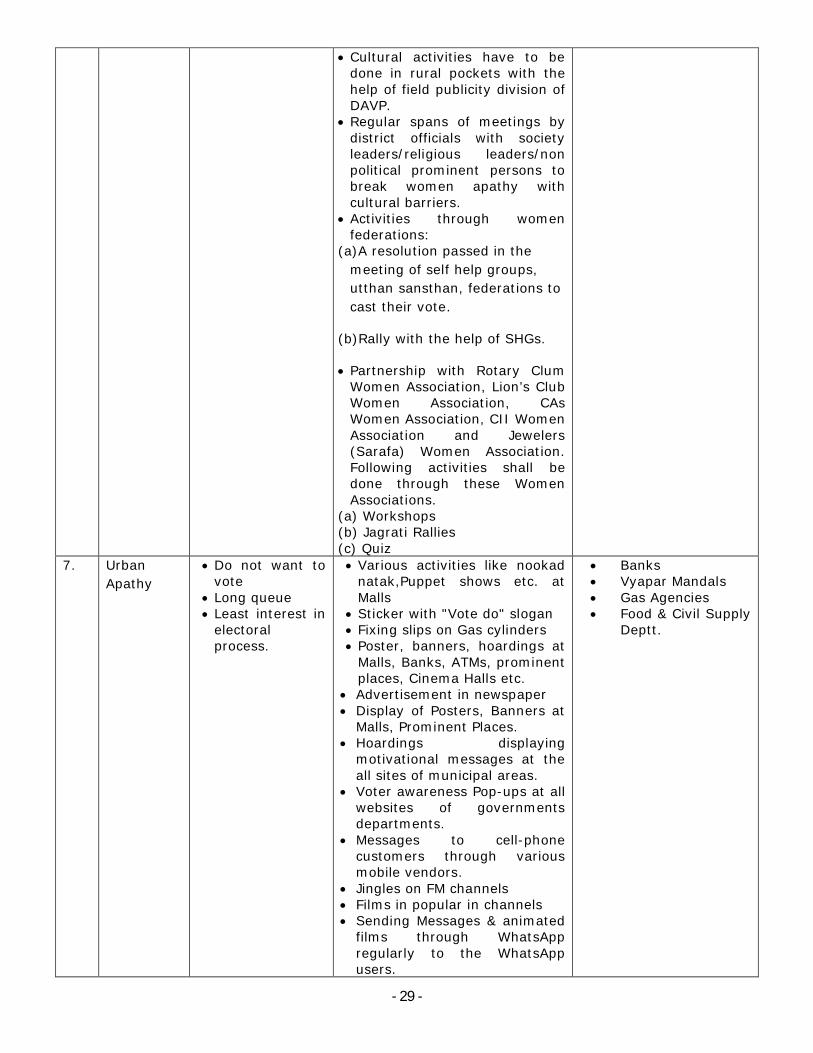
Cultural activities have to be done in rural pockets with the help of field publicity division of DAVP.
Regular spans of meetings by district officials with society leaders/religious leaders/non political prominent persons to break women apathy with cultural barriers.
Activities through women federations:
(a)A resolution passed in the meeting of self help groups, utthan sansthan, federations to cast their vote.
(b)Rally with the help of SHGs.
Partnership with Rotary Clum Women Association, Lion’s Club Women Association, CAs Women Association, CII Women Association and Jewelers (Sarafa) Women Association. Following activities shall be done through these Women Associations.
(a) Workshops (b) Jagrati Rallies(c) Quiz
7. Urban Apathy
Do not want to vote
Long queue Least interest in
electoral process.
Various activities like nookad natak,Puppet shows etc. at Malls
Sticker with "Vote do" slogan Fixing slips on Gas cylinders Poster, banners, hoardings at
Malls, Banks, ATMs, prominent places, Cinema Halls etc.
Advertisement in newspaper Display of Posters, Banners at
Malls, Prominent Places. Hoardings displaying
motivational messages at the all sites of municipal areas.
Voter awareness Pop-ups at all websites of governments departments.
Messages to cell-phone customers through various mobile vendors.
Jingles on FM channels Films in popular in channels Sending Messages & animated
films through WhatsApp regularly to the WhatsApp users.
Banks Vyapar Mandals Gas Agencies Food & Civil Supply
Deptt.
- 30 -
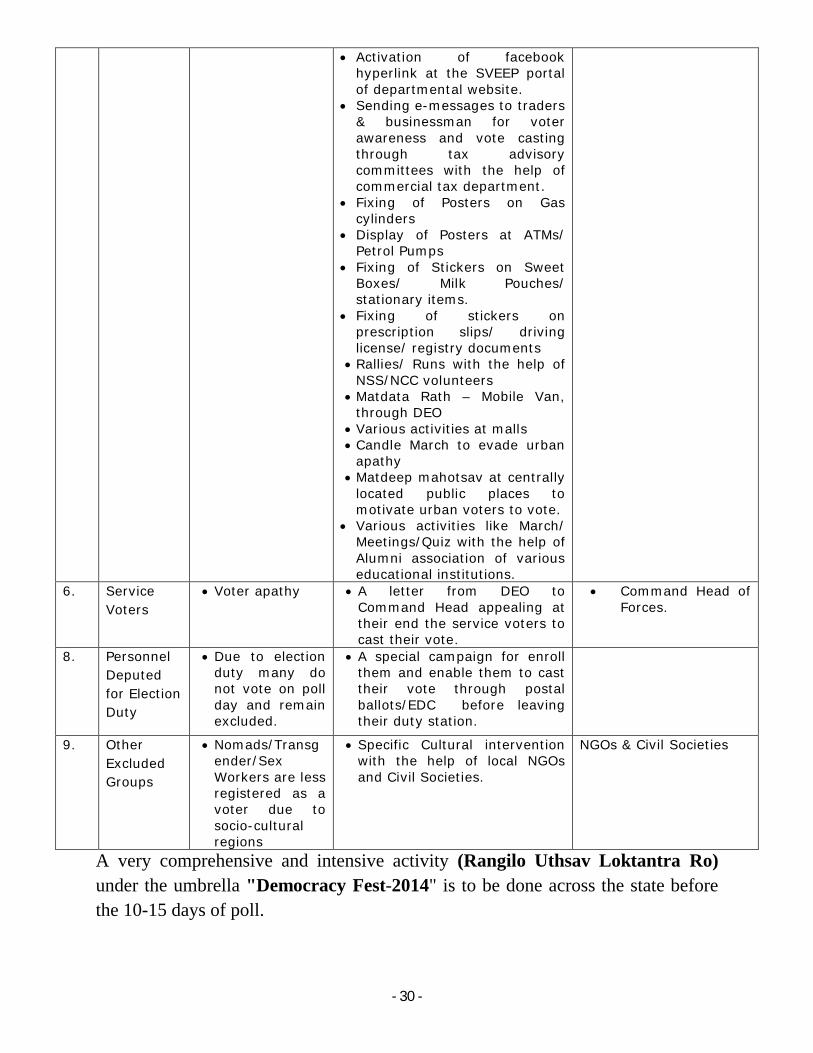
A very comprehensive and intensive activity (Rangilo Uthsav Loktantra Ro)under the umbrella "Democracy Fest-2014" is to be done across the state before the 10-15 days of poll.
Activation of facebook hyperlink at the SVEEP portal of departmental website.
Sending e-messages to traders & businessman for voter awareness and vote casting through tax advisory committees with the help of commercial tax department.
Fixing of Posters on Gas cylinders
Display of Posters at ATMs/ Petrol Pumps
Fixing of Stickers on Sweet Boxes/ Milk Pouches/ stationary items.
Fixing of stickers on prescription slips/ driving license/ registry documents
Rallies/ Runs with the help of NSS/NCC volunteers
Matdata Rath – Mobile Van, through DEO
Various activities at malls Candle March to evade urban
apathy Matdeep mahotsav at centrally
located public places to motivate urban voters to vote.
Various activities like March/ Meetings/Quiz with the help of Alumni association of various educational institutions.
6. Service Voters
Voter apathy A letter from DEO to Command Head appealing at their end the service voters to cast their vote.
Command Head of Forces.
8. PersonnelDeputed for Election Duty
Due to election duty many do not vote on poll day and remain excluded.
A special campaign for enroll them and enable them to cast their vote through postal ballots/EDC before leaving their duty station.
9. Other Excluded Groups
Nomads/Transgender/Sex Workers are less registered as a voter due to socio-cultural regions
Specific Cultural intervention with the help of local NGOs and Civil Societies.
NGOs & Civil Societies

- 31 -
D. Implementation
D.1. Team formation at District and State Hqs
District core committee is already constituted in all districts under the chairmanship of CEO (ZP). A nodal officer incharge of SVEEP is also appointed in all districts. The core committee is functioning under the guidance of District Election ofiicer. Dy. DEO is also engaged in the SVEEP activities on the behalf of DEO. The committee has proved fruitful for voter awareness programme in the district as the remarkable increase in voter turnout in assembly election-2013 specially for female voters is concern.
D.2. Training & Capacity Building of SVEEP Teams
Workshops and trainings at state & divisional level HQs will be organised in such a manner that district level officers (SVEEP) can comprehensively understand the theme & Objectives of SVEEP.
D.3. Building PartnershipThe success of Voter Awareness Programme is based on collective efforts, so the various Institutions are to be tapped for SVEEP activities. In this connection a comprehensive partnership with government departments,PSUs, Banks, Corporate Houses, CSOs, NGOs will be build at state level & district level both during the SVEEP Campaign.
D.4. Content Development
Content will be developed by state as well as district with the approval of ECI. SVEEP Portal is available as a common platform for sharing the content developed by districts.
D.5. Sankalp Patras / Pledge Letters and Invitation letters from CEO/DEO and other innovations
1. Sankalp Patra has played an important role for motivating the voters to vote and also proved a helpful tool to fetching the voters at polling station in Assembly election-2013. A record number of more than 60 lak Sankalp Patra were distributed and collected in assembly election-2013. Similarly in upcoming Loksabha Elections a huge number Sankalp Patra will be distributed and
- 32 -
collected from government schools & private schools well in time to encourage parents and elders of almost every family requested by their ward.
2. Invitation letter from DEOs with "yellow rice" will be sent to the families to invite them for casting their vote on poll day.
3. A letter from DEO to command heads appealing at their end the service voters to cast their vote.
D.6. Voter Slip
Voter Slip is one of the best tool to motivate the voters to vote. It helps to enhance the ethical voting specially in rural areas as they need not to go to the polling agent of any political parties for searching their name in PER. Approx more than 80% voters has used the voter slip in assembly election-2013. On the basis of experience of previous assembly election-2013the voter slip will be distributed to all voters 3 days before the date of poll.
E. Monitoring Mechanism
A SVEEP portal is designed for monitoring & sharing the information among the district.
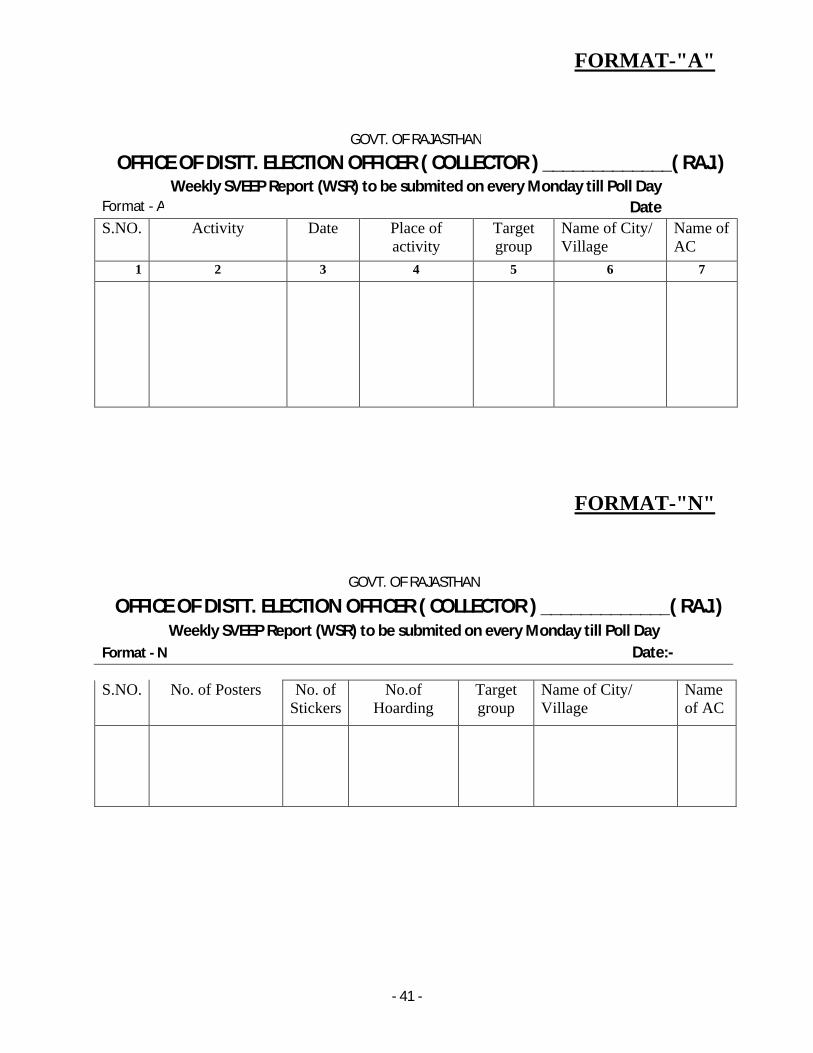
To monitor the district SVEEP activities fortnightly, Format-A & Format-N is developed.
F. Evaluation & Documentation
Evaluation & documentation will be done just after the poll. An agency will be hired for documentation in a professional manner. Every district is directed to upload each & every activity on SVEEP Portal so that all the material required for documentation will be available easily.
G. Calendar A detailed timeline action plan will be chalked out after the notification for Loksabha Eleciton-2014.
- 33 -
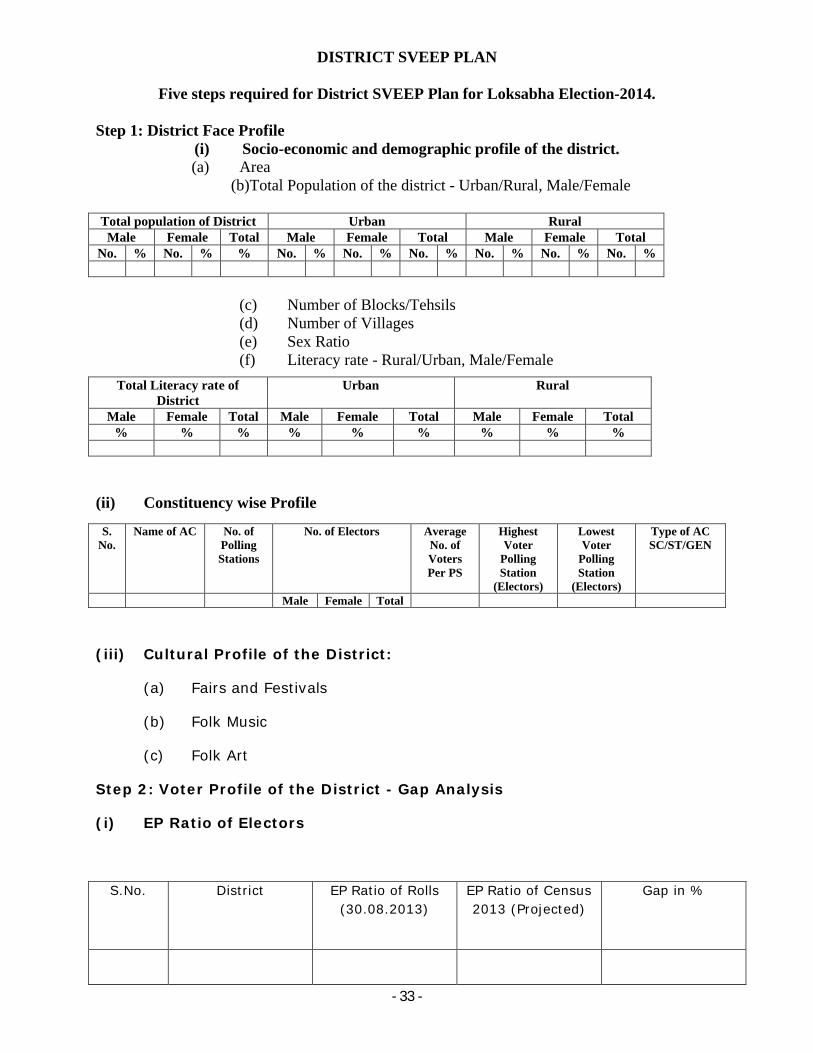
DISTRICT SVEEP PLAN
Five steps required for District SVEEP Plan for Loksabha Election-2014.
Step 1: District Face Profile(i) Socio-economic and demographic profile of the district.(a) Area
(b)Total Population of the district - Urban/Rural, Male/Female
Total population of District Urban RuralMale Female Total Male Female Total Male Female Total
No. % No. % % No. % No. % No. % No. % No. % No. %
(c) Number of Blocks/Tehsils(d) Number of Villages(e) Sex Ratio(f) Literacy rate - Rural/Urban, Male/Female
Total Literacy rate of District
Urban Rural
Male Female Total Male Female Total Male Female Total% % % % % % % % %
(ii) Constituency wise Profile
(iii) Cultural Profile of the District:
(a) Fairs and Festivals
(b) Folk Music
(c) Folk Art
Step 2: Voter Profile of the District - Gap Analysis
(i) EP Ratio of Electors
S.No. District EP Ratio of Rolls (30.08.2013)
EP Ratio of Census 2013 (Projected)
Gap in %
S.No.
Name of AC No. of Polling Stations
No. of Electors Average No. of Voters Per PS
Highest Voter
Polling Station
(Electors)
Lowest Voter
Polling Station
(Electors)
Type of ACSC/ST/GEN
Male Female Total
- 34 -
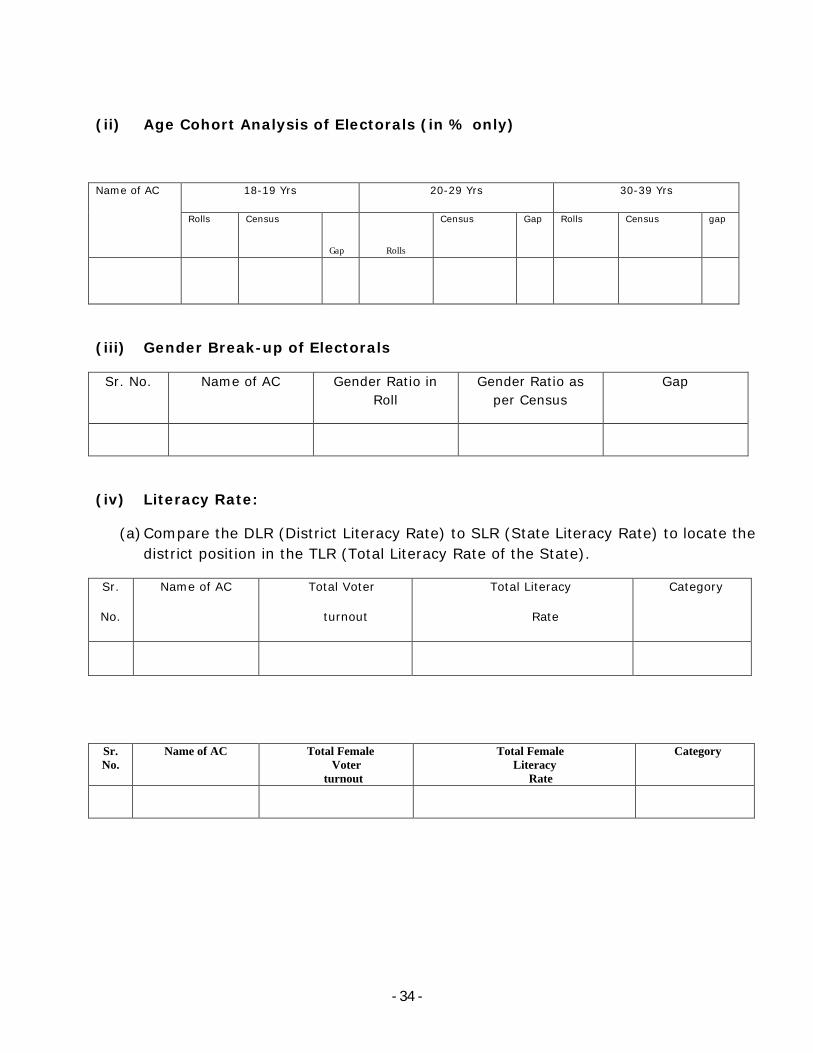
(ii) Age Cohort Analysis of Electorals (in % only)
Name of AC 18-19 Yrs 20-29 Yrs 30-39 Yrs
Rolls Census
Gap Rolls
Census Gap Rolls Census gap
(iii) Gender Break-up of Electorals
Sr. No. Name of AC Gender Ratio in Roll
Gender Ratio as per Census
Gap
(iv) Literacy Rate:
(a)Compare the DLR (District Literacy Rate) to SLR (State Literacy Rate) to locate the district position in the TLR (Total Literacy Rate of the State).
Sr.
No.
Name of AC Total Voter
turnout
Total Literacy
Rate
Category
Sr. No.
Name of AC Total Female Voter turnout
Total Female Literacy Rate
Category
- 35 -
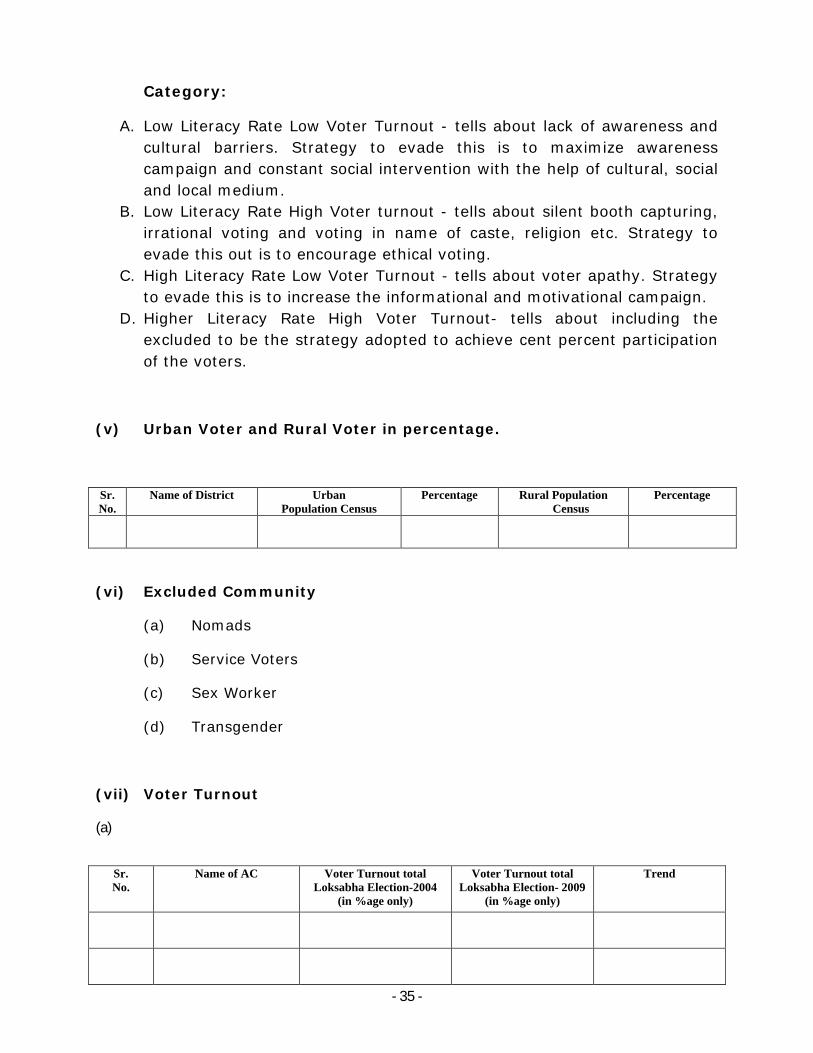
Category:
A. Low Literacy Rate Low Voter Turnout - tells about lack of awareness and cultural barriers. Strategy to evade this is to maximize awareness campaign and constant social intervention with the help of cultural, social and local medium.
B. Low Literacy Rate High Voter turnout - tells about silent booth capturing, irrational voting and voting in name of caste, religion etc. Strategy to evade this out is to encourage ethical voting.
C. High Literacy Rate Low Voter Turnout - tells about voter apathy. Strategy to evade this is to increase the informational and motivational campaign.
D. Higher Literacy Rate High Voter Turnout- tells about including the excluded to be the strategy adopted to achieve cent percent participation of the voters.
(v) Urban Voter and Rural Voter in percentage.
Sr. No.
Name of District Urban Population Census
Percentage Rural Population Census
Percentage
(vi) Excluded Community
(a) Nomads
(b) Service Voters
(c) Sex Worker
(d) Transgender
(vii) Voter Turnout
(a)
Sr. No.
Name of AC Voter Turnout total Loksabha Election-2004
(in %age only)
Voter Turnout totalLoksabha Election- 2009
(in %age only)
Trend
- 36 -
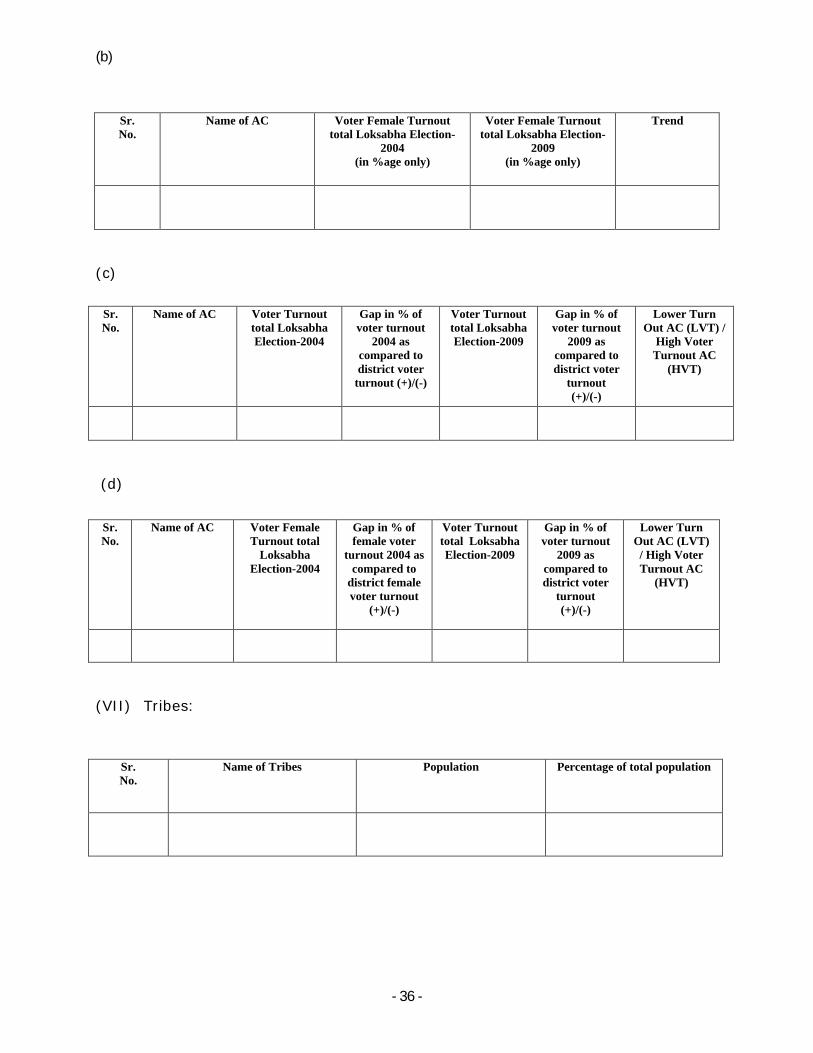
(b)
(c)
(d)
(VII) Tribes:
Sr. No.
Name of AC Voter Female Turnout total Loksabha Election-
2004(in %age only)
Voter Female Turnout total Loksabha Election-
2009(in %age only)
Trend
Sr.No.
Name of AC Voter Turnout total Loksabha Election-2004
Gap in % of voter turnout
2004 as compared to district voter
turnout (+)/(-)
Voter Turnout total Loksabha Election-2009
Gap in % of voter turnout
2009 as compared to district voter
turnout(+)/(-)
Lower Turn Out AC (LVT) /
High Voter Turnout AC
(HVT)
Sr. No.
Name of AC Voter Female Turnout total
Loksabha Election-2004
Gap in % of female voter
turnout 2004 as compared to
district female voter turnout
(+)/(-)
Voter Turnout total Loksabha Election-2009
Gap in % of voter turnout
2009 as compared to district voter
turnout(+)/(-)
Lower Turn Out AC (LVT) / High Voter Turnout AC
(HVT)
Sr. No.
Name of Tribes Population Percentage of total population
- 37 -
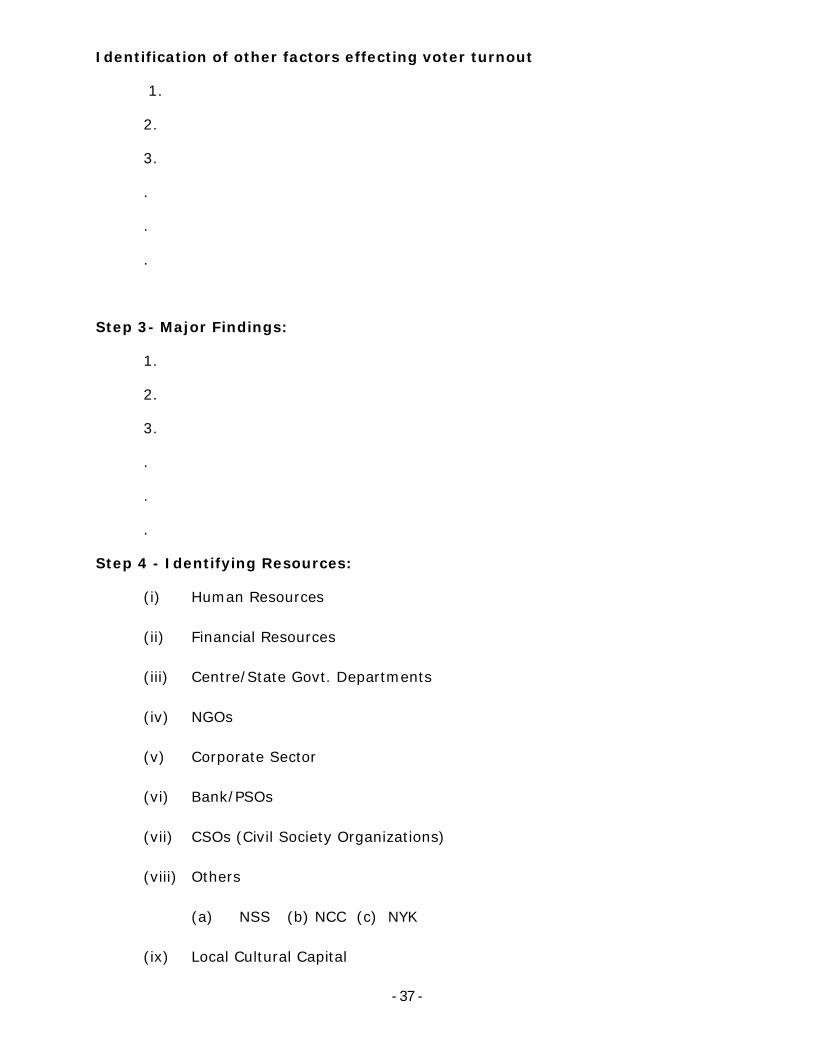
Identification of other factors effecting voter turnout
1.
2.
3.
.
.
.
Step 3- Major Findings:
1.
2.
3.
.
.
.
Step 4 - Identifying Resources:
(i) Human Resources
(ii) Financial Resources
(iii) Centre/State Govt. Departments
(iv) NGOs
(v) Corporate Sector
(vi) Bank/PSOs
(vii) CSOs (Civil Society Organizations)
(viii) Others
(a) NSS (b) NCC (c) NYK
(ix) Local Cultural Capital
- 38 -
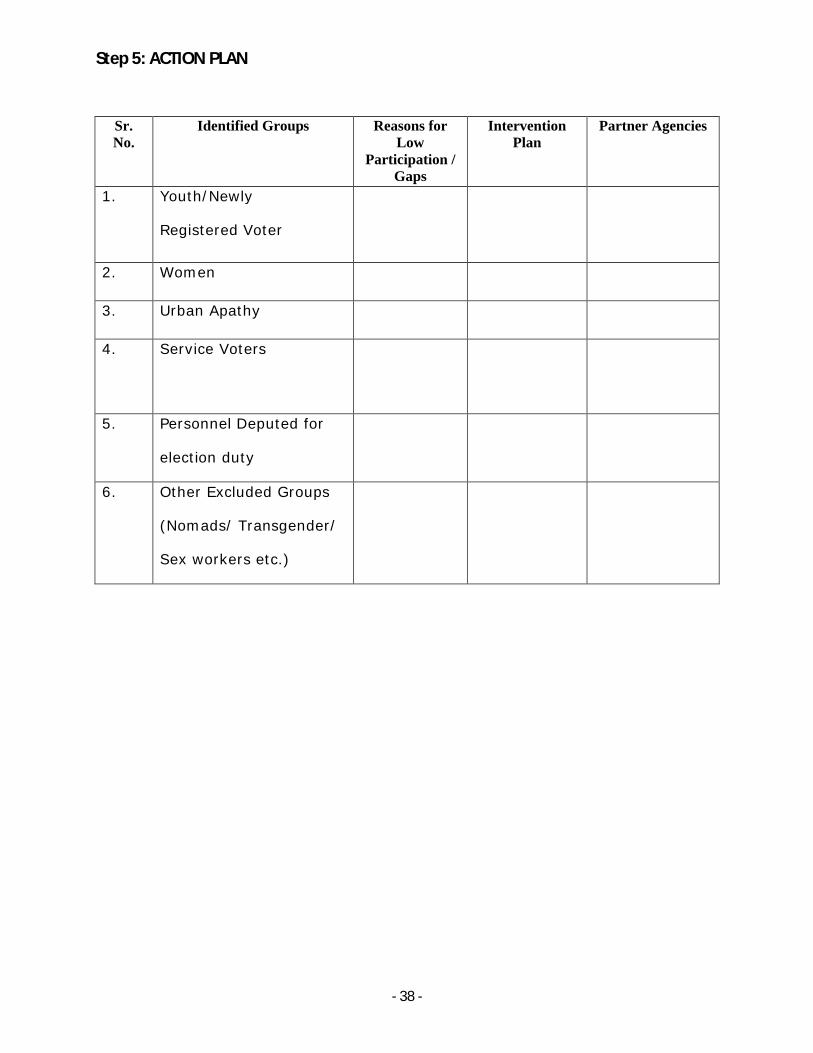
Step 5: ACTION PLAN
Sr.No.
Identified Groups Reasons for Low
Participation / Gaps
Intervention Plan
Partner Agencies
1. Youth/Newly
Registered Voter
2. Women
3. Urban Apathy
4. Service Voters
5. Personnel Deputed for
election duty
6. Other Excluded Groups
(Nomads/ Transgender/
Sex workers etc.)
- 41 -
FORMAT-"A"
GOVT. OF RAJASTHAN
OFFICE OF DISTT. ELECTION OFFICER ( COLLECTOR ) _____________( RAJ.) Weekly SVEEP Report (WSR) to be submited on every Monday till Poll Day
Format - A Date S.NO. Activity Date Place of
activityTarget group
Name of City/ Village
Name of AC
1 2 3 4 5 6 7
FORMAT-"N"
GOVT. OF RAJASTHAN
OFFICE OF DISTT. ELECTION OFFICER ( COLLECTOR ) _____________( RAJ.) Weekly SVEEP Report (WSR) to be submited on every Monday till Poll Day
Format - N Date:-
S.NO. No. of Posters No. of Stickers
No.of Hoarding
Target group
Name of City/ Village
Name of AC