Acquisition and employment effect in swedish manufacturing ...
29
Foreign Acquisition and Employment Effect in Swedish Manufacturing By Roger Bandick & Patrik Karpaty August 31, 2007 Abstract Sweden has witnessed a dramatic increase of inward FDI during the 1990’s that has no correspondence in earlier years. This development has raised many questions on the effects on pro competitive effects, the labor market and welfare issues. This study analyzes the effects on labor demand in firms acquired by foreign investors. Recent literature has shown that it is important to study the counterfactual outcome, i.e. what would the outcome be had the domestic firm never been acquired? The analysis is based on a panel of Swedish firm level data. In order to isolate the causal effects due to a takeover a propensity score matching estimator is applied to compare similar treated and untreated firms. The difference-in- difference estimations with firm fixed effect show that there is a positive effect of foreign acquisition on total employment. Separating between skilled and unskilled labor the effect of foreign acquisition on the former seems to bee more pronounced. Moreover, this effect seems to occur immediately on skilled labor but starts between 3-4 years post acquisition on unskilled labor. Finally, we control for previous international experience. Our findings suggest that the effect on the labor demand is only in domestic non-MNEs acquired by foreign investors, suggesting that domestic MNEs already are very similar to foreign MNEs. Key words: Multinational enterprise, foreign acquisitions, labor demand, matching, Difference-in-Difference. JEL classification: F16, F23, J23
Transcript of Acquisition and employment effect in swedish manufacturing ...

Foreign Acquisition and Employment Effect in Swedish Manufacturing
By
Roger Bandick &
Patrik Karpaty
August 31, 2007
Abstract Sweden has witnessed a dramatic increase of inward FDI during the 1990’s that has no correspondence in earlier years. This development has raised many questions on the effects on pro competitive effects, the labor market and welfare issues. This study analyzes the effects on labor demand in firms acquired by foreign investors. Recent literature has shown that it is important to study the counterfactual outcome, i.e. what would the outcome be had the domestic firm never been acquired? The analysis is based on a panel of Swedish firm level data. In order to isolate the causal effects due to a takeover a propensity score matching estimator is applied to compare similar treated and untreated firms. The difference-in-difference estimations with firm fixed effect show that there is a positive effect of foreign acquisition on total employment. Separating between skilled and unskilled labor the effect of foreign acquisition on the former seems to bee more pronounced. Moreover, this effect seems to occur immediately on skilled labor but starts between 3-4 years post acquisition on unskilled labor. Finally, we control for previous international experience. Our findings suggest that the effect on the labor demand is only in domestic non-MNEs acquired by foreign investors, suggesting that domestic MNEs already are very similar to foreign MNEs. Key words: Multinational enterprise, foreign acquisitions, labor demand, matching, Difference-in-Difference. JEL classification: F16, F23, J23
1. Introduction There are a number of reasons why employment should be affected by a foreign acquisition.
Barba Navaretti et al (2003) argue that this is likely since MNEs are more footloose.1 First,
since MNEs have the possibility to relocate the production or even labor between their
affiliates. Second, foreign MNEs are assumed to contribute to employment and the dispersion
of technology that gives them a privileged bargaining position compared to domestic firms in
the host country. This privilege can facilitate the possibility to hire and fire personal as they
like. Third, foreign MNEs are assumed to be less committed towards the host economy,
which may affect the decision to relocate production to a country where factor costs are low.
Brännlund et al (2004) argues in a similar way, except for the effect on employment. In their
model foreign ownership may have a detrimental effect on the trade unions bargaining power.
The trade unions will tend to be indulgent with the foreign MNEs because of the unspoken
threat to move production abroad. They do however argue that this is perhaps likely to have a
downward pressure on the wages, while the effect on employment is more ambiguous. On the
one hand lower wages gives the foreign firm an opportunity to hire more employees. On the
other hand if MNEs are more efficient they can decide to fire employees in order to increase
productivity.
Empirical evidence on the impact of acquisition and mergers on employment is very limited
and the results are ambiguous. The early paper of Brown and Medoff (1988) find a small
positive employment effect following acquisition in the state of Michigan for the period 1978-
1984. Lichtenberg and Siegel (1990) find that employment in US manufacturing is much
lower in acquired auxiliary establishments relative to those not changing owners. McGuckin
et al. (1995) and McGuckin and Nguyen (2001) find positive effect of ownership changes in
US manufacturing plants during the period 1977-1987. Conyon et al (2002 and 2001) shows
that, for different types of mergers, the effect on employment is negative in UK
manufacturing. The authors conclude that the negative effect is more pronounced in related
and hostile acquisitions.
Previous empirical studies for Sweden, finds that foreign MNEs does not have a different
wage setting policy than do indigenous firms (Bandick, 2004) and that productivity in the
1 Girma and Görg (2003), Görg and Strobl (2003) and Huttunen (2006) argue in a similar way. MNEs are expected to be more footloose and thus more likely to shut down production in the host economy.
acquired manufacturing firms increases in the post-acquisition years (Modén, 1998 and
Karpaty, 2007). From these results we would expect a negative effect on employment due to
foreign acquisition. However, in contrast to previous studies, Bandick (2007) finds that
foreign MNE plants have higher survival rates than Swedish MNE plants and Swedish non-
MNE plants. The employment prospect should then be better in firms owned by foreign
investors.
The employment effects (if any), due to foreign acquisitions is thus ambiguous. We argue that
foreign ownership is likely to have small, if any, effects on the overall employment in
acquired firms. The reasons are: First, Sweden is a small open economy that for many years
has been disciplined by international competition. In terms of both the number of domestic
and foreign MNEs and in terms of the number exporting firms, Swedish firms have been
globally engaged for many years. Second, Sweden has comparative advantages in the
production of skill and capital-intensive production (see Hansson et al, 2007). To some extent
Sweden also has comparative advantages in the production of technology intensive goods (in
terms of R&D intensity). Sweden has a highly educated labor force with low wages.
Moreover, Hansson et al. (2007) found that the motives behind inward FDI in Sweden during
the 1990s were both market seeking and efficiency seeking. In contrast, they found no strong
evidence for that the main motives for inward FDI into Sweden were to preempt competition
or to source knowledge from Swedish firms.
The purpose of this paper is to analyse the employment effects of foreign acquisition on
acquired Swedish manufacturing firms during the 1990s. To our knowledge the only study of
employment effects of foreign ownership in Swedish manufacturing is the study by
Brännlund et al (2004). However their study include a small number of firms and does not
cover the period in which Sweden become member of the European Union (EU) in 1994. As
discussed in Bandick and Hansson (2005) and Hansson et al (2007) Sweden has experienced a
steady increase in inward foreign direct investment (FDI) the years before EU membership.
After 1994 this increase took off considerably. By the year 2001 foreign owned multinationals
(MNEs) become the most dominating employers in Swedish manufacturing (see Table 2).
The 1990s is hence more important and interesting period to study than previous years.
This paper contributes to the existing literature in some important aspects. First, the study,
unlike other studies (e.g. for the US Lichtenberg and Siegel (1990), for Sweden Brännlund et

al. (2004) and also for the US McGuckin and Nguyen (2000)), covers the period in which
inward FDI in form of acquisition and merger grow substantially both in Sweden as well as in
other developed countries. Second, we use a unique firm level panel data that contains
information on the financial account of enterprises and register-based labor statistics (i.e.
education levels and incomes). The effect of inward FDI on labor demand should mainly
appear on the firm level2. By using panel data it is possible for us to examine the dynamic
effect of foreign takeover. Third, since we have information on ownership status of the firm
we are able to divide them into foreign-owned firms (FOF), Swedish-owned multinational
enterprises (SMNE) and Swedish-owned non-multinationals (non-MNEs)3. Using this
division we can examine whether there are any differences in the employment effects due to
previous multinationality of the acquired Swedish firms. The forth contribution is that in
implementing the method of difference in difference on matched sample along with firm fixed
effect, this paper provide an alternative cure to the existing literature that are hampered by
selection bias (e.g. Conyon et al (2002 and 2001), Piscitello and Rabbiosi (2002) and
Brännlund et al (2004)).
We find in our empirical analysis that foreign acquisitions have had a positive effect on
employment. This effect occurs 1-5 years post-acquisition. The results also indicate that the
positive effects of foreign acquisitions on the margin are larger for skilled employment. In
controlling for previous international experience in the acquired firms we find that the effect
on the labor demand is only in target domestic non-MNEs. Thus, the change of ownership
from Swedish MNE to foreign MNE has less importance than for the change of ownership
from non-MNE to foreign MNE.
The rest of the paper is structured as follows. Section 2 outlines the methodological
framework and the econometric methods. Section 3 describes the data while section 4 reports
the main empirical findings. Section 5 concludes.
2 See Conyon et al (2002) and Bandick and Hansson (2005) 3 This division appears to be very important since the crucial differences is between MNEs (foreign-owned and Swedish-owned) on the one hand and non-MNEs, on the other. (See Doms and Jensen (1998) and Bandick (2004))

2. The methodological framework In order to evaluate the effect of foreign acquisition on the acquired firms employment, we
follow Blundell and Costa Dias (2000) in combining the propensity score matching approach
and the difference-in-difference (DiD) estimate technique. The advantage of this technique is
that we can in a more proper way: i) control for the causal effect of the unobserved
counterfactual, i.e. the outcome of the acquired firms if they had not been taken over and ii)
account for the selectivity problem, that is when foreign investor “cherry pick” firms with
good properties4 and iii) calculate for the unobserved time invariant effects by looking at
changes in the outcome before and after foreign acquisition. The econometric specifications in
a more formal way are outlined below. In the first stage we present the propensity score
matching approach and in the second the DiD.
2.1 Matching approach
The main problem in the evaluation literature is to estimate how the treatment event only
attributes to the post-treatment outcome. Due to lack of data (since we don’t have information
on the alternative outcome in a target firm had it never been acquired) we need to establish a
counterfactual outcome for the acquired firms. Would employment have been unchanged if
the firm never would have been acquired? If we find firms that are very similar, in terms of
observable characteristics, then the probability of being a target firm (conditioned on the
observables X) can substitute for the missing data, Rosenbaum and Rubin (1983).5 We
proceed by constructing a group of domestic firms that will constitute our missing data
(employment in acquired firms had they never been acquired). The propensity score matching
technique has the advantage of summarizing all observables in a single index. The matching
procedure will help us identify two groups of firms: The group of firms that were acquired,
the treatment group and the matched firms with similar characteristics, the control group. The
4 There are by now several ways of dealing with the selection bias including the differences-in-difference, instrumental variables regression and propensity score matching (see Heckman and Navarro-Lozano, 2003 and Heckman et al, 1998). 5 We have to assume that all differences between the two groups are captured by their observables X. This assumption is not always realistic when for example (soft) information on management and organizational details is not available. When unobservable are likely to be very important, the analysis on matched firms should be seen as a complement to an analysis on unmatched firms. At best we may then reduce the selection bias.
control group could for instance consist of firms that are similar to the treated firms with
respect to size, industry, human capital endowments etc.6
The binary choice model may be written as:
),,()1( 1 tjitit TIXFFOP −== (1)
where 1=FO if a domestically owned firms in year t-1 become foreign owned in year t.
1−itX is a vector of relevant firm specific characteristics in year t-1 which may affect the firms
probability of being acquired in year t. I and T control for fixed industry and time fix effects.
Once the propensity scores are calculated we can (using the “caliper” matching method) select
a nearest control firm in which the propensity score falls within a pre-specified radius as a
match for an acquired firm7.
2.2 Difference-in-Difference (DiD)
Another problem that may arise in evaluating the effect of the treatment event is that the
treatment in it self may be bias due to the non-random selection decision.8 The treated unit
may have been selected due to their pre-treatment characteristics that can affect the post-
treatment outcome. One way to isolate the treatment effect is to apply the DiD estimator. DiD
compare the differences between pre- and post-treatment outcome for the treated unit with the
difference in the outcome of the non-treated unit in the same period. More formally, the DiD
can be written as:
( ) ( )Ct
Ct
Tt
Tt YYYYDiD
0101ˆ −−−=α (2)
where the first term of the right-hand side counts for the differences in the outcome (Y) before
and after the treatment event for the treated unit (T) and the second term counts for the
6 Technically speaking, the psmatch2 routine in STATA is used to match treatment and control firms (Leuven, E. and B. Sianesi, 2003). 7 The psmatch2 routine in Stata Version 9 is used to match treatment and control firms. The pre-specified radius is set at 0.01 in our analysis. 8 See e.g. Heckman et al (1997)

differences in the outcome for the non-treated (control) unit (C). α̂ is the mean percentage
point change in the outcome that can be attributed to the treatment event.
2.3 The DiD and the matched sample
Although the DiD approach reduces the selection bias it is not a valid estimator if there
remains large differences between treated and non-treated groups. To get a more accurate
estimator we combine the constructed match sample derived from the propensity score
matching approach with the DiD.9
In formalizing equation (2) into a regression model we get the following expression10:
ittiY εαααα +it3t2i10, TR*AF+AF+TR+= (3)
where tiY , is the outcome variable. The dummy variable iTR takes the value 1 if the firm is in
the treatment group and 0 otherwise. The possible differences between treated and non-treated
are captured by the parameter 1α . tAF is a dummy variable taking the value 1 in the post-
treatment period and 0 otherwise. tAF will then capture the time effect on the outcome that is
equalized for both treated and non-treated group. The last term of equation (3) is the most
important. The parameter 3α of the interaction variables TR*AF captures the difference-in-
difference outcome of the treatment event on the treated unit. Table 1 summarizes the
interpretation of each parameter in equation (3).
9 See e.g. Blundell and Costa Dias (2000) 10 See Woolridge (2002)
3. Data and description
3.1 The data The data, supplied by Statistics Sweden (SCB) and Swedish Institute for Growth Policy
Studies (ITPS), is a firm level data covering the period 1993-2002. The panel consists of the
entire manufacturing firms with 20 employees or more in which output (gross production and
value added), employment (divided into different educational level) and capital stocks are
reported for.11 Moreover, we have information about the ownership status of the firm and can
therefore divide them into foreign-owned firms (FOF), Swedish-owned multinational
enterprises (SMNE) and Swedish-owned non-multinationals (non-MNEs). The firms are
defined as foreign owned if a foreign owner(s) possesses more than 50 percent of the voting
rights and as Swedish-owned multinational if the firms have at least one affiliate abroad or
being part of an enterprise group that has affiliates abroad. Swedish-owned non-MNEs are
firms that neither are Swedish MNEs, and nor are foreign owned.
Table 2 gives the development of the frequency distribution and the share of manufacturing
employment for each of the three types of firms. As shown, foreign ownership increased
steadily in the Swedish manufacturing between the years 1993-2002, with respect to the
number of firms and to employment shares. This increase seems to be at the expense of the
domestic firms and especially Swedish MNEs. Although, the number of firms was constant
during this period, the importance of Swedish MNEs in the manufacturing declined; the share
of total number of firms decreased from 23 to 18 percent and the share of total manufacturing
employment from 50 to 31 percent.
The frequency of ownership changes, also shown in Table 2, reveals, especially after the year
1994, that several large Swedish MNEs have become foreign owned due to mergers with and
acquisitions by foreign MNEs.12
Table 3 provides the distribution of foreign acquisitions between 16 industries at the two-digit
(SNI92) industry level during 1994-2002. As is evident, foreign acquisitions are characterized 11 In the year 1997, the total manufacturing employment and value added share for these firms in the sample were around 80 and 82 percent, which indicate a good representation of the Swedish manufacturing. See Karpaty, 2007. 12 Swedish MNEs that become foreign owned at this period due to mergers with and acquisitions by foreign MNEs are e.g. Pharmacia and Upjohn, in 1995 and Ford and Volvo Car Corporation, in 1999.
by a large heterogeneity between different industries. Consistent with empirical findings for
many other developed countries (see e.g. Barba Navaretti and Venables, 2004) foreign
ownership has increased in Chemicals, motor vehicles and professional goods (e.g. medical
instruments), i.e. high skill and technology intensive industries. Foreign ownership has also
increased in basic metal and non-metallic products.13
Table 4 shows the mean variable differences between foreign acquired firms and non-
acquired firms in the pre and post acquisition years. Here we use all manufacturing firms with
20 employees or more (the unmatched sample) that are in the panel at least five consecutive
years. From column 1 it seems clear that one-year pre acquisition the acquired firms are
larger, in terms of employment, capital stock and shipment. At the same time the acquired
firms have higher skill intensity (measured by the proportion of employees with more than
secondary education) and labor productivity (measured by value added per employee). The
result in Table 4, column 1 thus provides us with some evidence for “cherry picking”, i.e.
firms with good performance are more likely to bee target. The development between one-
year pre and four-year post acquisition suggests increased employment and capital differences
between acquired and non- acquired firms. However, differences in wages, skill intensity and
productivity between acquired and non- acquired firms remain almost unchanged while
differences in shipment declines over the post acquisition years.
Differences in the performance between acquired and non- acquired firms in the years before
acquisition could bias the causal direction of foreign acquisition. It is difficult to distinguish
whether firms performance in the post-acquisition years is attributable to the foreign takeover
or whether the foreign firms select them self’s into relatively high performance industries and
firms. To deal with this issue we use a comparison group that did not undergo an ownership
change and that do not differ much from the target firms in the pre-acquisition year with
respect to firm specific characteristics. This method is described more in the following
section.
13 Hansson et al (2007) provides the distribution of employment in foreign owned firms in Sweden 2005 in the industry and service sector respectively.
3.2 The Sample
To construct the sample of treated and non-treated firms, which are similar in their pre-
acquisition characteristics, we employ the method of propensity score matching developed by
Rosenbaum and Rubin (1983). For each year we estimate the propensity score, the conditional
probability of being acquired by a foreign MNE, by using the probit model described in
section 2.1. The probit model will help us identify relevant variables for the matching process.
We impose two conditions to be fulfilled: balancing condition and common support
condition. The balancing condition controls that each independent variable is not significantly
different between treated and non-treated firms. This means that only acquired and non-
acquired firms with the same propensity score and with the same distribution of their
observable characteristics will be matched.
There is no consensus in either the theoretical, nor the empirical literature in determining
what causes a foreign acquisition.14 One may argue that the central variable should be the
difference in expected profits between the owner of the firm and the buyer. In that case we
would expect to observe acquisitions where the buyer expects profits to rise, due to the
implementation of, e.g., better management, organization or technology etc. However,
expected profits are unknown to the econometrician, since current profits do not necessarily
reflect potential profits. In the following analysis we will consider characteristics that we
know from Table 4.
After evaluating different alternatives, we found the following set of explanatory variables to
fulfill the balancing condition criterion; labor productivity (measured by value added per
employee) of the firm, firm’s employment relative to industry mean employment, firm’s age
and its square, skill intensity of the firm, a dummy variable indicating whether the acquired
firm was a Swedish MNE or not and the share of foreign employment at industry level (two-
digit) as proxy for foreign presence.15 All the variables are lagged one year to avoid
endogeneity problem.
14 Norbäck and Persson (2007a,b) derives a model for acquisition, greenfield and no entry. Moreover, they also show in the ”NU-model” that inward FDI affects the domestic economy through efficient ownership, competition effects and through knowledge dispersion. The model analyzes different scenarios with special focus on welfare effects in the host country due to inward FDI either by acquisition or greenfield entry. 15 Other variables that may affect the firm’s probability of being acquired e.g. wage capital stock and sales, are left behind in the matching procedure since the criteria of balancing condition are not fulfilled. However, in the DiD regression models, we control for these variables.
The estimation of the probit model is shown in Table 5. The result indicates that firms that are
productive, more skill intensive and owned by domestic MNEs are more likely to become
targets. Moreover, foreign MNEs seems to be more inclined to agglomerate in industries
where foreign presence is more pronounced. This results support the findings in Table 4 that
foreign investors “cherry pick” firms with good performance.
The second condition to be fulfilled in the matching procedure is the so-called common
support condition. This criterion implies that only acquired firms in which the propensity
score are within the highest and lowest propensity score of the non- acquired group will be
involved in the matching process. Moreover, we include only firms in which information are
reported for at least three consecutive years after acquisition in the analysis, since we want to
study the dynamic development of the post-acquisition effect16. The final sample, in which we
refer to matched sample, consists of 181 treated and 372 non-treated firms.
After matching firms we ask whether firms in the treatment and control group still differs
with respect to size, skill structure of the labour endowment, wages and labor productivity. In
Table 6 we set up the mean values for these variables again, but only for the acquired and
non-acquired firms that were successfully matched together. Comparing the results to the
corresponding in Table 4, we see that there still remains differences in wages (not unskilled
wage), capital and labor productivity between the groups. However the matching procedure
has been successful in reducing the differences in these variables as well as in other. Most
important the differences in employment have been reduced substantially, suggesting that the
control firms may substitute for the missing outcome data (see discussion above).
4. The Results of DiD To empirically test whether foreign acquisition of a Swedish owned firm have any effect on
the employment level in the post acquisition years, we use the DiD model in Tables 7-9. In
Table 7 columns (i) and (ii) we report the OLS estimates with robust standard errors on
matched firms that remains at least 5 years in the panel. In the first column we analyse the
16 We also exclude greenfield operation and firms that switch back and forth between different ownership statuses.
basic model given by equation (3) and in column (ii) we also control for firm level covariates
such as; wage, sales and the capital stock17. We do so in order to implement the basic model
into an empirical labor demand framework, see e.g. Girma (2005) and Girma and Görg
(2004).
The coefficient on the interaction variable AF*TR in column (i) is positive and significant at
the 10 percent level. This suggests that foreign acquisition have a positive effect on target
firms employment in the years following an acquisition. The differential in the labor demand
between acquired and non- acquired firms in the post-acquisition years is almost 8 percent.
However, when controlling for firm level covariates, in column (ii), the acquisition effect on
employment disappears.
The positive and significant coefficient on the variable “TR” indicates that there is a constant
difference in total employment in the pre-acquisition years between the acquired and non-
acquired firms. The level of employment seems to be much higher in target firms relative to
firms that have not undergone ownership changes18. Although the pre-acquisition
characteristics in the matched sample were significantly reduced (in Table 6), there still are
significant differences in some characteristics that may affect the results. One way to control
for these remaining unobservable characteristics is to use the firm fixed effect model (FE). In
such a model any permanent characteristics of individual firms are absorbed by the fixed
effects and do not appear as the consequence of selection bias. The fixed effect estimator in
column (iii), the basic model, and in column (iv), the basic model with control, suggests some
evidence of post-treatment labor demand effects in the acquired firms. The labor demand
seems to increase in acquired firms by about 4 percent in the post-acquisition period.
In the next four columns (vi-viii) the post acquisition period is divided using year-by-year
dummies in order to illustrate the dynamic pattern of post-acquisition effects. The coefficient
on the variable “TR” is once again positive and significant leaving the OLS estimation
uncertain. From the FE estimation in column (vii) and (viii) it is evident that the positive
effect on employment starts four years post acquisition and takes the form of a one single shift
in the level of employment 17 These characteristics could still be important after matching since the propensity score matching only summarizes all observables in a single index (see above). 18 This finding confirms the results in Table 4 and Table 5 that foreign MNEs select themselves into domestic firms with good properties.
A reason for this single shift could be that it’s the relative employment that increases in
acquired firms and not the absolute employment. The reason could e.g. be competition
effects. The foreign MNEs can force less productive domestic firms to exit the market or to
reduce their production and thus to produce a sub optimal output. This will have negative
affect on the labor demand in the domestic low productive firms.
In the next two tables, Table 8 and 9, we try to answer the question: is the observed positive
effect on overall employment specific to any skill group? Employment is divided according to
level of education, where we distinguish between skilled, employees with post-secondary
education, and unskilled labor, employees with less than secondary education. The results in
Table 8 reveals that skilled labor demand increases by between 8 and 10 percent in the
acquired firms depending on which estimator we use. This increase seems to occur in the
period immediately following acquisition and maintains up to five year post-acquisition. The
effect on unskilled labor demand, shown in Table 9, is however less pronounced. Looking at
FE estimation the effect is around 4 percent and starts from the fourth post-acquisition year.
Many of the large Swedish MNEs have been targets for foreign investors during the 1990’s.
Firms such as Astra, Pharmacia, Volvo Car, and Saab Automobile are some well-known
international firms that have shifted ownership during the 1990’s and are now foreign owned.
In this section we explore heterogeneity and in order to search for further detail on the nature
of the employment effects uncovered thus far. We extend the analysis by allowing for
differences in the employment effects due to previous multinationality in domestic firms. The
question we ask is: do the acquisitions of Swedish MNEs have a different effect on labor
demand from the acquisitions of pure local firms. Our hypothesis is that firms operating
within a multinational network are already forced to be productive and therefore already has
an efficient production, while pure local firms may have lower labor productivity, either due
to x-inefficiencies or due to inefficient production. The scope for changing the level of
employment should then be larger in acquired pure local firms.
In Table 10 and 11 we inter act the treatment (TR) and post acquisition dummies with a
dummy for previous MNE status.19 The positive and significant coefficient on TR(MNE)
19 If a domestic firm has been part of a Swedish MNE network during the investigated period it will take the value 1, else 0.
indicates that there is a constant difference between target domestic MNEs and non-target
domestic MNEs. This along with the result that there is no effect of foreign acquisition on
domestic MNEs employment (AR*TR(MNE) is insignificant), the results suggest that foreign
MNEs do select Swedish MNEs that already have efficient employment level and does not
make any changes in the post acquisition years.
However, there is no evidence that foreign investors “cherry picked” domestic non-MNEs
with higher performance compared to the non-MNEs that was not target. Still, in the line with
our hypothesis, the overall, skilled and unskilled labor demand is positively affected in the
post-acquisition years in acquired non-MNEs. The range of this effect is between 6 and 12
percent for overall and unskilled labor demand and in between 10 and 17 percent for skilled
labor demand. The result in Table 11 reveal that post-treatment effects on overall and
unskilled labor in the acquired non-MNEs start in the second post-acquisition year while the
effect on skilled labor starts in the year immediately following an acquisition.
5. Summary and conclusion Over the last decade Sweden has witnessed a large increase in its international exposure, in
terms of FDI flows and export. The largest increase though is in inward FDI flow with a large
number of foreign acquisitions of Swedish firms. A new owner, be it a foreign or domestic,
may need to rationalize production in order to make it more efficient, e.g. by firing or hiring
personal. Foreign owners though, could be more footloose than domestic owners. The reason
is that the foreign owner may relocate their production between their affiliates without any
concern of nationality. A foreign MNE could also have a more privileged bargaining position
in the host country compared to domestic firms. This could make it easier for a foreign firm to
hire and fire Swedish personal. On the other hand, negative effects on employment may have
been exhausted in a Swedish MNE in a way that they have not for other firms. And thus the
effects (if any) on employment in a domestic MNE due to a foreign acquisition may be
smaller than for other firms.
In this paper we consider whether foreign acquisitions of Swedish firms have had any effects
on employment post acquisition. Our rich firm level data set for Swedish manufacturing firms
enables us to analyze the effect on employment of different skill groups. Moreover, we allow
for differential impacts on employment post acquisition in domestic MNEs and domestic non-
MNEs.
It would appear from our results that to the extent that foreign acquisitions had any effects on
employment it was positive, significantly increasing the employment post acquisition. This
effect occurs 1-5 years post acquisition. The results also indicate that the positive effects of
foreign acquisitions on the margin are larger for skilled employment.
Of the effect of foreign acquisition on employment we found a difference between different
ownerships. There was no effect on employment in target Swedish MNEs, but there was in
the target non-MNEs. This allowed us to conclude that the skill composition in Swedish and
foreign MNEs already are very similar. The change of ownership from Swedish MNE to
foreign MNE thus has less importance than for the change of ownership from non-MNE to
foreign MNE. Firms operating within an international network and with a history of high
levels of exposure to international markets could already have adapted to international
competition.

References [1] Bandick, R. (2007), ”Multinationals and Plant Survival in Swedish Manufacturing”.
Unpublished, Örebro Universitet. [2] Bandick, R. and P. Hansson (2005), ”Inward FDI and demand for Skills in Sweden”.
ESI working paper 2005:10, Örebro Universitet. [3] Bandick, R. (2004), “Do Workers Benefit from Foreign Ownership? Evidence from
Swedish Manufacturing”, ESI working paper 2004:15, Örebro University. [4] Barba Navaretti G. and A.,J. Venables (2004), “Multinational Firms in the world
economy”. Princeton University Press. [5] Barba Navaretti, G., D. Checchi and A.Turrini (2003), "Adjusting Labour Demand:
Multinational versus National Firms - A Cross-European Analysis". CEPR Discussion Paper No. 3751.
[6] Blundell, R and C. Dias (2000), “Evaluation methods for non-experimental data”.
Fiscal Studies, Vol.21, pp.427-468. [7] Brown G. and J. Medoff (1988), “The impact of firm acquisition on labor”. In
Auerbach A.J. (ed.), Corporate takeovers: causes and consequences. London and Chicago: Chicago University Press.
[8] Brännlund, R., J. Nordström, and D. Svedin (2004), ”Foreign ownership and effects
on employment and wages: The case of Sweden”. Umeå Economic Studies 638 [9] Conyon, M., S. Girma, S. Thompson, and P. Wright (2002), “The Impact of Mergers
and Acquisitions on Company Employment”. European Economic Review 46 (1): 31–49.
[10] Conyon, M.J., Girma, S., Thompson, S., Wright, P. (2001), “Do hostile mergers
destroy jobs?” Journal of Economic Behavior and Organization 45, 427–440. [11] Doms, M. and Jensen, B. (1998), Comparing wages, skills, and productivity between domestically and foreign-owned manufacturing establishments in the United States, in Baldwin, R, Lipsey, R. and Richardson, D. (1998), Comparing wages, skills, and productivity between domestically and foreign-owned manufacturing establishments in the United States. Chicago: University of Chicago press. [12] Girma, S. (2005), “Safeguarding Jobs? Acquisition FDI and Employment Dynamics in
UK manufacturing”. Review of World Economics, Vol. 141(1), pp. 165-178. [13] Girma, S. and H. Görg. (2003), “Blessing or Curse? Domestic Plants’ Survival and
Employment Prospects after Foreign Acquisitions”. IZA Discussion Paper No. 706. [14] Görg, H. and E. Strobl (2003), “Footloose multinationals?”. The Manchester School,
71, 1-19.
[15] Hansson, P., P. Karpaty, M. Lindvert, L. Lundberg, A. Poldahl and L. Yun (2007), ”Swedish business sector in a globalized world: Impact of internationalization on productivity and employment”. ITPS A2007:004 (Only in Swedish).
[16] Heckman, J. and S. Navarro-Lozano (2003), “Using matching, instrumental variables
and control functions to estimate economic choice model”. Working Paper 2003:4. IFAU.
[17] Heckman, J., H. Ichimura, J. Smith, P. Todd (1998), “Characterizing Selection Bias
Using Experimental Data”. Econometrica, Vol.66, No. 5 pp. 1017-1098. [18] Heckman, J., H. Ichimura, J. Smith, P. Todd (1997), “Matching as an Economic
Evaluation Estimator: Evidence From a Job Training Program”. Review of Economic Studies, 64(4), 605-654.
[19] Huttunen, K. (2005), “The Effect of Foreign Acquisition on Employment and Wages:
Evidence from Finnish Establishments”, HECER Discussion Paper No. 62.
[20] Karpaty, P. (2007), “Productivity Effects of Foreign Acquisitions in Swedish Manufacturing: The FDI Productivity Issue Revisited”. International Journal of the Economics of Business Vol. 14, No. 2.
[21] Leuven, E, and B. Sianesi (2003), “PSMATCH2: Stata module to perform full
Mahalanobis and propensity score matching, common support graphing, and covariate imbalance testing”. Available at http://ideas.repec.org/c/boc/bocode/ s432001.html.
[22] Lichtenberg, F.R. and D. Siegel (1990), “The effect of ownership changes on the
employment and wages of central office and other personnel”. Journal of Law and Economics, Vol. 33.
[23] McGuckin, R.H. and S.V. Nguyen (2001), “The Impact of Ownership Changes: A
View from Labour Markets”. The International Journal of Industrial Organization 19 (5), 739– 762.
[24] McGuckin R.H., S.V. Nguyen and A.P. Reznek (1995), “The impact of ownership
change on employment, wages and labour productivity in US manufacturing 1977-87”. Center for Economic Studies, US Bureau of Census, 95-8.
[25] Modén, K.M. (1998), “Foreign Acquisitions of Swedish companies - effects on R&D
and Productivity”. ISA 1998/2. Stockholm. [26] Norbäck, P.J. and L. Persson (2007a), “Globalization and Profitability of Cross-
Border Mergers & Acquisitions”. Economic Theory, forthcoming. [27] Norbäck, P.J. and L. Persson (2007b), “Investment Liberalization – Why a Restrictive
Cross-Border Merger Policy can be Counterproductive”. Journal of international Economics, forthcoming.

[28] Piscitello, L. and L. Rabbiosi (2002), “Foreign entry through acquisition. The impact on labour productivity and employment”. Paper presented at the EIBA Conference in Athens.
[29] Rosenbaum, P., and D. B. Rubin (1983), “The Central Role of the Propensity Score in Observational Studies for Causal Effects”. Biometrika 70 (1): 41–55. [30] Woolridge, J.M. (2002), “Econometric Analysis of cross section and Panel Data”.
MIT Press.
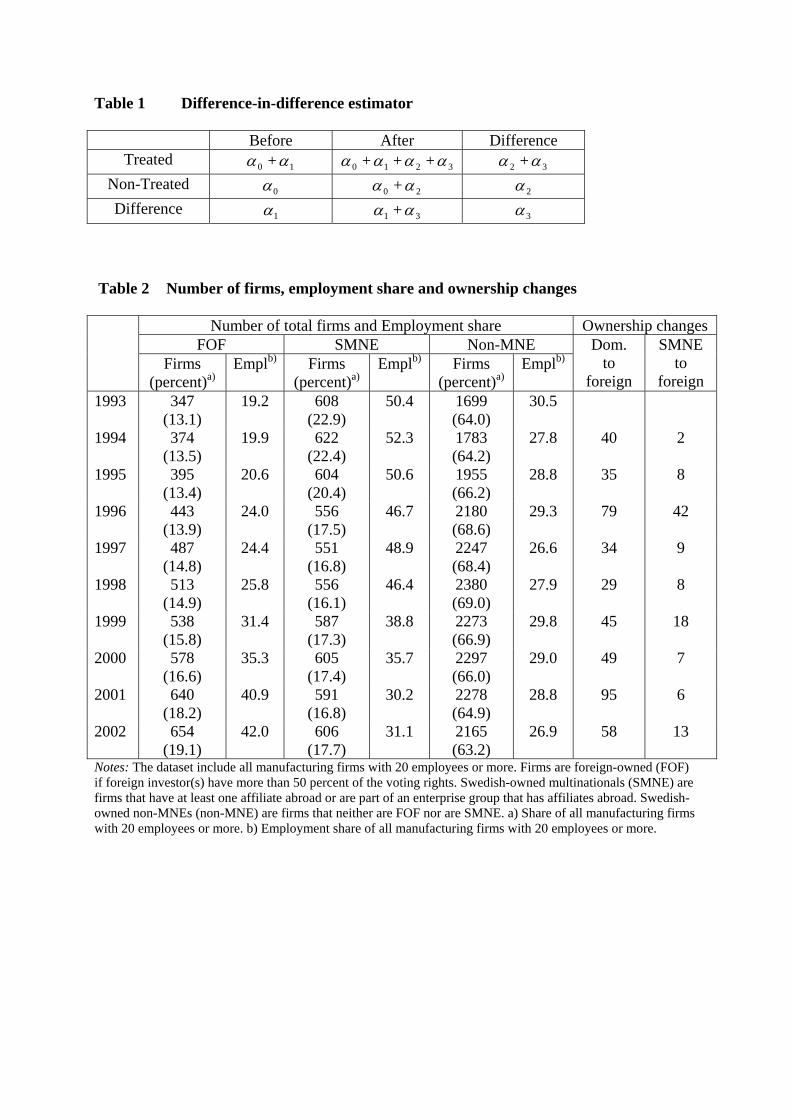
Table 1 Difference-in-difference estimator
Before After Difference Treated 10 +αα 3210 +++ αααα 32 +αα
Non-Treated 0α 20 +αα 2α Difference 1α 31 +αα 3α
Table 2 Number of firms, employment share and ownership changes
Number of total firms and Employment share Ownership changes FOF SMNE Non-MNE
Firms (percent)a)
Emplb) Firms (percent)a)
Emplb) Firms (percent)a)
Emplb) Dom.
to foreign
SMNE to
foreign 1993 347
(13.1) 19.2 608
(22.9) 50.4 1699
(64.0) 30.5
1994 374 (13.5)
19.9 622 (22.4)
52.3 1783 (64.2)
27.8
40 2
1995 395 (13.4)
20.6 604 (20.4)
50.6 1955 (66.2)
28.8
35 8
1996 443 (13.9)
24.0 556 (17.5)
46.7 2180 (68.6)
29.3
79 42
1997 487 (14.8)
24.4 551 (16.8)
48.9 2247 (68.4)
26.6
34 9
1998 513 (14.9)
25.8 556 (16.1)
46.4 2380 (69.0)
27.9
29 8
1999 538 (15.8)
31.4 587 (17.3)
38.8 2273 (66.9)
29.8
45 18
2000 578 (16.6)
35.3 605 (17.4)
35.7 2297 (66.0)
29.0
49 7
2001 640 (18.2)
40.9 591 (16.8)
30.2 2278 (64.9)
28.8
95 6
2002 654 (19.1)
42.0 606 (17.7)
31.1 2165 (63.2)
26.9
58 13
Notes: The dataset include all manufacturing firms with 20 employees or more. Firms are foreign-owned (FOF) if foreign investor(s) have more than 50 percent of the voting rights. Swedish-owned multinationals (SMNE) are firms that have at least one affiliate abroad or are part of an enterprise group that has affiliates abroad. Swedish-owned non-MNEs (non-MNE) are firms that neither are FOF nor are SMNE. a) Share of all manufacturing firms with 20 employees or more. b) Employment share of all manufacturing firms with 20 employees or more.

Table 3 Total number of firm and foreign acquisition by sectors, 1994-2002
Notes: Industries are defined on SNI92 2-digit level
Industry Target firms (percent)
All firms
Food, beverages and tobacco 28 (5.8) 483 Textiles, apparel and leather 10 (5.1) 197
Wood products 33 (5.6) 588 Paper and paper products 20 (13.5) 144 Printing and publishing 35 (5.4) 653
Chemicals 44 (22.1) 199 Rubber and plastics 25 (8.4) 297
Non-metallic products 23 (12.4) 185 Basic metals 19 (14.3) 133
Metal products 55 (5.1) 1,085 Non-electrical machinery 75 (8.1) 928
Electrical machinery 18 (7.1) 253 Telecommunication 9 (5.7) 158 Professional goods 24 (12.2) 196
Motor vehicles 25 (11.0) 227 Transport equipment and other manufacturing 21 (4.5) 462
Total 464 (7.5) 6,188
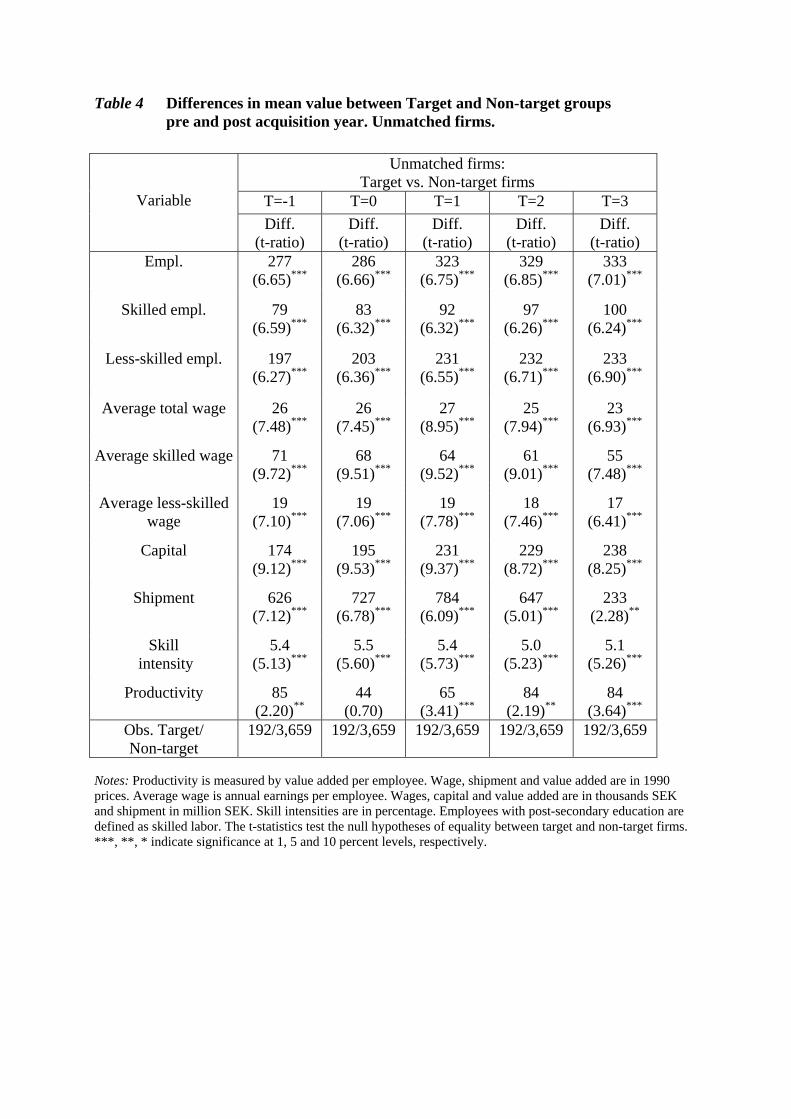
Table 4 Differences in mean value between Target and Non-target groups pre and post acquisition year. Unmatched firms.
Notes: Productivity is measured by value added per employee. Wage, shipment and value added are in 1990 prices. Average wage is annual earnings per employee. Wages, capital and value added are in thousands SEK and shipment in million SEK. Skill intensities are in percentage. Employees with post-secondary education are defined as skilled labor. The t-statistics test the null hypotheses of equality between target and non-target firms. ***, **, * indicate significance at 1, 5 and 10 percent levels, respectively.
Unmatched firms: Target vs. Non-target firms
T=-1 T=0 T=1 T=2 T=3
Variable Diff.
(t-ratio) Diff.
(t-ratio) Diff.
(t-ratio) Diff.
(t-ratio) Diff.
(t-ratio) Empl.
277
(6.65)*** 286
(6.66)*** 323
(6.75)*** 329
(6.85)*** 333
(7.01)***
Skilled empl. 79 (6.59)***
83 (6.32)***
92 (6.32)***
97 (6.26)***
100 (6.24)***
Less-skilled empl. 197
(6.27)*** 203
(6.36)*** 231
(6.55)*** 232
(6.71)*** 233
(6.90)***
Average total wage 26 (7.48)***
26 (7.45)***
27 (8.95)***
25 (7.94)***
23 (6.93)***
Average skilled wage 71 (9.72)***
68 (9.51)***
64 (9.52)***
61 (9.01)***
55 (7.48)***
Average less-skilled wage
19 (7.10)***
19 (7.06)***
19 (7.78)***
18 (7.46)***
17 (6.41)***
Capital 174 (9.12)***
195 (9.53)***
231 (9.37)***
229 (8.72)***
238 (8.25)***
Shipment 626 (7.12)***
727 (6.78)***
784 (6.09)***
647 (5.01)***
233 (2.28)**
Skill intensity
5.4 (5.13)***
5.5 (5.60)***
5.4 (5.73)***
5.0 (5.23)***
5.1 (5.26)***
Productivity 85 (2.20)**
44 (0.70)
65 (3.41)***
84 (2.19)**
84 (3.64)***
Obs. Target/ Non-target
192/3,659 192/3,659 192/3,659 192/3,659 192/3,659
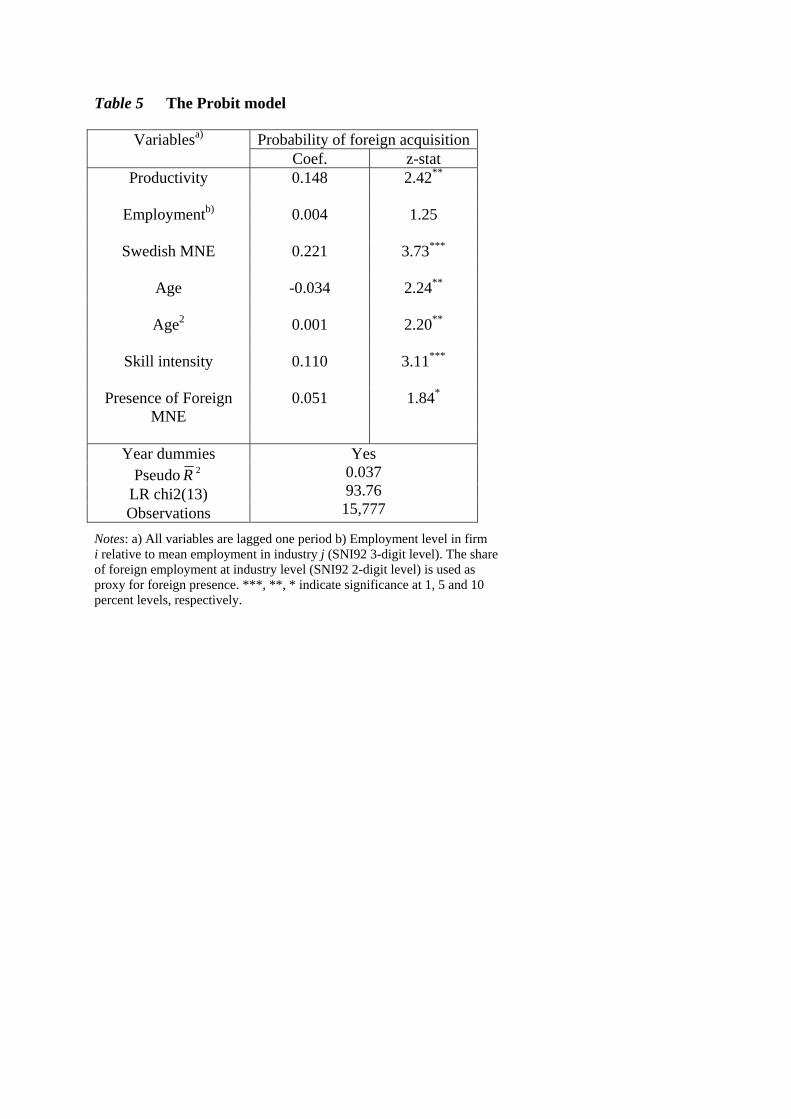
Table 5 The Probit model
Notes: a) All variables are lagged one period b) Employment level in firm i relative to mean employment in industry j (SNI92 3-digit level). The share of foreign employment at industry level (SNI92 2-digit level) is used as proxy for foreign presence. ***, **, * indicate significance at 1, 5 and 10 percent levels, respectively.
Probability of foreign acquisitionVariablesa)
Coef. z-stat Productivity 0.148 2.42**
Employmentb) 0.004 1.25
Swedish MNE 0.221 3.73***
Age -0.034 2.24**
Age2 0.001 2.20**
Skill intensity 0.110 3.11***
Presence of Foreign
MNE 0.051 1.84*
Year dummies
Pseudo 2R LR chi2(13) Observations
Yes 0.037 93.76 15,777
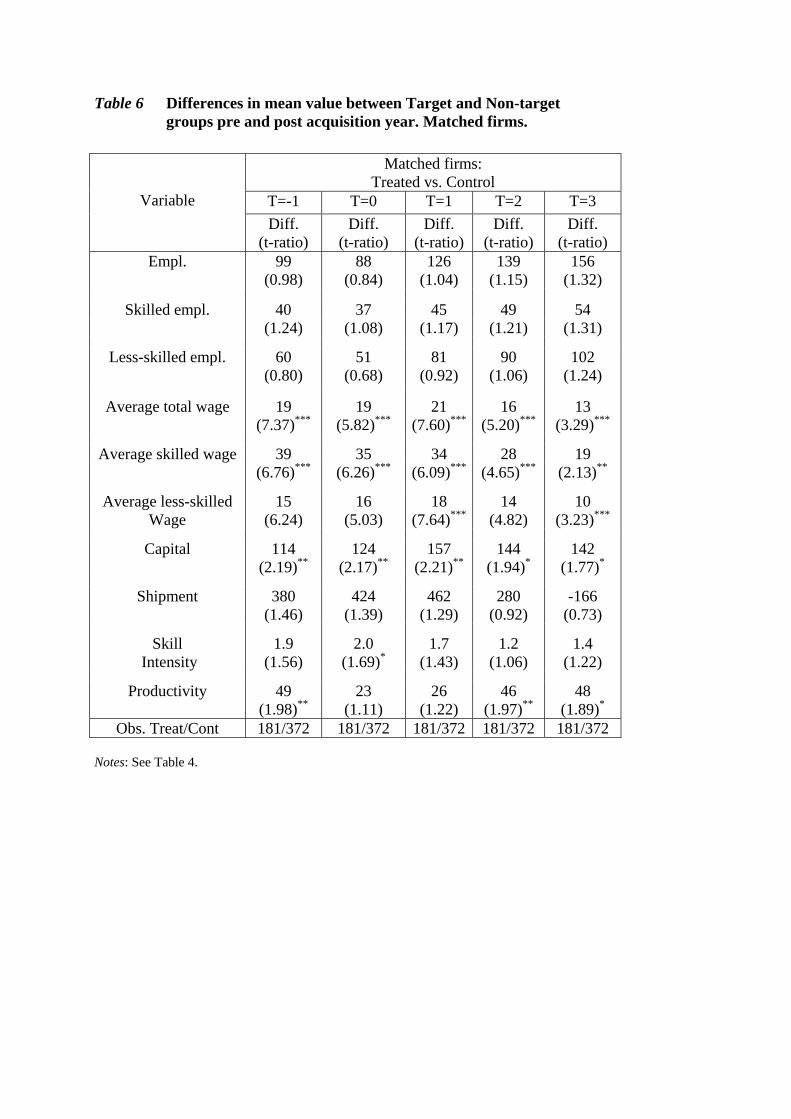
Table 6 Differences in mean value between Target and Non-target groups pre and post acquisition year. Matched firms.
Notes: See Table 4.
Matched firms: Treated vs. Control
T=-1 T=0 T=1 T=2 T=3
Variable Diff.
(t-ratio) Diff.
(t-ratio) Diff.
(t-ratio) Diff.
(t-ratio) Diff.
(t-ratio) Empl.
99
(0.98) 88
(0.84) 126
(1.04) 139
(1.15) 156
(1.32)
Skilled empl. 40 37 45 49 54 (1.24) (1.08) (1.17) (1.21) (1.31)
Less-skilled empl. 60 (0.80)
51 (0.68)
81 (0.92)
90 (1.06)
102 (1.24)
Average total wage 19 (7.37)***
19 (5.82)***
21 (7.60)***
16 (5.20)***
13 (3.29)***
Average skilled wage 39 35 34 28 19 (6.76)*** (6.26)*** (6.09)*** (4.65)*** (2.13)**
Average less-skilled Wage
15 (6.24)
16 (5.03)
18 (7.64)***
14 (4.82)
10 (3.23)***
Capital 114 (2.19)**
124 (2.17)**
157 (2.21)**
144 (1.94)*
142 (1.77)*
Shipment 380 (1.46)
424 (1.39)
462 (1.29)
280 (0.92)
-166 (0.73)
Skill Intensity
1.9 (1.56)
2.0 (1.69)*
1.7 (1.43)
1.2 (1.06)
1.4 (1.22)
Productivity
49 (1.98)**
23 (1.11)
26 (1.22)
46 (1.97)**
48 (1.89)*
Obs. Treat/Cont 181/372 181/372 181/372 181/372 181/372


Table 7 Effect of foreign acquisition on Total employment in different post-acquisition years
Level estimation Dynamic estimation DID_OLS
(t-stat) DID_OLS
(t-stat) DID_FE (t-stat)
DID_FE (t-stat)
DID_OLS (t-stat)
DID_OLS (t-stat)
DID_FE (t-stat)
DID_FE (t-stat)
TR 0.350 (3.13)***
0.339 (3.24)***
0.351 (3.11)***
0.340 (3.22)***
AF*TR 0.077 (1.73)*
0.041 (0.95)
0.041 (2.38)**
0.037 (2.14)**
AF 0.001 (0.03)
-0.008 (0.23)
-0.015 (1.14)
-0.014 (1.03)
AF*TRt+1 0.046 (0.97)
0.033 (0.70)
0.013 (0.48)
0.011 (0.38)
AF*TRt+2 0.030 (0.57)
-0.019 (0.35)
0.027 (0.95)
0.022 (0.80)
AF*TRt+3 0.089 (1.59)
0.042 (0.80)
0.046 (1.62)
0.042 (1.47)
AF*TRt+4 0.100 (1.54)
0.045 (0.73)
0.060 (2.03)**
0.055 (1.84)*
AF*TRt+5 0.135 (1.71)*
0.112 (1.56)
0.052 (1.58)
0.048 (1.48)
Firm No Yes No Yes No Yes No Yes Year Yes Yes Yes Yes Yes Yes Yes Yes
Industry Yes Yes No No Yes Yes No No Constant 4.339
(12.18)*** 4.308
(11.13)*** 4.485
(305.95)*** 4.542
(101.85)*** 4.338
(12.17)*** 4.308
(11.11)*** 4.484
(305.94)*** 4.538
(101.60)*** Obs. 3,643 3,643 3,643 3,643 3,643 3,643 3,643 3,643 R2 0.37 0.46 0.37 0.46
R2 Within 0.055 0.057 0.058 0.059 R2 Between 0.001 0.131 0.001 0.119 R2 Overall 0.004 0.061 0.004 0.055
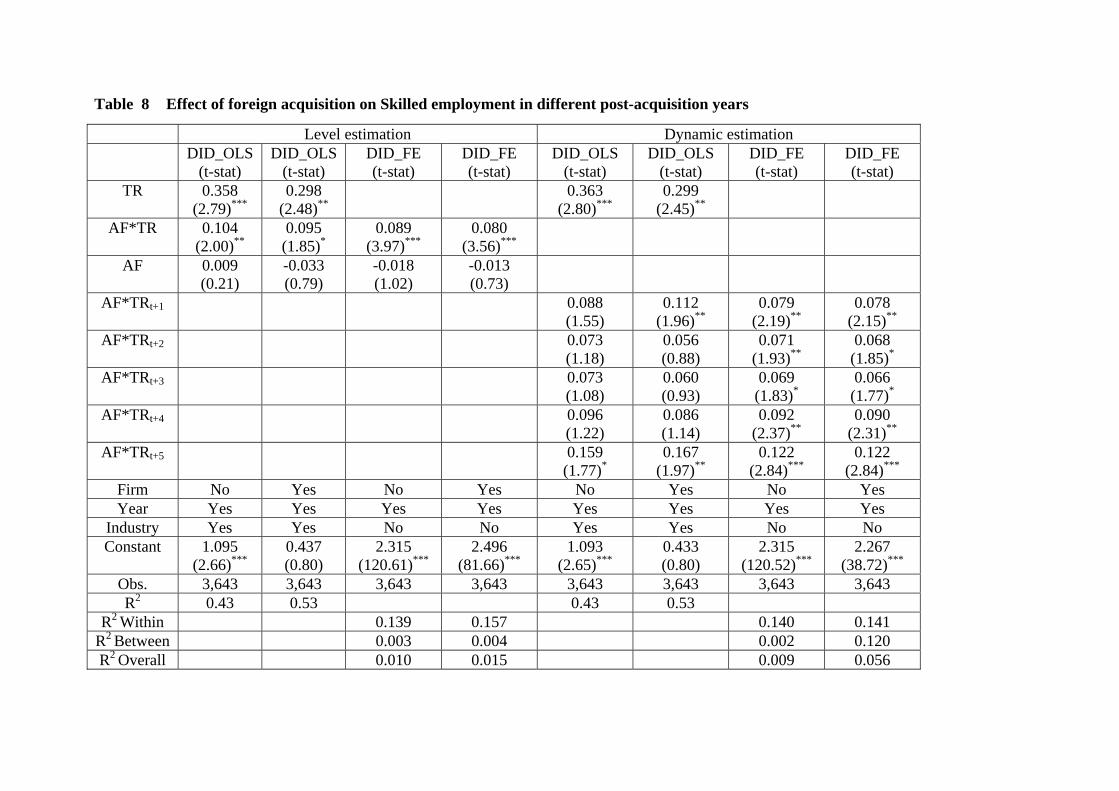
Table 8 Effect of foreign acquisition on Skilled employment in different post-acquisition years
Level estimation Dynamic estimation DID_OLS
(t-stat) DID_OLS
(t-stat) DID_FE (t-stat)
DID_FE (t-stat)
DID_OLS (t-stat)
DID_OLS (t-stat)
DID_FE (t-stat)
DID_FE (t-stat)
TR 0.358 (2.79)***
0.298 (2.48)**
0.363 (2.80)***
0.299 (2.45)**
AF*TR 0.104 (2.00)**
0.095 (1.85)*
0.089 (3.97)***
0.080 (3.56)***
AF 0.009 (0.21)
-0.033 (0.79)
-0.018 (1.02)
-0.013 (0.73)
AF*TRt+1 0.088 (1.55)
0.112 (1.96)**
0.079 (2.19)**
0.078 (2.15)**
AF*TRt+2 0.073 (1.18)
0.056 (0.88)
0.071 (1.93)**
0.068 (1.85)*
AF*TRt+3 0.073 (1.08)
0.060 (0.93)
0.069 (1.83)*
0.066 (1.77)*
AF*TRt+4 0.096 (1.22)
0.086 (1.14)
0.092 (2.37)**
0.090 (2.31)**
AF*TRt+5 0.159 (1.77)*
0.167 (1.97)**
0.122 (2.84)***
0.122 (2.84)***
Firm No Yes No Yes No Yes No Yes Year Yes Yes Yes Yes Yes Yes Yes Yes
Industry Yes Yes No No Yes Yes No No Constant 1.095
(2.66)*** 0.437 (0.80)
2.315 (120.61)***
2.496 (81.66)***
1.093 (2.65)***
0.433 (0.80)
2.315 (120.52)***
2.267 (38.72)***
Obs. 3,643 3,643 3,643 3,643 3,643 3,643 3,643 3,643 R2 0.43 0.53 0.43 0.53
R2 Within 0.139 0.157 0.140 0.141 R2 Between 0.003 0.004 0.002 0.120 R2 Overall 0.010 0.015 0.009 0.056

Table 9 Effect of foreign acquisition on Unskilled employment in different post-acquisition years
Level estimation Dynamic estimation DID_OLS
(t-stat) DID_OLS
(t-stat) DID_FE (t-stat)
DID_FE (t-stat)
DID_OLS (t-stat)
DID_OLS (t-stat)
DID_FE (t-stat)
DID_FE (t-stat)
TR 0.346 (3.27)***
0.346 (3.27)***
0.342 (3.00)***
0.347 (3.25)***
AF*TR 0.090 (1.96)**
0.046 (1.05)
0.042 (2.34)**
0.037 (2.07)**
AF -0.008 (0.21)
-0.008 (0.22)
-0.018 (1.29)
-0.016 (1.09)
AF*TRt+1 0.055 (1.13)
0.031 (0.67)
0.008 (0.28)
0.005 (0.17)
AF*TRt+2 0.041 (0.76)
-0.016 (0.30)
0.027 (0.92)
0.023 (0.77)
AF*TRt+3 0.114 (1.95)*
0.058 (1.05)
0.052 (1.74)*
0.047 (1.58)
AF*TRt+4 0.125 (1.90)*
0.058 (0.93)
0.069 (2.23)**
0.062 (2.00)**
AF*TRt+5 0.151 (1.87)*
0.120 (1.63)
0.052 (1.52)
0.048 (1.39)
Firm No Yes No Yes No Yes No Yes Year Yes Yes Yes Yes Yes Yes Yes Yes
Industry Yes Yes No No Yes Yes No No Constant 4.319
(12.21)*** 4.469
(12.47)*** 4.302
(279.30)*** 4.417
(94.30)*** 4.319
(12.20)*** 4.469
(12.46)*** 4.302
(279.34)*** 4.412
(94.07)*** Obs. 3,643 3,643 3,643 3,643 3,643 3,643 3,643 3,643 R2 0.35 0.44 0.35 0.44
R2 Within 0.037 0.040 0.040 0.042 R2 Between 0.003 0.061 0.002 0.051 R2 Overall 0.004 0.034 0.004 0.030
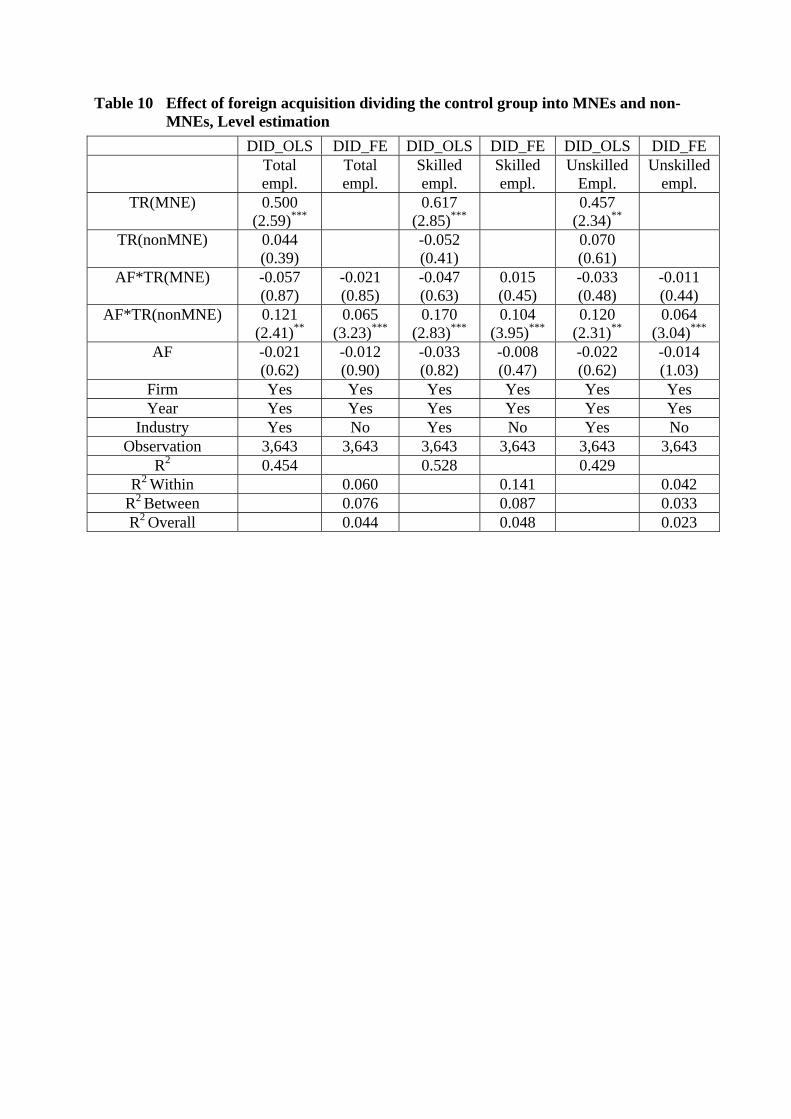
Table 10 Effect of foreign acquisition dividing the control group into MNEs and non- MNEs, Level estimation
DID_OLS DID_FE DID_OLS DID_FE DID_OLS DID_FE Total
empl. Total empl.
Skilled empl.
Skilled empl.
Unskilled Empl.
Unskilled empl.
TR(MNE) 0.500 (2.59)***
0.617 (2.85)***
0.457 (2.34)**
TR(nonMNE) 0.044 (0.39)
-0.052 (0.41)
0.070 (0.61)
AF*TR(MNE) -0.057 (0.87)
-0.021 (0.85)
-0.047 (0.63)
0.015 (0.45)
-0.033 (0.48)
-0.011 (0.44)
AF*TR(nonMNE) 0.121 (2.41)**
0.065 (3.23)***
0.170 (2.83)***
0.104 (3.95)***
0.120 (2.31)**
0.064 (3.04)***
AF -0.021 (0.62)
-0.012 (0.90)
-0.033 (0.82)
-0.008 (0.47)
-0.022 (0.62)
-0.014 (1.03)
Firm Yes Yes Yes Yes Yes Yes Year Yes Yes Yes Yes Yes Yes
Industry Yes No Yes No Yes No Observation 3,643 3,643 3,643 3,643 3,643 3,643
R2 0.454 0.528 0.429 R2 Within 0.060 0.141 0.042
R2 Between 0.076 0.087 0.033 R2 Overall 0.044 0.048 0.023
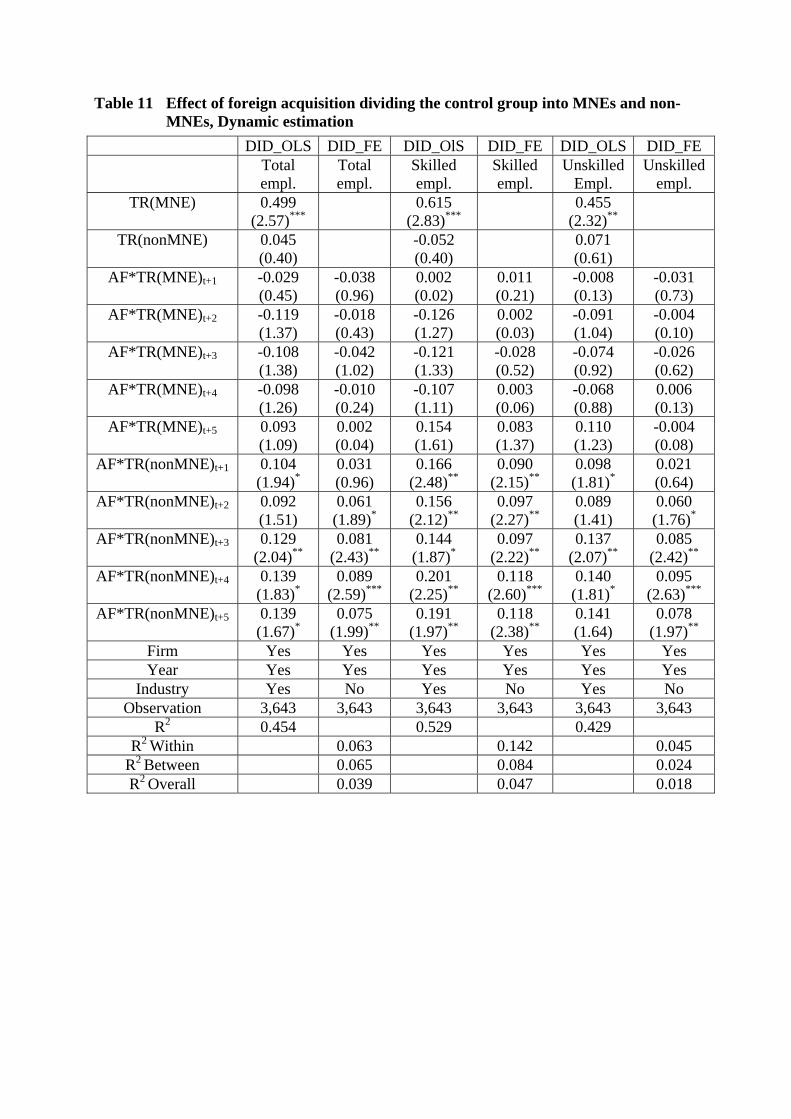
Table 11 Effect of foreign acquisition dividing the control group into MNEs and non- MNEs, Dynamic estimation
DID_OLS DID_FE DID_OlS DID_FE DID_OLS DID_FE Total
empl. Total empl.
Skilled empl.
Skilled empl.
Unskilled Empl.
Unskilled empl.
TR(MNE) 0.499 (2.57)***
0.615 (2.83)***
0.455 (2.32)**
TR(nonMNE) 0.045 (0.40)
-0.052 (0.40)
0.071 (0.61)
AF*TR(MNE)t+1 -0.029 (0.45)
-0.038 (0.96)
0.002 (0.02)
0.011 (0.21)
-0.008 (0.13)
-0.031 (0.73)
AF*TR(MNE)t+2 -0.119 (1.37)
-0.018 (0.43)
-0.126 (1.27)
0.002 (0.03)
-0.091 (1.04)
-0.004 (0.10)
AF*TR(MNE)t+3 -0.108 (1.38)
-0.042 (1.02)
-0.121 (1.33)
-0.028 (0.52)
-0.074 (0.92)
-0.026 (0.62)
AF*TR(MNE)t+4 -0.098 (1.26)
-0.010 (0.24)
-0.107 (1.11)
0.003 (0.06)
-0.068 (0.88)
0.006 (0.13)
AF*TR(MNE)t+5 0.093 (1.09)
0.002 (0.04)
0.154 (1.61)
0.083 (1.37)
0.110 (1.23)
-0.004 (0.08)
AF*TR(nonMNE)t+1 0.104 (1.94)*
0.031 (0.96)
0.166 (2.48)**
0.090 (2.15)**
0.098 (1.81)*
0.021 (0.64)
AF*TR(nonMNE)t+2 0.092 (1.51)
0.061 (1.89)*
0.156 (2.12)**
0.097 (2.27)**
0.089 (1.41)
0.060 (1.76)*
AF*TR(nonMNE)t+3 0.129 (2.04)**
0.081 (2.43)**
0.144 (1.87)*
0.097 (2.22)**
0.137 (2.07)**
0.085 (2.42)**
AF*TR(nonMNE)t+4 0.139 (1.83)*
0.089 (2.59)***
0.201 (2.25)**
0.118 (2.60)***
0.140 (1.81)*
0.095 (2.63)***
AF*TR(nonMNE)t+5 0.139 (1.67)*
0.075 (1.99)**
0.191 (1.97)**
0.118 (2.38)**
0.141 (1.64)
0.078 (1.97)**
Firm Yes Yes Yes Yes Yes Yes Year Yes Yes Yes Yes Yes Yes
Industry Yes No Yes No Yes No Observation 3,643 3,643 3,643 3,643 3,643 3,643
R2 0.454 0.529 0.429 R2 Within 0.063 0.142 0.045
R2 Between 0.065 0.084 0.024 R2 Overall 0.039 0.047 0.018