
Acoustic Survey of a 3/8-Scale Automotive Wind Tunnel
88
National Aeronautics and Space Administration Langley Research Center • Hampton, Virginia 23681-0001 NASA Technical Memorandum 4736 Acoustic Survey of a 3/8-Scale Automotive Wind Tunnel Earl R. Booth, Jr. Langley Research Center • Hampton, Virginia Gary Romberg Chrysler Technology Center • Auburn Hills, Michigan Larry Hansen Enviro-Acoustics Company • Minneapolis, Minnesota Ron Lutz Sverdrup Technologies Corporation • Tullahoma, Tennessee October 1996
Transcript of Acoustic Survey of a 3/8-Scale Automotive Wind Tunnel

National Aeronautics and Space AdministrationLangley Research Center • Hampton, Virginia 23681-0001
NASA Technical Memorandum 4736
Acoustic Survey of a 3/8-Scale AutomotiveWind TunnelEarl R. Booth, Jr.Langley Research Center • Hampton, Virginia
Gary RombergChrysler Technology Center • Auburn Hills, Michigan
Larry HansenEnviro-Acoustics Company • Minneapolis, Minnesota
Ron LutzSverdrup Technologies Corporation • Tullahoma, Tennessee
October 1996
Printed copies available from the following:
NASA Center for AeroSpace Information National Technical Information Service (NTIS)800 Elkridge Landing Road 5285 Port Royal RoadLinthicum Heights, MD 21090-2934 Springfield, VA 22161-2171(301) 621-0390 (703) 487-4650
The use of trademarks or names of manufacturers in this report is foraccurate reporting and does not constitute an official endorsement,either expressed or implied, of such products or manufacturers by theNational Aeronautics and Space Administration.
Available electronically at the following URL address: http://techreports.larc.nasa.gov/ltrs/ltrs.html

Summary
An acoustic survey that consists of insertion loss andflow noise measurements was conducted at key locationsaround the circuit of a 3/8-scale automotive acousticwind tunnel. Descriptions of the test, the instrumentation,and the wind tunnel facility are included in the currentreport, along with data obtained in the test in the form of1/3-octave-band insertion loss and narrowband flownoise spectral data.
Introduction
Background noise in acoustic wind tunnel facilitiesconsists of the summation of flow-induced noise sourcesnot caused by the test object itself and nonflow-inducednoise sources caused by mechanical and auxiliary sys-tems. Measurements of this noise in the test section areusually included as a matter of course in most acoustictest reports. Although background noise in the test sec-tion is important for comparison with test results, thenoise is usually generated elsewhere in the tunnel circuit.To date, comprehensive flow and auxiliary system noisedata that are gathered around the circuit of acoustic windtunnel facilities are rarely published. Providing thesedata for open study will lead to a better understanding offlow noise generation processes which, in turn, will leadto better acoustic wind tunnels. This report is intended toaddress the gap in the existing literature and to encouragesimilar data sets to be published from other acoustic testfacilities. The data are presented herein with minimalanalysis.
The acoustic survey was a collaboration betweenthe National Aeronautics and Space Administration(NASA), Chrysler Technology Center (CTC), Enviro-Acoustics Company Inc., and Sverdrup Technologies,Inc. Each participant in the test envisioned different usesfor the resulting data. The NASA participants were inter-ested in having the data provide an experimental data-base to compare with computational and analyticaldesign methods for designing an acoustic wind tunnel.The proposed National Wind Tunnel Complex (NWTC)will incorporate acoustic testing capabilities and datafrom this investigation to support the design effort forNWTC facilities. Chrysler built the 3/8-scale automotivewind tunnel as the pilot for a full-scale automotive windtunnel that will be used primarily for acoustic testing ofnew automobiles. For Chrysler this test was one of manydesigned to enhance understanding of this facility inorder to improve the capabilities of both the present
facility and especially the future full-scalefacility. Enviro-Acoustics manufactured several portionsof the acoustic treatment for the pilot facility, such as theboundary-layer removal system and the acousticallytreated turning vanes, and intended this test primarily as
a hardware verification test. Finally,Sverdrup Technolo-gies designed the facility based on design specificationsfrom Chrysler and will use the test results to verify thatdesign specifications were met for the pilot tunnel. Eachparticipant in the test recognized and understood themotivations and objectives of the other participants, andeach brought various unique contributions and capabili-ties to the testing effort. The resulting collaborative testeffort produced data to fulfill all test requirements andthus to provide a model for future NASA-Industry col-laborative efforts.
Symbols and Abbreviations
ATS test section area (also contraction nozzle exitarea), 33 ft2
A/ATS ratio of local TScross-sectional area to testsection area
B.L.S. boundary-layer removal system
bw bandwidth, Hz
pressure rise produced by the drive fan, lb/ft2
l/d ratio length to depth
M Mach number
OASPL overall sound pressure level, dB re 20µPa
p0 test section static pressure, lb/in2
q dynamic pressure, lb/ft2
SPL sound pressure level, dB re 20µPa
T temperature inside test section,°F
Description of 3/8-Scale Automotive WindTunnel
The 3/8-scale automotive wind tunnel is a closed-circuit atmospheric pressure automotive wind tunnel.The overall tunnel circuit layout is shown in figure 1.The test section, measuring 4.4 ft high by 7.5 ft wide, canbe converted from an open jet test section bounded by afloor with tops and sides open, as shown in the figure, toa slotted-wall test section configuration. In the slotted-wall configuration, 30-percent open-area ratio-ventilatedsidewalls and ceiling surround the test section. The flooris nonventilated for both configurations. The tunnel iscapable of producing a top speed on the order of200mph (M = 0.23) in either the slotted or open jet testsection configurations. The acoustic calibration measure-ments were performed with the test section in the openjet configuration.
The test section is enclosed in a plenum chamber thatis 9.38 ft high by 16.88 ft wide by 36.25 ft long. The ratioof plenum area to test section cross-sectional area is 4.8.In the open jet configuration, a flow collector is located
3/8-scale
∆pfan

2
17 ft downstream from the contraction exit plane. Thecollector consists of two sides and a ceiling, each angled15° from the tunnel centerline. The collector is ventilatedby 1-ft-long air vents that are halfway down the length ofthe collector and at the collector exit. The air vent at theexit of the collector separates the collector from theentrance to the first diffuser.
In addition to the test section and plenum, the windtunnel circuit consists of low half-angle diffusers, a con-stant cross-sectional flow area from turn 3 to the contrac-tion, a 6.3:1 contraction ratio nozzle, a honeycomb, and asingle turbulence screen. Major wind tunnel circuit ele-ments are briefly described in the following paragraphs.
The first diffuser is 27.75 ft long with a 2.28° equiv-alent half-angle. Turn 1 has an area ratioA/ATS of 1.97.The cross-leg diffuser that connects turns 1 and 2 is14.26 ft long with an equivalent half-angle of 2.21°.Turn2 has an area ratio of 2.48. The turning vanes arethe large, double-circular arc type with a gap-to-chordratio of 0.41 and were designed based on the concept pre-sented in reference 1. The chord of the turning vanes is2.65 ft for turns 1 and 2 and 4.98 ft for turns 3 and 4. Thepositive pressure surfaces of the turning vanes in all fourturns have perforated surfaces and are filled with acous-tic absorbing material. A debris screen is mounted to theleading edge of the turning vanes in turn 2 to protect thefan from foreign objects carried by the airstream.
The fan section, just downstream of turn 2, has anarea ratioA/ATS of 2.26. The main fan is an axial-typevariable-speed system driven by an internal electricmotor rated at 1000 hp. The fan diameter is 11.44 ft on a6-ft diameter hub. The fan has 10 blades and 13 statorsand is controllable from 0 to 875 rpm. The fan is housedin an aero-dynamically faired nacelle which is supportedby aero-dynamically faired supports. The fan motor iscooled by air circulation through the support struts. Air isdrawn from above the tunnel by a cooling fan to themotor and out through the sides of the fan sectionthrough vents in the tunnel shell. Operation of the drivemotor cooling fan was thought to be a major source offlow noise prior to this test.
The backleg diffuser is 63.97 ft long and has anequivalent half-angle of 2.96°. Turns 3 and 4 both havean area ratio of 6.3. A flow heat exchanger is located inthe low-speed cross leg between turns 3 and 4. Thecooler is a two-row vertical-staggered round-tube config-uration with circular fins. A constant cooling water flowis maintained through the cooler in a counterflow fashionby using a circulation pump, piping, and mixing valves.Chilled water is mixed in as required to maintain a con-stant airflow temperature, as sensed by instrumentationlocated near the turbulence screen. This system can
maintain the operating temperature between 70°F and90°F over all operating speeds.
The flow-conditioning section is located upstream ofthe contraction and consists of an aluminum honeycomband a stainless-steel turbulence reduction screen. Thehoneycomb has 3/16-in-wide cells and is 3 in. deep, giv-ing a celll/d of 16. The screen is constructed of 0.015-in-diameter woven wire cloth with a wire spacing of0.064 in. (16 mesh). The screen open area ratio is58 percent.
A boundary-layer-removal-system (B.L.S.) inletscoop is located 2.75 ft downstream of the contractionexit plane on the test section floor. This system, whenactive, removes the boundary layer from the floor of thetest section and reinjects the flow into the diffuser. Thesystem is acoustically treated to prevent an increase intest section background noise from B.L.S. operation. Thesystem includes acoustically treated flow removal ducts,flow plenum, flow reinjection ducting, and a flow rein-jection slot in the first diffuser floor. The boundary-layersystem is driven by a centrifugal fan equipped with avariable-speed drive and an air exhaust to the buildingexterior. The boundary-layer system is controlled byadjusting the boundary-layer-removal fan speed until thedifferential pressure measured across the inlet scoopupper lip is zero. Reference 2 presents a completedescription of the facility.
Test Description
The data included herein encompass three parts ofthe test program carried out in the 3/8-scale automotivewind tunnel: (1) insertion loss measurements of variouswind tunnel components, (2) background noise measure-ments caused by the operation of the boundary-layerremoval system and the drive fan cooling motor, and(3) flow noise measurements at key locations around thewind tunnel circuit.
The insertion loss measurement tests were per-formed to determine the acoustic absorption characteris-tics of various wind tunnel components (such as theturning vanes) in the absence of flow. The tests were per-formed by generating a diffuse acoustic field on one sideof the component and by comparing simultaneous mea-surements made on the source side and the transmittedside of the component, as shown schematically in fig-ure2(a). A photograph of the test setup for insertion lossmeasurement in turn 3 is presented in figure 2(b).
Measurements of background noise caused by opera-tion of the B.L.S. and the cooling fan for the drive motorwere performed to assess the contribution to test sectionbackground noise made by these systems. The data weremeasured in the center of the test section with no flow in

3
the tunnel for a range of B.L.S. motor rpm’s and with thecooling fan for the drive motor either on or off.
Flow noise measurements were made at several rep-resentative locations around the wind tunnel circuitshown in figure 1. In order to ensure that placement ofthe microphone in the flow did not adversely affect noiselevel in the test section, a reference microphone wasplaced outside the flow adjacent to the test section,shown as position 0 in figure 1. No changes in the refer-ence test section noise level resulted from microphonehardware in the flow at any of the test locations. In fig-ure3 a photograph of the flow noise test setup in the testsection shows both the in-flow microphone at position 1and the reference microphone at position 0.
Instrumentation
Data were measured with a B&K 1/2-in. micro-phone, type 4166, for the source side measurement in theinsertion loss tests and the reference microphone mea-surements in the flow noise tests. Data for the transmitted(data) signal measurement in the insertion loss tests andflow noise measurement around the circuit were mea-sured with a B&K 1-in. microphone, type 4144. With theexception of the 1-in. microphone for the flow test, allmicrophones were outfitted with standard B&K grid capsand foam windscreens. For the flow noise test, the 1-in.microphone was outfitted with a standard B&K nosecone. The data were recorded on a Nagra portable taperecorder at a tape speed of 7.5 in/sec, which resulted in ausable frequency range of 35 Hz to 20 kHz from therecorded data. Data were also measured on-line by usinga B&K model 2133 Spectral Analyzer, which provided1/12-octave-band on-line data plots during the test.Although the on-line data are not presented in this report,the overall sound pressure values from the on-line dataagree with the narrowband data presented in this report towithin 1.0 dB.
After the test, the data were digitized from therecorded tapes by using a NASA digital data acquisitionsystem. The data were sampled for 8 sec at a rate of40000 samples/sec and were low-pass filtered at 20 kHzto prevent aliasing of the data. Data were then written tocomputer disk for subsequent analysis. The flow noisedata were analyzed with a Fourier transform in18 independent blocks of 16384 data points to provide2.441-Hz-bandwidth data for frequencies up to 20 kHzfor the flow noise data. The insertion loss data were fur-ther processed into the 1/3-octave-band format, sinceinsertion loss testing is more commonly presented in thatformat.
During posttest data processing, it was discoveredthat the on-line data system had contaminated the flownoise data in the frequency range of 15 to 17 kHz. Since
the contamination does not represent a physical noisesource in the 3/8-scale automotive wind tunnel, thesedata have been corrected by interpolating the spectraldata across the affected frequency range.
Presentation of Data
Tables 1, 2, and 3 serve as a directory for locat-ing data at specific conditions. Table 1 lists figures 4through12 for insertion loss data as a function of loca-tion. Since the wind tunnel drive fan is normally assumedto be the largest contributor to test section backgroundnoise, the insertion loss data were usually acquired in thedirection away from the fan; that is, the generating sidewas usually closer to the drive fan than to the transmittedside of the component that was being evaluated. Anexception to this rule is the data presented in figure 8.Here the insertion loss of turn 3 was evaluated in thedirection toward the fan for comparison with figure 7(a),where data were acquired in the direction away fromthe fan. Insertion loss data are presented in the form of1/3-octave-band sound pressure level as a function of fre-quency band. The data presented are the difference insound power between the generation and transmittedsides of the component that is measured. Data for fre-quencies less than 178 Hz (200-Hz 1/3-octave band),where acoustic wavelengths are greater than tunnel char-acteristic dimensions, were disregarded because ofexpected contamination by standing-wave phenomenon.Since the microphones used on the transmitted and gen-eration sides were different, a calibration test in whichboth microphones were located on the generation side ofturn 1 was used to assess a microphone correction func-tion that represented microphone sensitivity differences,as shown in figure 4. All insertion loss data are correctedwith this microphone correction function.
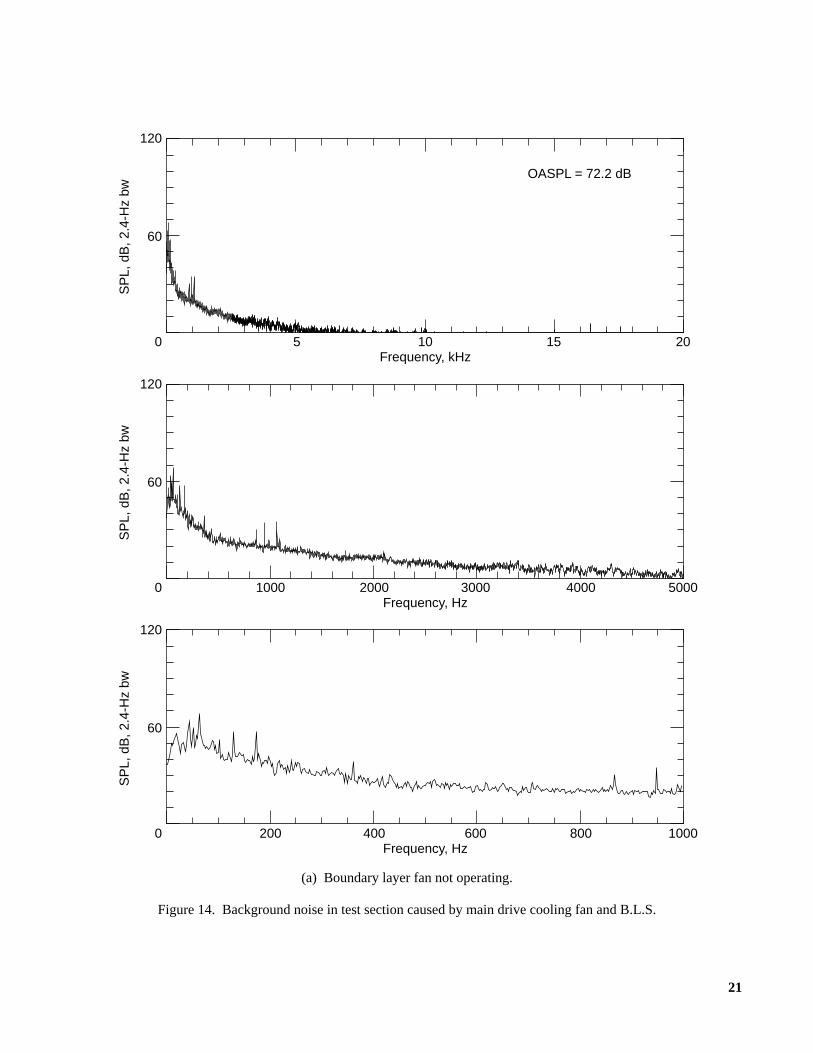
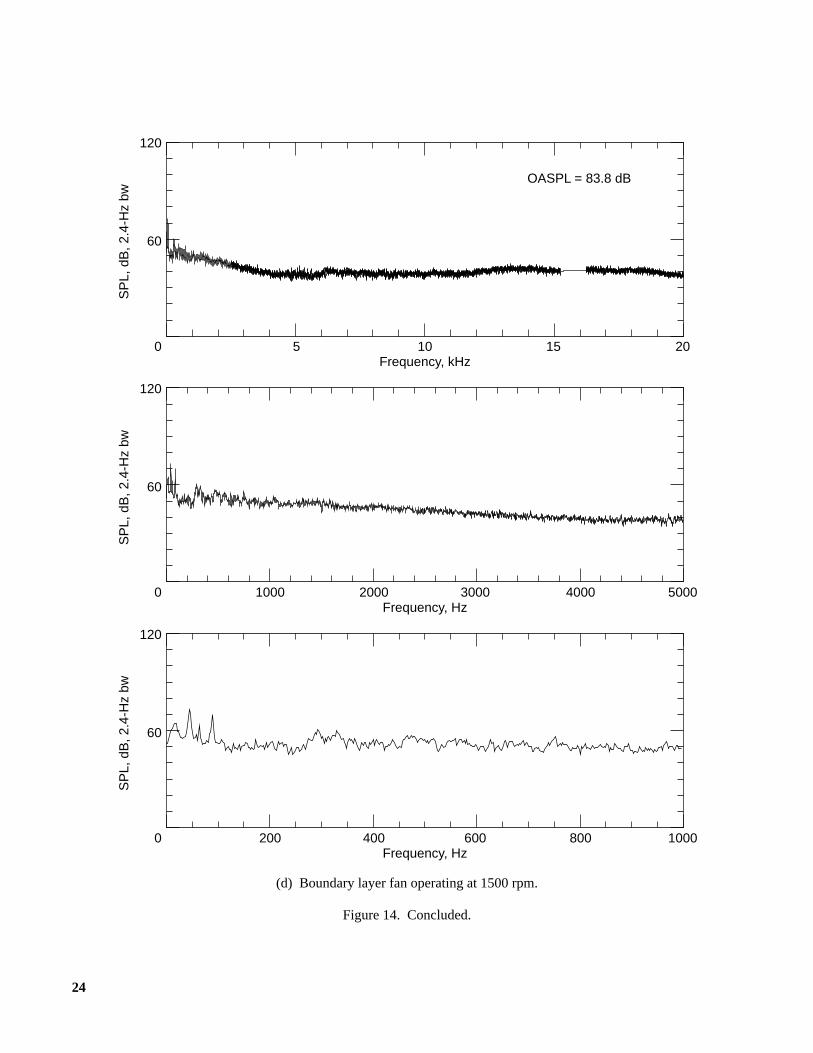
Table 2 lists data (figs. 13 and 14) for backgroundnoise measurements in the test section. The noise wascaused by operation of the boundary-layer removal sys-tem and the cooling fan for the drive motor when therewas no flow in the tunnel. Data for these measurementswere processed in the same manner as the flow noisemeasurements described below.
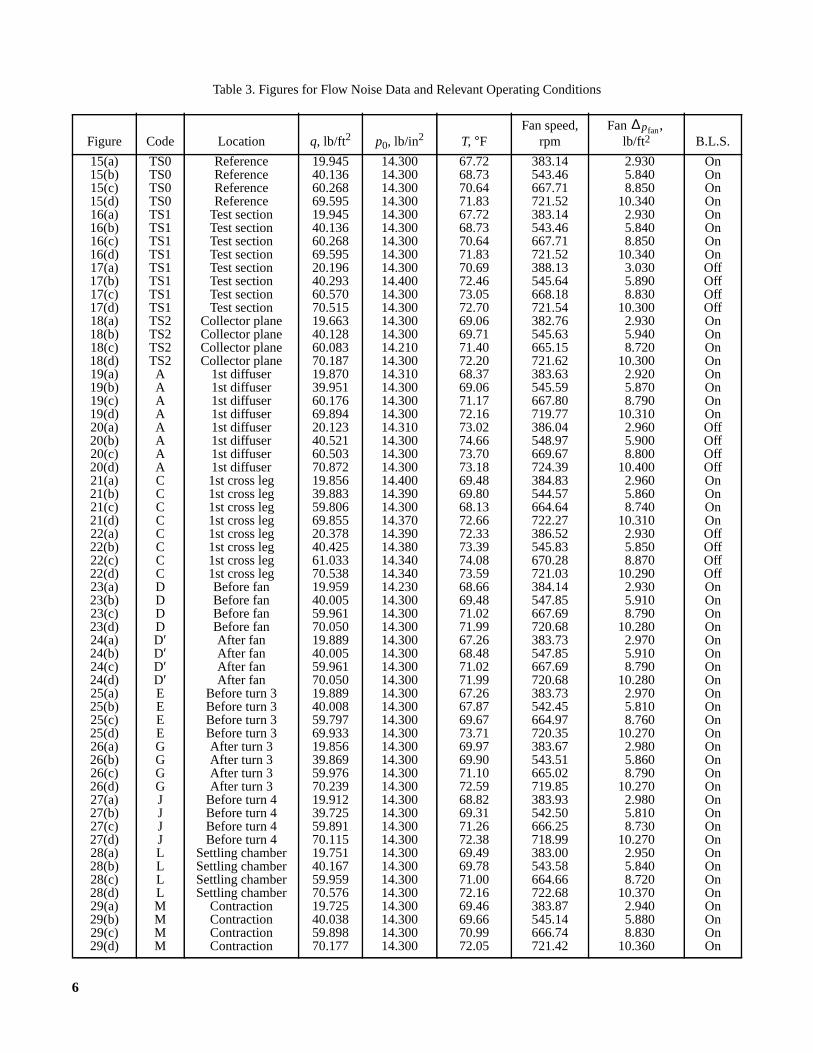
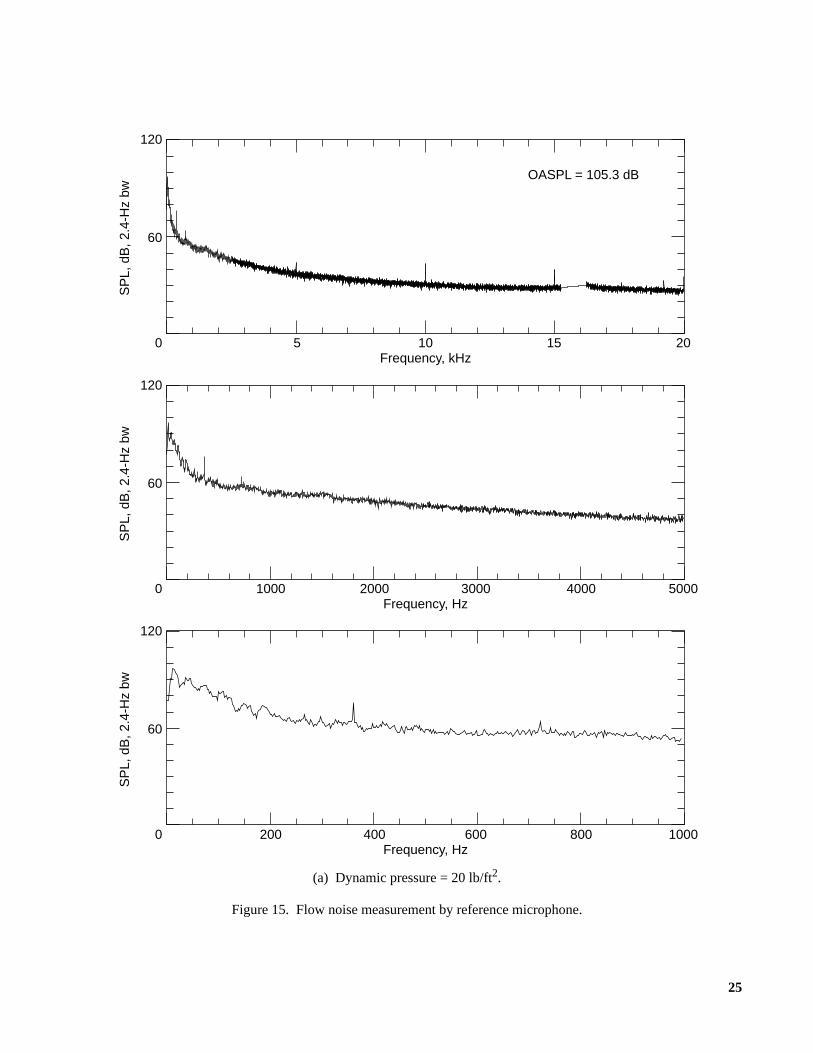
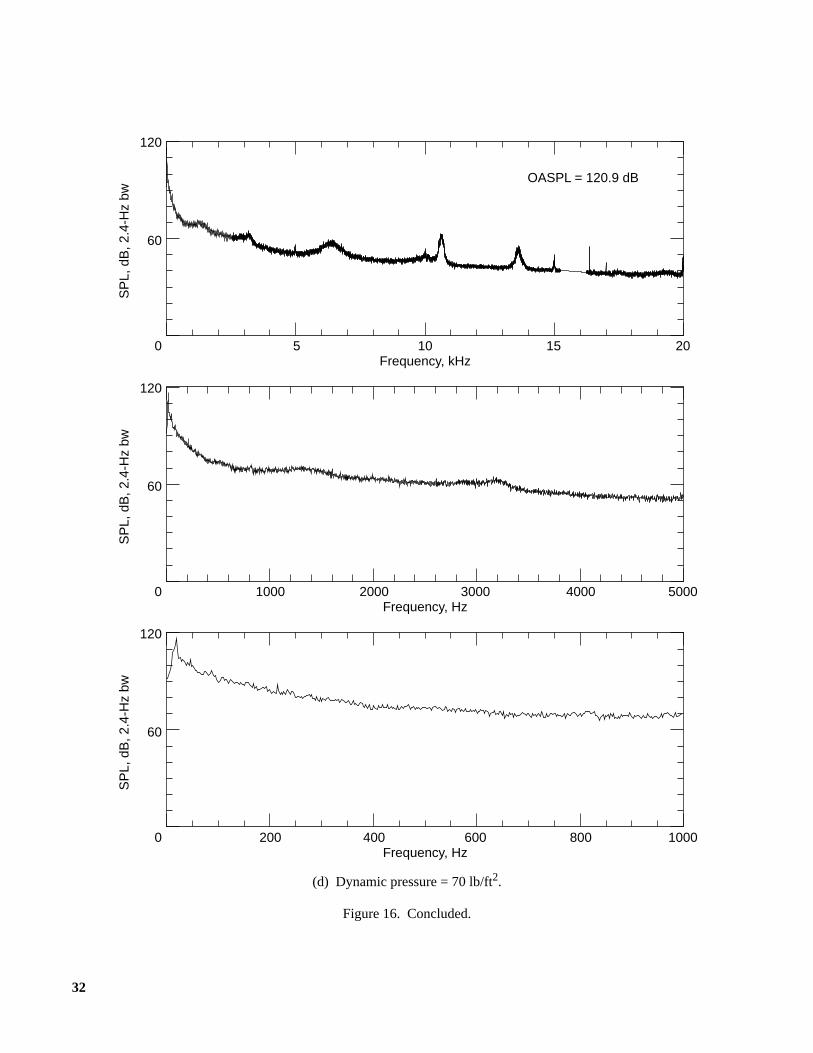
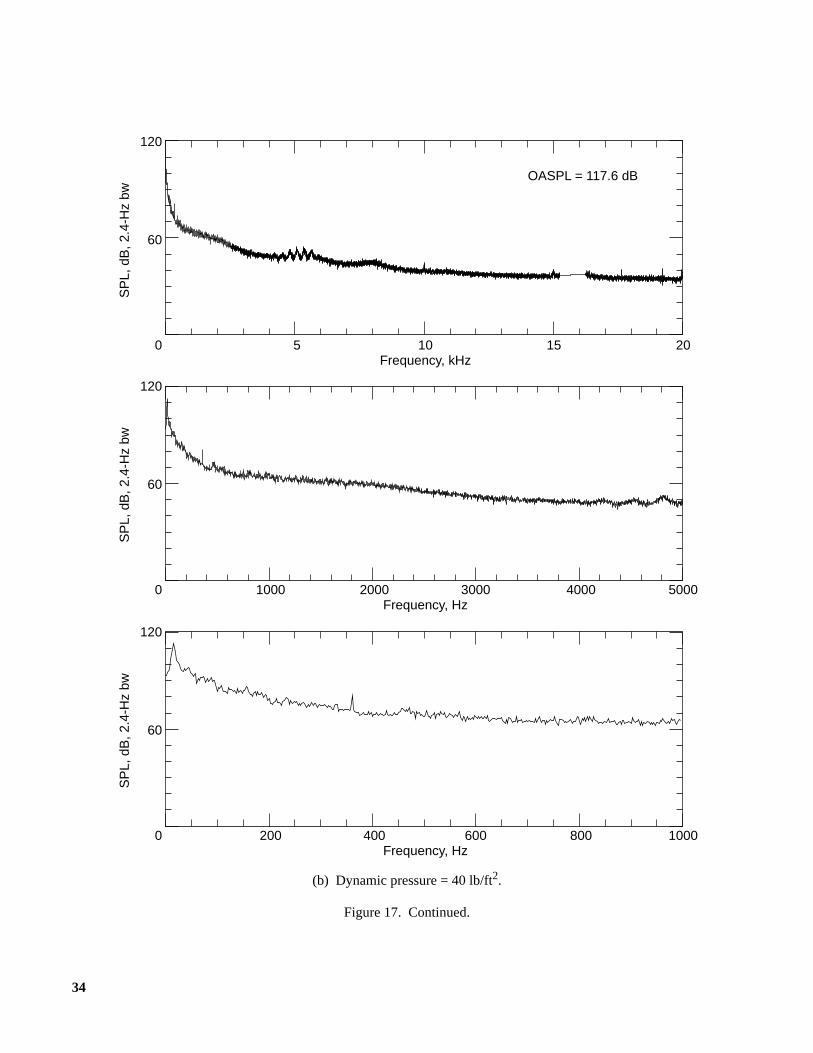
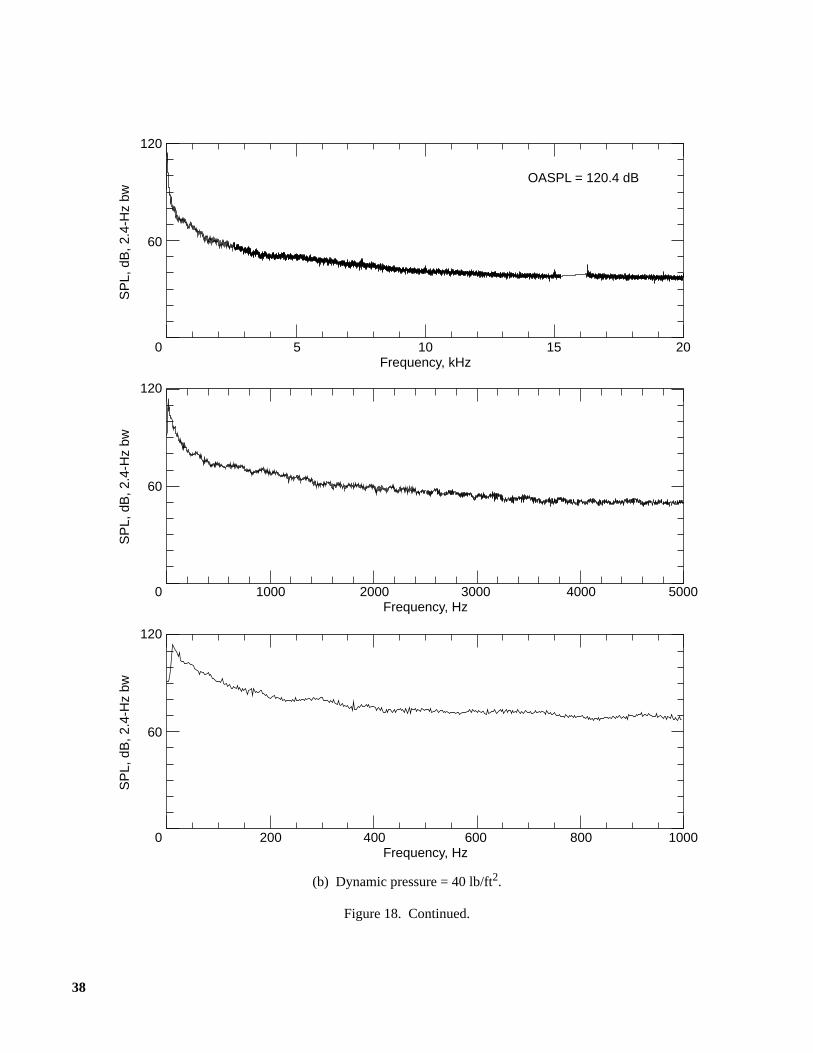
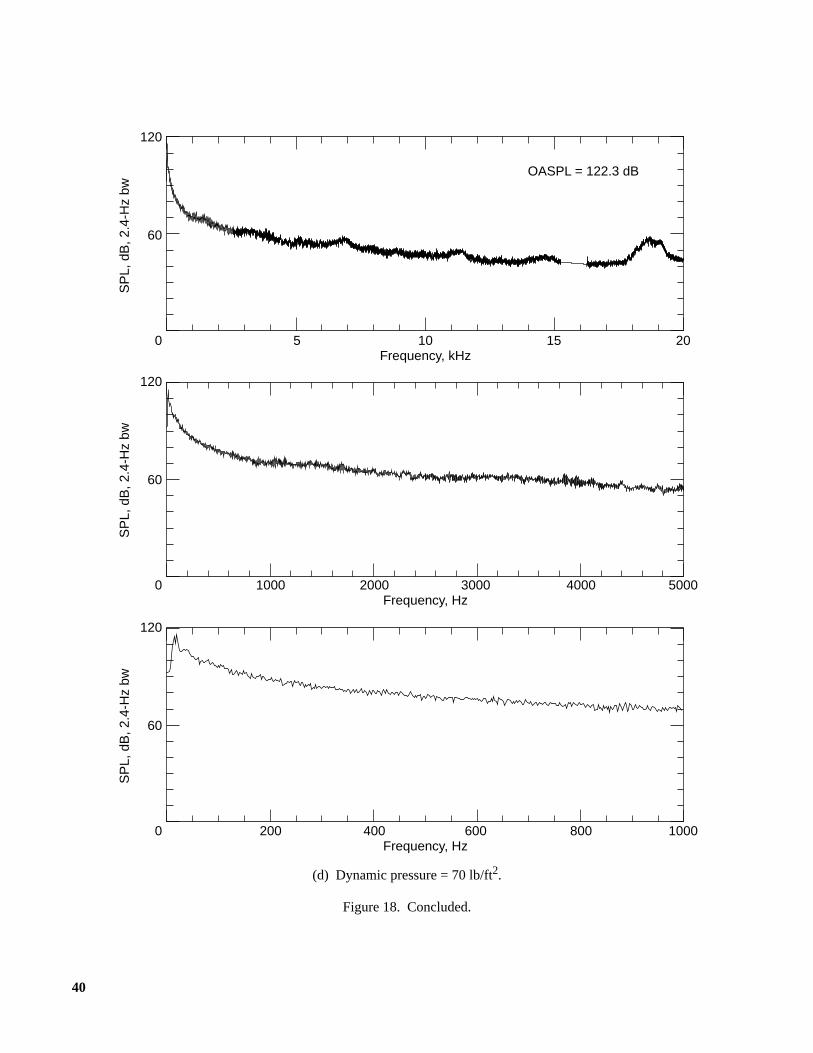
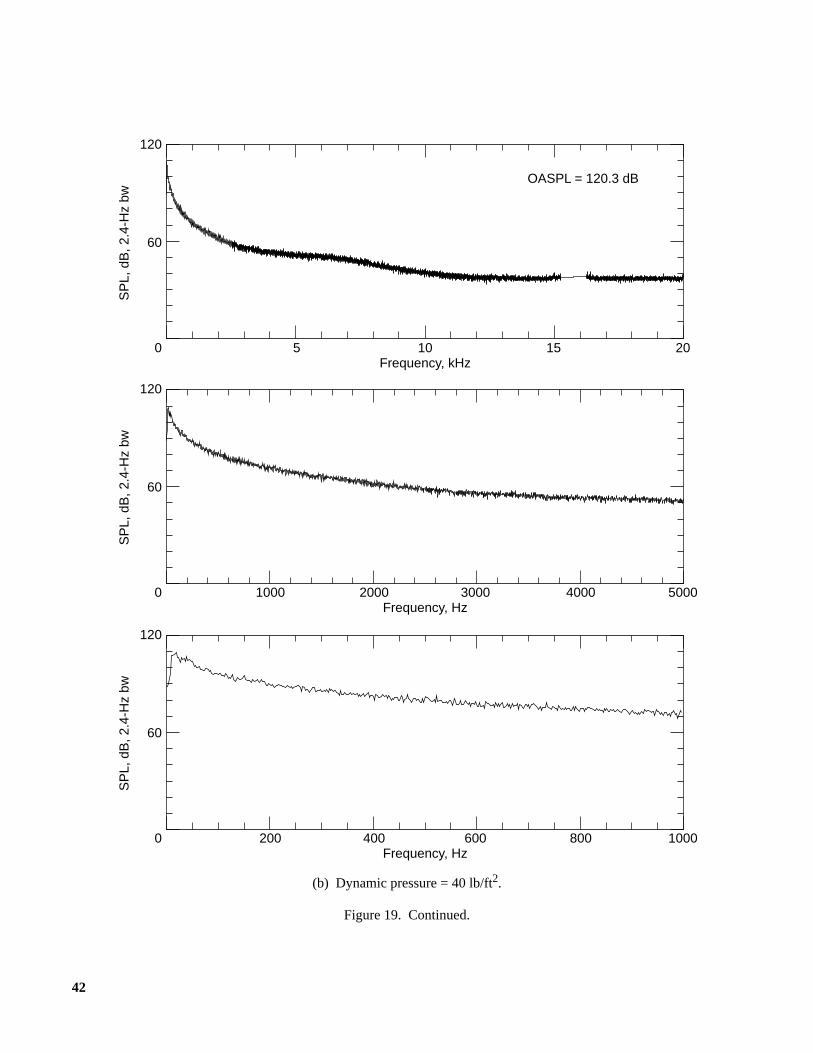
Table 3 lists figures 15 through 29 for flow noisedata as a function of location and tunnel dynamic pres-sure. Other relevant wind tunnel operating conditions arealso included in table 3. Data are presented for each mea-surement location for test section dynamic pressure lev-els of 20, 40, 60, and 70 lb/ft2. Reference test sectiondata are presented once, in figure 15, since these datawere independent of the in-flow microphone position.Data are presented in the form of sound pressure level asa function of frequency with a bandwidth of 2.441 Hz.Both test section background noise data and tunnel

4
circuit flow noise data are presented in three frequencyrange plots: (1) up to 20 kHz to provide aglobal view ofthe data; (2) up to 5 kHz; and (3) up to 1000Hz to pro-vide details of low frequency data, where the amplitudeswere the greatest.
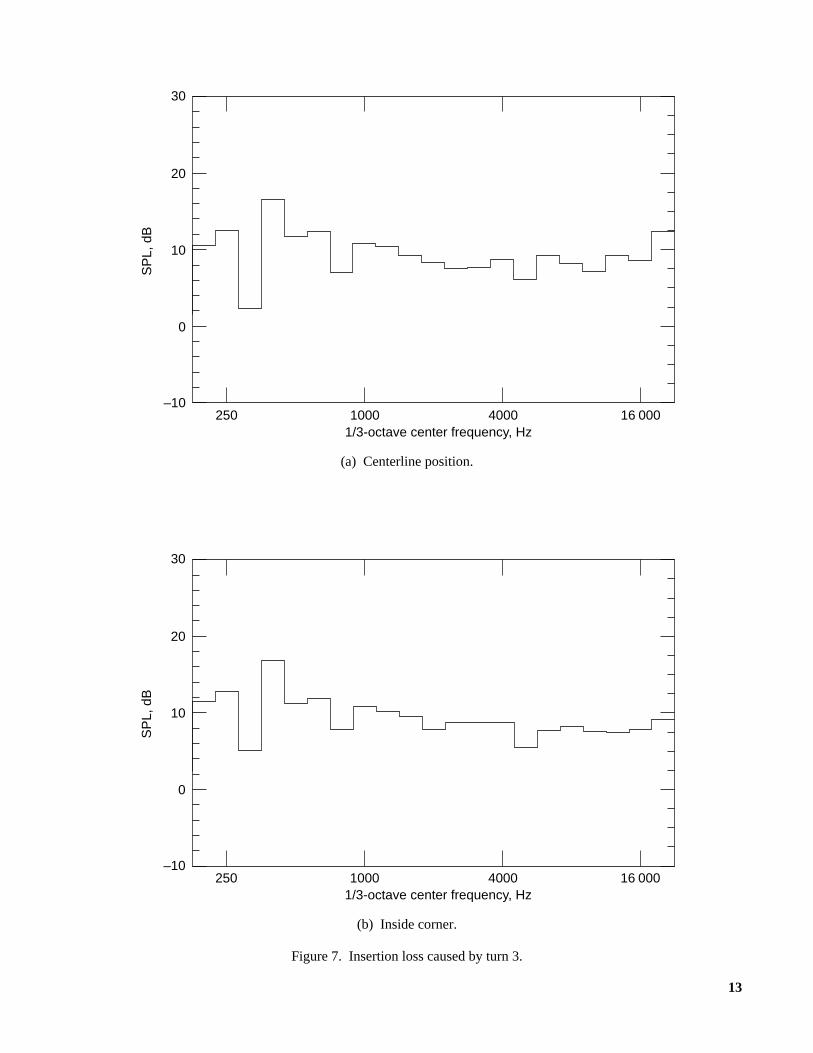
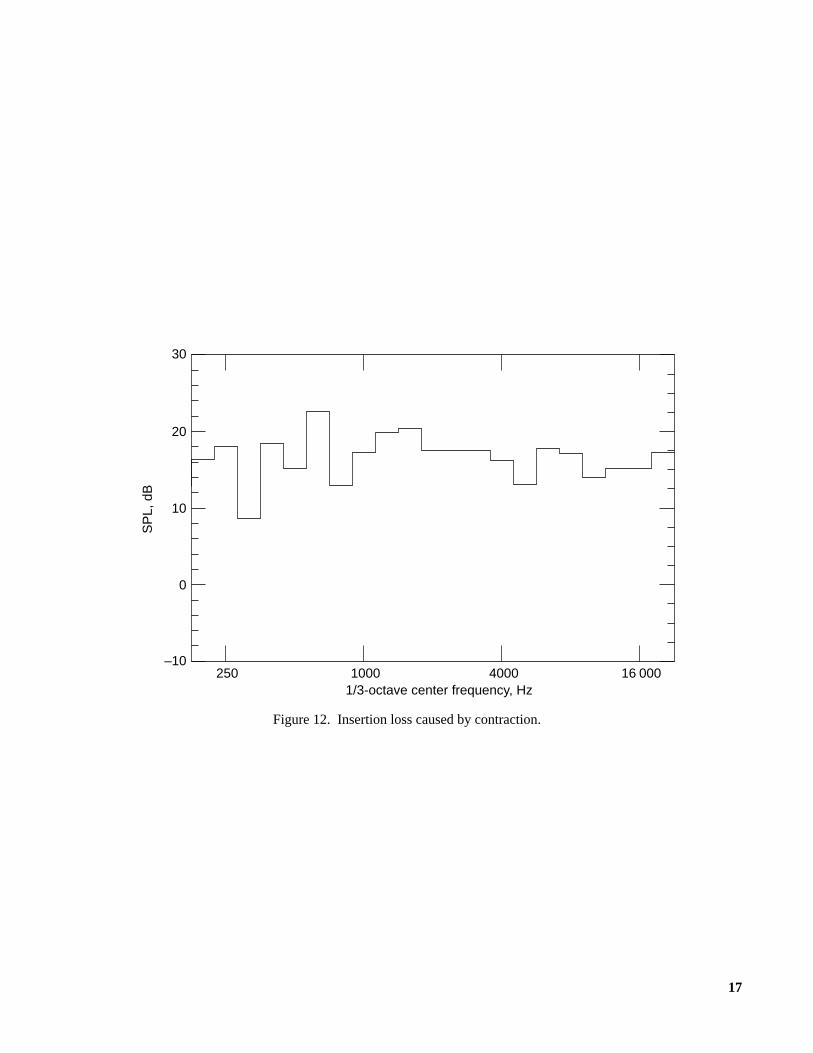
Although an extensive analysis of all these data isbeyond the scope of this report, a brief discussion ofsome of the interesting aspects of the data is providedhere. First, as shown in figures 5 and 6, the turning vanesin turns 1 and 2 generally provided between 5 and 10 dBattenuation for frequencies above 300 Hz. Treated turn-ing vanes are not expected to provide much, if any,attenuation for low frequencies, where the acousticwavelength is much greater than the turning vane chord.Correspondingly, turns 3 and 4, as shown in figures 7(a)and 10, attenuated transmitted acoustic energy somewhatbetter into slightly lower frequency ranges because oftheir larger chords. As expected, not much insertion losswas measured in the heat exchanger (fig. 9) and in thehoneycomb and screens (fig. 11). Figure 12 shows thecontraction provided significant attenuation for frequen-cies greater than 300 Hz, primarily due to reflection ofacoustic energy by the contraction back into the upstreamdirection. This result suggests that attenuation of noisefrom the settling chamber to the test section may bereduced by increasing the contraction ratio. Static inser-tion loss, as measured here, is expected to be greater thanthe actual attenuation experienced during tunnel opera-tion because of flow convection effects.
Prior to this test, auxiliary systems were thought tocontribute significantly to test section background noise.Figures 13 and 14 show that background noise from anyof the auxiliary systems is actually of a much smallermagnitude than the flow noise in the test section, mea-sured at a dynamic pressure of 20 lb/sec2, as shown infigures 16(a) and 17(a). Interestingly, the flow noisemeasured in the test section was greater with theboundary-layer system turned off for dynamic pressuresof 60lb/sec2 and 70lb/sec2, as shown in figures16(c),17(c), 16(d), and 17(d). A possible explanation is thatimproved stability of the test section flow was caused byremoval of the boundary layer on the floor during the
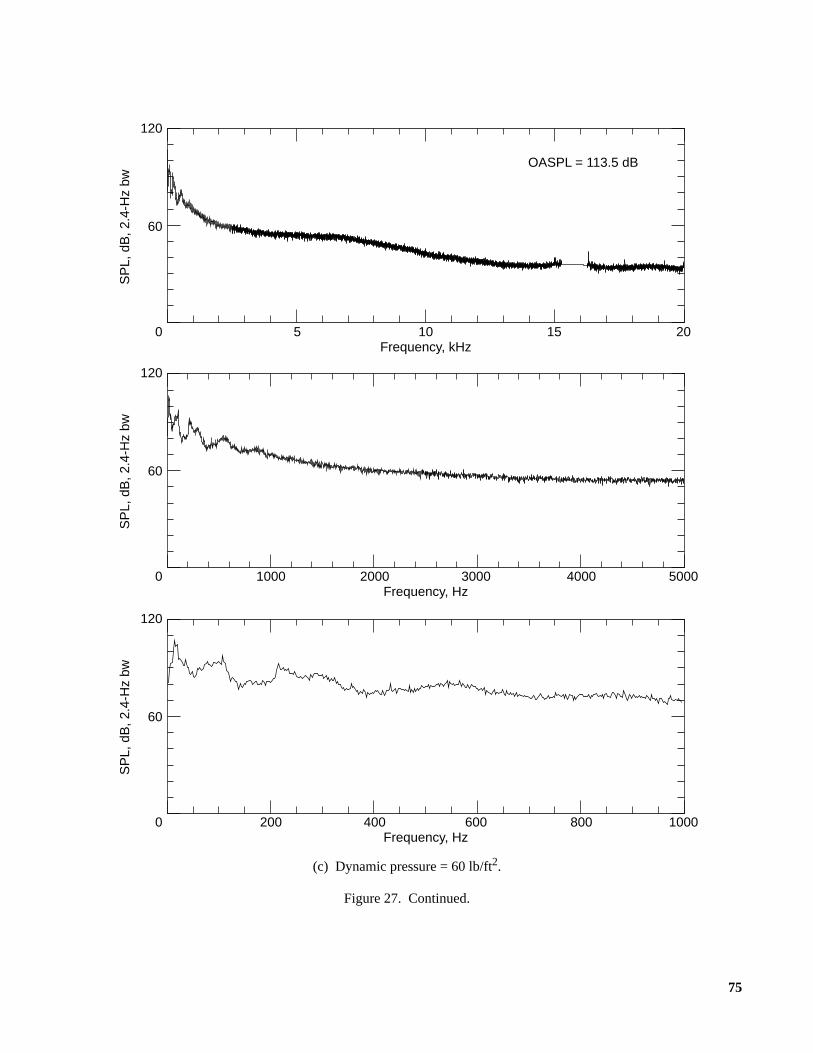
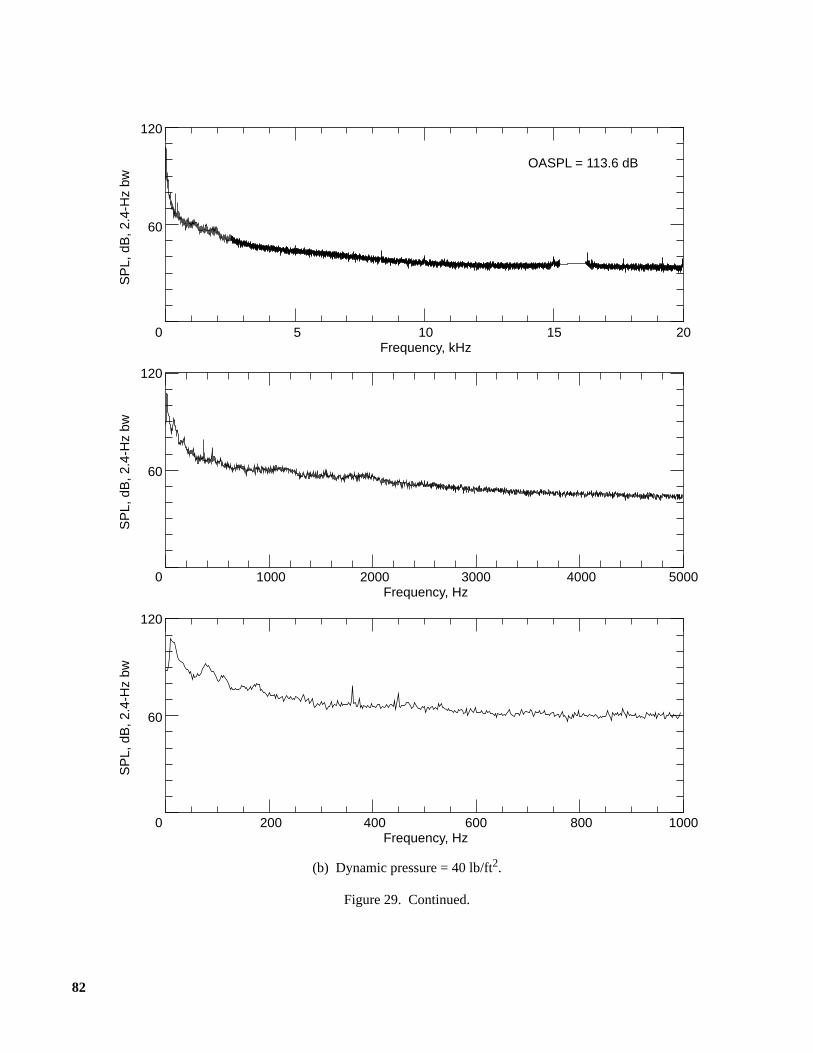
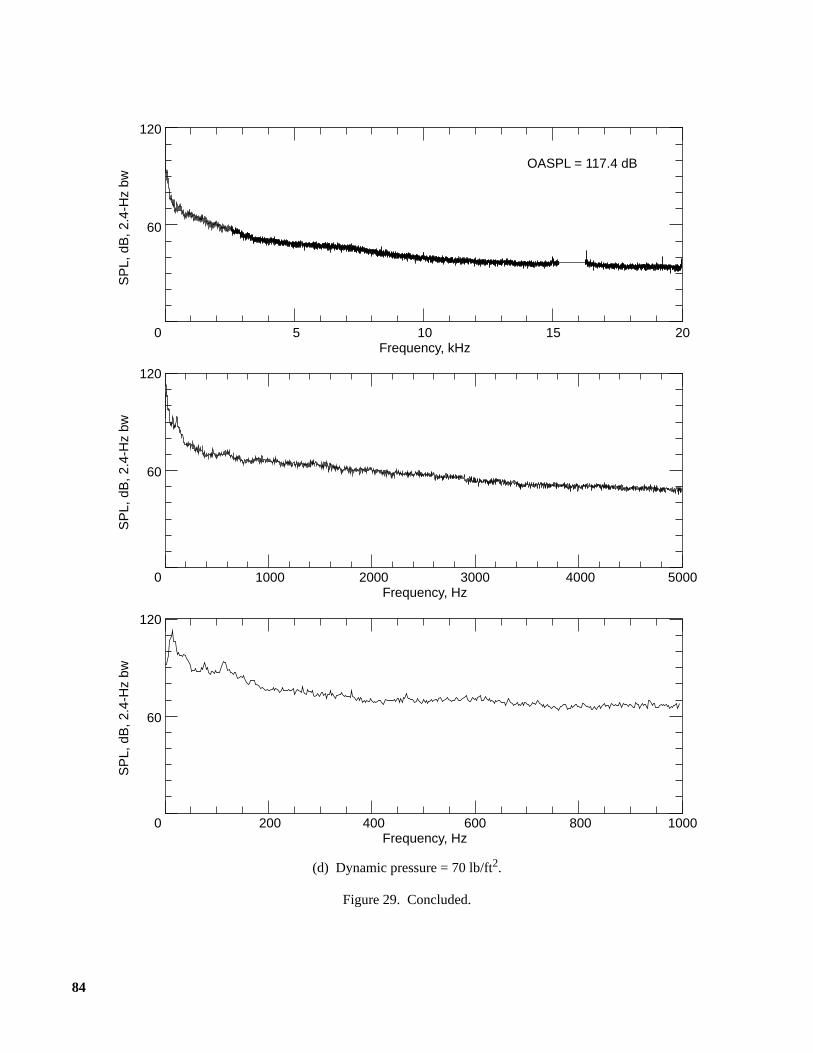
high-speed tests. Significantly, drive fan blade harmon-ics, shown most clearly immediately downstream of thefan station (fig. 24) as the series of tones between 300and 900 Hz, are not evident upstream of turn 1, as shownin figure 20, but are detectable downstream of the fan atall measurement locations to the contraction, as shown infigures 25 through 29. These data indicate that the fantones traveled towards the test section via the down-stream route, even though the acoustic turning vanes inturns 3 and 4 offer much more acoustic treatment areathan is in the turning vanes in turns 1 and 2. Fortunately,the attenuation offered by the contraction (fig. 12), cou-pled with the acceleration of the flow and the resultingincrease of flow noise level, kept fan tones from beingevident in the test section.
Concluding Remarks
An acoustic calibration of a 3/8-scale automotivewind tunnel was performed by a group composed ofmembers from government and industry. Through col-laboration this test provided data to meet all the testobjectives of each test partner. Data from the test werepresented to document flow noise levels and insertionlosses that are provided by various flow-conditioningdevices around the acoustic wind tunnel circuit, to fill agap in the existing literature concerning flow noise inacoustic test facilities, and to serve as a database to vali-date design methods for future wind tunnel facilities.
NASA Langley Research CenterHampton, VA 23681-0001July 17, 1996
References
1. Gelder, T. F.; Moore, R. D.; Sanz, J. M.; and McFarland, E. R.:Wind Tunnel Turning Vanes of Modern Design. AIAA-86-0044, Jan. 1986.
2. Romberg, Gary F.; Gunn, James A.; and Lutz, Ronald G.:TheChrysler 3/8-Scale Pilot Wind Tunnel. SAE Paper 94-0416,Mar. 1994.

5
Table 1. Figures for Insertion Loss Data as Function of Wind Tunnel Circuit Location
Figure Source microphone Data microphone Location
4 B B Microphone differences5 B A Turn 16 D C Turn 2
7(a) E F Turn 37(b) E F Turn 3 inside corner7(c) E F Turn 3 outside corner8 F E Turn 3 upstream9 G H Heat exchanger10 J K Turn 411 L M Screen and honeycomb12 M N Contraction
Table 2. Figures for Background Noise Caused by Operation of B.L.S. and Drive Motor Cooling Fan
Figure Code LocationB.L.S. fan speed,
rpm Cooling fan
13(a) TS1 Test section 500 Off13(b) TS1 Test section 1000 Off13(c) TS1 Test section 1500 Off14(a) TS1 Test section 0 On14(b) TS1 Test section 500 On14(c) TS1 Test section 1000 On14(d) TS1 Test section 1500 On
6
Table 3. Figures for Flow Noise Data and Relevant Operating Conditions
Figure Code Location q, lb/ft2 p0, lb/in2 T, °FFan speed,
rpmFan
lb/ft2 B.L.S.
15(a) TS0 Reference 19.945 14.300 67.72 383.14 2.930 On15(b) TS0 Reference 40.136 14.300 68.73 543.46 5.840 On15(c) TS0 Reference 60.268 14.300 70.64 667.71 8.850 On15(d) TS0 Reference 69.595 14.300 71.83 721.52 10.340 On16(a) TS1 Test section 19.945 14.300 67.72 383.14 2.930 On16(b) TS1 Test section 40.136 14.300 68.73 543.46 5.840 On16(c) TS1 Test section 60.268 14.300 70.64 667.71 8.850 On16(d) TS1 Test section 69.595 14.300 71.83 721.52 10.340 On17(a) TS1 Test section 20.196 14.300 70.69 388.13 3.030 Off17(b) TS1 Test section 40.293 14.400 72.46 545.64 5.890 Off17(c) TS1 Test section 60.570 14.300 73.05 668.18 8.830 Off17(d) TS1 Test section 70.515 14.300 72.70 721.54 10.300 Off18(a) TS2 Collector plane 19.663 14.300 69.06 382.76 2.930 On18(b) TS2 Collector plane 40.128 14.300 69.71 545.63 5.940 On18(c) TS2 Collector plane 60.083 14.210 71.40 665.15 8.720 On18(d) TS2 Collector plane 70.187 14.300 72.20 721.62 10.300 On19(a) A 1st diffuser 19.870 14.310 68.37 383.63 2.920 On19(b) A 1st diffuser 39.951 14.300 69.06 545.59 5.870 On19(c) A 1st diffuser 60.176 14.300 71.17 667.80 8.790 On19(d) A 1st diffuser 69.894 14.300 72.16 719.77 10.310 On20(a) A 1st diffuser 20.123 14.310 73.02 386.04 2.960 Off20(b) A 1st diffuser 40.521 14.300 74.66 548.97 5.900 Off20(c) A 1st diffuser 60.503 14.300 73.70 669.67 8.800 Off20(d) A 1st diffuser 70.872 14.300 73.18 724.39 10.400 Off21(a) C 1st cross leg 19.856 14.400 69.48 384.83 2.960 On21(b) C 1st cross leg 39.883 14.390 69.80 544.57 5.860 On21(c) C 1st cross leg 59.806 14.300 68.13 664.64 8.740 On21(d) C 1st cross leg 69.855 14.370 72.66 722.27 10.310 On22(a) C 1st cross leg 20.378 14.390 72.33 386.52 2.930 Off22(b) C 1st cross leg 40.425 14.380 73.39 545.83 5.850 Off22(c) C 1st cross leg 61.033 14.340 74.08 670.28 8.870 Off22(d) C 1st cross leg 70.538 14.340 73.59 721.03 10.290 Off23(a) D Before fan 19.959 14.230 68.66 384.14 2.930 On23(b) D Before fan 40.005 14.300 69.48 547.85 5.910 On23(c) D Before fan 59.961 14.300 71.02 667.69 8.790 On23(d) D Before fan 70.050 14.300 71.99 720.68 10.280 On24(a) D′ After fan 19.889 14.300 67.26 383.73 2.970 On24(b) D′ After fan 40.005 14.300 68.48 547.85 5.910 On24(c) D′ After fan 59.961 14.300 71.02 667.69 8.790 On24(d) D′ After fan 70.050 14.300 71.99 720.68 10.280 On25(a) E Before turn 3 19.889 14.300 67.26 383.73 2.970 On25(b) E Before turn 3 40.008 14.300 67.87 542.45 5.810 On25(c) E Before turn 3 59.797 14.300 69.67 664.97 8.760 On25(d) E Before turn 3 69.933 14.300 73.71 720.35 10.270 On26(a) G After turn 3 19.856 14.300 69.97 383.67 2.980 On26(b) G After turn 3 39.869 14.300 69.90 543.51 5.860 On26(c) G After turn 3 59.976 14.300 71.10 665.02 8.790 On26(d) G After turn 3 70.239 14.300 72.59 719.85 10.270 On27(a) J Before turn 4 19.912 14.300 68.82 383.93 2.980 On27(b) J Before turn 4 39.725 14.300 69.31 542.50 5.810 On27(c) J Before turn 4 59.891 14.300 71.26 666.25 8.730 On27(d) J Before turn 4 70.115 14.300 72.38 718.99 10.270 On28(a) L Settling chamber 19.751 14.300 69.49 383.00 2.950 On28(b) L Settling chamber 40.167 14.300 69.78 543.58 5.840 On28(c) L Settling chamber 59.959 14.300 71.00 664.66 8.720 On28(d) L Settling chamber 70.576 14.300 72.16 722.68 10.370 On29(a) M Contraction 19.725 14.300 69.46 383.87 2.940 On29(b) M Contraction 40.038 14.300 69.66 545.14 5.880 On29(c) M Contraction 59.898 14.300 70.99 666.74 8.830 On29(d) M Contraction 70.177 14.300 72.05 721.42 10.360 On
∆pfan,

7
Fig
ure
1. L
ayou
t of w
ind
tunn
el s
how
ing
mic
roph
one
loca
tions
.
10
2M
LK
A
BC
DD
E
F G H J
Turn
3
Turn
4
Turn
2
Turn
1
Deb
ris
scre
en
Fan
Hea
t exc
hang
er
Test
sec
tion
(TS
)
Ple
num Bou
ndar
y la
yer
slot
Scr
een
and
hone
ycom
b
Con
trac
tion
B.L
.S. r
einj
ectio
n sl
ot
Col
lect
or
108
ft
42 ft
8 in
.

8
(a) Sketch of test setup.
Figure 2. Insertion loss test.
Diffuse sound field produced by speakers
Generated side (source)
microphone
Transmitted side (data) microphone
Nagra tape recorder system
Signal generator and amplifier system
Component

9
(b)
Pho
togr
aph
show
ing
typi
cal s
ourc
e an
d m
onito
r eq
uipm
ent f
or in
sert
ion
loss
test
.
Fig
ure
2. C
oncl
uded
.
Sou
nd s
ourc
e 1
Dat
a m
icro
phon
e
Sou
nd s
ourc
e 2
Sou
rce
mic
roph
one
Tap
e re
cord
er

10
Fig
ure
3. D
ata
and
refe
renc
e m
icro
phon
es in
test
sec
tion
for
flow
noi
se te
st.
Ref
eren
ce m
icro
phon
e
In-f
low
mic
roph
one

11
Figure 4. Sound pressure differences between microphones.
Figure 5. Insertion loss caused by turn 1.
30
20
10
0
–10250 1000 4000 16 000
1/3-octave center frequency, Hz
SP
L, d
B
30
20
10
0
–10250 1000 4000 16 000
1/3-octave center frequency, Hz
SP
L, d
B

12
Figure 6. Insertion loss caused by turn 2.
30
20
10
0
–10250 1000 4000 16 000
1/3-octave center frequency, Hz
SP
L, d
B
13
(a) Centerline position.
(b) Inside corner.
Figure 7. Insertion loss caused by turn 3.
30
20
10
0
–10250 1000 4000 16 000
1/3-octave center frequency, Hz
SP
L, d
B
30
20
10
0
–10250 1000 4000 16 000
1/3-octave center frequency, Hz
SP
L, d
B

14
(c) Outside corner.
Figure 7. Concluded.
30
20
10
0
–10250 1000 4000 16 000
1/3-octave center frequency, Hz
SP
L, d
B

15
Figure 8. Insertion loss caused by turn 3 in upstream direction.
Figure 9. Insertion loss caused by heat exchanger.
30
20
10
0
–10250 1000 4000 16 000
1/3-octave center frequency, Hz
SP
L, d
B
30
20
10
0
–10250 1000 4000 16 000
1/3-octave center frequency, Hz
SP
L, d
B

16
Figure 10. Insertion loss caused by turn 4.
Figure 11. Insertion loss caused by screen and honeycomb.
30
20
10
0
–10250 1000 4000 16 000
1/3-octave center frequency, Hz
SP
L, d
B
30
20
10
0
–10250 1000 4000 16 000
1/3-octave center frequency, Hz
SP
L, d
B
17
Figure 12. Insertion loss caused by contraction.
30
20
10
0
–10250 1000 4000 16 000
1/3-octave center frequency, Hz
SP
L, d
B

18
(a) Boundary layer fan operating at 500 rpm.
Figure 13. Background noise in test section caused by B.L.S. only.
120
60
0 5 10Frequency, kHz
15 20
SP
L, d
B, 2
.4-H
z bw
120
60
0 1000 2000Frequency, Hz
3000 50004000
SP
L, d
B, 2
.4-H
z bw
120
60
0 200 400Frequency, Hz
600 1000800
SP
L, d
B, 2
.4-H
z bw
OASPL = 62.0 dB

19
(b) Boundary layer fan operating at 1000 rpm.
Figure 13. Continued.
120
60
0 5 10Frequency, kHz
15 20
SP
L, d
B, 2
.4-H
z bw
120
60
0 1000 2000Frequency, Hz
3000 50004000
SP
L, d
B, 2
.4-H
z bw
120
60
0 200 400Frequency, Hz
600 1000800
SP
L, d
B, 2
.4-H
z bw
OASPL = 74.1 dB

20
(c) Boundary layer fan operating at 1500 rpm.
Figure 13. Concluded.
120
60
0 5 10Frequency, kHz
15 20
SP
L, d
B, 2
.4-H
z bw
120
60
0 1000 2000Frequency, Hz
3000 50004000
SP
L, d
B, 2
.4-H
z bw
120
60
0 200 400Frequency, Hz
600 1000800
SP
L, d
B, 2
.4-H
z bw
OASPL = 83.1 dB
21
(a) Boundary layer fan not operating.
Figure 14. Background noise in test section caused by main drive cooling fan and B.L.S.
120
60
0 5 10Frequency, kHz
15 20
SP
L, d
B, 2
.4-H
z bw
120
60
0 1000 2000Frequency, Hz
3000 50004000
SP
L, d
B, 2
.4-H
z bw
120
60
0 200 400Frequency, Hz
600 1000800
SP
L, d
B, 2
.4-H
z bw
OASPL = 72.2 dB

22
(b) Boundary layer fan operating at 500 rpm.
Figure 14. Continued.
120
60
0 5 10Frequency, kHz
15 20
SP
L, d
B, 2
.4-H
z bw
120
60
0 1000 2000Frequency, Hz
3000 50004000
SP
L, d
B, 2
.4-H
z bw
120
60
0 200 400Frequency, Hz
600 1000800
SP
L, d
B, 2
.4-H
z bw
OASPL = 70.3 dB

23
(c) Boundary layer fan operating at 1000 rpm.
Figure 14. Continued.
120
60
0 5 10Frequency, kHz
15 20
SP
L, d
B, 2
.4-H
z bw
120
60
0 1000 2000Frequency, Hz
3000 50004000
SP
L, d
B, 2
.4-H
z bw
120
60
0 200 400Frequency, Hz
600 1000800
SP
L, d
B, 2
.4-H
z bw
OASPL = 74.0 dB
24
(d) Boundary layer fan operating at 1500 rpm.
Figure 14. Concluded.
120
60
0 5 10Frequency, kHz
15 20
SP
L, d
B, 2
.4-H
z bw
120
60
0 1000 2000Frequency, Hz
3000 50004000
SP
L, d
B, 2
.4-H
z bw
120
60
0 200 400Frequency, Hz
600 1000800
SP
L, d
B, 2
.4-H
z bw
OASPL = 83.8 dB
25
(a) Dynamic pressure = 20 lb/ft2.
Figure 15. Flow noise measurement by reference microphone.
120
60
0 5 10Frequency, kHz
15 20
SP
L, d
B, 2
.4-H
z bw
120
60
0 1000 2000Frequency, Hz
3000 50004000
SP
L, d
B, 2
.4-H
z bw
120
60
0 200 400Frequency, Hz
600 1000800
SP
L, d
B, 2
.4-H
z bw
OASPL = 105.3 dB

26
(b) Dynamic pressure = 40 lb/ft2.
Figure 15. Continued.
120
60
0 5 10Frequency, kHz
15 20
SP
L, d
B, 2
.4-H
z bw
120
60
0 1000 2000Frequency, Hz
3000 50004000
SP
L, d
B, 2
.4-H
z bw
120
60
0 200 400Frequency, Hz
600 1000800
SP
L, d
B, 2
.4-H
z bw
OASPL = 115.3 dB

27
(c) Dynamic pressure = 60 lb/ft2.
Figure 15. Continued.
120
60
0 5 10Frequency, kHz
15 20
SP
L, d
B, 2
.4-H
z bw
120
60
0 1000 2000Frequency, Hz
3000 50004000
SP
L, d
B, 2
.4-H
z bw
120
60
0 200 400Frequency, Hz
600 1000800
SP
L, d
B, 2
.4-H
z bw
OASPL = 118.7 dB

28
(d) Dynamic pressure = 70 lb/ft2.
Figure 15. Concluded.
120
60
0 5 10Frequency, kHz
15 20
SP
L, d
B, 2
.4-H
z bw
120
60
0 1000 2000Frequency, Hz
3000 50004000
SP
L, d
B, 2
.4-H
z bw
120
60
0 200 400Frequency, Hz
600 1000800
SP
L, d
B, 2
.4-H
z bw
OASPL = 119.4 dB

29
(a) Dynamic pressure = 20 lb/ft2.
Figure 16. Flow noise measurement in test section with B.L.S. on.
120
60
0 5 10Frequency, kHz
15 20
SP
L, d
B, 2
.4-H
z bw
120
60
0 1000 2000Frequency, Hz
3000 50004000
SP
L, d
B, 2
.4-H
z bw
120
60
0 200 400Frequency, Hz
600 1000800
SP
L, d
B, 2
.4-H
z bw
OASPL = 111.6 dB

30
(b) Dynamic pressure = 40 lb/ft2.
Figure 16. Continued.
120
60
0 5 10Frequency, kHz
15 20
SP
L, d
B, 2
.4-H
z bw
120
60
0 1000 2000Frequency, Hz
3000 50004000
SP
L, d
B, 2
.4-H
z bw
120
60
0 200 400Frequency, Hz
600 1000800
SP
L, d
B, 2
.4-H
z bw
OASPL = 117.8 dB

31
(c) Dynamic pressure = 60 lb/ft2.
Figure 16. Continued.
120
60
0 5 10Frequency, kHz
15 20
SP
L, d
B, 2
.4-H
z bw
120
60
0 1000 2000Frequency, Hz
3000 50004000
SP
L, d
B, 2
.4-H
z bw
120
60
0 200 400Frequency, Hz
600 1000800
SP
L, d
B, 2
.4-H
z bw
OASPL = 117.6 dB
32
(d) Dynamic pressure = 70 lb/ft2.
Figure 16. Concluded.
120
60
0 5 10Frequency, kHz
15 20
SP
L, d
B, 2
.4-H
z bw
120
60
0 1000 2000Frequency, Hz
3000 50004000
SP
L, d
B, 2
.4-H
z bw
120
60
0 200 400Frequency, Hz
600 1000800
SP
L, d
B, 2
.4-H
z bw
OASPL = 120.9 dB

33
(a) Dynamic pressure = 20 lb/ft2.
Figure 17. Flow noise measurement in test section with B.L.S. off.
120
60
0 5 10Frequency, kHz
15 20
SP
L, d
B, 2
.4-H
z bw
120
60
0 1000 2000Frequency, Hz
3000 50004000
SP
L, d
B, 2
.4-H
z bw
120
60
0 200 400Frequency, Hz
600 1000800
SP
L, d
B, 2
.4-H
z bw
OASPL = 107.5 dB
34
(b) Dynamic pressure = 40 lb/ft2.
Figure 17. Continued.
120
60
0 5 10Frequency, kHz
15 20
SP
L, d
B, 2
.4-H
z bw
120
60
0 1000 2000Frequency, Hz
3000 50004000
SP
L, d
B, 2
.4-H
z bw
120
60
0 200 400Frequency, Hz
600 1000800
SP
L, d
B, 2
.4-H
z bw
OASPL = 117.6 dB

35
(c) Dynamic pressure = 60 lb/ft2.
Figure 17. Continued.
120
60
0 5 10Frequency, kHz
15 20
SP
L, d
B, 2
.4-H
z bw
120
60
0 1000 2000Frequency, Hz
3000 50004000
SP
L, d
B, 2
.4-H
z bw
120
60
0 200 400Frequency, Hz
600 1000800
SP
L, d
B, 2
.4-H
z bw
OASPL = 121.2 dB

36
(d) Dynamic pressure = 70 lb/ft2.
Figure 17. Concluded.
120
60
0 5 10Frequency, kHz
15 20
SP
L, d
B, 2
.4-H
z bw
120
60
0 1000 2000Frequency, Hz
3000 50004000
SP
L, d
B, 2
.4-H
z bw
120
60
0 200 400Frequency, Hz
600 1000800
SP
L, d
B, 2
.4-H
z bw
OASPL = 123.5 dB

37
(a) Dynamic pressure = 20 lb/ft2.
Figure 18. Flow noise measurement in entrance of collector.
120
60
0 5 10Frequency, kHz
15 20
SP
L, d
B, 2
.4-H
z bw
120
60
0 1000 2000Frequency, Hz
3000 50004000
SP
L, d
B, 2
.4-H
z bw
120
60
0 200 400Frequency, Hz
600 1000800
SP
L, d
B, 2
.4-H
z bw
OASPL = 115.6 dB
38
(b) Dynamic pressure = 40 lb/ft2.
Figure 18. Continued.
120
60
0 5 10Frequency, kHz
15 20
SP
L, d
B, 2
.4-H
z bw
120
60
0 1000 2000Frequency, Hz
3000 50004000
SP
L, d
B, 2
.4-H
z bw
120
60
0 200 400Frequency, Hz
600 1000800
SP
L, d
B, 2
.4-H
z bw
OASPL = 120.4 dB

39
(c) Dynamic pressure = 60 lb/ft2.
Figure 18. Continued.
120
60
0 5 10Frequency, kHz
15 20
SP
L, d
B, 2
.4-H
z bw
120
60
0 1000 2000Frequency, Hz
3000 50004000
SP
L, d
B, 2
.4-H
z bw
120
60
0 200 400Frequency, Hz
600 1000800
SP
L, d
B, 2
.4-H
z bw
OASPL = 121.7 dB
40
(d) Dynamic pressure = 70 lb/ft2.
Figure 18. Concluded.
120
60
0 5 10Frequency, kHz
15 20
SP
L, d
B, 2
.4-H
z bw
120
60
0 1000 2000Frequency, Hz
3000 50004000
SP
L, d
B, 2
.4-H
z bw
120
60
0 200 400Frequency, Hz
600 1000800
SP
L, d
B, 2
.4-H
z bw
OASPL = 122.3 dB

41
(a) Dynamic pressure = 20 lb/ft2.
Figure 19. Flow noise measurement in first diffuser with B.L.S. on.
120
60
0 5 10Frequency, kHz
15 20
SP
L, d
B, 2
.4-H
z bw
120
60
0 1000 2000Frequency, Hz
3000 50004000
SP
L, d
B, 2
.4-H
z bw
120
60
0 200 400Frequency, Hz
600 1000800
SP
L, d
B, 2
.4-H
z bw
OASPL = 117.4 dB
42
(b) Dynamic pressure = 40 lb/ft2.
Figure 19. Continued.
120
60
0 5 10Frequency, kHz
15 20
SP
L, d
B, 2
.4-H
z bw
120
60
0 1000 2000Frequency, Hz
3000 50004000
SP
L, d
B, 2
.4-H
z bw
120
60
0 200 400Frequency, Hz
600 1000800
SP
L, d
B, 2
.4-H
z bw
OASPL = 120.3 dB

43
(c) Dynamic pressure = 60 lb/ft2.
Figure 19. Continued.
120
60
0 5 10Frequency, kHz
15 20
SP
L, d
B, 2
.4-H
z bw
120
60
0 1000 2000Frequency, Hz
3000 50004000
SP
L, d
B, 2
.4-H
z bw
120
60
0 200 400Frequency, Hz
600 1000800
SP
L, d
B, 2
.4-H
z bw
OASPL = 121.4 dB
44
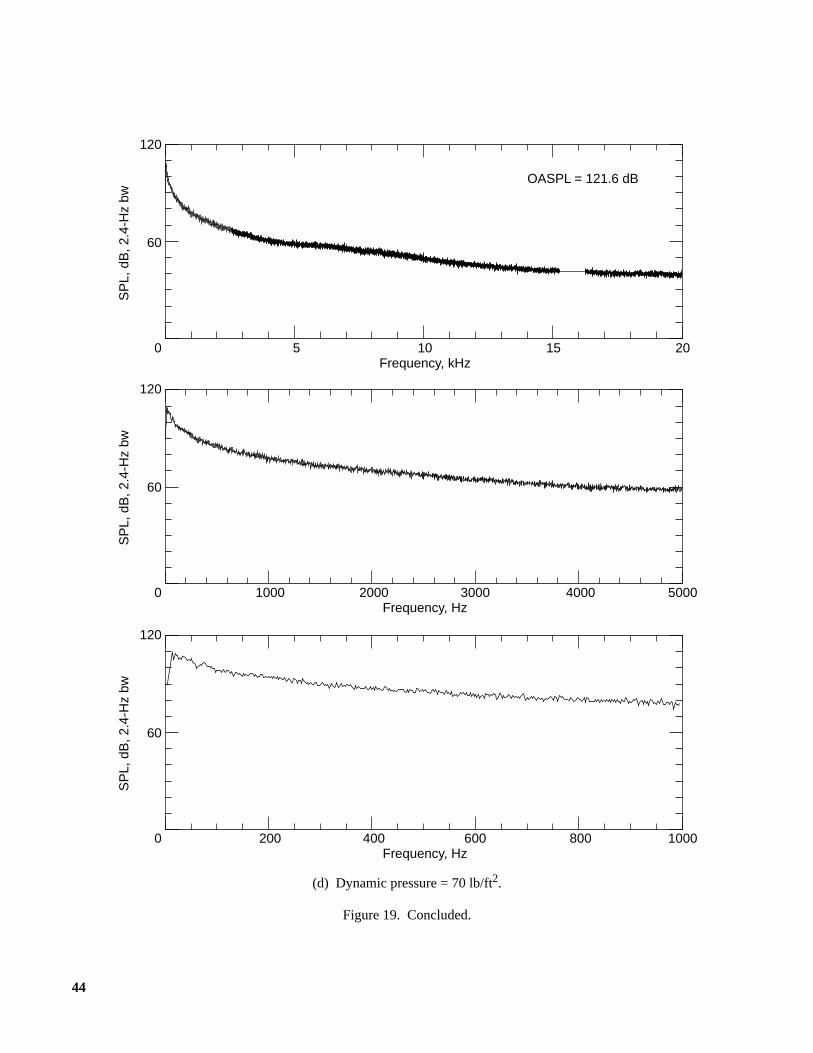
(d) Dynamic pressure = 70 lb/ft2.
Figure 19. Concluded.
120
60
0 5 10Frequency, kHz
15 20
SP
L, d
B, 2
.4-H
z bw
120
60
0 1000 2000Frequency, Hz
3000 50004000
SP
L, d
B, 2
.4-H
z bw
120
60
0 200 400Frequency, Hz
600 1000800
SP
L, d
B, 2
.4-H
z bw
OASPL = 121.6 dB

45
(a) Dynamic pressure = 20 lb/ft2.
Figure 20. Flow noise measurement in first diffuser with B.L.S. off.
120
60
0 5 10Frequency, kHz
15 20
SP
L, d
B, 2
.4-H
z bw
120
60
0 1000 2000Frequency, Hz
3000 50004000
SP
L, d
B, 2
.4-H
z bw
120
60
0 200 400Frequency, Hz
600 1000800
SP
L, d
B, 2
.4-H
z bw
OASPL = 118.7 dB

46
(b) Dynamic pressure = 40 lb/ft2.
Figure 20. Continued.
120
60
0 5 10Frequency, kHz
15 20
SP
L, d
B, 2
.4-H
z bw
120
60
0 1000 2000Frequency, Hz
3000 50004000
SP
L, d
B, 2
.4-H
z bw
120
60
0 200 400Frequency, Hz
600 1000800
SP
L, d
B, 2
.4-H
z bw
OASPL = 121.6 dB

47
(c) Dynamic pressure = 60 lb/ft2.
Figure 20. Continued.
120
60
0 5 10Frequency, kHz
15 20
SP
L, d
B, 2
.4-H
z bw
120
60
0 1000 2000Frequency, Hz
3000 50004000
SP
L, d
B, 2
.4-H
z bw
120
60
0 200 400Frequency, Hz
600 1000800
SP
L, d
B, 2
.4-H
z bw
OASPL = 122.1 dB

48
(d) Dynamic pressure = 70 lb/ft2.
Figure 20. Concluded.
120
60
0 5 10Frequency, kHz
15 20
SP
L, d
B, 2
.4-H
z bw
120
60
0 1000 2000Frequency, Hz
3000 50004000
SP
L, d
B, 2
.4-H
z bw
120
60
0 200 400Frequency, Hz
600 1000800
SP
L, d
B, 2
.4-H
z bw
OASPL = 121.7 dB
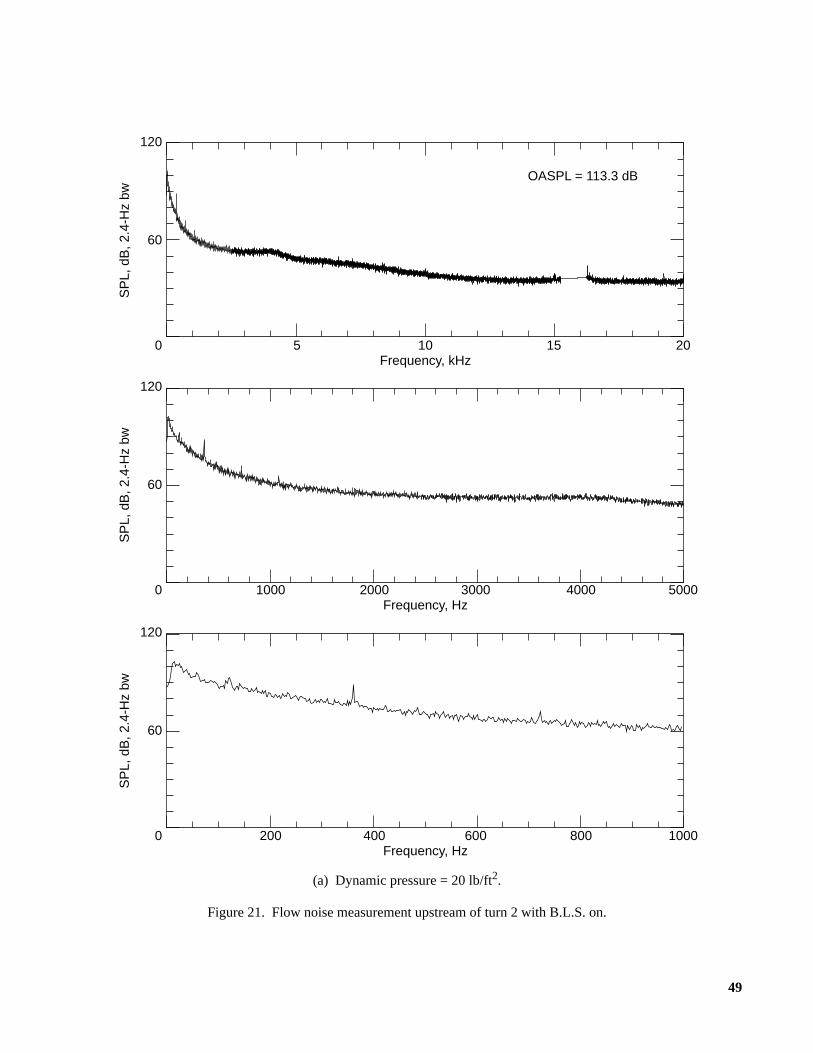
49
(a) Dynamic pressure = 20 lb/ft2.
Figure 21. Flow noise measurement upstream of turn 2 with B.L.S. on.
120
60
0 5 10Frequency, kHz
15 20
SP
L, d
B, 2
.4-H
z bw
120
60
0 1000 2000Frequency, Hz
3000 50004000
SP
L, d
B, 2
.4-H
z bw
120
60
0 200 400Frequency, Hz
600 1000800
SP
L, d
B, 2
.4-H
z bw
OASPL = 113.3 dB

50
(b) Dynamic pressure = 40 lb/ft2.
Figure 21. Continued.
120
60
0 5 10Frequency, kHz
15 20
SP
L, d
B, 2
.4-H
z bw
120
60
0 1000 2000Frequency, Hz
3000 50004000
SP
L, d
B, 2
.4-H
z bw
120
60
0 200 400Frequency, Hz
600 1000800
SP
L, d
B, 2
.4-H
z bw
OASPL = 119.0 dB

51
(c) Dynamic pressure = 60 lb/ft2.
Figure 21. Continued.
120
60
0 5 10Frequency, kHz
15 20
SP
L, d
B, 2
.4-H
z bw
120
60
0 1000 2000Frequency, Hz
3000 50004000
SP
L, d
B, 2
.4-H
z bw
120
60
0 200 400Frequency, Hz
600 1000800
SP
L, d
B, 2
.4-H
z bw
OASPL = 120.7 dB

52
(d) Dynamic pressure = 70 lb/ft2.
Figure 21. Concluded.
120
60
0 5 10Frequency, kHz
15 20
SP
L, d
B, 2
.4-H
z bw
120
60
0 1000 2000Frequency, Hz
3000 50004000
SP
L, d
B, 2
.4-H
z bw
120
60
0 200 400Frequency, Hz
600 1000800
SP
L, d
B, 2
.4-H
z bw
OASPL = 121.8 dB

53
(a) Dynamic pressure = 20 lb/ft2.
Figure 22. Flow noise measurement upstream of turn 2 with B.L.S. off.
120
60
0 5 10Frequency, kHz
15 20
SP
L, d
B, 2
.4-H
z bw
120
60
0 1000 2000Frequency, Hz
3000 50004000
SP
L, d
B, 2
.4-H
z bw
120
60
0 200 400Frequency, Hz
600 1000800
SP
L, d
B, 2
.4-H
z bw
OASPL = 112.8 dB

54
(b) Dynamic pressure = 40 lb/ft2.
Figure 22. Continued.
120
60
0 5 10Frequency, kHz
15 20
SP
L, d
B, 2
.4-H
z bw
120
60
0 1000 2000Frequency, Hz
3000 50004000
SP
L, d
B, 2
.4-H
z bw
120
60
0 200 400Frequency, Hz
600 1000800
SP
L, d
B, 2
.4-H
z bw
OASPL = 118.8 dB

55
(c) Dynamic pressure = 60 lb/ft2.
Figure 22. Continued.
120
60
0 5 10Frequency, kHz
15 20
SP
L, d
B, 2
.4-H
z bw
120
60
0 1000 2000Frequency, Hz
3000 50004000
SP
L, d
B, 2
.4-H
z bw
120
60
0 200 400Frequency, Hz
600 1000800
SP
L, d
B, 2
.4-H
z bw
OASPL = 120.9 dB

56
(d) Dynamic pressure = 70 lb/ft2.
Figure 22. Concluded.
120
60
0 5 10Frequency, kHz
15 20
SP
L, d
B, 2
.4-H
z bw
120
60
0 1000 2000Frequency, Hz
3000 50004000
SP
L, d
B, 2
.4-H
z bw
120
60
0 200 400Frequency, Hz
600 1000800
SP
L, d
B, 2
.4-H
z bw
OASPL = 121.8 dB

57
(a) Dynamic pressure = 20 lb/ft2.
Figure 23. Flow noise measurement upstream of drive fan.
120
60
0 5 10Frequency, kHz
15 20
SP
L, d
B, 2
.4-H
z bw
120
60
0 1000 2000Frequency, Hz
3000 50004000
SP
L, d
B, 2
.4-H
z bw
120
60
0 200 400Frequency, Hz
600 1000800
SP
L, d
B, 2
.4-H
z bw
OASPL = 116.5 dB

58
(b) Dynamic pressure = 40 lb/ft2.
Figure 23. Continued.
120
60
0 5 10Frequency, kHz
15 20
SP
L, d
B, 2
.4-H
z bw
120
60
0 1000 2000Frequency, Hz
3000 50004000
SP
L, d
B, 2
.4-H
z bw
120
60
0 200 400Frequency, Hz
600 1000800
SP
L, d
B, 2
.4-H
z bw
OASPL = 120.9 dB

59
(c) Dynamic pressure = 60 lb/ft2.
Figure 23. Continued.
120
60
0 5 10Frequency, kHz
15 20
SP
L, d
B, 2
.4-H
z bw
120
60
0 1000 2000Frequency, Hz
3000 50004000
SP
L, d
B, 2
.4-H
z bw
120
60
0 200 400Frequency, Hz
600 1000800
SP
L, d
B, 2
.4-H
z bw
OASPL = 121.9 dB

60
(d) Dynamic pressure = 70 lb/ft2.
Figure 23. Concluded.
120
60
0 5 10Frequency, kHz
15 20
SP
L, d
B, 2
.4-H
z bw
120
60
0 1000 2000Frequency, Hz
3000 50004000
SP
L, d
B, 2
.4-H
z bw
120
60
0 200 400Frequency, Hz
600 1000800
SP
L, d
B, 2
.4-H
z bw
OASPL = 122.5 dB

61
(a) Dynamic pressure = 20 lb/ft2.
Figure 24. Flow noise measurement downstream of drive fan.
120
60
0 5 10Frequency, kHz
15 20
SP
L, d
B, 2
.4-H
z bw
120
60
0 1000 2000Frequency, Hz
3000 50004000
SP
L, d
B, 2
.4-H
z bw
120
60
0 200 400Frequency, Hz
600 1000800
SP
L, d
B, 2
.4-H
z bw
OASPL = 110.5 dB
62
(b) Dynamic pressure = 40 lb/ft2.
Figure 24. Continued.
120
60
0 5 10Frequency, kHz
15 20
SP
L, d
B, 2
.4-H
z bw
120
60
0 1000 2000Frequency, Hz
3000 50004000
SP
L, d
B, 2
.4-H
z bw
120
60
0 200 400Frequency, Hz
600 1000800
SP
L, d
B, 2
.4-H
z bw
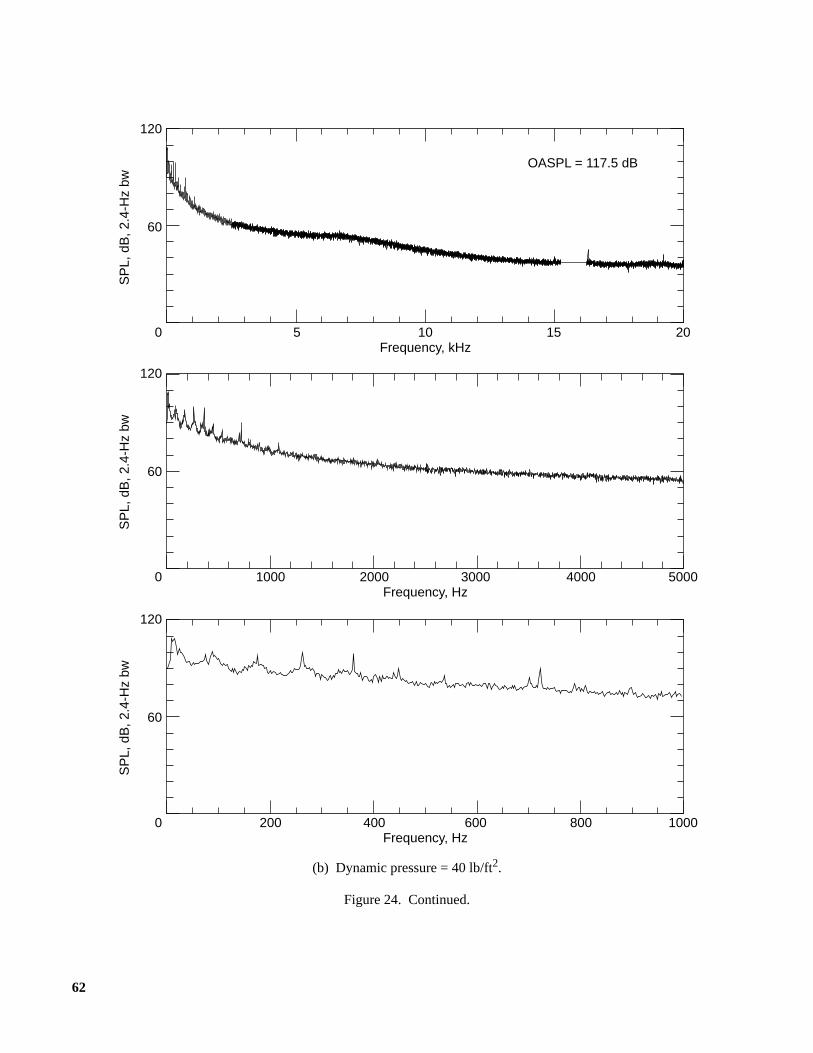
OASPL = 117.5 dB

63
(c) Dynamic pressure = 60 lb/ft2.
Figure 24. Continued.
120
60
0 5 10Frequency, kHz
15 20
SP
L, d
B, 2
.4-H
z bw
120
60
0 1000 2000Frequency, Hz
3000 50004000
SP
L, d
B, 2
.4-H
z bw
120
60
0 200 400Frequency, Hz
600 1000800
SP
L, d
B, 2
.4-H
z bw
OASPL = 119.6 dB

64
(d) Dynamic pressure = 70 lb/ft2.
Figure 24. Concluded.
120
60
0 5 10Frequency, kHz
15 20
SP
L, d
B, 2
.4-H
z bw
120
60
0 1000 2000Frequency, Hz
3000 50004000
SP
L, d
B, 2
.4-H
z bw
120
60
0 200 400Frequency, Hz
600 1000800
SP
L, d
B, 2
.4-H
z bw
OASPL = 120.2 dB

65
(a) Dynamic pressure = 20 lb/ft2.
Figure 25. Flow noise measurement upstream of turn 3.
120
60
0 5 10Frequency, kHz
15 20
SP
L, d
B, 2
.4-H
z bw
120
60
0 1000 2000Frequency, Hz
3000 50004000
SP
L, d
B, 2
.4-H
z bw
120
60
0 200 400Frequency, Hz
600 1000800
SP
L, d
B, 2
.4-H
z bw
OASPL = 107.8 dB

66
(b) Dynamic pressure = 40 lb/ft2.
Figure 25. Continued.
120
60
0 5 10Frequency, kHz
15 20
SP
L, d
B, 2
.4-H
z bw
120
60
0 1000 2000Frequency, Hz
3000 50004000
SP
L, d
B, 2
.4-H
z bw
120
60
0 200 400Frequency, Hz
600 1000800
SP
L, d
B, 2
.4-H
z bw
OASPL = 115.9 dB

67
(c) Dynamic pressure = 60 lb/ft2.
Figure 25. Continued.
120
60
0 5 10Frequency, kHz
15 20
SP
L, d
B, 2
.4-H
z bw
120
60
0 1000 2000Frequency, Hz
3000 50004000
SP
L, d
B, 2
.4-H
z bw
120
60
0 200 400Frequency, Hz
600 1000800
SP
L, d
B, 2
.4-H
z bw
OASPL = 117.5 dB

68
(d) Dynamic pressure = 70 lb/ft2.
Figure 25. Concluded.
120
60
0 5 10Frequency, kHz
15 20
SP
L, d
B, 2
.4-H
z bw
120
60
0 1000 2000Frequency, Hz
3000 50004000
SP
L, d
B, 2
.4-H
z bw
120
60
0 200 400Frequency, Hz
600 1000800
SP
L, d
B, 2
.4-H
z bw
OASPL = 117.9 dB
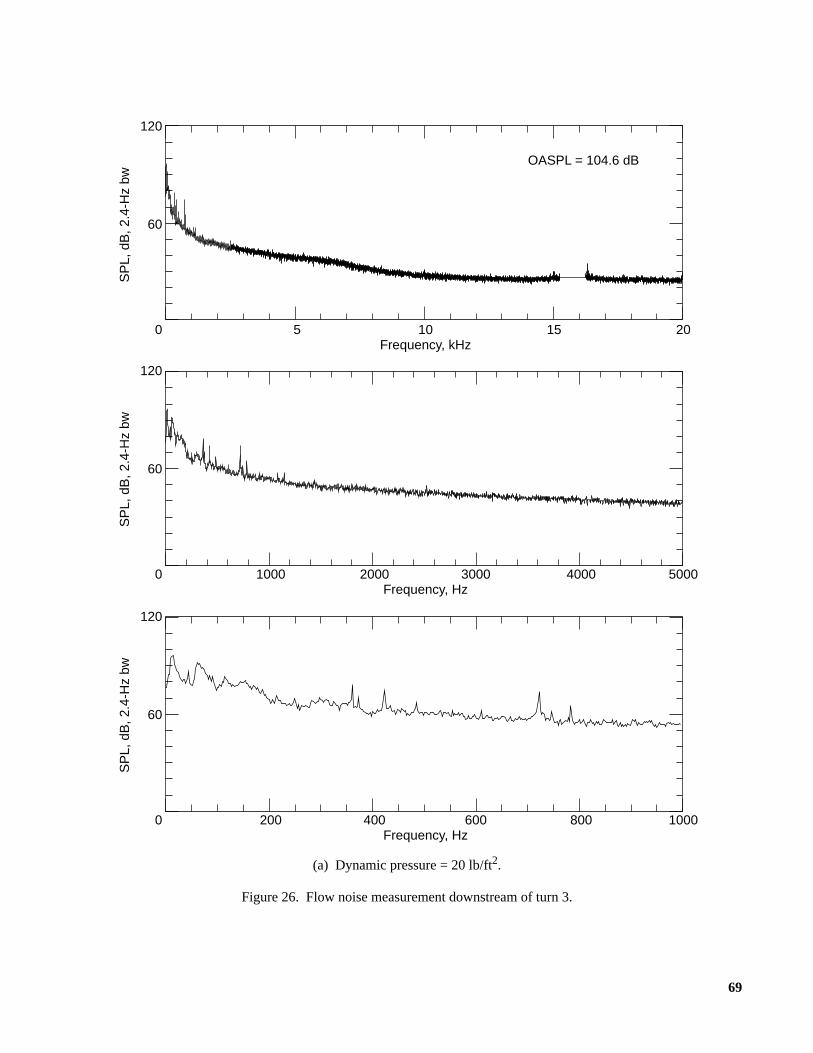
69
(a) Dynamic pressure = 20 lb/ft2.
Figure 26. Flow noise measurement downstream of turn 3.
120
60
0 5 10Frequency, kHz
15 20
SP
L, d
B, 2
.4-H
z bw
120
60
0 1000 2000Frequency, Hz
3000 50004000
SP
L, d
B, 2
.4-H
z bw
120
60
0 200 400Frequency, Hz
600 1000800
SP
L, d
B, 2
.4-H
z bw
OASPL = 104.6 dB

70
(b) Dynamic pressure = 40 lb/ft2.
Figure 26. Continued.
120
60
0 5 10Frequency, kHz
15 20
SP
L, d
B, 2
.4-H
z bw
120
60
0 1000 2000Frequency, Hz
3000 50004000
SP
L, d
B, 2
.4-H
z bw
120
60
0 200 400Frequency, Hz
600 1000800
SP
L, d
B, 2
.4-H
z bw
OASPL = 114.8 dB

71
(c) Dynamic pressure = 60 lb/ft2.
Figure 26. Continued.
120
60
0 5 10Frequency, kHz
15 20
SP
L, d
B, 2
.4-H
z bw
120
60
0 1000 2000Frequency, Hz
3000 50004000
SP
L, d
B, 2
.4-H
z bw
120
60
0 200 400Frequency, Hz
600 1000800
SP
L, d
B, 2
.4-H
z bw
OASPL = 117.2 dB

72
(d) Dynamic pressure = 70 lb/ft2.
Figure 26. Concluded.
120
60
0 5 10Frequency, kHz
15 20
SP
L, d
B, 2
.4-H
z bw
120
60
0 1000 2000Frequency, Hz
3000 50004000
SP
L, d
B, 2
.4-H
z bw
120
60
0 200 400Frequency, Hz
600 1000800
SP
L, d
B, 2
.4-H
z bw
OASPL = 118.8 dB

73
(a) Dynamic pressure = 20 lb/ft2.
Figure 27. Flow noise measurement upstream of turn 4.
120
60
0 5 10Frequency, kHz
15 20
SP
L, d
B, 2
.4-H
z bw
120
60
0 1000 2000Frequency, Hz
3000 50004000
SP
L, d
B, 2
.4-H
z bw
120
60
0 200 400Frequency, Hz
600 1000800
SP
L, d
B, 2
.4-H
z bw
OASPL = 101.1 dB

74
(b) Dynamic pressure = 40 lb/ft2.
Figure 27. Continued.
120
60
0 5 10Frequency, kHz
15 20
SP
L, d
B, 2
.4-H
z bw
120
60
0 1000 2000Frequency, Hz
3000 50004000
SP
L, d
B, 2
.4-H
z bw
120
60
0 200 400Frequency, Hz
600 1000800
SP
L, d
B, 2
.4-H
z bw
OASPL = 108.4 dB
75
(c) Dynamic pressure = 60 lb/ft2.
Figure 27. Continued.
120
60
0 5 10Frequency, kHz
15 20
SP
L, d
B, 2
.4-H
z bw
120
60
0 1000 2000Frequency, Hz
3000 50004000
SP
L, d
B, 2
.4-H
z bw
120
60
0 200 400Frequency, Hz
600 1000800
SP
L, d
B, 2
.4-H
z bw
OASPL = 113.5 dB

76
(d) Dynamic pressure = 70 lb/ft2.
Figure 27. Concluded.
120
60
0 5 10Frequency, kHz
15 20
SP
L, d
B, 2
.4-H
z bw
120
60
0 1000 2000Frequency, Hz
3000 50004000
SP
L, d
B, 2
.4-H
z bw
120
60
0 200 400Frequency, Hz
600 1000800
SP
L, d
B, 2
.4-H
z bw
OASPL = 117.1 dB

77
(a) Dynamic pressure = 20 lb/ft2.
Figure 28. Flow noise measurement in settling chamber.
120
60
0 5 10Frequency, kHz
15 20
SP
L, d
B, 2
.4-H
z bw
120
60
0 1000 2000Frequency, Hz
3000 50004000
SP
L, d
B, 2
.4-H
z bw
120
60
0 200 400Frequency, Hz
600 1000800
SP
L, d
B, 2
.4-H
z bw
OASPL = 102.5 dB

78
(b) Dynamic pressure = 40 lb/ft2.
Figure 28. Continued.
120
60
0 5 10Frequency, kHz
15 20
SP
L, d
B, 2
.4-H
z bw
120
60
0 1000 2000Frequency, Hz
3000 50004000
SP
L, d
B, 2
.4-H
z bw
120
60
0 200 400Frequency, Hz
600 1000800
SP
L, d
B, 2
.4-H
z bw
OASPL = 109.8 dB

79
(c) Dynamic pressure = 60 lb/ft2.
Figure 28. Continued.
120
60
0 5 10Frequency, kHz
15 20
SP
L, d
B, 2
.4-H
z bw
120
60
0 1000 2000Frequency, Hz
3000 50004000
SP
L, d
B, 2
.4-H
z bw
120
60
0 200 400Frequency, Hz
600 1000800
SP
L, d
B, 2
.4-H
z bw
OASPL = 111.0 dB

80
(d) Dynamic pressure = 70 lb/ft2.
Figure 28. Concluded.
120
60
0 5 10Frequency, kHz
15 20
SP
L, d
B, 2
.4-H
z bw
120
60
0 1000 2000Frequency, Hz
3000 50004000
SP
L, d
B, 2
.4-H
z bw
120
60
0 200 400Frequency, Hz
600 1000800
SP
L, d
B, 2
.4-H
z bw
OASPL = 115.4 dB

81
(a) Dynamic pressure = 20 lb/ft2.
Figure 29. Flow noise measurement in contraction.
120
60
0 5 10Frequency, kHz
15 20
SP
L, d
B, 2
.4-H
z bw
120
60
0 1000 2000Frequency, Hz
3000 50004000
SP
L, d
B, 2
.4-H
z bw
120
60
0 200 400Frequency, Hz
600 1000800
SP
L, d
B, 2
.4-H
z bw
OASPL = 106.0 dB
82
(b) Dynamic pressure = 40 lb/ft2.
Figure 29. Continued.
120
60
0 5 10Frequency, kHz
15 20
SP
L, d
B, 2
.4-H
z bw
120
60
0 1000 2000Frequency, Hz
3000 50004000
SP
L, d
B, 2
.4-H
z bw
120
60
0 200 400Frequency, Hz
600 1000800
SP
L, d
B, 2
.4-H
z bw
OASPL = 113.6 dB

83
(c) Dynamic pressure = 60 lb/ft2.
Figure 29. Continued.
120
60
0 5 10Frequency, kHz
15 20
SP
L, d
B, 2
.4-H
z bw
120
60
0 1000 2000Frequency, Hz
3000 50004000
SP
L, d
B, 2
.4-H
z bw
120
60
0 200 400Frequency, Hz
600 1000800
SP
L, d
B, 2
.4-H
z bw
OASPL = 115.0 dB
84
(d) Dynamic pressure = 70 lb/ft2.
Figure 29. Concluded.
120
60
0 5 10Frequency, kHz
15 20
SP
L, d
B, 2
.4-H
z bw
120
60
0 1000 2000Frequency, Hz
3000 50004000
SP
L, d
B, 2
.4-H
z bw
120
60
0 200 400Frequency, Hz
600 1000800
SP
L, d
B, 2
.4-H
z bw
OASPL = 117.4 dB

Form ApprovedOMB No. 0704-0188
Public reporting burden for this collection of information is estimated to average 1 hour per response, including the time for reviewing instructions, searching existing data sources,gathering and maintaining the data needed, and completing and reviewing the collection of information. Send comments regarding this burden estimate or any other aspect of thiscollection of information, including suggestions for reducing this burden, to Washington Headquarters Services, Directorate for Information Operations and Reports, 1215 JeffersonDavis Highway, Suite 1204, Arlington, VA 22202-4302, and to the Office of Management and Budget, Paperwork Reduction Project (0704-0188), Washington, DC 20503.
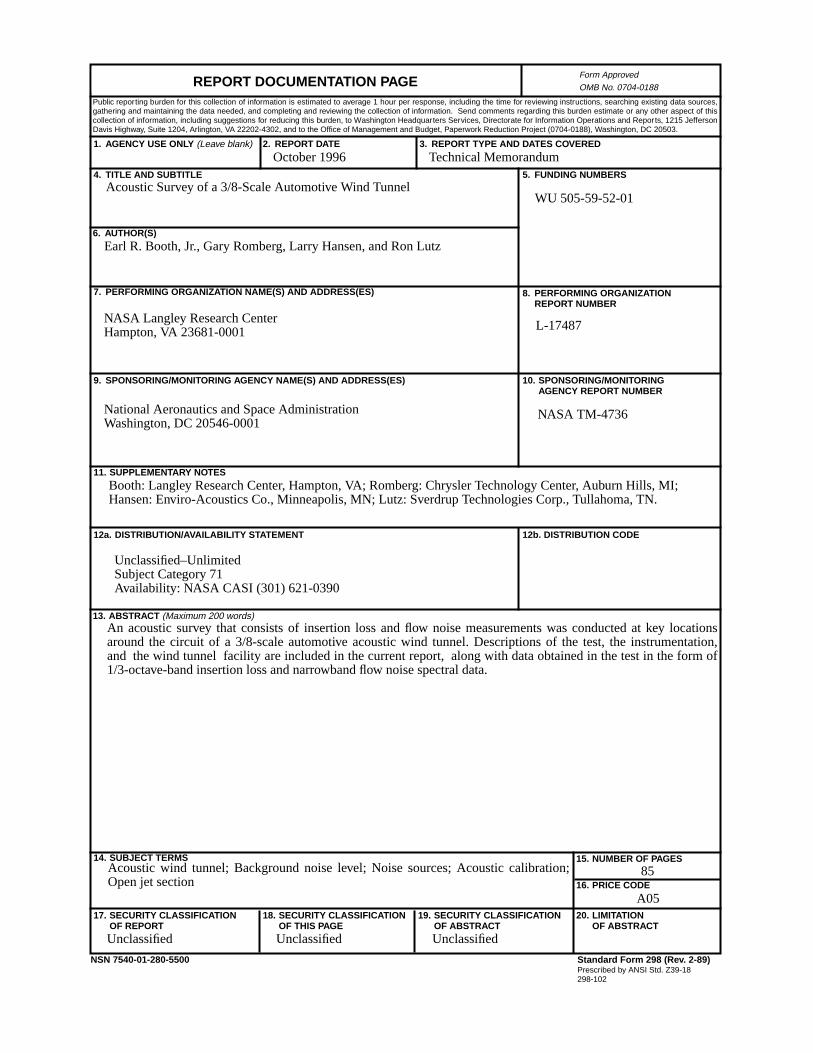
1. AGENCY USE ONLY (Leave blank) 2. REPORT DATE 3. REPORT TYPE AND DATES COVERED
4. TITLE AND SUBTITLE 5. FUNDING NUMBERS
6. AUTHOR(S)
7. PERFORMING ORGANIZATION NAME(S) AND ADDRESS(ES)
9. SPONSORING/MONITORING AGENCY NAME(S) AND ADDRESS(ES)
11. SUPPLEMENTARY NOTES
8. PERFORMING ORGANIZATIONREPORT NUMBER
10. SPONSORING/MONITORINGAGENCY REPORT NUMBER
12a. DISTRIBUTION/AVAILABILITY STATEMENT 12b. DISTRIBUTION CODE
13. ABSTRACT (Maximum 200 words)
14. SUBJECT TERMS
17. SECURITY CLASSIFICATIONOF REPORT
18. SECURITY CLASSIFICATIONOF THIS PAGE
19. SECURITY CLASSIFICATIONOF ABSTRACT
20. LIMITATIONOF ABSTRACT
15. NUMBER OF PAGES
16. PRICE CODE
NSN 7540-01-280-5500 Standard Form 298 (Rev. 2-89)Prescribed by ANSI Std. Z39-18298-102
REPORT DOCUMENTATION PAGE
October 1996 Technical Memorandum
Acoustic Survey of a 3/8-Scale Automotive Wind TunnelWU 505-59-52-01
Earl R. Booth, Jr., Gary Romberg, Larry Hansen, and Ron Lutz
L-17487
NASA TM-4736
Booth: Langley Research Center, Hampton, VA; Romberg: Chrysler Technology Center, Auburn Hills, MI;Hansen: Enviro-Acoustics Co., Minneapolis, MN; Lutz: Sverdrup Technologies Corp., Tullahoma, TN.
An acoustic survey that consists of insertion loss and flow noise measurements was conducted at key locationsaround the circuit of a 3/8-scale automotive acoustic wind tunnel. Descriptions of the test, the instrumentation,and the wind tunnelfacility are included in the current report, along with data obtained in the test in the form of1/3-octave-band insertion loss and narrowband flow noise spectral data.
Acoustic wind tunnel; Background noise level; Noise sources; Acoustic calibration;Open jet section
85
A05
NASA Langley Research CenterHampton, VA 23681-0001
National Aeronautics and Space AdministrationWashington, DC 20546-0001
Unclassified–UnlimitedSubject Category 71Availability: NASA CASI (301) 621-0390
Unclassified Unclassified Unclassified