Using Volunteered Geographic Information to Measure Name ...

Integrated Disease Surveillance Project (IDSP) in Gujarat: An Evaluation with particular reference to Malaria
DR. AMAR SHAH
Dissertation submitted in partial fulfillment of the requirement for the award of the degree of Master of Public Health.
Achutha Menon Centre for Health Science Studies (AMCHSS) Sree Chitra Tirunal Institute for Medical Sciences and
Technology (SCTIMST) Thiruvananthapuram
Kerala October 2007
1

Acknowledgements
I would express my sincere thanks to my guide Dr. KR Thankappan, Professor and Head, AMCHSS, SCTIMST who helped me at each and every stages of my research. He has also been a sense of inspiration for me and without his untiring efforts; I would not have been able to complete this piece of work in time.
I feel it's my duty to thank to Dr. Ammjit Singh (lAS) commissioner of Health, Gujarat who gave pennission for the study.
I would like to express my gratitude to participants who were working in the health institutions in Gujarat, who volunteered to spend their valuable time for pmiicipating in the study. I also express my thanks to Dr. Paresh Dave, Dr. Nilam Patel, Dr. B K Patel, Dr. Bhavesh Modi, Dr. W.R. Hegan, Dr. Dinkar Rawal, Dr Makwana, Dr. S.B.Patel, Dr. Manubhai Solanki, Dr. Mitesh Bhanderi, and Mr. P T Joshi who have coordinated the
I • . survey 111 a praiseworthy style.
Further, I would like to thank to my faculties at AMCHSS: Dr. V. Raman Kutty, Dr. P. S. Sharma, Dr. D. Varatharajan, Dr. TK Sundari Ravindran, Dr. Mala Ramanathan, Dr. Manju Nair, and Dr. Biju Soman for providing valuable suggestions to improve the technical contents of the study. Also, I am sincerely thankful to Mr. Sundar Jayasingh Assistant Registrar, SCTIMST for all his suppmi especially in administrative and logistic matters.
I am also grateful to Dr. Devadasan and Dr. Dileep Mavalankar (visiting faculties) at SCTIMST who have given me great inputs and idea regarding study methodology during my study period.
I would also like to thank Dr. Khatari & Mrs. Saxena Ruchi who facilitated the secondary data required for this work.
AmarN. Shah
2

Declaration
I hereby declare that this dissertation work titled "Integrated Disease Surveillance
Project (IDSP) in Gujarat: An Evaluation with particular reference to Malaria", is an
original work of mine and it has not been submitted to any other institution or University.
Dr. Amar Shah
Thiruvananthapuram
27 October 2007.
3

I hereby certify that the work embodied in this dissertation titled 'Integrated
Disease Surveillance Project (IDSP) in Gujarat: An Evaluation with particular
reference to Malaria' is a bonafide record of original research work undertaken by Dr
AMAR SHAH, in partial fulfillment of the requirement for the award of the MPH degree,
under my guidance and supervision.
Guide: Dr. K. R Thankappan (M.B.B.S., M.D., MPH)
Professor & Head, Achutha Menon Centre for Health Science Studies Sree Chitra Tirunal Institute for Medical Sciences and Technology Thiruvananthapuram, Kerala. India.
4

Table of Contents Acknowledgements ....................................................................................................................... 2
Declaration .................................................................................................................................... 3
~ ........................................................................................................................................ 4
Table ofContents .......................................................................................................................... S
List of abbreviations ..................................................................................................................... 7
Abstract ......................................................................................................................................... 8
1. INTRODUCTION ................................................................................................................................ 9
1.1 Introduction to disease surveillance .................................................................................. 9
1.2 Why we need surveillance? .............................................................................................. 9
There is a significant magnitude of communicable disease ...................................................... 9
There is a high rise in non-communicable diseases .................................................................. 9
Epidemics cost lives and money ............................................................................................... 9
1.3 What type of surveillance we need? ............................................................................... 10
1.4 Literature related to surveillance evaluation ................................................................... ll
1.4.2 National ................................................................................................................... 13
1.4.3 State ......................................................................................................................... 13
1.5 Rationale for the study .................................................................................................... 14
2. BACKGROUND OF THE GUJARAT STATE ................................................................................. 15
2.1 Geography ....................................................................................................................... 15
2.2 Demography & Socio-economic factors ......................................................................... 15
2.3 Health systems ................................................................................................................ 16
2.3.1 Health services infrastructure ................................................................................. 16
2.3.2 Human resources for health:- .................................................................................. 16
2.3.5 Review of existing surveillance systems ................................................................ 17
2.3.6 Brief description of exist.ing component of surveillance system ............................ 18
3. OBJECTIVES OF ASSESSMENT .................................................................................................... 22
4. METHODOLOGY ............................................................................................................................. 23
4.1 Preparation for the assessment ...................................................................................... 23
4.2.1 Selection of districts ................................................................................................ 24
4.3 Procedure and data collection tools ................................................................................ 25
4.3.1. Procedure ................................................................................................................ 25
4.3.2. Assessment tool ...................................................................................................... 26
4.4 Field assessment ............................................................................................................. 27
5

4.5 Data analysis ................................................................................................................... 27
4.5.1 Quantitative analysis ............................................................................................... 27
4.5 .2 Qualitative analysis ................................................................................................. 27
5 FINDINGS .......................................................................................................................................... 28
5.1. Presence of Surveillance Systems ................................................................................... 28
5.2. Case detection and confirmation ..................................................................................... 29
5.2.1. Use of standard case definition ............................................................................... 29
5 .2.2. Diagnosis of Malaria ............................................................................................... 30
5.3. Reporting ........................................................................................................................ 30
5.3.1. Total reporting units ................................................................................................ 30
5.3.4. Completeness and Timyliness of Surveillance Reporting ....................................... 32
, 5.4. Analysis .......................................................................................................................... 34
5.4.1 Routine Analysis ..................................................................................................... 34
5.4.2 Planning and action based on data .......................................................................... 36
5.5. Epidemicprepar!=dness ................................................................................................... 36
5.5.1 Epidemic Preparedness Infrastructure .................................................................... 36
5.6. Outbreak Management. ................................................................................................... 37
5.7. Feedback ......................................................................................................................... 38
5.8. Supervision ..................................................................................................................... 39
5.9. Coordination ................................................................................................................... 39
5.10. Training ...................................................................................................................... .40
5.11. Laboratory .... _. ............................................................................................................. .42
5.12. GIS .............................................................................................................................. 42
5.13. Communications ......................................................................................................... 43
5 .14. Opinion regarding IDSP ............................................................................................ .44
5.15. Review of surve~llance data before and after implementation of IDSP in Gujarat state 46
6. CONCLUSION & RECOMMENDATION ....................................................................................... 49
6.1 Strengths ......................................................................................................................... 49
6.2 Challenges ....................................................................................................................... SO
6.3 Table of conclusion & recommendations ....................................................................... 51
7 REFERENCES ........................................................................................................................................ 52
8. ANNEX ................... , .......................................................................................................................... 56
6

List of abbreviations
AFRO
AMCHSS
BHO
CDC
CDHO
CHC
csu DALYs
DPHL
-Dso DSU
FHW
GIS
GSWAN
IDSP
IDSR
MHW
NICD
NRHM
NSPCD
NVBDCP
PHC
RNTCP
RRT
RU
SEARO
ssu WHO
WHO Regional Office for Africa
Achutha Menon Centre For Health Science Studies
Block Health Office(r)
Centre for Disease Control
Chief District Health Office(r)
Community Health Center
Central Surveillance Unit
Disability Adjusted Life Years
District Public Health Laboratory
District Surveillance Officer
District Surveillance Unit
Female Health Worker
Geographic Information System
Gujarat State Wide Area Network
Integrated Disease Surveillance Project
Integrated Disease Surveillance and Response
Male Health Worker
National Institute for Communicable Disease
National Rural Health Mission
National Surveillance Project for Communicable Diseases
National Vector Born Disease Control Program
Primary health Centre
Revised National Tuberculosis Control Program
Rapid Response Team
Reporting Units
WHO Regional Office for South East Asia
State Surveillance Unit
World Health Organization
7

Abstract
Background and Objectives: Government of Gujarat started the Integrated Disease Surveillance Program from 2003, and this program was merged with India's Integrated Disease Surveillance Project (IDSP) from November 2005. Its aim is to assist health staff to detect and respond to diseases of public health importance. By the year 2007, all the Indian states have started implementing the IDSP. So far no major study has been conducted in any Indian state regarding functioning of IDSP. Therefore I decided to conduct an evaluation study to find out merits and demerits of the project with specific focus on malaria
Methods: All the 25 districts in the state were grouped into two based on the median slide Falciparum rate. One district from each group was selected randomly. From each district 17 health facilities including four sub centres, eight primary health centres,, two community health centres, one chief district health office and two block health offices were selected for the study. Data were collected using semi structured questionnaire for health staff, observatory check list for health facility, in-depth interviews for selected health staff and record reviews. Positive patients were visited at their homes for cross checking the validity information.
Results: In general there was a well established infrastructure for surveillance system in all districts which provided electronic data reporting on a weekly basis. Surveillance data showed a definite increase in the case and outbreak detection and decrease in deaths, which indicates favorable outcome for IDSP. The parallel pre-existing disease control programs also helps in managing the disease situation. Laboratory confirmation of disease (checked for Malaria) was consistently found at every level. Compliance of the system particularly timeliness & completeness of the reported data was good (89% and 98% respectively) at the rural repmiing units. The routine weekly analysis of data at state and district level was found to be consistent and of the desirable standards. Specifically assigned Rapid Response Teams along with allocation of funds up to taluka level ensured the epidemic preparedness of 92% in studied districts. Attitude &
satisfaction of health staff regarding IDSP was found to be 94%, which is a good sign for the future development of the project.
On a negative note, involvement of Private sector was very limited (3%) and the str<l;tegies of involving them were not shown in both districts. The written case management protocol for epidemic situation was not found at any health facility studied. Use of Geographic Information System is not based on epidemiological data. The data operators were not provided training regarding data management at state and district level. Reporting systems were weak in terms of data documentation and the data were not recorded in a standard way in 55% of health facilities visited.
8

1. INTRODUCTION
1.1 Introduction to disease surveillance Disease surveillance is the ongoing systematic collection, analysis, and interpretation of
health data essential to the planning implementation, and evaluation of public health
practice, closely integrated with the timely dissemination of these data to those who need
to know. 1
1.2 Why we need surveillance?
There is a significant magnitude of communicable disease.
Worldwide, one death in every three (32.3%) is from (communicable diseases, maternal-
perinatal conditions, and nutritional deficiencies). 2
There is a high rise in non-communicable diseases.
The proportion of deaths due to non-communicable disease is projected to rise from 59
per cent in 2002 to 69 percent in 2030.3
India has also rising burden of chronic diseases, which are estimated to account for 53%
of all deaths and 44% ofDALYs lost in year 2005.4
Epidemics cost lives and money.
Besides direct costs in outbreak control measures and treatment of a patient, the indirect
costs due to negative impact on tourism and trade is also devastating. For example, the
failure to detect and control the epidemic of plague in 1994 at its early stages resulted in
tragic loss of life as well as disruption of trade, commerce, transportation and tourism -
estimates of the total cost are as high as US$ 1.5 billion; and the emergency and large
scale response eventually required placed a heavy burden on the health system. 5
Indirectly these are costs to not having an effective disease surveillance system.
9

Importance of malaria surveillance
At the end of 2004, 107 countries and territories had areas involving 3.2 billion people at
risk of malaria transmission. 6
A global total of 402 million cases were estimated for 2004, of which about 57% was
from AFRO and 30% from SEAR0.7
For India the estimate was 83 million cases for year 2004.7 but if we see reported cases of
malaria for India it was 1. 78 million cases. The reason is inadequate health information
system. Completeness of reporting of data is just 2.5%. 8
1.3 What type of surveillance we need? India is currently passing through an epidemiological transition. Many states in India
have good health delivery systems while other states are lagging far behind.
Health problems of some states are predominantly due to communicable diseases while in
others it is due to non communicable diseases.
Need for comprehensive surveillance
A study in Tamilnadu state clearly showed that India needs a surveillance system, which
is integrated, decentralized and involving private and government sector.9
Logic ofhaving surveill_arrce
It is believed that disease surveillance program will avert a sufficient number of disease
outbreaks, reduce human suffering, morbidity and mortality in specific diseases by
improving disease control programs so that the incremental cost of running the project
can be financed from the savings of actual health expenditure in the state. 10
10

I
I t 11
1.4 Literature related to surveillance evaluation
1.4.1 International
The pnmary evaluation of integrated disease surveillance and response (IDSR) m
Tanzania was one of the first approaches to evaluate such type of systemY
• The instruments used in evaluating the system were record revtew, group
interview and self-administered survey.
• 33 indicators were used in the four broad group namely reporting, use of
surveillance data, outbreak management and management of IDSR system.
• Within each district, the selection of health facilities was made on a convenience
basis with an effort to make the sample as representative as possible in temis of
facility location, size, performance, and ownership (government/private), taking
into consideration time and transport constraints.
In September and October 2004, WHO teams evaluated the project on strengthening
surveillance and control of vaccine-preventable and epidemic-prone diseases, which had
been implemented in four countries in the WHO African Region (Burkina Faso, Ghana,
Guinea and Mali) and in one country in the WHO Eastern Mediterranean Region (Sudan)
in 2001. 12
The final project evaluation's main objectives were:
• To measure the achievements of the project objectives, outputs and outcomes
based on the expected results;
• To assess the changes in each country's surveillance system using the core
indicators of Integrated Disease Surveillance and Response (IDSR) that measure
the effectiveness of the system and thus serve as proxy measures of project
outcomes;
11

The evaluation process employed a qualitative approach, but it also drew on available
quantitative information. In order to reduce costs, the information-gathering process was
organized in two phases: a "distance phase" of retrospectively reviewing available
country specific project documents and a "field phase" to gather information not captured
through document reviews by interviewing key informants involved in implementation.
The field phase also served to confirm and expand on what had been learnt from other
sources.
In February 2000, ministry of health, Makerere University Institute of Public Health,
WHO, and CDC performed a cross-sectional survey to determine the performance and
support of infectious disease surveillance systems at health facilities (e.g., dispensaries,
health centers, and hospitals) and district health offices. 13 The six systems assessed were
the Health Management Information System, the Weekly Epidemiological Report,
Tuberculosis/Leprosy, HIV/AIDS, Polio/Acute Flaccid Paralysis, and Guinea Worm
Eradication.
The assessment covered 52 (3%) of 1639 health facilities and eight (18%) of the 45
district health offices (two in each of the four geographic zones of Uganda). The districts
were selected by UMoH on the basis of timeliness of reporting. Three or four health
facilities were selected randomly within each district. Performance was measured using
surveillance indicators (i.e., detection, registration, and confirmation of case-patients;
reporting; data analysis and use; and epidemic preparedness and response) and
infrastructural and managerial support (i.e., feedback, performance reviews, training, and
resources) of surveillance activities using a protocol developed by WHO-AFRO with
support from CDC.
12

A study on timeliness of reporting of four notifiable diseases in 8 states of the USA
showed that delay in reporting varied markedly by type of disease and it is territory. The
method for data collection was review ofrecords. 14
A modified version of the WHO draft protocol for assessing surveillance and response
systems was seen in one of the assessment performed by the WHO member in assessment
of the national communicable disease surveillance and response system, Ethiopia.15 It had
assessed the core and support functions of IDSR system. The health facilities were
selected with a mix of random and convenient sampling.
1.4.2 National Tamilnadu NADHI (North Arcot District health Information) model outlined various
reasons for successful surveillance, which includes simplicity, low budget, private sector
participation, regular feedback of information through a monthly bulletin.9 This study
also pointed out that though data on malaria and HIV infection were available at national
level, no one has used the data at the district level before.
A study by Sathyanarayana for "Evaluating Integrated Diseases Surveillance Project in
Bellary Unit, Kamataka state" used a record review and interview schedule tool for data
collection. This evaluation concentrated on the parameters like timeliness, trained
manpower, use of surveillance data and protocol adherence. 16
1.4.3 State
A situation analysis for IDSP Navasari District, Gujarat revealed that the surveillance for
risk factors for non-communicable disease has not been started yet and the participation
from the private practitioner is minimal. 17• 18
13

1.5 Rationale for the study IDSP is currently in the implementation stage in all the Indian states and till date no
major study has been conducted in any Indian state regarding functioning ofiDSP.
• So it is of public health importance to evaluate the performance of the IDSP so that
merits and demerits of the project can be examined and appropriate public health
strategies can be planned for future development of the project. As one of the
objectives of the IDSP is "To integrate existing surveillance activities so as to avoid
duplication and facilitate sharing of information across all disease control programs
and other stake holders it is very important to evaluate the surveillance adequacy by
IDSP so that decision regarding merging it with existing vertical disease surveillance
system can be taken up correctly.
• Gujarat State has been selected for this evaluation based on feasibility
14

2. BACKGROUND OF THE GUJARAT STATE
2.1 Geography
Gujarat is situated between 20°1' and 24°7' north latitudes and 68°4' and 74°4'east
longitudes on the west coast of India. It is bounded on the west by the Arabian Sea, on the
north-west by Pakistan, on the north by Rajasthan, on the east by Madhya Pradesh and on
the south and south-east by Maharashtra.
2.2 Demography & Socio-economic factors In Gujarat there are 25 districts, 226 Talukas, 242 towns & 18618 villages.
Its official and primary language is Gujarati. The population density is 258 per square
km. 19 The religion of the majority of its residents is Hinduism, in addition to significant
percentages following Islam, Jainism, Zoroastrianism and Christianity. Most of the
Gujarati people are vegetarians. Amongst Hindus the deity of Krishna is famously
worshipped in His form of Sri Nathji throughout Gujarat. Gujarat is the birthplace of
Ghandhiji.
Table 1: Demographic, Socio-economic profile of Gujarat State as compared to
India19
S.No. Item Gujarat India
1 Total population (in million) 50.67 1028.61
2 Decadal Growth (%) 22.66 21.54
3 Population below Poverty line (%) 14.07 26.10
4 Schedule Caste population percentages 7.09% 16.2%
5 Schedule Tribe population percentages 14.76% 8.2%
6 Female Literacy Rate(%) 58.6 54.28
15

2.3 Health systems
2.3.1 Health services infrastructure
As per the norm the number of subcentres is adequate, however, there is a shortage in
Primary Health Centre (PH C) and in Community Health Centre (CHC) of 100 and 20
respectively.20
The other Health Institutions in the State comprise of 13 medical colleges, 25 district
hospitals and 409 referral hospitals. Also there are 106 city family welfare centers and
8347 rural dispensaries. Apart from this there are 48 Ayurvedic hospitals and 493
dispensaries, 14 homeopathic hospitals & 216 dispensaries and no Unani hospitals.
2.3.2 Human resources for health:-
Against the total required multipurpose worker (Female)/ ANM at sub centers & PHCs,
77.9% are in position, whereas for health Worker (Male) /MPW (M) at Sub centers only
38.12% positions are filled. For the Health Assistant (female)/ LHV post at PHCs, 80.4%
and Health Assistant (Male) 57.5% are in position. Among the Radiographer, Pharmacist,
Lab technician and Nurse/midwife, 40%, 59.3%, 64.3% and 53% are in position
respectively. While 84.6% ofPHC doctor positions are filled, only 7.7% of specialists are
in position at CHCs.
16

2.3.3 Health status
Table2: selected indicators
Selected Indicators Gujarat India
1 Crude Birth Rate Ll 23.7 23.8
2 Crude Death Rate Ll 7.1 7.6
3 Total Fertility Rate LL 2.42 2.7
4 Infant Mortality Rate 22 50 57
5 Maternal Mortality Ratio Lj 389 466
6 Sex Ratio 19 921 927
2.3.4 The burden of diseases Malaria is one of the major public health problems in Gujarat and it accounts for 6.06
percent of total India's burden. 24
2.3.5 Review of existing surveillance systems
Disease surveillance activity in Gujarat
The NSPCD (National Surveillance Project for communicable Diseases) was initiated in
1998 as a pilot project with WHO supporting the initial 5 districts. The reporting was on
monthly basis. 25
Following· earthquake in Gujarat (2001), WHO was involved in relief and rehabilitation
activity.25 As a part of this package, WHO developed the weekly disease surveillance
programs in Kutch district. By 2003 Integrated Disease Surveillance Program being
implemented in 8 districts and 3 municipal corporations of the state. By July 2004 the
program was expanded to all the 25 districts of the state. In June 2005 WHO handed over
17

the program to Government of Gujarat and was merged with National level project IDSP
on 8-11-2005. Now Government oflndia is giving technical and financial assistance and
for these activities Rs. 18 Crores have been sanctioned for the period of year 2005-2009.
Diseases like Malaria, Leprosy, HIV/AIDS, Blindness control, tuberculosis, Polio have
their own surveillance activity in their respective disease control programs.
2.3.6 Brief description of existing component of surveillance system
OVERVIEW OF IDSP In the country the IDSP was implemented in three phases in three years and in Gujarat it
was implemented in Phase II (2005-06)
Objectives of IDSP 10
• To establish a decentralized state based system of surveillance for communicabie and
non-communicable diseases so that timely and effective public health actions can be
initiated in response to health challenges in the country at the state and national level.
• To integrate existing surveillance activities so as to avoid duplication and facilitate
sharing of information across all disease control programs and other stake holders
Specific Objectives10
1. To integrate and decentralize surveillance activities
2. To establish systems for data collection, reporting, analysis and feedback
using information technology
3. To improve laboratory support for disease surveillance
4. To develop human resources for disease surveillance and action
5. To involve all stakeholders including private sector and communities m
surveillance.
2.3.6.1. P . . d. 10 rwnty tseases
18

Table3: List of priority diseases in Gujarat
Regular Surveillance
Vector Borne Disease 1. Malaria
Water Borne Disease: 2. Acute Diarrhoeal Disease (Cholera)
3. Typhoid
4. Hepatitis
Respiratory Diseases 5. Tuberculosis
6. Acute Respiratory Infection
Vaccine Preventable Diseases: 7. Measles
Diseases under eradication 8. Polio
Other Conditions 9. Road Traffic Accidents
(Linkup with police computers)
Other International commitments 10. Plague, Yellow fever
Unusual clinical syndromes: (Causing 11.Menigoencephalitis/ Respiratory death/hospitalization) Distress, Hemorrhagic fever Undiagnosed
conditions
Sentinel Surveillance
Sexually transmitted diseases/Blood borne 12. HIV, HBV, HCV
Other Conditions 13. Water Quality
14. Outdoor Air Quality (Large Urban centers)
Regular periodic surveys
NCD Risk Factors 15 Anthropometry, Physical activity, blood pressure, tobacco & diet
State specific diseases
Gujarat State specific diseases Dengue, Leptospirosis, diphtheria, Hepatitis A & E
The number of core diseases is limited to improve quality of surveillance and to reduce
workload on the peripheral health worker.
19

l J I I
Process, Structure & linkages
Flow Chart 1: Information flow under IDSP
.----'------, J Sub-Centres I
lnfonnatlon Flow 8 c.s.u .
SOURCE: GOI, Integrated Disease Surveillance Project India: Project Implementation Plan
2004-2009
Output Surveillance Action in IDSP
Preset trigger levels for diseases will be identified and specific responses prescribed for
various levels. The levels will depend on the epidemic potential, case fatality of the
disease and the prevalence of the problem in the community.
1. Trigger Level-l Suspected /limited outbreak- Local response
2. Trigger Level-2 Epidemic- Local & Regional Response
3. Trigger Level-3 Widespread Epidemic- Local, Regional and state level responses
20

f I
1 Communication To ensure quick data flow and accessibility of data to all stakeholders at the district,
corporation, medical college and hospital, RDD and the State levels, special software for
I IDSP has been designed. This software (Web based application software) will be
available to the offices of the CDHO/MOH/MC/RDD/and the State through the Gujarat
State Wide Area Network (GSWAN).
21
' 1·.·. ' i 1 I
3. OBJECTIVES OF ASSESSMENT • To assess the overall structure and support function of the Integrated Disease
Surveillance Project in Gujarat State.
• To assess core functions and surveillance quality with particular reference to
Malaria surveillance component of the Integrated Disease Surveillance Project
(IDSP).
22
f J I I
4. METHODOLOGY
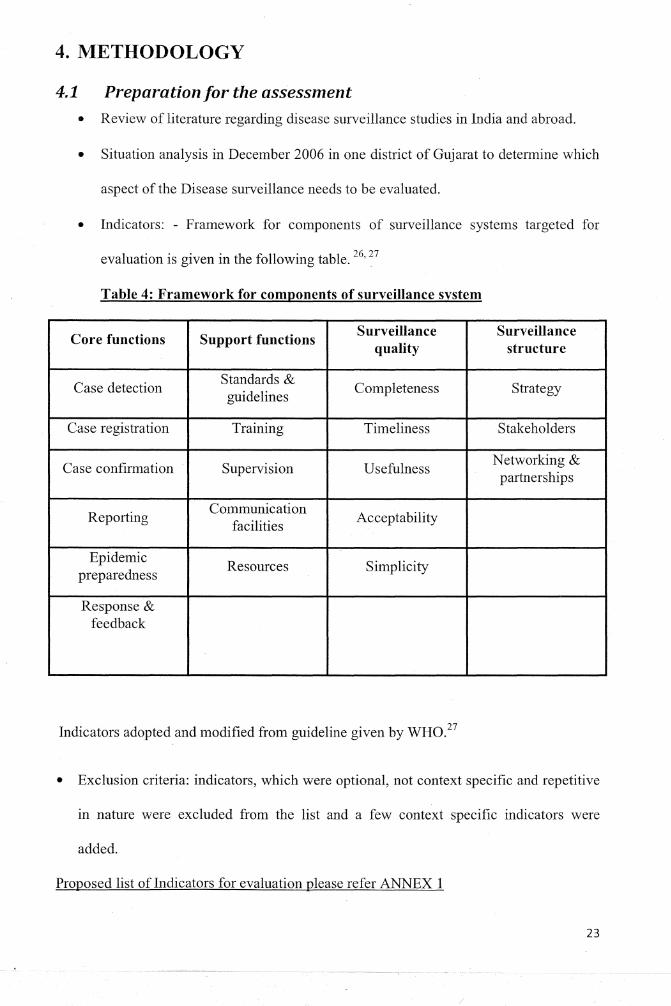
4.1 Preparation for the assessment • Review of literature regarding disease surveillance studies in India and abroad.
• Situation analysis in December 2006 in one district of Gujarat to determine which
aspect of the Disease surveillance needs to be evaluated.
• Indicators: - Framework for components of surveillance systems targeted for
evaluation is given in the following table. 26' 27
Table 4: Framework for components of surveillance system
Core functions Support functions Surveillance Surveillance
quality structure
Case detection Standards &
Completeness Strategy guidelines
Case registration Training Timeliness Stakeholders
Case confirmation Supervision Usefulness Networking & partnerships
Reporting Communication
Acceptability facilities
Epidemic Resources Simplicity
preparedness
Response & feedback
Indicators adopted and modified from guideline given by WH0.27
• Exclusion criteria: indicators, which were optional, not context specific and repetitive
in nature were excluded from the list and a few context specific indicators were
added.
Proposed list of Indicators for evaluation please refer ANNEX 1
23

' . . . .
J
I 4.2.1 Selection of districts
Districts were arranged in ascending order according to average Slide Falciparum Rate
(2001-2006) and then divided into two groups by taking median SFR as the dividing
point. One district was selected randomly from each group. (ANNEX 2)
4.2.2 Selection of health facilities
Within each district 16-18 health facilities were selected based on multi stage selection as
shown in the flow chart.
Flow Chart 2: selection of health facilities
PHC sc 2CHC
~ '"< ~-
PHC
2BHO ~
District v PHC sc COHO
~ '
2CHC PHC i
District civil ,-.,A,-,
hosp1tal
24

1 J
I Table 5: Total health facilities visited: 35
Health Facility Number
Sub Centre 8
PHC 16
CHC 4
BHO Office 4
CDHO Office 2
IDSP state office 1 Total 35
Table 6: Total interviewed person: 53
Type Number Proportion
Health Worker 8 15%
Medical Officer 20 38%
Lab Technician 16 30%
Health Officer (BHO, DSO, CDHO) 8 15%
Project officer 1 2%
Total 53 100%
4.3Procedure and data collection tools
4.3.1. Procedure
.• Written permission was taken from Gujarat Govt. for the study.
• Ethical clearance for the study was given by the Sree Chitra Tirunal Institute for
medical sciences and technology, Trivandrum.
• All participants were thoroughly explained about the purpose of the study and.
voluntary nature of the participation. Participants were also assured for anonymity
of their identity. Prior to interview written informed consent from all participants
was taken.
25

' J
I 4.3.2. Assessment tool
4.3.1.1 Semi structured questionnaire and observation check list guideline were used for
data collection among sampled health facility and health professionals.
(ANNEX 3) A modified version of the WHO draft protocol for assessing
surveillance and response systems was used.28• 29 An assessmenttool comprising
of five sets of questionnaires was developed for use at the health facility (for
health worker, lab technician, medical officer), intermediate level ( DSO, BHO,
CDHO) and state level (project officer). Questions were reviewed, modified,
and adapted to suit the local realities.
4.3.1.2 WHO modified questionnaire was used for In-depth interviews of Key
informants (from sub sample of semi structured questionnaire health
professionals five in numbers. 12 It included the various types of health care
providers (MPHW, medical officer, district surveillance officer chief district
health officer, IDSP state nodal officer). (ANNEX 4)
4.3.1.3 Review of reports (ANNEX 5)
1. Quarterly review reports by State IDSP Cell
2. Weekly IDSP alerts- from District and State IDSP Cell.
3. Reports on malaria by NVBDCP
4. IDSP project documents
5. Village wise Focal spray report
6. Outbreak reports from State Epidemic Cell.
7. District: Outbreak reports, results of data analysis, epidemi~ preparedness plans,
meeting minutes, schedules and reports for health education and other activities, and
District Health Action Plan.
26

4.4 Field assessment Data collection time: - 15th June to 15th September
4.5 Data analysis
4.5.1 Quantitative analysis
Data from the record review and semi structured questionnaire were entered into
Microsoft excel spreadsheet and analyzed with SPSS version 14.0.
Action taken based on data: - By NVBDCP protocol, for malaria control 'regular
spraying' should be followed in endemic areas, but in non endemic areas 'focal spraying'
should follow the reported malaria cases. Therefore to check the action taken on the basis
of reported data, the dates of the focal spray with IDSP reported malaria cases were
tallied. This was done by reviewing the .records for a period of one month (July 2007) in
both the districts. The action was considered to be appropriate if the focal spray followed
within one week of malmia case reporting.
4.5.2 Qualitative analysis
Qualitative data were collected by recording the five interviews. Later on transcripts were
·prepared from it and analyzed based on each component assessed. They were used to
complement the quantitative data.
Accuracy of the reports
Accuracy of the reports was cross chec],<ed by paying home visits to the diagnosed
malaria cases. For this purpose eleven health facilities were selected randomly. The
recorded malaria cases diagnosed in the last two weeks were cross checked for accuracy
of the report.
27

5 FINDINGS
5.1. Presence of Surveillance Systems The surveillance system was present in all the 25 districts of Gujarat since July 2004 and
it was merged with IDSP in November 2005. The Integrated Disease Surveillance System
targets 17 selected diseases. Immediate and weekly reporting were expected for
tuberculosis, cholera, plague, yellow fever, meningococcal meningitis, measles, acute
flaccid paralysis/polio, neonatal tetanus, malaria, typhoid fever while AIDS, leprosy, and
sexually transmitted diseases were reported on sentinel surveillance. State specific
diseases include dengue, Hepatitis A & E, Diphtheria, Leptospirosis & unusual syndrome.
This disease surveillance system was functioning in all offices and health facilities
sampled (N=35).
Although tuberculosis and malaria are part of the IDSP, there were vertical data collection
for these diseases coordinated by the Revised National Tuberculosis Control Program and
NVBDCP in all health facilities sampled (N= 35).
Priority of diseases: - During discussions with key respondents the inclusion of TB into
weekly surveillance system could not be justified. Instead a monthly reporting system
would be more meaningful to capture the trend ofTB (static, increasing or decreasing).
28

5.2. Case detection and confirmation
5.2.1. Use of standard case definition
5.2.1.1 Standard case definition availability:-
All facilities (n=28) implementing malaria surveillance had standard case definitions. At
district level and the PHC level the 'IDSP medical officer manual' was available. All the
eight health workers had the reference manual in Gujarati language.
5.2.1.2 Standard case definition knowledge: -
All the 20 medical officers interviewed satisfactorily answered the question regarding the
probable malaria case definition.
5.2.1.3 Use of IDSP stamp:-
Last three days OPD papers were checked for use of IDSP stamp on it. At health facility
level (PHC & CHC) (N=20), 55 percent of health facilities did not use IDSP stamp on the
case papers. Others reported either unavailability or they hadn't started using it. Thus,
though medical officers had the IDSP manual and knowledge about the case definition,
the data were not recorded in a standard way (without IDSP stamp) which allows room
for error. In addition a number of uncommon abbreviations were found in OP registers
which can lead to incorrect tallying of data.
5.2.1.4 Proceedings with suspected malaria case: -
The above question was asked to the lab technician & health worker. All of them (N=24)
had given satisfactory answer, which matched the IDSP protocoL Here the male health
worker's duty was to do active surveillance and female health workers were detecting
malaria passively (during ANC check ups, immunization OPD).
29

r 1
I ' .
5.2.2.
5.2.2.1
Diagnosis of Malaria
Capacity to collect blood specimen
All sub-centers and PHC/CHC staff (N=44) answered that they were able to collect the
blood for suspected malaria. Required materials were present at all visited health facility
(N=20). (Slides and stains were available)
5.2.2.2 Capacity to transport specimen to higher laboratory
There was capacity at all levels to transport specimens to higher reference labs (N= 16).
5.2.2.3 Diagnosis of malaria within a week
All lab technicians (N=16) reported that the OPD cases of malaria were confirmed on the
same day whereas the cases referred by the health worker (slides) were confirmed within
seven days of receiving of slides. Four out of 16 (4 CHCs & 12 PHCs) were cross-
checked for records for period of previous two weeks. The duration between the date of
receiving slide and that of confmnation was within a week for all the four health
facilities.
5.2.2.4 Knowledge of reference lab
This question was asked to lab technician and out of total 16 lab technician 14 knew
about the referral Laboratory at state level.
5.3. Reporting
5.3.1. Total reporting units In the studied districts, district-! had 32 government reporting units (RU) with no private
sector involvement. For district-2, there were 64 government RU and also two private
RU.
30

Table 6: total reporting units in IDSP Gujarat
Name ofinstitution Government Private reporting Total
Reporting units units
Districts (25) 1367 32 1399
Municipal 75 15 90
Corporation ( 6)
Medic al college ( 6) 52 0 52
Total 1494 47 1541
All the systems reqmred reports to be passively sent to the next higher levels. The pnvate
sector involvement was only three percent. According to norms, at least one private
facility per block should be involved in surveillance reporting. The reasons identified for
the very low involvement of the private sector were lack of incentives and no regulation
for participation.
5.3.2. Availability of register
PHCs & CHCs were checked for rumor register & presumptive surveillance register. Out
of the total 20 facilities verified four didn't have the rumor register. All facilities had
registers for presumptive surveillance and in six of them; the pharmacist was maintaining
presumptive surveillance register. Four facilities had not maintained these registers for the
last two weeks. Out of the eight health workers interviewed, seven had register for
syndromic surveillance. Among those seven, one health worker didn't maintain it for the
last two weeks.
31

l J
I 5.3.3. Shortage of reporting forms in last 6 months
Out of total 52 health professionals only one medical officer reported about shortage of
reporting fonns in last six months.
5.3.4. Completeness and Timeliness of Surveillance Reporting
Completeness and timeliness are key indicators of reporting performance. These are
defmed as the proportion of expected reports received (completeness), and the proportion
of expected reports received on time (timeliness). Reports were considered late if they
had not been received by the established deadline. Calculation of completeness of
reporting included all of the reports received late and on time.
The studied district 1 showed 100% completeness and 100% timeliness, where as district
2 showed 71% timeliness and 95% completeness ( range: 84-1 00). Reporting was
particularly weak among district civil and urban hospital. They did not report for 9 & 8
times respectively out of total 24 times. When inquired about poor reporting performance
in some facilities, it was found that the periods of poorest performance often correlated
with those periods when the person responsible for reporting was away from the post,
remote location of health facilities, vacant posts and administrative problems at district
civil hospitals.
32

r 1
Graph 1: Completeness & Timeliness of reporting unit Gujarat state
' "'
120
100
00
60
Completeness and Timeliness of combined all Districts of Gujarat by week
j ~
40
-+-completeness COHO
_...,Timeliness CDHO
20
1 2 3 4 5 6 7 s 9 10 111213 14 15 15 17 18 19 20 21 22 23 24
Week number (number 1 starting from 7st January 2007}
The timeliness & completeness of IDSP reports in all districts of Gujarat state for first 6
months in year 2007 is given below (ANNEX 6 & 7).
For Gujarat state, the timeliness for all districts (CDHO) was 89% (districts range 51-100)
and completeness was 98% (districts range: 91-100) in first 6 months of the year 2007.
The urban area MOH had completeness of 87% and timeliness just 61%. And Medical
colleges (N= 6) had completeness of 97% and timeliness 69%. An explanation for this
type of finding could be low percentage (43%) of trained medical officer staff in Urban
MOH than that of rural medical officers (86%).
5.3.5. Data Reporting Comparison Between two surveillance system
Though the reporting staffs for the malaria cases in IDSP and in NVBDCP were same,
still there was a difference between the reporting of malaria positive cases in the studied
districts. The average difference in reported positive malaria cases in District- I was 2.05
33
---------~- ------------ --------~---------

cases per week among the two reporting systems with highest difference being 11, and in
District-2 the difference were 2.4 cases per week with highest difference being 21. The
key respondents agreed with these findings and mentioned about the new common
reporting form between NVBDCP & IDSP for malaria, which was in its final process of
launch, curtailing this type of error.
5.3.6. Accuracy of reports
Cross checking of malaria positive cases in last two weeks was done for 9 health facilities
(2 CHC and 7 PH C) out of total 20. The positive patients list from register was taken and
visited back at their home to verify the correct entry. All had registered entry correctly.
Out of the eight sub centers two sub centers were checked for the same and the case entry
was found to be correct.
5.4. Analysis
5.4.1 Routine Analysis
The comparison of routine analysis between two districts was done usmg mne
parameters. WHO/AFRO recommends two specific types of analysis - tracking of
monthly malaria inpatient cases and deaths and long-term trend analysis (for example
year to year) of malaria, both for children aged less than five years and total population.
The findings are given below.
34

·f.···· ..
Table7:- Comparison of routine analysis in studied area
Parameter Observed as routine analysis District-! District-2 State IDSP cell
Timeliness " " " Completeness " " " Defaulters " " " Disease trend " " "
Malaria Trend Monthly " " " " " "
Weekly
GIS mapping X X '-1
List of top 10 high risk area for malaria " '-1 NA (in collaboration with NVBDCP)
Denominator " " '-1 (a) <5 year population
(b) Total population '-1 " " Tallying of date for PHC confirmed 90% 80% NA
IDSP malaria report and focal spraying report in non endemic area ( Period of
one month)
The IDSP in collaboration with NVBDCP analyze the routine data for malana. Though
both the districts scored well in all nine parameters, some issues came into notice.
The information regarding number of out breaks of malaria and related data of morbidity
and mortality for last 3 years was not documented either in NVBDCP or in IDSP. Though
computers were available at all PHCs, Medical officers did not perform trend analysis.
When explored the reasons for not doing, it was found that the data analysis at every
level required repetitive training which lacked due to high turn over of staff and
deficiency of staff at every level. Also, as the lower health facility staff gets the weekly
feedback and analysis from district level officials regularly, the felt need for analysis at
lower level was low.
35

r J
I 5.4.2 Planning and action based on data
The idea behind tallying the report of the 'focal spraying' with IDSP reported malaria
case was to see how much routine analysis was used for taking action. For District-!, 90
percent of the date matched with that ofiDSP report and for District-2, it was 80 percent.
(Table 7)
5.5. Epidemic preparedness
5.5.1 Epidemic Preparedness Infrastructure·
IDSP budget guideline was found in each District. Also state Government budget had
2245 crores rupees head grant spare for natural disaster. The epidemic preparedness
plans submitted by both districts in their 'District Health Action Plan' year 2007-12 under
NRHM were reviewed. The results are shown in the table below.
Table 8: IDSP plans under NRHM (2007-2012)
Element District I District2 Total
Staffing -I -I 2
Buffer stocks -I -I 2
Training -I .J 2
Health education -I -I 2
Preventive action (Chlorination/ Gambu fish) -I -I 2
Office automation .J X 1
Total 6 5 92%
Note: - .J means element was taken in to account in planning. X means element was not
taken in to account in planning.
36

State level RRT (Rapid Response Team) & district level RRT were assigned for
management of any epidemic outbreak. Out of total 101 team members of RR T, 49 were
trained for epidemic preparedness. Both the districts under study had their district level
and Taluka level RRT team documented. IDSP mainly concentrated on the waterborne
outbreaks. The Malaria outbreaks information was kept by the NVBDCP only.
Existence of a w1itten case management protocol for malaria epidemic was lacking at all
PHC/ CHC level.
5.5.2 Epidemic threshold Knowledge
Epidemic threshold knowledge regarding malaria was asked at all levels of health facility.
Out of the eights health workers seven knew about the local epidemic threshold. At PHC
& CHC level out of 20 officers 13 knew about the epidemic threshold level for malaria.
And at District level (BHO, DSO, CDHO) out of total eight officers only four gave the
satisfactory answer for malaria epidemic threshold. The lack of emphasis on this
component in training of higher officials could be one of the reasons for low awareness
among higher officials.
5.6. Outbreak Management
As there were no outbreaks in the study districts during study period, RRT response to
any epidemic could not be assessed for these districts. To confirm whether there was
really no outbreak, records were checked for case data and verified for any unusual rise or
crossing of threshold limit during the data collection period. In both district no unusual
rise or crossing of threshold was found during the study period, which indicated good
quality of routine analysis of data.
37

5. 7. Feedback
Flow Chart 3: feedback pattern observed in the system
state IDSP cell
Weekly State Alert+ Monthly Disease Trends
State Programme ~DHO, DSO
Officers
Weekly district Alert +Monthly district disease Trend
Medical Officer, BHO, District Programme Officers
Verbal feedback during meethings & supervison
Health - Worker
The frequency of feedbacks in the two districts are given below for last 3 months. All
Medical officers (BHO + MO) (N=24) replied when interviewed that in the last 3 months,
in addition to written feedbacks they also got weekly district alerts (12) and monthly
district disease trend reports (3). All the CDHO, DSO (N=4) replied that they were
getting weekly state alert report and monthly state disease trend report without fail during
last 3 months. Health workers (N=8) replied that they were getting feedback by medical
officer as and when required during meetings as well as during supervisory visits by
DSO. On asking the opinion about the feedback, 96% (50 out of 52) replied that, they felt
that the feedback was positive in nature. The common feedback topics were quality of
reports (49%) and assistance in task (60%). There were no feedbacks given by means of
quarterly or yearly bulletin by central MOH regarding technical updates in last 3 months.
38

5.8. Supervision
Central team from Delhi (World Bank team accompanied by NICD officers) had visited
Gujarat state for IDSP implementation progress on 7-9 May 2007. By IDSP protocol, the
supervisory visits should be at a rate of one visit per facility per month.
In the studied districts the reported numbers of supervisory visits by CDHO and DSO in
the last three months are given below.
Table 9: Supervision
Supervisory visits by Supervisory visits by DSO CDHO/DHO m last 3 in last 3 months months
District 1 3 12
District 2 5 18
District-2 had faced a major epidemic in 2004. This could be the probable reason behind
more number of supervisory visits in the district.
On asking how many times you have been supervised for IDSP by DSO I BHO in last
three months, the answers given (by medical officer, health worker, lab technician)
ranged from 1 to 9 with mean value of 4.
5.9. Coordination Strengthening surveillance at the district level involves working with a variety of partners
(or stakeholders) both within the health system and outside it. These partners may include
vertical program officers within the health sector (such as NVBDCP), and other
community leaders. . Chief District Health Officers of studied district and State IDSP
nodal Officers were asked about their communication and coordination with others during
the previous six months in two particular areas: sharing data & coordinating resources.
The results are given below.
39

T ..
Table 10: Coordination
regarding Data & human disease
disease coordinated regarding with all program
& human officers but resource coordinated
resource coordinated
outbreak related morbidity and mortality data were not shared between IDSP and NVBDCP
Both the CDHO showed examples of various campaigns (for example cycle rally, school
children rally), which involved community. Also they conducted a monthly meeting with
DMO and DSO to coordinate the activities of both programs. The state IDSP officer
invited all program officers of different department at state level to participate in their
IDSP meeting and to discuss some coordination issues.
On a negative note data regarding outbreak related morbidity and mortality were not
shared between IDSP and disease control programs. Here the IDSP didn't have the
figures regarding the number of malaria outbreaks and the mortality and morbidity
statistics associated with it, which was available with NVBDCP.
5.1 0. Training Training status under IDSP- May 2007:- Out oftotal105 required master trainers, 94'had
been given training. Data entry operators had not been trained for IDSP and 7 out of 25
districts had no data entry operators. 171 block health officers were trained.
40

Table 11: Training status in Gujarat under IDSP (till May 2007)
Medical officer Medical officer Workers, Laboratory Laboratory (CHC+PHC) (general supervisors & technician technician
Hospital) pharmacist (state+ DPHL) (PHC+CHC)
Training complete Training complete Training complete Training complete Training complete load load load load load
Total 1722 1482 364 156 11649 10476 54 51 988 749 % 86.06 42.86 89.93 94.44 75,.81
Here the Medical officer (general hospital) training was found to be 42.86% which was low as compared to other staff's training status, which could contribute to the lower compliance (timeliness and completeness of reports) in urban area.
Table 12: Observed training status among the sampled staff
Health Total visited Trained for IDSP Reason for not professionals trained
Health worker 8 7 Newly appointed
Lab technician 16 16 -Medical officer 20 20 -
BHO 2 1 Trained as MO
DSO 2 2 -CDHO 2 2 -
IDSP state officer 1 0 Trained & Worked in
NSPCD Dunng the m-depth mterv1ew w1th State IDSP nodal officer, CDHO, DSO and Medical
Officer, the barriers in providing effective training to the health staff were reported to be
high tum over of staff, vacancy and change in the reporting format every 2-3 years.
41

5.11. Laboratory The laboratory functioning was assessed particularly with reference to malaria. It was
found that all the laboratories {Ll level, N=20) were equipped with microscopes. Malaria
was consistently confirmed in all laboratories assessed. Reagents and supplies shortage
was not a problem in the last 3 months (reported). There was a state reference laboratory
(L3 level) which also carried out disease and outbreak confmnation. The line listing of
diseases like diphtheria was done as probable cases without laboratory confmnation and
hence it carried little epidemiological significance. According to key respondents, District
Public Health Laboratory (DPHL) will soon be established in four districts which would
provide case confirmation (culture & serology) at district level.
5.12. GIS
5.12.1 Level of health facility at which GIS is used
The system was using GIS (geographic information system) at state level. At district level
GIS use was at primitive level in both districts studied.
5.12.2 Type of information available on GIS
At state level they had base maps for administrative boundaries up to district level of
Gujarat. Base maps were not available for the geographic part (such as road, rivers and
elevation) and geo-referenced :rill;:tge database (facility/school) was also not available
5.12.3 Training regarding GIS
Data entry operators were on. contract basis and not trained for IDSP/GIS. About the type
of GIS software the officer gave the information that the GIS software was custom made
and developed by Gujarat State. The software was soon going to change in line with
national IDSP software.
42

5.13. Communications Table 13: Communication Status in studied Districts
Equipment District 1 District 2
Computer Up to PHC level Up to PHC level Telephone Fax Up to BHO level Up to BHO level
GSWAN Up to district level Up to district level
Target sites for EDUSAT installation 34
Sites, which were functional 29
Frequency of using the EDUSAT m last 3 months was once monthly with central
surveillance unit. The EDUSAT also had component of Video conferencing, which
connected CSU to DSU directly (in process). All districts were reporting to the State cell
via GSW AN. On asking any major operational constrains experienced, the officer had
replied that "the major problem in transmitting the weekly data through IT network was
interruption of the GSW AN connectivity."
43

r I
5.14. Opinion regarding IDSP Total 52 health professionals were interviewed. They were questioned about the five
parameters. The results are given below.
Graph2: -View regarding IDSP from Interview staff (Full table in ANNEX 8)
Cll 1>.0 ru .... s:: Cll u .. Cll 0.
70
60
50
40
30
20
10
0
USEFULNESS
(N=52)
Interpretation
Opinion regarding IDSP
SCALE l=LOWEST 5 = HIGHEST
SIMPLICITY ( ADAPTABILITY SENSITIVITY
N=52) (N= SO) (N=S2)
Paratmeter
RELIABILITY
(N= 29)
Ill scale 1
•scale 2
IJscale 3
II scale 4
BscaleS
Usefulness: 37 %of the interviewed staff gave opinion that IDSP was extremely useful
and 58% said it to be very useful. Remaining opined it to be useful.
· Simplicity: 35 % of the interviewed staff gave opinion that IDSP was extremely simple
and 37% said it to be very simple. 27% opined it to be simple & 2% said it was some
·what simple than in past.
Adaptability: 18 % of the interviewed staff gave opinion that IDSP was extremely
adaptable and 52% said it to be very adaptive. 20% opined it to be adaptable & 4% said it
was some what adaptable. Six percent said IDSP was not at all adaptable to the situation.
44
--- c---- ----------~---- -----·- ~

The reason for lower adaptability given by the health worker was that in rainy season the
surveillance reporting becomes daily and overall large amount of vacancy in the health
worker cadre (vacancy at post for MHW 72%, and for FHW 23%) created difficult
situation to fulfill the task. In this situation usually they had been assigned extra duty,
which was sometimes practically impossible to do.
Sensitivity: 17 % of the interviewed staff gave opinion that IDSP was extremely sensitive
and 42% said it to be very sensitive. 37% opinioned it to be sensitive & 4% said it was
some what sensitive in detecting outbreak.
Reliability: - 28 % of the interviewed staff gave opinion that IDSP was extremely
reliable and 34% said it to be very reliable. Remaining opined it to be reliable.
On asking overall satisfaction with the IDSP, 94% health care provider (N=52) showed
satisfaction with the system.
45

5.15. Review of surveillance data before and after implementation of IDSP in Gujarat state
Graph3: -Records of outbreak detected in Gujarat since 2001(ANNEX 9, 10)
Trend of Total Number of Outbreaks, Cases detected in Outbreaks and deaths during Outbreaks In Gujarat
2001-2006 ~ Num'be"r:;;,f~, { OutSr~~OR oeains , ,
~ == "=""
10HDn 200
8001}
150
soon
100 400;)
so 2000
0
2001 2002 2003 2004 2005 2006
Case -+-Outbreak ""'~':""'~'Death
Data Source: State Epidemic Cell, Gandhinagar (Table given in Annex)
Interpretation: Surveillance started in all district from 2004 July .. It·_cah be noticed that
reporting of the number of outbreaks and cases are increasing whereas the numbers of
reported deaths are decreasing. This means that outbreaks are being detected earlier than
before which can be one of the explanation in reduction of deaths.
46

l 250000
200000
150000
100000
50000
0
2001
Trend for malaria in Gujarat 2001-2006
2002 2003 2004 2005
Numberof , Outbreaks : OR Deaths
2006
•MALARIA CASE -+-Number of Outbreaks -a- Malaria Deaths
Data Source: NVBDCP, Gujarat (Table given in ANNEX)
Interpretation
Gujarat state faced a major epidemic of malaria in 2003 (Valsad) & 2004 (Kheda).
Excluding the two epidemic years, as compared to year 2001 & 2002 when there was no
weekly reporting system (paper reporting was done on monthly basis), the case detection
rate had increased from year 2005 onwards. This can be attributed to the weekly
reporting system followed in IDSP and seasonal weekly reporting by NVBDCP. (Note:
since Jan 2007, the NVBDCP was also reporting o:ri a weekly basis through out the year).
47

Graph 5: Malaria trend in studied districts
35000
30000
25000
20000
15000
10000
5000
0
Interpretation:
Malaria trend in studied districts 2001-06
7
6
5
4
3
2
1
_.::::::=~n~e-...L 0
2001 2002 2003 ' 2004 2005
Ill Malaria Case ---outbreak ~Death
In studied districts also we can notice the same trend of increase in case detection and
decrease in deaths after implementation ofiDSP.
48

6. CONCLUSION & RECOMMENDATION This evaluation revealed a number of areas in which the integrated disease surveillance
project was performing well, and identified a few areas that required strengthening. This
section summarizes the strengths and challenges of IDSP in the two districts and
discusses recommendations to strengthen IDSP.
6.1 Strengths
• There was a well established infrastructure for surveillance system in all districts
which provided electronic data reporting on a weekly basis. (Received award for
innovation).
• Surveillance data showed a definite increase in trend in case and outbreak detection
and decrease in deaths which indicates favorable outcome for IDSP. The parallel pre
existing surveillance system of malaria also helped in managing the disease situation.
So activities related to controlling the outbreak (focal spraying, drug impregnated nets
distribution) were done with ease.
• Laboratory confinnation for malaria was consistently found at every level.
• Compliance of the system - Timeliness & completeness of the repmied data was good
(89% and 98% respectively) at the rural reporting units.
• The routine weekly analysis of data at state and district level was found to be
consistent and of the desirable standards. This was followed by regular feedback &
supervision to concerned units.
• Specifically assigned Rapid Response Teams along with allocation of funds up to
taluka level ensured the epidemic preparedness of the system.
• Attitude & satisfaction ofhealth staff regarding IDSP was found fairly high which is a
good sign for the future of the project.
49

6.2 Challenges
• Reporting systems were weak in terms of data documentation and the data were not
recorded in a standard way in 55% of health facilities visited. Though medical officers
had the IDSP manual and knowledge about the case defmition, the data were not
recorded in a standard way (without IDSP stamp) which allows room for error. In
addition a number of uncommon abbreviations were found in Out Patient registers
which can lead to incorrect tallying of data.
• The involvement of private sector is still minimal (3%) and the strategies of involving
them were not shown by any district studied. The private sector was not trained in
IDSP and no incentives were made to involve them.
• Compliance of the urban sector in reporting was low.
• Documentation of Outbreaks. For malaria there was a poor inter departmental
information sharing particularly for outbreaks related morbidity and mortality. The
data were also not properly documented.
• The written case management protocol for epidemic situation was not found at any
health facility studied.
• Use of GIS was still not up to the desirable standards. The geographic base maps and
village wise data can enhance the quality of surveillance. The data operators were not
provided on the job training regarding data management at state and district level.
Limitations of the study
• Laboratory functioning was checked for only one disease (Malaria)
• In the absence of any outbreak during study period, all component of Outbreak
management were not examined.
50
6.3 Table of conclusion & recommendations
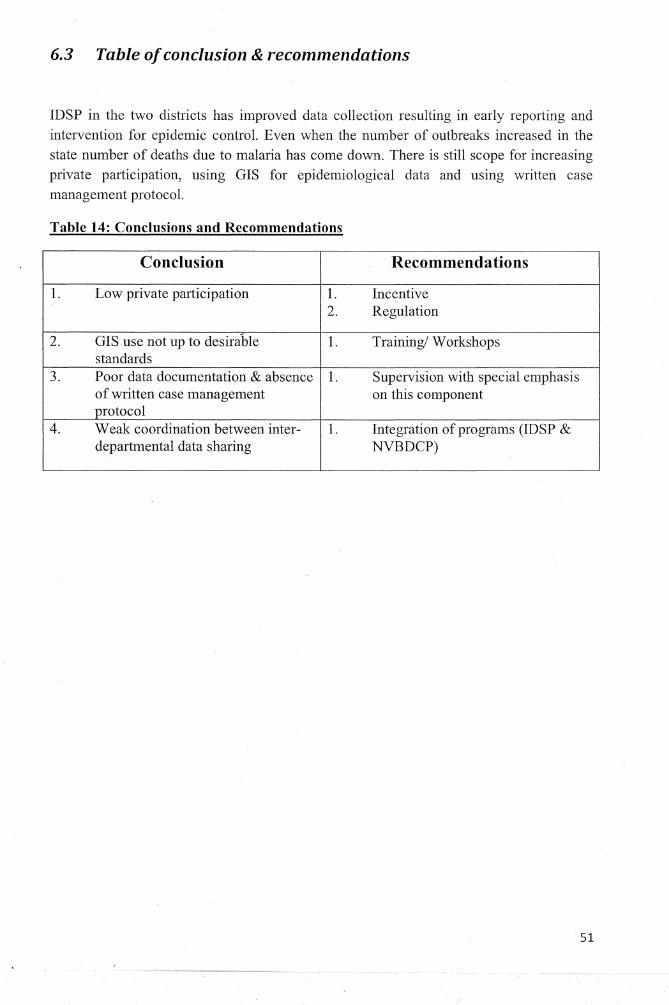
IDSP in the two districts has improved data collection resulting in early reporting and intervention for epidemic control. Even when the number of outbreaks increased in the state number of deaths due to malaria has come down. There is still scope for increasing private participation, using GIS for epidemiological data and using written case management protocol.
Table 14: Conclusions and Recommendations
Conclusion Recommendations
1. Low private participation 1. Incentive 2. Regulation
2. GIS use not up to desirable 1. Training/ Workshops standards
3. Poor data documentation & absence 1. Supervision with special emphasis of written case management on this component protocol
4. Weak coordination between inter- 1. Integration of programs (IDSP & departmental data sharing NVBDCP)
51

7 REFERENCES 1. Thacker SB,Berkelman RL. Public health surveillance in the United States. Epidemiol
Rev 1988; 10:164-90.
2. Alan D. Lopez, Colin D. Mathers, Majid Ezzati, Dean T. Jamison and Christopher J.
L. Murray. Global Burden of Disease and Risk Factors. 2006. World Bank and
Oxford University Press. Oxford University Press, 165 Madison Avenue, New York.
NY 10016
3. Colin D. Mathers, Dejan Loncar. Updated projections of global mortality and burden
of disease, 2002-2030: data sources, methods and results. Evidence and Information
for Policy World Health Organization. Revised November 2006.
http://www. who.int/healthinfo/statistics/bod projections2030 paper.pdf (accessed 18
Oct 2007).
4. K Srinath Reddy, Bela Shah, Cherian Varghese, Anbumani Ramadoss. Responding to
the threat of chronic diseases in India. Published online www.thelancet.com on
October 5, 2005 DOI:10.1016/S0140-6736(05)67343-6
5. World Bank. Project appraisal document on a proposed idea credit in the amount of
sdr 46.9 million (us$68.0 million equivalent) to the republic of India for an integrated
disease surveillance project. Report No: 25765-IN. June 7,2004
6. Roll back Malaria, World Health Organization and UNICEF. World Malaria Report
2005. http://rbm.who.int/wmr2005 (accessed 18 Oct 2007).
7. Eline Korenromp. Malaria incidence estimates at country level for the year 2004 -
proposed estimates and draft report. World Health Organization, Roll Back Malaria.
March 11 2005. Avenue Appia 20, CH-1211 Geneva 27, Switzerland.
52

T 8. Roll back Malaria, World Health Organization and UNICEF. Roll Back Malaria
Monitoring and Evaluation India, Generated: 4/28/2005 10:35:26AM.
www.rbm.who.int/wrnr2005/profiles/india.pdf. (accessed 18 Oct 2007).
9. T Jacob John, Reuben Samuei, Vinohar Balraj, Rohan John. Disease surveillance at
district level: a model for developing countries. Lancet 1998; 352:58-61.
10. Government of India. Integrated Disease Surveillance Project India: Project
Implementation Plan 2004-2009. Ministry of He~lth & Family Welfare, Department
ofhealth, Nirman Bhawan, New Delhi: 2003.
11. Gueye, Debbie, Kesheni P. Senkoro, and Susan F. Rumisha. Monitoring and
Evaluation of Integrated Disease Surveillance and Response in Tanzania, October
December 2003. Bethesda, MD: The Partners for Health Reformplus Project, Abt
Associates Inc. March 2005.
12. World Health Organization. Strengthening surveillance and response for epidemic
prone and vaccine-preventable diseases in selected African and Eastern
Mediterranean countries. Report of the UNFIP Final Project Evaluation in Burkina
Faso, Ghana, Guinea, Mali and southern Sudan. 2005.
13. Centre for Disease ControL Assessment of Infectious Disease Surveillance
Uganda, 2000. MMWR Weekly August 04, 2000 I 49(30); 687-691.
http://www .cdc.gov/mmwr/preview/mmwrhtmllmm4930a2.htm. (accessed 18 Oct
2007).
14. Guthne Birkhead, Terence L Chorba, Susan Root, Douglas N. Klaucke, and Nonna J.
Gibbs. Timeliness of National Reporting of Communicable Diseases: The Experience
of the Natiomil Electronic Telecommunications System for Surveillance. American
Journal ofPublic Health 1991; 81:1313-1315
53

15. World Health Organization. Assessment of the national communicable disease
surveillance and response system, Ethiopia. Weekly epidemiological record No. 2,
2001, 76, 9~16. http://www.who.int/wer. (Accessed 18 Oct 2007).
16. Dr Sathyanarayana. An Evaluation of Integrated Diseases Surveillance Project Bellary
Unit. Kama taka state, INDIA.
http://www.technet21.org/pdf file/KamatakaEvalSurv.pdf(accessed 18 Oct 2007)
17. Government of Gujarat. Integrated disease Surveillance Project Gujarat: Report of
Review Meeting-2nd Qtr. 2006. 141h -15th November 2006. Commissionerate of
Health, Medical Services & Medical Education E-Block, Civil Hospital Building
Sector-12.Gandhinagar, Gujarat.
18. Harshad Patel. Integrated Disease Surveillance Project: In Navsari District (Gujarat
State). December 2006. Available at document centre AMCHSS, SCTIMST,
Thiruvanthapuram.
19. Census of India. Office of Registrar General & Census Commissioner, India.
http://www.censusindia.gov.in/ (accessed 18 Oct 2007).
20. RHS Bulletin, ministry Of Health & F.W., Government Of India: March 2006
http://mohfw.nic.in/NRHM/State%20Files/gujarat.htm (accessed 18th Oct 2007)
21. Sample Registration System, Registrar General India. Volume 41 No 1. October 2006
vital statistics division, west block 1, wing 1, 2nd floor, R. K. Puram, new Delhi-
110066 ISSN 09713549
22. Government of India. 2005-2006 National Family Health Survey 3 Fact Sheet. New
Delhi 2007. http://mohfw.nic.in/factsheets%20pdf/GJ.pdf. (accessed 18 Oct 2007)
23. Government of India. Ministry of Health and Family Welfare. Report No. 3 of 2001
(Civi/)http://cag.nic.in/reports/civil/2001 book3/chapterl.pdf (accessed 18th Oct
2007)
54

24. Government of India. Malaria situation. National Vector Born Disease Control
Program 2007. http://www.nvbdcp. gov.in/Doc/Malaria%20Situation.pdf (Accessed
18th Oct 2007)
25. World Health Organization country office for India
http://www. whoindia.org/EN/Section3/Sectionl 08.htm (accessed 18th Oct 2007)
26. McNabb et al. Conceptual framework for public health surveillance and action and its
application m health sector reform. BMC Public Health, 2002, 2:2
http://www.biomedcentral.com/1471-2458/2/2 (accessed 18 Oct 2007).
27. World Health Organization. Communicable disease surveillance and response
systems. Guide to monitoring and evaluating. 2006.
http://www. who.int/csr/resources/publications/surveillance/WHO CDS EPR L YO 2
006 2.pdf. (accessed 180ct 2007).
28. World Health Organization. Protocol for the assessment of national communicable
disease surveillance and response systems (document WHO/CDS/CSR/ISR/2001.1) ~
and Protocol for the evaluation of epidemiological surveillance systems (document
WHO/EMC/DIS/97.2). These may be obtained on request from the CDS Information
Resource Centre, World Health Organization, 1211 Geneva 27, Switzerland; fax:+ 41
22 791 4285; email: [email protected].
29. World Health Organization. Communicable disease surveillance and response systems. Guide t~ monitoring and evaluating. http://www.who.int/csr/resotirc.es/publications/surveillance/WHO CDS EPR LYO 2 006 2/en/ (accessed 18 Oct 2008)
55

8. ANNEX 1- selected indicators
Type&
N Indicator Component purpose
Surveillanc Method Indicator of Value
0 definition & element e level indica to
r Evidence of
prioritizatio structure Document
Disease n of diseases Process/ YIN/ review, 1
prioritization for priority National
output N Kl surveillanc setting interview
e
Existence of
intersectrora
1
Intersectoral collaboratio
n, Structure National,
KI collaboration
networking interview, 2 net-working
and Networking & Process Y/N/U interrnediat
observatio and e peripheral
partnerships partnership n pminership
with other
sectors (
water,
NVBDCP)
Capacity for Existence of
sharing inter country
outbreak and cross- Structure
3 related border
Y/N/U National KI
infonnation Networking & Process
interview commu-between nication partnership
neighboring during
tenitory outbreak
Proportion
ofhGalth
Health facilities
facilities with
with standard
Core function National,
Observatio 4
standard case
case detection Input % Sub-
definitions national n
case for diseases
definitions to be
reported regularly
56

Existence of
a
mechanism
to capture
unusual or
public health
events from National,
Existence of non-routine 5 Core function intermediat KI
event based sources in Process Y/N/U surveillance the health
case detection e peripheral interview
system (e.g. community
from the
community,
media or
other
informal
sources)
Proportion
of health Core
6 Availability facilities
functions case Input % District, Observatio
of registers with registration
National n
standardized
registers
Proportion
Correct ofHFwith Core District Review of
7 filling of correctly functions case Process % National registers
registers filled registration
registers
Existence of
rumourlog
or database
for Core National
8 Existence of registration
functions case Input/
Y/N/U intermediat Observatio
rumour log of suspected registration
process e peripheral
n
public health . events from
informal
sources
57

Capacity to
confirm
selected
priority Core Kl
9 Confirmatio diseases
functions, National
interview, n of priority either within process Y/N/U intermediat
observatio diseases the
case e peripheral
laboratory or confinnation n
at a
reference laboratory
Presence of documented
list of Documented reference
Core National Kl
10 list of laboratories
functions case Input/
Y/N/U intermediat interview
reference for confirmation
process e peripheral
observatio laboratories confirmation n
of epidemic-prone
diseases
Proportion Kl
Laboratory of outbreaks Core National interview,
11 confirmation that are functions case Output % provincial document
of outbreaks laboratory confirmation district confirmed
rev1ew
Proportion
of
Surveillance surveillance
units having units with Core Kl
defined functions data National, Interview, 12 epidemic
epidemic analysis & Input %
sub-national observatio threshold
values threshold interpretation 11
values for
priority
diseases
58

Proportion
of public
health units Adequacy/ that
availability experienced Core Kl
13 of supplies shortage of
functions National interview and drugs drugs and
epidemic Output %
sub-national document for outbreak supplies for
preparedness rev1ew management the most and control recent
outbreak
(define the
time frame)
Proportion
Capacity for of outbreaks Core
responded to functions National Review of 14 outbreak
in the response & Output %
sub-national documents response
previous 12 control months
Proportion Kl
Feedback of feedback Core
National interview, 15
disseminated reports functions Output %
sub-national observatio disseminate feedback
d n
Proportion
of feedback KI
Feedback reports Core
National interview, 16
received received functions Output %
sub-national observatio from the feedback next high
n
level
Proportion
A vail ability of districts
that were Support Kl or reporting
not short of functions District
interview, 17 forms at
reporting standard & Input % provincial
observatio district national levels
forms in the guidelines n previous 6
months
Proportion Availability of
KI 18
of training surveillance Support National, interview,
manuals units with functions Input % sub-national observatio
modules for surveillance training surveillance training
n
I manuals
59

Proportion
Staff trained of
Support KI
surveillance National, interview, 19 on function Input %
staff trained sub-national document surveillance
in training
review surveillance
Proportion of
surveillance
A vail ability units with Support
KI ofcommu-
functional functions National interview
20 nication
commu- supervision Input % sub-national observatio
facilities nication commu-
facilities for nication n
immediate, weekly,
reporting
Proportion of
Availability surveillance
KI units with Support
of National interview, 21
functioning functional function Input %
sub-national observatio computers finance
computers for
n
surveillance purpose
Proportion of
Timeliness surveillance Quality/ of units that outputs of
22 submission submitted surveillance
Output % National Review of
of surveillance systems sub-national reports surveillance repots to the Timeliness
reports next higher level on
time
Proportion Quality/output
of Completenes surveillance
s of 23 surveillance National Review of
s of data reports with Output % systems sub-national reports
reported no missing completeness
required information
60

' I
24
25
26
Usefulness of
surveillance data
Simplicity of
the surveillance
Flexibility/ adaptability
of the surveillance
system
Rating or the
usefulness of the
surveillance system (for
case
detection, planning, priority
setting &
intervention
s
Rating of the
simplicity of
the surveillance system( in terms of
data collection,
compilation, reporting
analysis and utilization )
by implementer sand users
of the system
Rating of the
ability of the surveillance
system to adapt to changing
needs, as perceived
by the national
health managers
and evaluators
Quality/ outputs of
surveillance
systems Usefulness, Scale National KI simplicity,
Outcome sub-national 1-5 interview
flexibility, sensitivity,
acceptability
Quality/ outputs of
Scale National KI surveillance Outcome
1-5 sub-national interview systems
Quality/ outputs of
surveillance Outcome Scale National KI
systems 1-5 sub-national interview
61

Rating of Quality/
the outputs of
sensitivity of surveillance
Sensitivity systems 27 of outbreak
the Usefulness, Scale National Kl
detection surveillance
simplicity, Outcome
1-5 sub-national interview system to detect
flexibility,
outbreaks sensitivity,
acceptability
Rating of the Quality/
acceptability outputs of Acceptabilit of surveillance
y the systems
28 of the surveillance Usefulness, Outcome
Scale National Kl surveillance system by simplicity, 1-5 sub-national interview
system users flexibility, and sensitivity,
implementer acceptability s
Rating of the
Reliability reliability of
Quality/ the
of surveillance
outputs of
29 surveillance datal
surveillance Outcome
Scale National Kl data
reports by systems 1-5 sub-national interview
reports implementer
reliability
sand users of the
system
62
~ -~~---~~~--

l I
NUMBER
6 25 16 8 1 5 9 18 11 13 14 10 22 19 23 24 7 2 20 15 3 4 12 17 21
ANNEX2
SELECTION OF TWO DISTRICTS.
AVERAGE RANK
DISTRICT SFRFOR
OF LAST6
AVGSFR YEARS
Mehsana 0.0352 1 Porbandar 0.0591 2
Valsad 0.0689 3 Banaskantha 0.0700 4
Ahmedabad 0.0779 5 Gandhinagar 0.1063 6 Sabarkantha 0.1094 7 Dang 0.1345 8 Godhara 0.2106 9 Bharuch 0.2302 10 Narmada 0.2452 11 Vadodara 0.2586 12 Bhavnagar 0.2607 13 Rajkot 0.2719 14 Amreli 0.2747 15 Junagdh 0.2866 16 Patan 0.3030 17 Kheda 0.3214 18 Jamnagar 0.3480 19 Surat 0.3950 20 Anand 0.4732 21 Surendranagar 0.6849 22
Dahod 0.8079 23 Navsari 0.8240 24
Kutch 1.1488 25
TWO GROUP OF AVGSFR
1 1 1 1 1 1 1 1 1 1 1 1 2 2 2 2 2 2 2 2 2 2 2 2 2
RANDOM SELCTIONOF THE DISTRICT FROM EACH GROUP
63

..
.·1··'
I t-
l ANNEX3
Semi structured questionnaire & observation check list guideline for data collection
Integrated Disease Surveillance Project (IDSP) in Gujarat: An Evaluation with particular reference to Malaria
Achutha Menon Centre for Health Science Studies,
Sree Chitra Tirunal Institute for Medical Science and Technology,
Thiruvananthapuram, Kerala. 695011
Informed written consent:-
I am Dr. Amar Shah, Master of Public Health (MPH) student in Sree Chitra Tirunal
Institute for Medical Sciences and Technology, as a part of study conducting study on the
facilities that are involved with IDSP project within Gujarat state. In this I am trying to
evaluate the IDSP performance in various districts. As a part of the sampling procedure,
this health facility also has been included in my study. I would like to ask you some
questions regarding IDSP functioning, which will take 15-20 minutes time. I have taken
permission from the identified higher officials including the Health Commissioner
Gujarat for this interview. Your identity and the identity of this health facility will not be
mentioned anywhere and the information given by you will be kept confidential and will
be used for research purposes only. There is no direct benefit to you but results of this
study can benefit the project and thus community. Participation in this study is purely on
voluntary basis. You can refuse any specific question or decline to answer the interview
as a whole.
My guide Dr. K.R. Thankappan at Achutha Menon Centre, Thiruvananthapuram, Kerala)
is available to answer any questions about this, should you have any doubts. His address
& phone number is as follows.
64

l I t Address: Achutha Menon Centre for Health Science Studies, Sree Chitra Tirunal Institute
for Medical Science & Technology, Thiruvananthapuram. Kerala. 695011
Phone: 0471-2524231.
As part of routine procedure it is necessary for me to obtain written informed consent
from the participants in my study as well. If you decide to participate please do sign this
document in the space below. You can also signify your consent orally ifyou chose to.
Is the participant willing to sign? yes 1, no 2.
Signature of the participant:
Signature of the witness (in case of oral consent):
Signature of the interviewer:
Date: Health facility code: District code: no: category:
65

Type and code ofhealth care facility: SUB CENTRE c=J
Designation & code of the interviewed person: MULTI PURPOSE HEALTH WORKER c=J
1. Observe for availability of registers
• Syndromic surveillance register for HW
Yes o Noo not maintained for last two weeks o
2. Proceedings with suspected malaria case
• How will you classifY the patient with fever? Answer given satisfactorily: Yes o Noo
3. At which threshold of fever cases will you take trigger 1 action? Answer given satisfactorily: Yes o Noo
4. Approximately how many times reporting forms (FORMS) were not available on time in last six months?
Answer: I I
5. Capacity to collect blood specimen. Slides and ink medium available? Yes o Noo
6. Do you receive feed back every week? Yes o Noo
7. How many fever cases have you registered last week? Answer: --
8. How many times have you been supervised in last 3 months? without observation o D with observationo
9. Have you received training regarding IDSP? Yes o Noo
For the following questions rate your opinion
1 =least and 5 =maximum
10. How do you rate the usefulness of the IDSP (for case detection)? 1 = not at all useful 5= extremely useful
1 2 3 4 5
11. How do you rate the simplicity of the IDSP (in terms of data collection, compilation, reporting, analysis &
1 2 3 4 5 utilization)? 1 =not at all simple 5= extremely simple
66

12. How do you rate the adaptability of the IDSP (to adapt changing needs)? 1 =not at all adaptive to situation 5= extremely adaptive to situation
13. How do you rate the sensitivity of the IDSP to detect outbreak? For example how many cases of Malaria would IDSP detect out of total Malaria cases in your area? 1 = not at all sensitive 5= extremely sensitive
1 2 3 4 5
1 2 3 4 5
14. Overall usefulness of the IDSP Yes o Noo
15. Observe for the correct filling of registers. Not done o Done o ( Check from the register for the Syndromic surveillance, pick any one data which is registered as malaria last week, take address and visit the place and confirm it.)
Does it match with the register: Entry correct o entry incorrect o
67

Type & code of health care facility: PHC, CHC D
Designation & code of the interviewed person: MO, RMO D
1. Observe for availability of registers
• OP/IP register for presumptive surveillance Yes o Noo not maintained for last two weeks o
• rumor register Noo Yes o not maintained for last two weeks o
2. Standard case defmition
• Manual present Yes o Noo
• What do you consider as a case of malaria? Answer given satisfactorily: Yes o Noo
• When do you consider malaria as an epidemic in your area? Answer given satisfactorily: Yes o Noo
3. Observe for use of IDSP stamp on a case paper for every suspected malaria case (check for last 3 days OPD paper)
not usingo · using but inconsistento using consistentlyo
4. Observe the availability of diagnostic material for malaria. Is it present? Yes o Noo
5. Approximately how many times reporting forms (form P) were not available on time in last six months?
Answer: I I
6. Perform trend analysis? Yes o Noo comment:
7. Existence of a written case management protocol for malaria epidemic Yes o Noo
8. Do you disseminate the report every week? Yes o Noo
9. Do you receive feed back every week? Yes o Noo
10. Have you been supervised in last 3 months? How many times? Noo Yes , without observation o Yes , with observation o
11. Training received Yes o Noo
12. Observe for communication facility appropriate for that facility.
68

Yes o Noo comment:
For the following questions rate your opinion
1 =least and 5 =maximum
13. How do you rate the usefulness of the IDSP (for case detection, planning, priority setting & intervention)?
1 2 3 4 5 1 = not at all useful 5= extremely useful
14. How do you rate the simplicity of the IDSP (in terms of data collection, compilation, reporting, analysis &
1 2 3 4 5 utilization)? 1 =not at all simple 5= extremely simple
15. How do you rate the adaptability of the IDSP (to adapt changing needs)? 1 =not at all adaptive to situation 5=
1 2 3 4 5 extremely adaptive to situation
16. How do you rate the sensitivity of the IDSP to detect outbreak? For example how many cases of Malaria
1 2 3 4 5 would IDSP detect out of total Malaria cases in your area? 1 =not at all sensitive 5= extremely sensitive
17. How much you rely on the data generated by IDSP? 1 = not at all reliable 5= extremely reliable
1 2 3 4 5
18. Overall satisfaction with IDSP Yes o Noo
19. Cross checking for last two weeks positive cases Not done o Doneo
Entry correct o entry incorrect o
69

Type and code of health care facility: PHC D
Designation & code of the interviewed person: LAB TECHNICIAN D 1. Observe for availability of registers
• Malaria register Yes o Noo
2. Standard case definition Proceedings with suspected case of malaria?
Answer given satisfactorily: Yes o Noo
3. Approximately how many times reporting forms (form Ll) were short of time in last six months?
Answer: I I
4. Knowledge of reference laboratories. Yes o Noo
5. Diagnosis of malaria within a week Noo Yes without observation o Yes with observation o
6. Do you disseminate the report every week? Yes o Noo
7. Do you receive feed back every week? Yes o Noo
8. Have you received training regarding IDSP? Yes o Noo
For the following questions rate your opinion
1 =least and 5 =maximum
9. How do you rate the usefulness of the IDSP (for case detection, planning, priority setting & intervention)?
1 2 3 4 5 1 = not at all useful 5= extremely useful
10. How do you rate the simplicity of the IDSP (in terms of data collection, compilation, reporting, analysis &
1 2 3 4 5 utilization)? 1 =not at all simple 5= extremely simple
11. How do you rate the adaptability of the IDSP (to adapt changing needs)? 1 = not at all adaptive to situation 5=
1 2 3 4 5 extremely adaptive to situation
70

i f-~
' I 12. How do you rate the sensitivity of the IDSP to detect
outbreak? For example how many cases of Malaria 1 2 3 4 5 would IDSP detect out of total Malaria cases in your
area? 1= not at all sensitive 5= extremely sensitive
13. Overall satisfaction with IDSP Yes o Noo
71

Type & Code of health care facility: D
Designation & code of the interviewed person: BHO, DSO, CDHO D
1. Capacity to transport specimen to higher laboratory Yes o Noo
2. Approximately how many times reporting forms were short of time in last six months?
Answer: I I
3. Performing trend analysis Noo Yes , without observation o Yes , with observation o
4. Taluka rapid response team assigned? Yes o Noo
5. When do you consider malaria as an epidemic in your area? Answer given satisfactorily: Yes o Noo
6. Proceedings with malaria epidemic. Answer given satisfactorily: Yes o Noo
7. Do you disseminate the report every week? Yes o Noo
8. Do you receive feed back every week? Yeso Noo
9. How many supervisory visits made in last 3 months? D without observation o with observation o
10. Have you received training regarding IDSP? Yeso Noo
11. Observe for presence of a documented list of reference laboratories. Yes o Noo
12. Observe for communication facility appropriate for that facility. Yes o Noo
For the following questions rate your opinion
1 =least and 5 =maximum
13. How do you rate the usefulness of the IDSP (for case detection, planning, priority setting & intervention)?
1 2 3 4 5 1 = not at all useful 5= extremely useful
72

i .f-.
' I 14. How do you rate the simplicity of the IDSP (in terms
of data collection, compilation, reporting, analysis & 1 2 3 4 5 utilization)? 1 =not at all simple 5= extremely simple
15. How do you rate the adaptability of the IDSP (to adapt changing needs)? 1 =not at all adaptive to situation 5=
1 2 3 4 5 extremely adaptive to situation
16. How do you rate the sensitivity of the IDSP to detect outbreak? For example how many cases of Malaria
1 2 3 4 5 would IDSP detect out of total Malaria cases in your area? 1 =not at all sensitive 5= extremely sensitive
17. How much you rely on the data generated by IDSP? 1 = not at all reliable 5= extremely reliable
1 2 3 4 5
18. Overall satisfaction with IDSP Yes o Noo
73

J I ' I
Type & Code of health care facility: D
Designation & code of the interviewed person: state IDSP nodal officer D
1. Do you have standard case definition & epidemic threshold protocol? Yes o Noo
2. Approximately how many times reporting forms were short of time in last six months?
Answer: I I
3. Performing trend analysis Noo Yes , without observation o Yes , with observation o
4. State & district level rapid response team (RRT) assigned? Yes o Noo
5. Do you disseminate the report every week? Yes o Noo
6. Do you receive feed back every week? Yes o Noo
7. How many supervisory visits made in last 3 months? D without observation o with observation o
8. Have you received training regarding IDSP? Yes o Noo
9. GIS used in IDSP Yes o Noo
10. Base maps available for administrative part Yes o Noo
11. Base maps available for geographic part Yes o Noo
12. Geo referenced village database Yes o Noo
13. Data entry operator trained for IDSP GIS? Yes o Noo
14. GIS software information. Which version Comment:
15. Number of sites need to be connected through IT network EDUSAT/GASW AN I I
16. Number of sites ~urrently connected through IT network LJ 17. Frequency of usage of IT network in a month l J 18. Observe for communication facility appropriate for that facility.
74

l.·' ,-
i 4-·
' I I Yes o Noo
For the following questions rate your opinion
1 =least and 5 =maximum
19. How do you rate the usefulness of the IDSP (for case detection, planning, priority setting & intervention)? 1 = not at all useful 5= extremely useful
20. How do you rate the simplicity of the IDSP (in terms of data collection, compilation, reporting, analysis & utilization)? 1 =not at all simple 5= extremely simple
21. How do you rate the adaptability of the IDSP (to adapt changing needs)? 1 = not at all adaptive to situation 5= extremely adaptive to situation
22. How do you rate the sensitivity of the IDSP to detect outbreak? For example how many cases of Malaria would IDSP detect out of total Malaria cases in your area? 1= not at all sensitive 5= extremely sensitive
23. How much you rely on the data generated by IDSP? 1= not at all reliable 5= extremely reliable
24. Overall satisfaction with IDSP
25. Central coordination
1 2 3 4 5
1 2 3 4 5
1 2 3 4 5
1 2 3 4 5
1 2 3 4 5
Yes o Noo
Yes o Noo
75

l l ' I
ANNEX4
In-depth interview with Key informant
Integrated Disease Surveillance Project (IDSP) in Gujarat: An Evaluation with particular reference to Malaria
Achutha Menon Centre for Health Science Studies,
Sree Chitra Tirunal Institute for Medical Sciences and Technology,
Thiruvananthapuram, Kerala. 695011
Informed consent:-
As you have already answered the some questions now I would like to ask you more
about your opinions regarding the functioning of IDSP. There is no right or wrong
answers here; I am interested in your opinions only. It will take further 15-20 minutes. In
case my notes are incomplete or I need some clarification, I may contact you. Are you
willing to continue with the interview?
Yes D NoD
76

GUIDELINES FOR IN-DEPTH INTERVIEW
Informants/ Participants:
1. IDSP state nodal officer
2. Chief District Health Officer
Guidelines
1. What is your role in the project (IDSP)? 2. Where did you see the biggest problems in the implementation of IDSP? 3. How do you judge the coordination of the surveillance (the role of the
coordination body)? 4. In your opinion, what do you consider to be the most important successes in the
last three years in disease surveillance and response? 5. What explains them? 6. What would you recommend that this country's most important priority should be
for improving IDSP now? If aware of the project and involved:
7. What are the strengths and weaknesses of the project that you can identify? 8. Which are the experiences you would wish to share? 9. Your view about existence of intersectoral collaboration with other sectors like
NVBDCP, water supply. 10. Your view about existence of inter-state communication during outbreaks. 11. Can you give examples where the project builds on experiences of polio or other
successful initiatives? l2. What are the potential areas for success beyond original plans? 13. Are there any unexpected outcomes of the project that you are aware of? 14. What strategies have been implemented for involvement of private sector? • Strategic alliance through professional association (IMA, lAP) • Recognition & partnership • Providing linkages through web or fax or courier or telephone. 15. What are the views of the targeted beneficiaries with regard to the project? 16. From above discussion points how do you judge the implementation of the
integrated disease surveillance system? · . 17. Who else should I talk to who could give me some information on this issue?
77

l I I
' I Informants/ Participants:
• District surveillance officer • Medical Officer
Guidelines
1. What is your role in the project (IDSP)?
2. Does the inclusion of Malaria in the IDSP have made any difference in the disease reporting? If yes how?
3. How adequate do you think is the reporting, and why?
4. What do you believe can or should be done to ensure more complete reporting in IDSP?
5. Is there existence of a mechanism to capture unusual fever cases from non-routine source? (E.g. community, other informal source)
6. What do you think about the attitude amongst the healthcare worker about IDSP? What measure will you take to improve their attitude?
Informants/ Participants:
1. health worker Guidelines
1. What is your role in the project (IDSP)?
2. Does the inclusion of Malaria in the IDSP have made any difference in the disease reporting? If yes how?
3. The feed back that are you getting from the higher IDSP level? How do you feel about it, is it positive or negative feed back?
78

i • I
ANNEXS
Integrated Disease Surveillance Project (IDSP) in Gujarat: An Evaluation with particular reference to Malaria
Achutha Menon Centre for Health Science Studies,
Sree Chitra Tirunal Institute for Medical Sciences and Technology,
Thiruvananthapuram, Kerala. 695011
Document review & IDSP reports & data by NVBDCP
1. Evidence of prioritization of the diseases for surveillance
2. Number of outbreaks responded to in the previous 12 months.
3. Proportion of staff trained in IDSP (details of each category staff)
4. Availability of materials (computers, training modules)
5. Availability of financial resources
6. Timeliness of submission of surveillance reports.
7. Completeness of data reported.
8. Pre & post IDSP malaria deaths in selected district (NVBDCP)
9. Pre & post IDSP trend of malaria disease in selected district.
10. Case study: Comparison between date of investigation for suspected malaria
outbreak pre & post IDSP & correlating it with (SPR) slide positivity rate (data
source NVBDCP reports, IDSP reports & outbreak investigation report)
11. Village wise 'focal spraying' report for both districts.
79

ANNEX 8 OPINION REGARDING IDSP
OPINION REGARDINGIDSP OV£R:All.
PAI!ii.Mrnl Wiffiii.HESS SINPUCITY ADAPIAIHUI'\1' (N = SO) StNSHIVliV REUABIUTV {N = 19) SlillSFACllCm
1 1 3 4 5 1 1 3 4 5 1 1 3 4 5 1 1 3 4 5 1 2 3 4 5 NO YES Med'Ka!O!iflttr (!4;~ 0 0 3 14 3 0 0 5 5 10 3 0 3 7 5 0 0 9 8 3 0 0 7 5 8 0 10 l!iiOD!OOHll~ 0 0 0 4 4 0 0 0 1 6 0 0 0 6 1 0 1 2 2 2 0 0 4 4 0 0 8 WlR'IINI(JAlil~ 0 0 0 .u 5 II 0 7 9 0 0 0 4 l1 0 0 0 5 u 0 NA NA tiA HA NA 3 13 llfAI.'ffivtmm~N~ 0 0 0 1 6 0 l 1 3 2 0 2 2 1 1 0 0 1 1 4 NA NA NA NA WI 0 7 5Jii.T£W OffiC£I (:1) 0 tJ II 0 1 0 0 1 II 0 0 0 1 0 0 0 0 1 0 0 0 0 0 1 0 II 1 Wi!AI.(N=~ II 0 3 30 19 0 1 14 19 lS 3 2 Ill 26 9 0 1 19 :n 9 0 0 11 10 8 3 49 m!COO:MiE 0 0 6 S8 31 0 1 11 37 35 6 4 10 Sl Ul 0 4 37 42 17 0 II 38 34 1'8 6 94
PAJW.IB:al U:SffiJLNESS SIMPUCIT¥ ADAPIABUID (N =SO) SENS.JHVU¥ R:EUABIUTY (N = 1'9) W.LSAI!SfM: PERCE~i~Mil 0 II 6 S8 31 0 2 n 37 35 6 4 10 52 13 0 4 37 42 17 0 0 38 34 1'8 6 94
SCAlf l=LOWIEST 5 =HIGHEST PIIIIMIIB Kill! Kille Kale Kille~ Kale5 WfULMESS~~ 0 0 6 58 37 SII'IIOOrl'j~ 0 1: 21 .37 35 Anflll'lltllllll'f(lo'IO] 6 4 20 52 18 5EIMI\IllY ~~ 0 4 37 42 11 mJPW~;Y!N=l!}j 0 0 .38 .34 1'8
~-. ~ --~----
82

ANNEX 9: Outbreaks in Guiarat State
year 2001 year 2002 year 2003 type of outbrea cas de at outbrea de at outbrea
death disease k h k
case h k
case e
cholera 9 33 0 5 66 2 6 64 2
dia-vorniting 140 215 87 60 1357 34 77 1161 56 4 jaundice 25 578 5 11 139 2 6 131 1 typhoid 5 55 0 7 118 0 3 53 0
food 41 128 23 40 1109 19 43 1450 20
pmsomng 4 year 2004 year 2005 year 2006
,,
type of outbrea de at outbrea outbr cas cas death death
disease k h k eak case
e e cholera 4 26 0 33 73 2 34 95 2
dia-vomiting 42 790 14 86 290 36 67 391 19 7 0
jaundice 18 120 6 48 788 20 44 409 7 9 2 0 typhoid 4 189 0 4 446 0 10 243 0
food 37 104 6 33 145 20
pmsonmg 6 0 Source: State Epidemic Cell, Gandhinagar.
83

ANNEX tO
diseases case/death 2001-2006 Gujarat state trend
lAR 2001 2001 2002 2002 2003 2003 2004 2004 2005 2005 2006 2006
' death death death death death death case case case case case case ;
tro-enteritis 46406 Ill 44564 41 54031 74 64660 30 91289 40 165684 30
l hepatitis 5881 33 5256 23 5470 17 9233 28 15557 28 14252 188
,ric fever 3358 2 3903 2 4742 0 5502 0 5551 1 13198 0
Hera 109 0 60 2 101 3 65 0 84 1 100 2
aria 84459 19 82966 17 130744 65 222807 89 177936 54 92620 41
Source: State Epidemic Branch & NVBDCP. Gandhinagar
84