Non-Communicable Diseases Control Program _________________________________ K R Thankappan MD, MPH...
32
Non-Communicable Diseases Control Program ____________________________ _____ K R Thankappan MD, MPH Additional Professor and Head Achutha Menon Centre for Health Science Studies Sree Chitra Tirunal Institute for Medical Sciences and Technology, Trivandrum
-
Upload
helena-washington -
Category
Documents
-
view
217 -
download
1
Transcript of Non-Communicable Diseases Control Program _________________________________ K R Thankappan MD, MPH...
Non-Communicable Diseases Control Program
_________________________________
K R Thankappan MD, MPH Additional Professor and Head
Achutha Menon Centre for Health Science StudiesSree Chitra Tirunal Institute for Medical Sciences and
Technology, Trivandrum
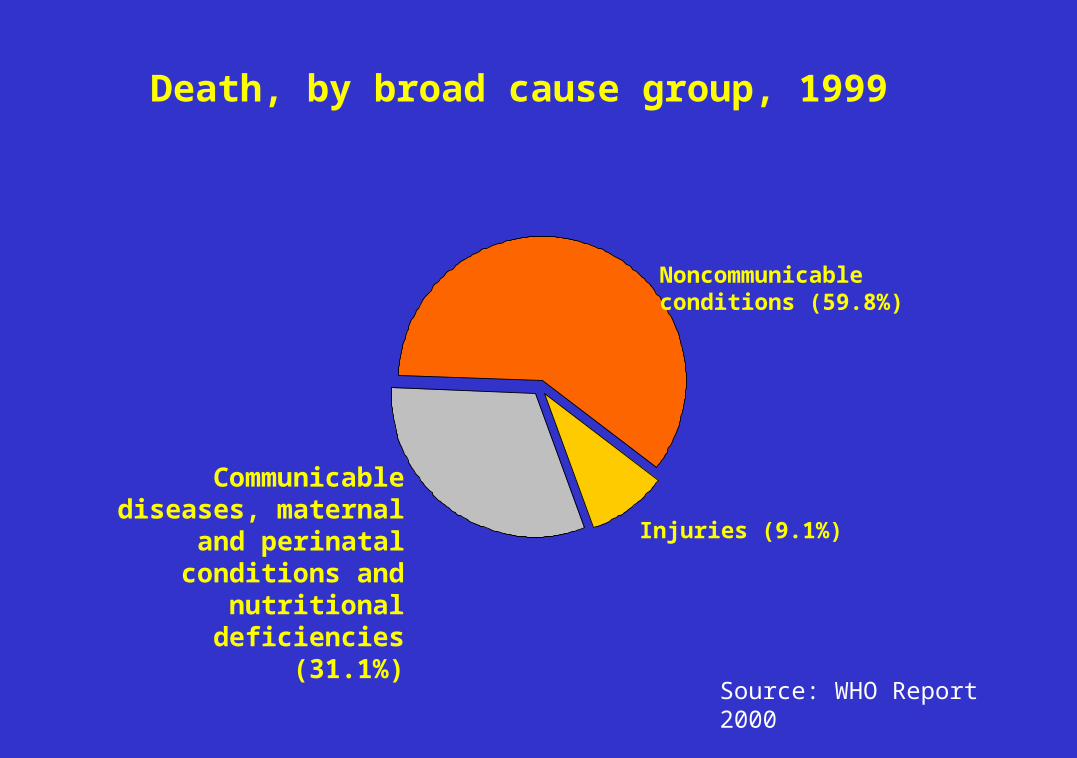
Injuries (9.1%)
Noncommunicableconditions (59.8%)
Death, by broad cause group, 1999
Communicable diseases, maternal and perinatal
conditions and nutritional deficiencies (31.1%)
Source: WHO Report 2000
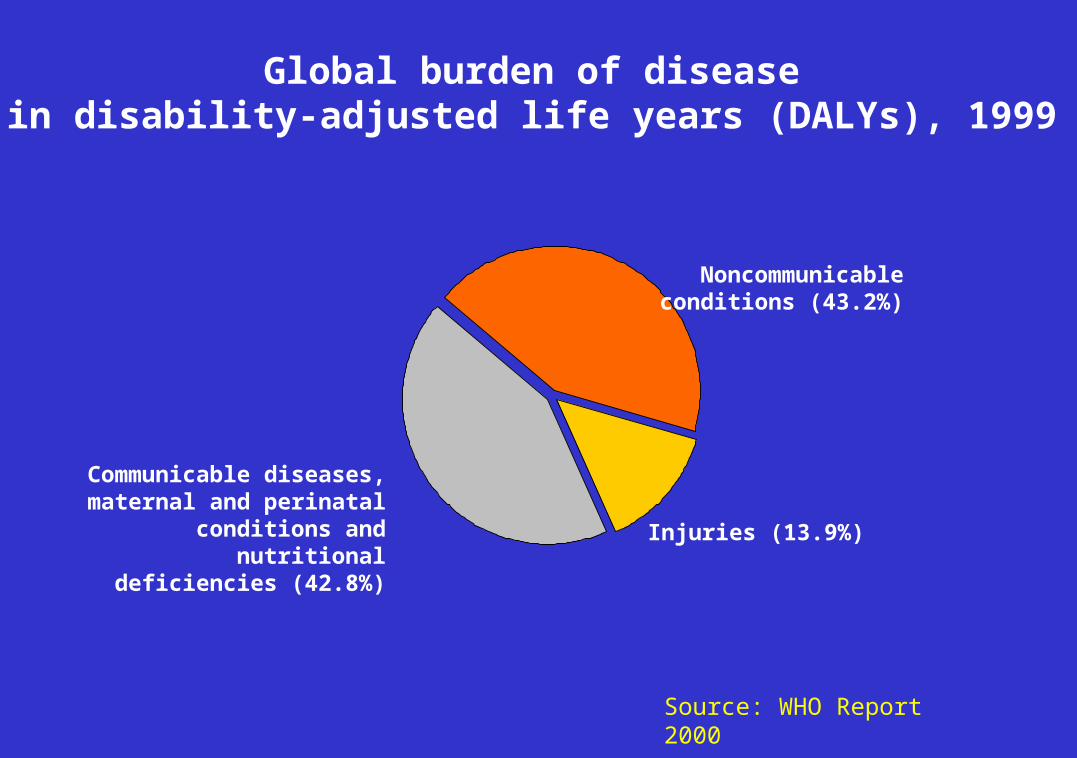
Injuries (13.9%)
Noncommunicableconditions (43.2%)
Global burden of diseasein disability-adjusted life years (DALYs), 1999
Communicable diseases, maternal and perinatal
conditions and nutritional deficiencies (42.8%)
Source: WHO Report 2000
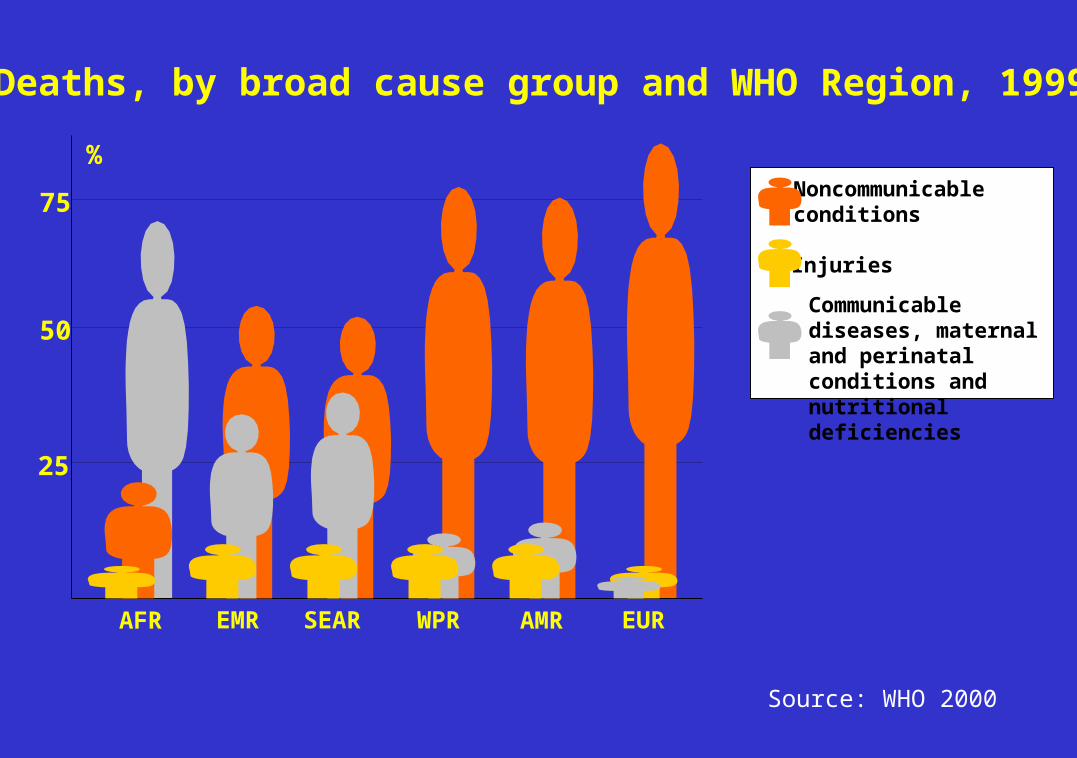
Deaths, by broad cause group and WHO Region, 1999
AFR EMR EURSEAR WPR AMR
25
50
75
%
Communicable diseases, maternal and perinatal conditions and nutritional deficiencies
Noncommunicableconditions
Injuries
Source: WHO 2000
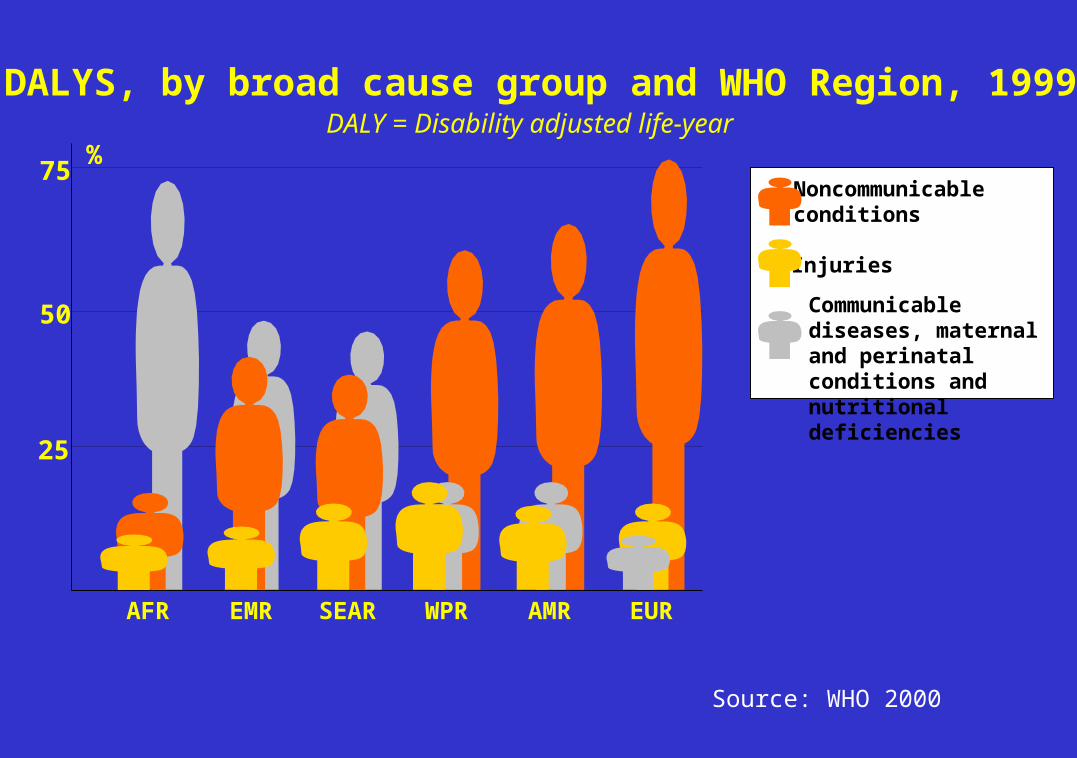
DALYS, by broad cause group and WHO Region, 1999
AFR EMR EURSEAR WPR AMR
DALY = Disability adjusted life-year
Communicable diseases, maternal and perinatal conditions and nutritional deficiencies
Noncommunicableconditions
Injuries
25
50
75%
Source: WHO 2000
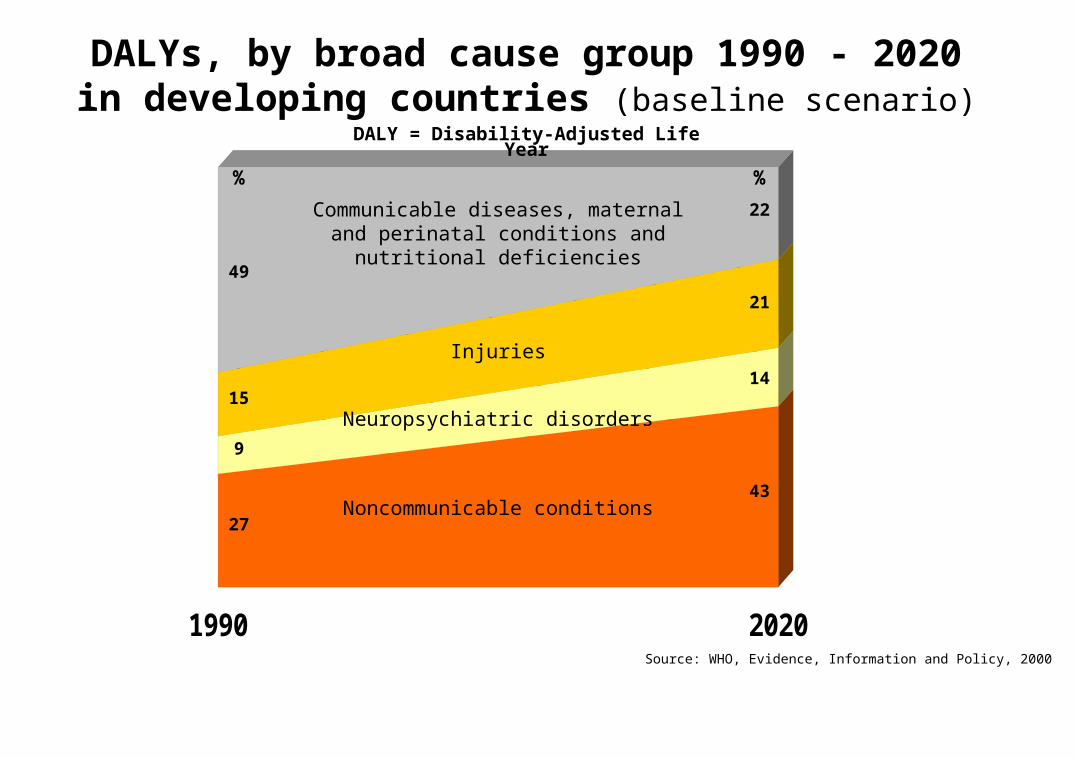
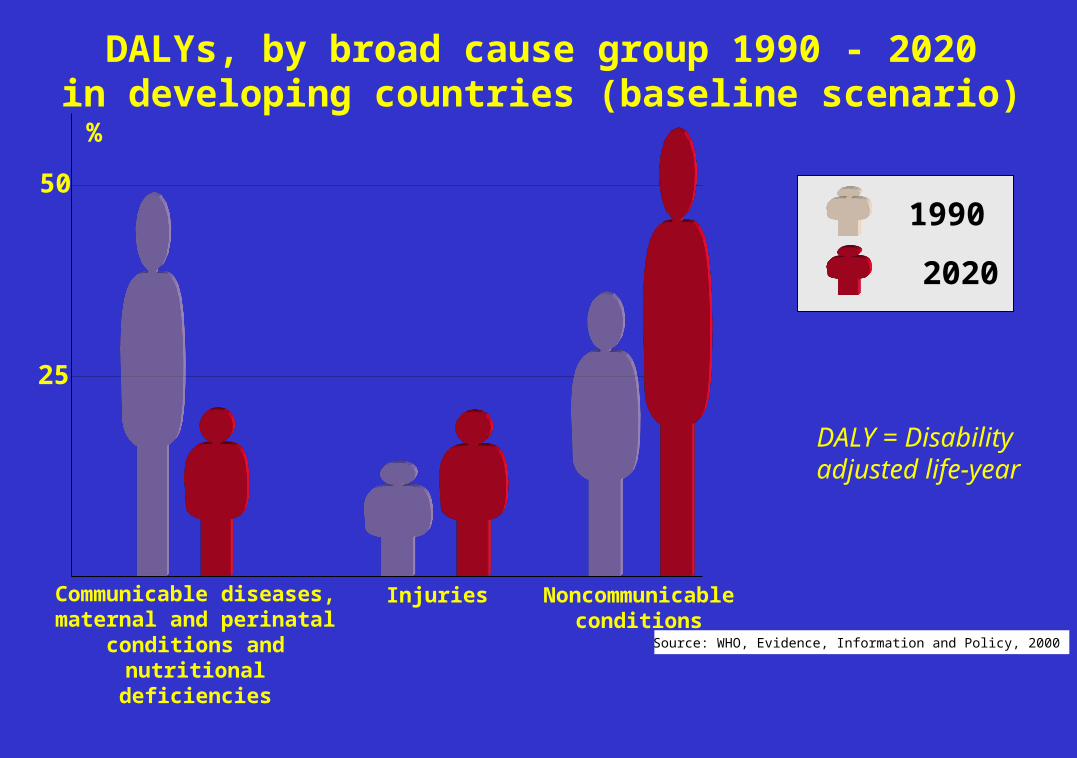
Source: WHO, Evidence, Information and Policy, 2000
1990 2020
DALY = Disability-Adjusted Life Year
Communicable diseases, maternal and perinatal conditions and nutritional
deficiencies
Noncommunicable conditions
Neuropsychiatric disorders
Injuries
43
14
22
21
49
27
15
9
% %
DALYs, by broad cause group 1990 - 2020in developing countries (baseline scenario)
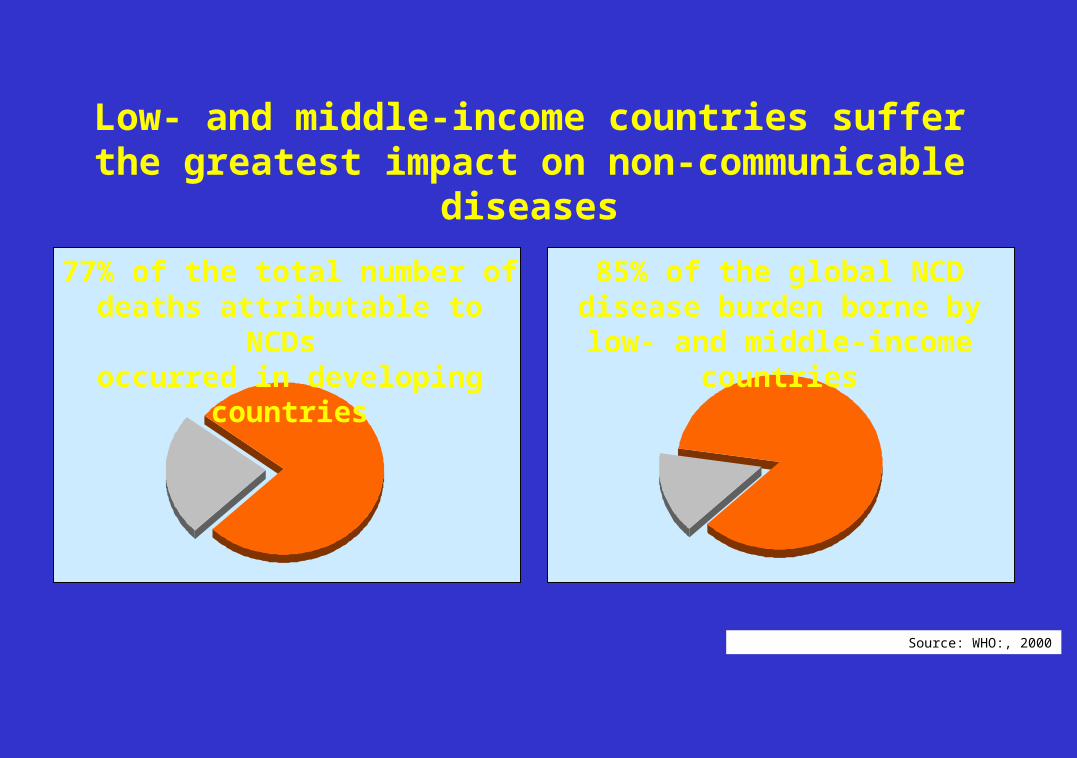
Low- and middle-income countries suffer the greatest impact on non-communicable diseases
77% of the total number of deaths attributable to NCDs
occurred in developing countries
85% of the global NCD disease burden borne by low- and middle-income countries
Source: WHO:, 2000
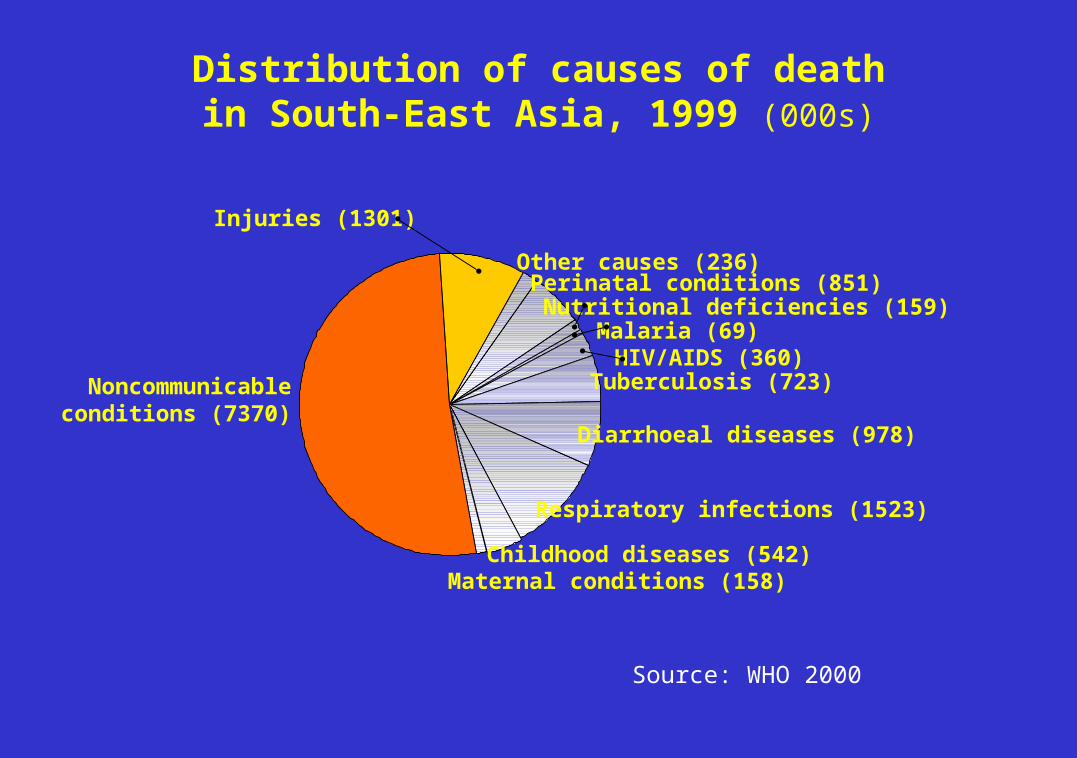
Malaria (69)HIV/AIDS (360)
Tuberculosis (723)
Diarrhoeal diseases (978)
Injuries (1301)
Noncommunicableconditions (7370)
Maternal conditions (158)Childhood diseases (542)
Respiratory infections (1523)
Distribution of causes of deathin South-East Asia, 1999 (000s)
Other causes (236)
Nutritional deficiencies (159)Perinatal conditions (851)
Source: WHO 2000
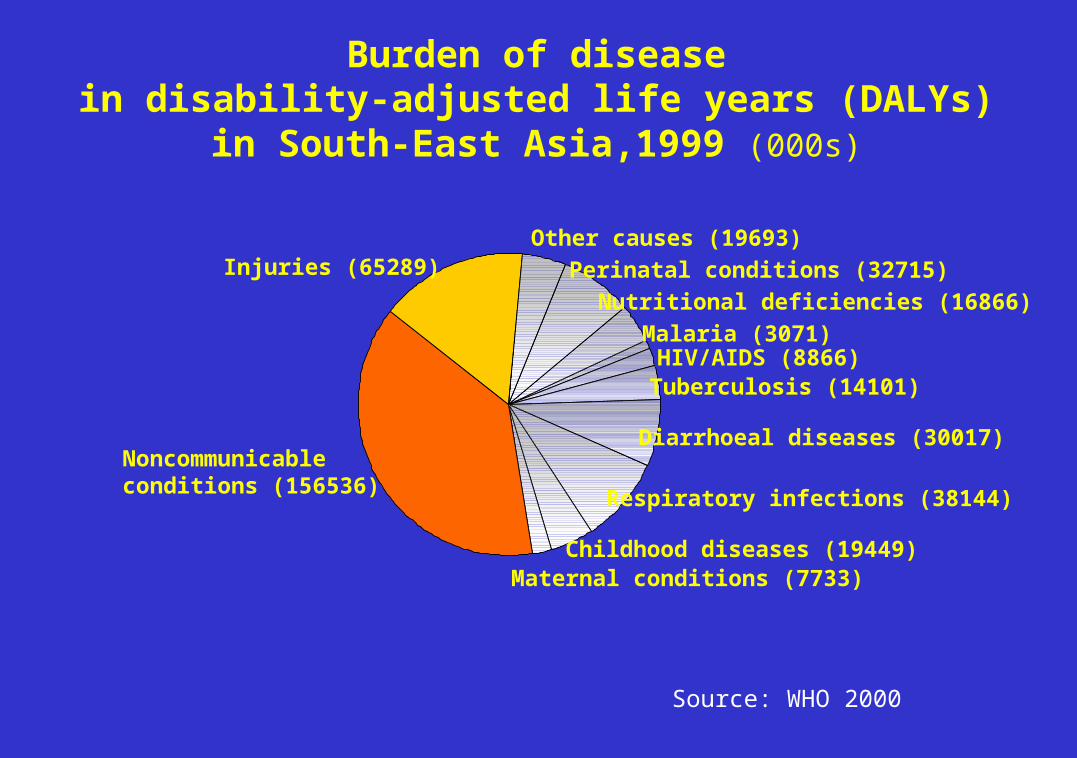
Malaria (3071)HIV/AIDS (8866)Tuberculosis (14101)
Diarrhoeal diseases (30017)
Injuries (65289)
Noncommunicableconditions (156536)
Maternal conditions (7733)Childhood diseases (19449)
Respiratory infections (38144)
Other causes (19693)
Burden of diseasein disability-adjusted life years (DALYs)
in South-East Asia,1999 (000s)
Nutritional deficiencies (16866)
Perinatal conditions (32715)
Source: WHO 2000
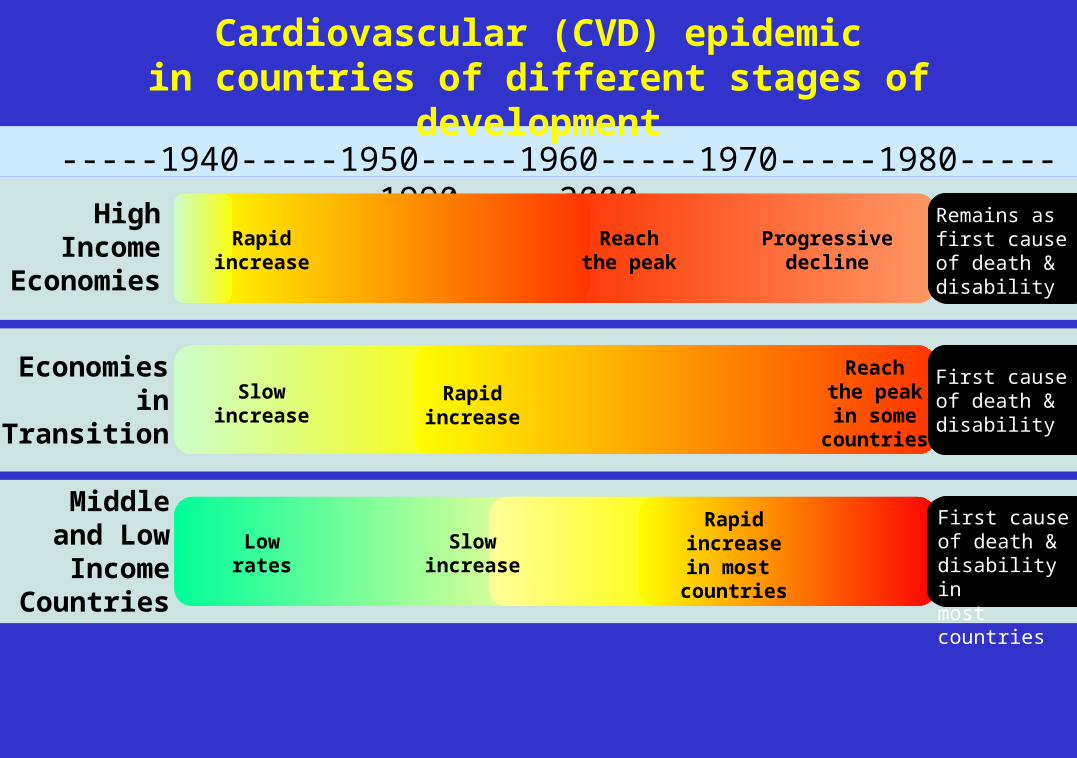
Cardiovascular (CVD) epidemicin countries of different stages of development
-----1940-----1950-----1960-----1970-----1980-----1990-----2000-----High
IncomeEconomies
Economiesin
Transition
Slow
increaseRapid
increase
Reachthe peakin some
countries
Middleand Low
IncomeCountries
First causeof death & disability
Lowrates
Slowincrease
Rapidincreasein most
countries
First causeof death & disability inmost countries
Reachthe peak
Progressivedecline
Rapidincrease
Remains as first causeof death & disability
25
50
%
Communicable diseases, maternal and perinatal conditions and
nutritional deficiencies
Injuries
DALYs, by broad cause group 1990 - 2020in developing countries (baseline scenario)
DALY = Disability adjusted life-year
1990
2020
Source: WHO, Evidence, Information and Policy, 2000
Noncommunicableconditions
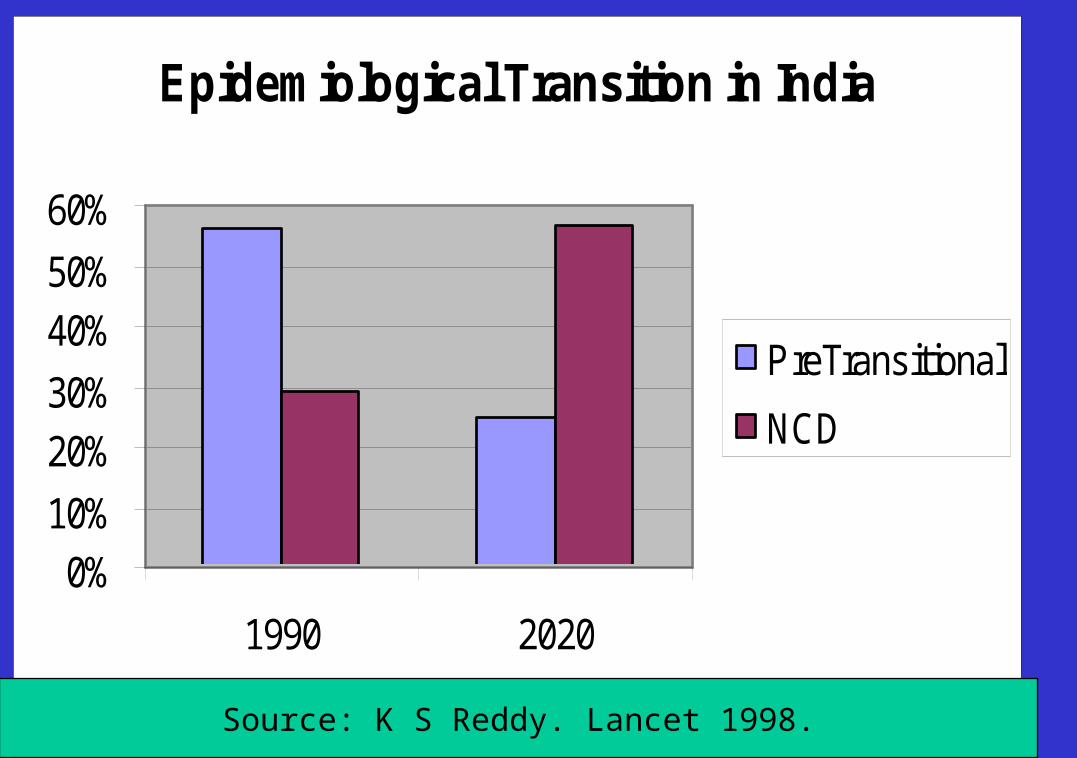
Epidemiological Transition in India
0%10%
20%30%
40%50%
60%
1990 2020
PreTransitional
NCD
Source: K S Reddy. Lancet 1998.
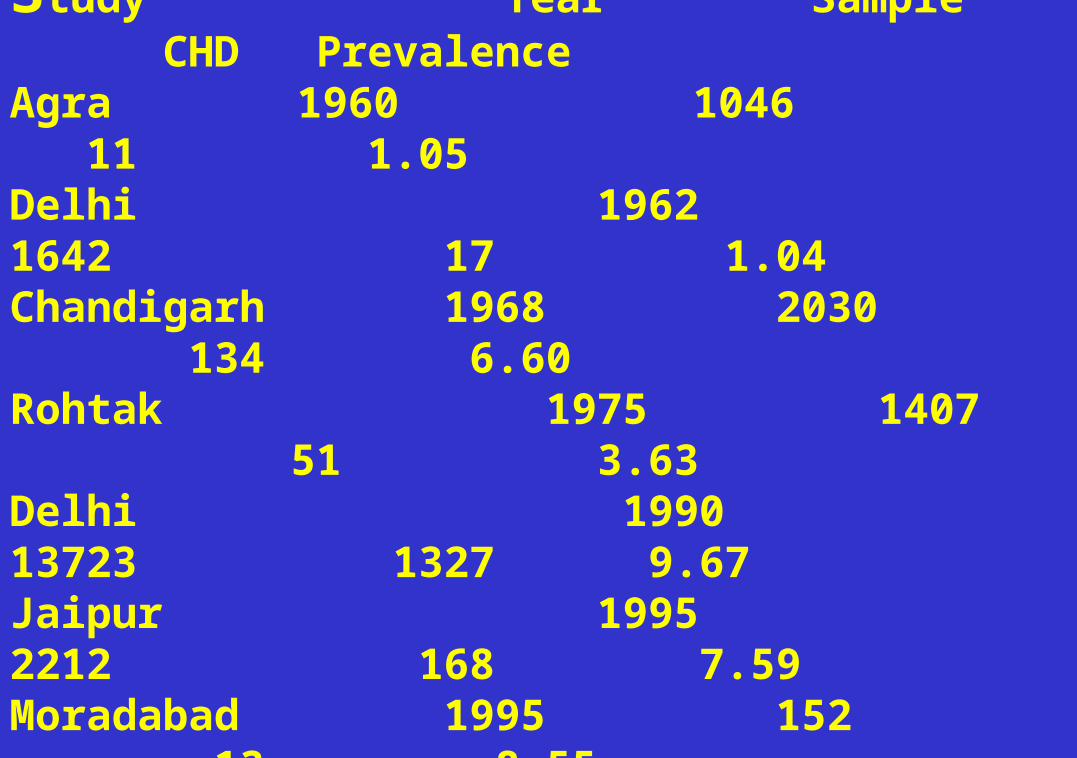
Coronary Heart Disease Prevalence Studies in India (Urban)Study Year Sample CHD PrevalenceAgra 1960 1046 11 1.05Delhi 1962 1642 17 1.04Chandigarh 1968 2030 134 6.60Rohtak 1975 1407 51 3.63Delhi 1990 13723 1327 9.67Jaipur 1995 2212 168 7.59Moradabad 1995 152 13 8.55Trivandrum 1995 506 41 12.65________________________Source: Gupta et al. Indian Heart Journal 1995.
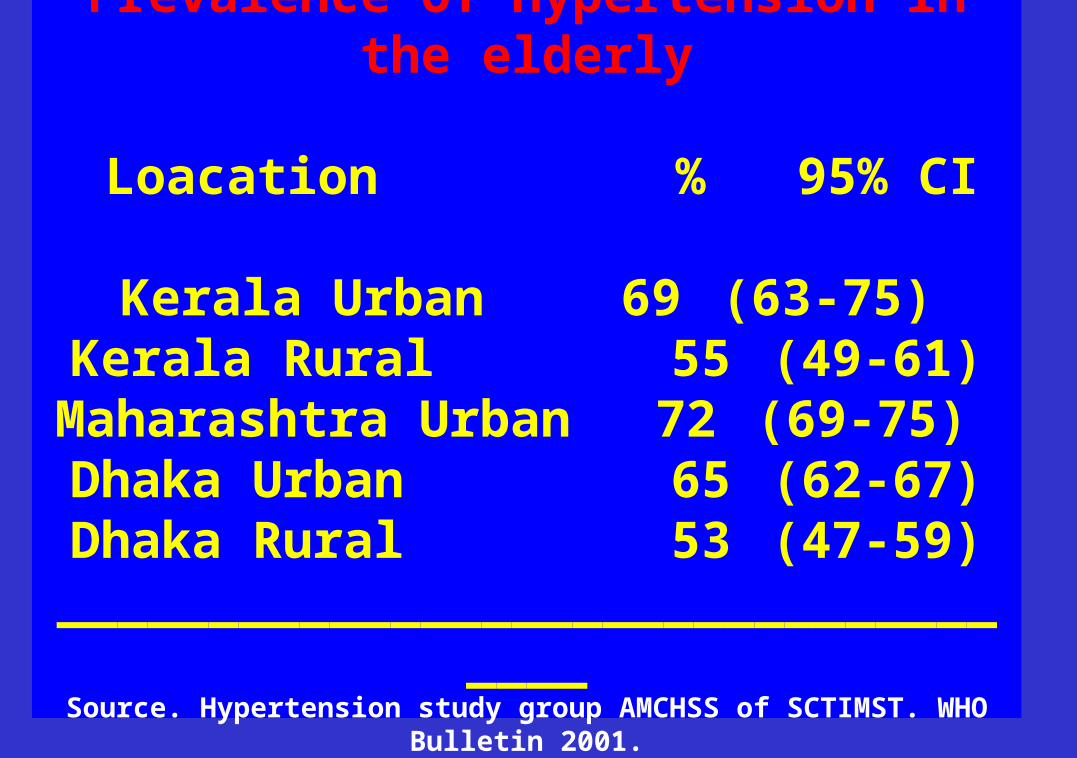
Prevalence Of Hypertension in the elderly
Loacation % 95% CI
Kerala Urban 69 (63-75)Kerala Rural 55 (49-61)Maharashtra Urban 72 (69-75) Dhaka Urban 65 (62-67)Dhaka Rural 53 (47-59)
___________________________________Source. Hypertension study group AMCHSS of SCTIMST. WHO Bulletin 2001.
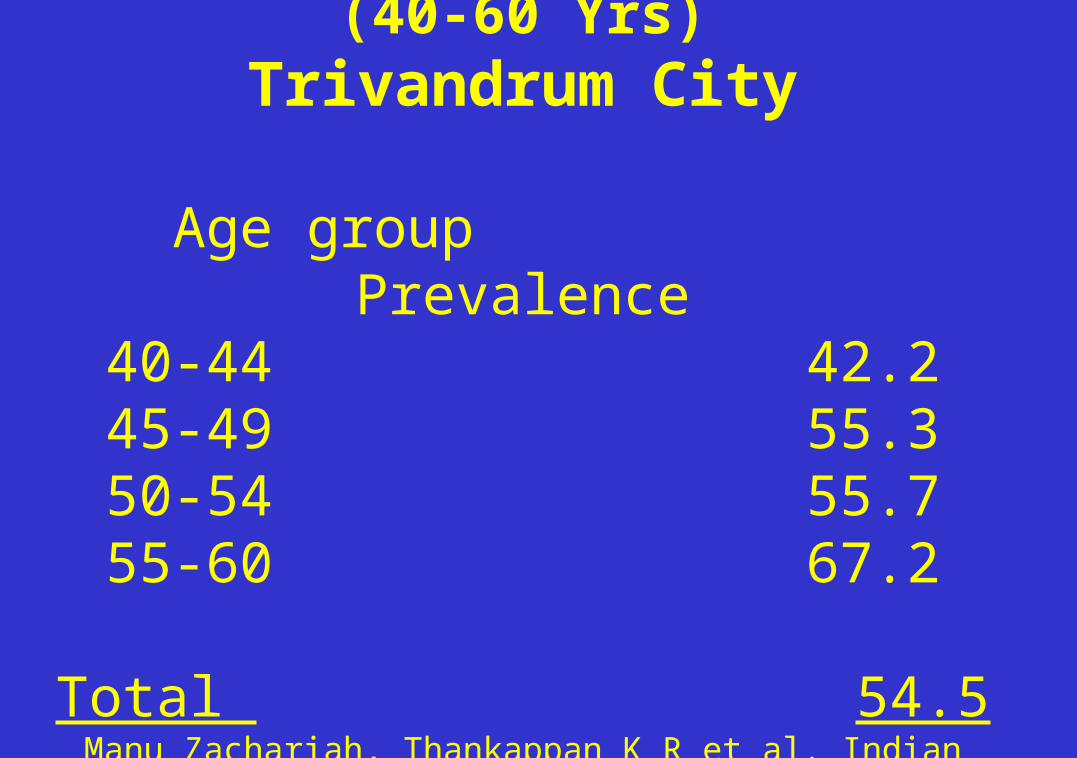
Prevalence of Hypertension (40-60 Yrs)Trivandrum City
Age group Prevalence40-44 42.245-49 55.350-54 55.755-60 67.2
Total 54.5Manu Zachariah, Thankappan K R et al. Indian Heart Journal 2003
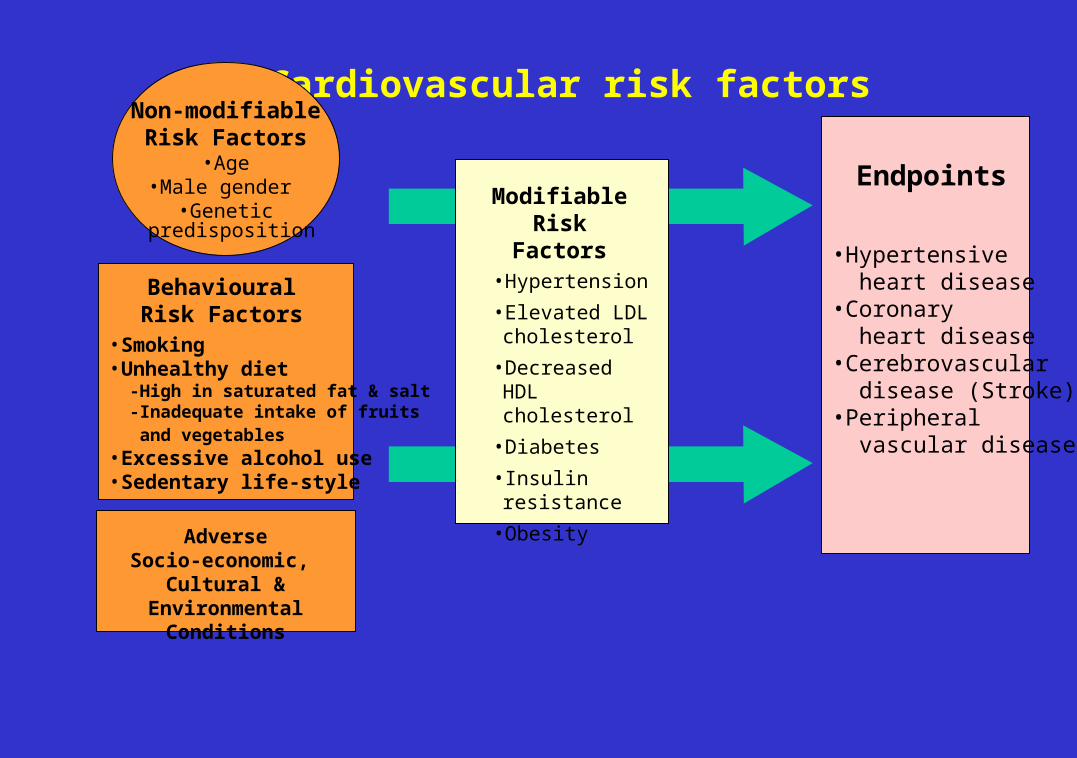
• Smoking• Unhealthy diet -High in saturated fat & salt -Inadequate intake of fruits and vegetables • Excessive alcohol use• Sedentary life-style
BehaviouralRisk Factors
• Hypertensive heart disease• Coronary heart disease• Cerebrovascular disease (Stroke)• Peripheral vascular disease
Endpoints
Cardiovascular risk factorsNon-modifiable
Risk Factors•Age
•Male gender •Genetic
predisposition
ModifiableRisk
Factors•Hypertension
•Elevated LDL cholesterol
•Decreased HDL cholesterol
•Diabetes
• Insulin resistance
•ObesityAdverse
Socio-economic, Cultural & Environmental
Conditions
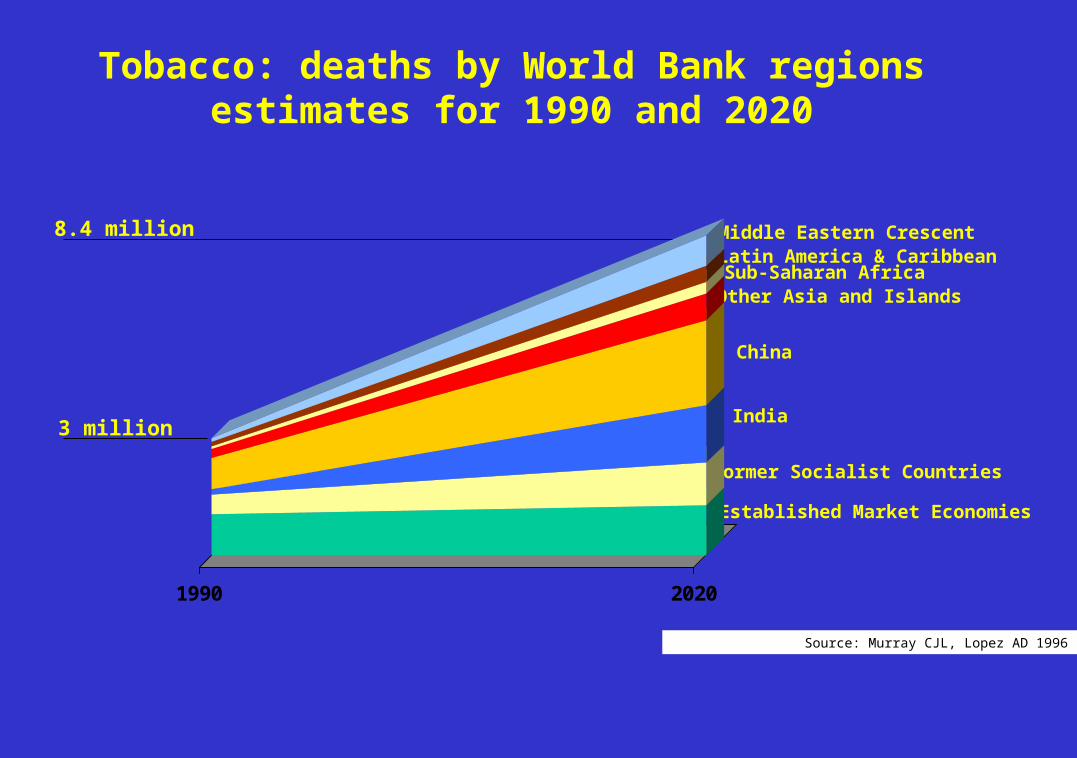
8.4 million
3 million
Established Market Economies
Middle Eastern CrescentLatin America & CaribbeanSub-Saharan AfricaOther Asia and Islands
China
India
Former Socialist Countries
Tobacco: deaths by World Bank regionsestimates for 1990 and 2020
Source: Murray CJL, Lopez AD 1996
1990 2020
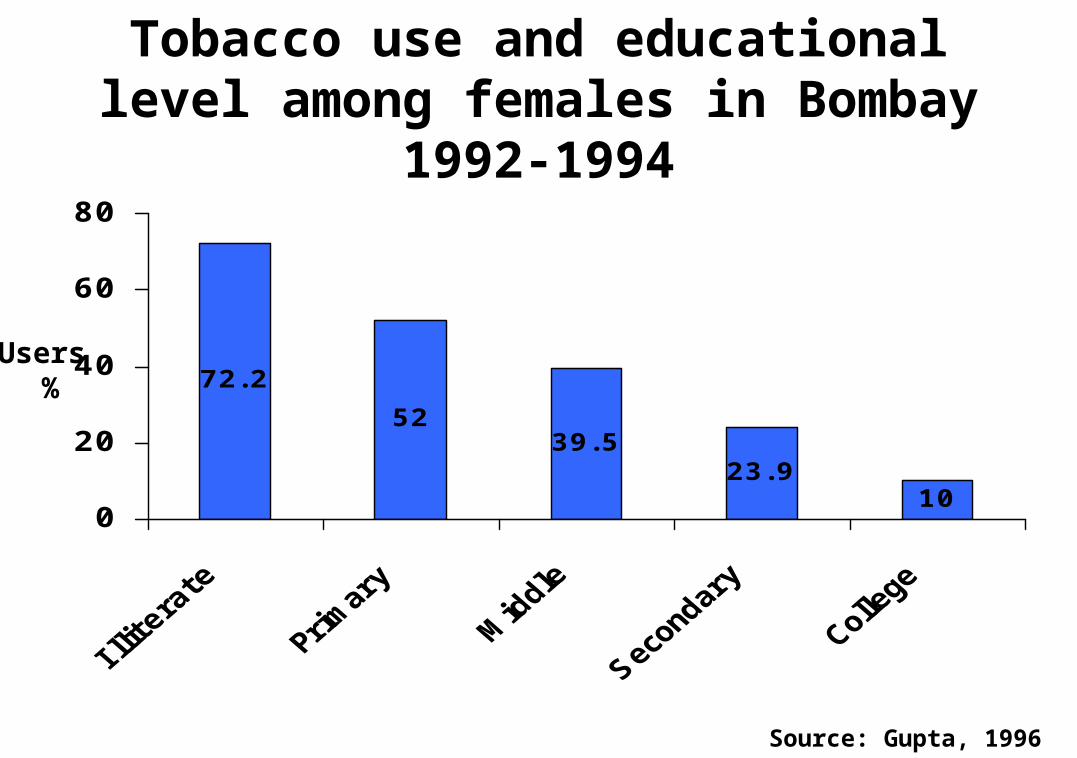
Tobacco use and educational level among females in Bombay
1992-1994
Source: Gupta, 1996
5239.5
23.910
72.2
0
20
40
60
80
Users %
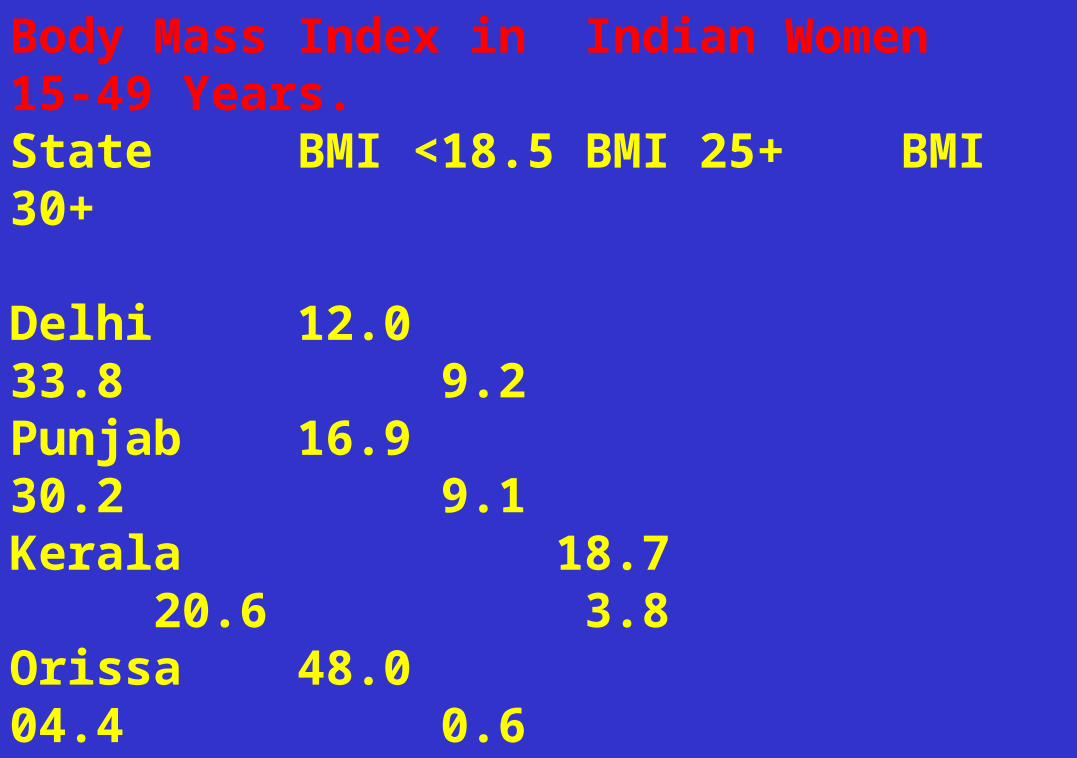
Body Mass Index in Indian Women 15-49 Years.State BMI <18.5 BMI 25+ BMI 30+
Delhi 12.0 33.8 9.2Punjab 16.9 30.2 9.1Kerala 18.7 20.6 3.8Orissa 48.0 04.4 0.6Assam 27.1 04.2 0.7Bihar 39.3 03.7 0.5India 35.8 10.6 2.2Urban 22.6 23.5 5.8Rural 40.6 05.9 0.9Source: NFHS 1998-99.
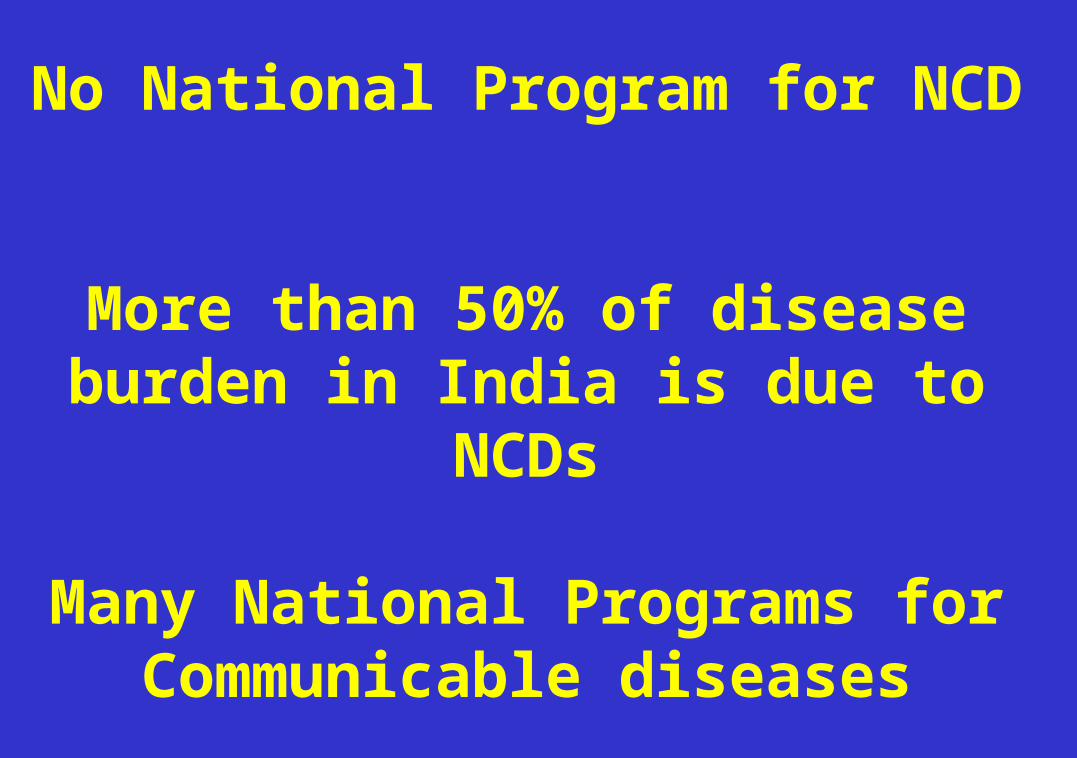
No National Program for NCD
More than 50% of disease burden in India is due to NCDs
Many National Programs for Communicable diseases
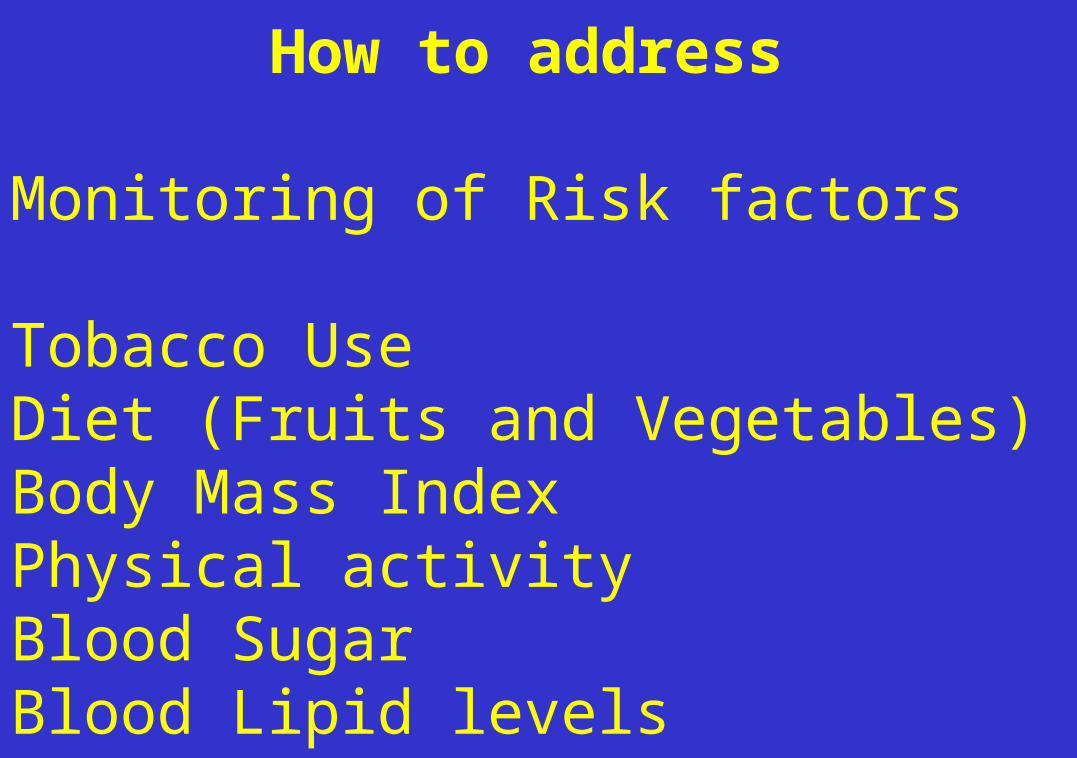
How to address
Monitoring of Risk factors
Tobacco UseDiet (Fruits and Vegetables)Body Mass IndexPhysical activityBlood SugarBlood Lipid levels
Disease Specific Program
CancerDiabetes
Bronchial AsthmaHypertension?
Need to develop a Program
Sentinel Health Monitoring Centres
AssamDelhi
Kerala MaharashtraTamil Nadu
Address Risk factors and determinants
at community level Inter-sectoral coordination
Legislation
For example Tobacco ControlAlcohol
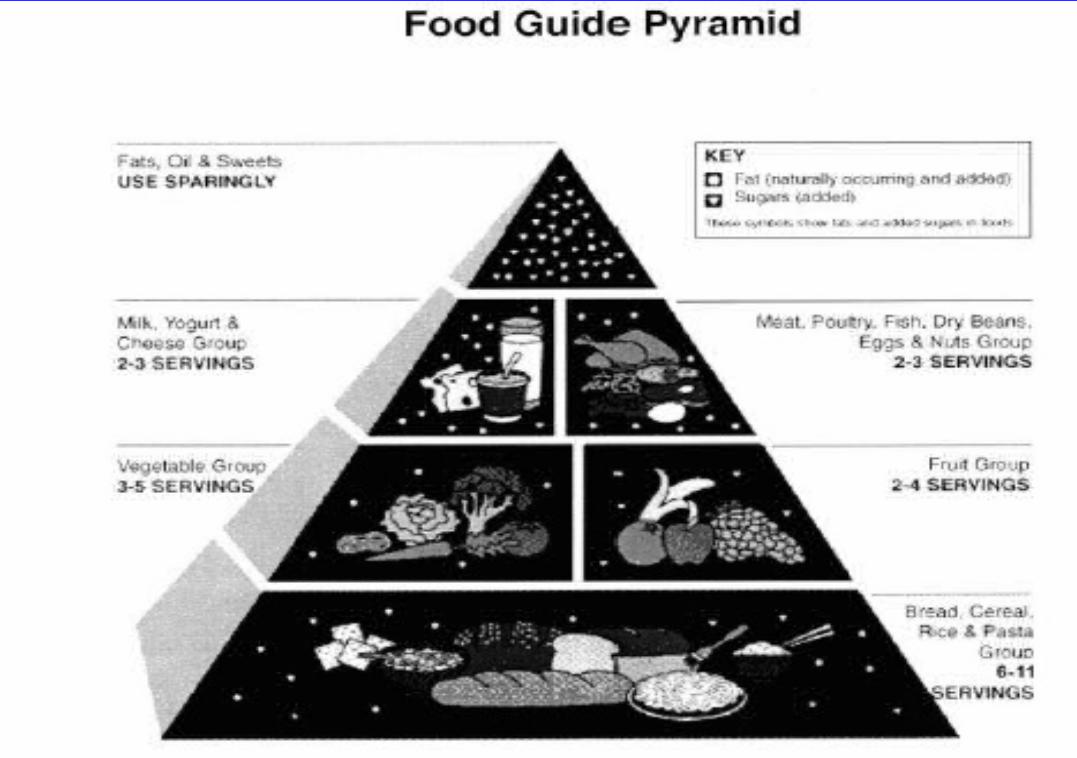
Diet, salt restrictionExercise

Global strategy for Diet and Physical activity

Primary Health Care System
Need to re-orient focusTraining of health workers
Monitoring of blood pressure and urine sugar can be done at grass
root levelHealth education programs

Capacity Building
Manpower -PH specialistsNew Public Health Schools Social Science componentsMPH-SCTIMST, AllahabadPGI Chandigarh, CMC Vellore, EHAExpand the current MD programsFETP Programs- MAE at NIE

Start From Children

THANK YOU