Achieving Effective Delivery of Capital Projects - …/media/Accenture/Conversion...Achieving...
24
Achieving Effective Delivery of Capital Projects Accenture global survey of the chemicals industry
Transcript of Achieving Effective Delivery of Capital Projects - …/media/Accenture/Conversion...Achieving...

Achieving Effective Delivery of Capital ProjectsAccenture global survey of the chemicals industry

2
Contents
Executive summary 4
Key survey findings 6
Leading performers’ attributes and advantages 10
Four recommendations for effective project delivery 14
Conclusion 22

3

After pulling through the most recent economic downturn, chemicals companies are in expansion mode. Projections indicate nearly $19 trillion1 will be spent globally through 2035 on capital projects.2 The growing investments in the chemicals industry, along with the innate complexity of projects, leads to the question: How can capital project delivery be improved?
To answer this question, Accenture interviewed executives about key challenges and methods to improve outcomes in capital project delivery. Survey respondents were asked about organizational priorities in the next three years and three themes emerged:
•Obtainingtherightleadersandtalentfor project delivery.
•Enhancingfront-endloadingandscheduling.
•Improvingalignmenttoorganizationalstrategy.
Areas in which leading performers stand outAnalysis of the chemical survey along with a comparable recent survey of energy companies’ capital projects produced additional insights. After aggregating responses from respondents in the two industries, Accenture segmented a group of“leadingperformers,”roughlyone-thirdof the sample size.
All of the leading performers view effective capital project delivery as critical for high performance. The leading groupalsoindicateshavingawell-developed project delivery culture, as compared to 74 percent in the rest of the sample. Additional characteristics can be seen in Figure 1.
Four recommendations for effective capital project delivery Based on survey results, research and industry experience, Accenture offers four recommendations to help improve project delivery to address cost and schedule demands, reduce risks and boost return oninvestment(ROI):
1. Establish strong project governance, riskmanagementandfront-endplanning tools.
2. Enhance scarce talent through portfolio management, organizational flexibility and training.
3.Integrateinformationsystemsamongcapital project players.
4. Accelerate operational readiness.
Executive summary
Figure 1. Leading performer attributes and advantages.
• Fewer revisions in approved schedule
• More timely decisions
• Closer to both cost and schedule objectives
• Well-developed culture
• Wider usage of analytics
• Better transition from project to operating asset
Attributes Advantages
4

5
Figure 2. Capital projects include the following areas among survey respondents.
Scope of capital projects
Pharmaceuticals
Paints, adhesives and inks
Consumer chemicals
Agricultural chemicals
Inorganic chemicals
Petrochemicals and intermediaries
Other specialty chemicals
Polymers, synthetic rubber, fibers 4
1
1
2
3
3
3
4
4Other
Respondents could list more than one category.
This report is based on primary research conductedbyathird-partyfirmonbehalf of Accenture. Nine interviews were conducted with executives between February and May 2012.
AllrespondentswereC-levelexecutives,decision makers or influencers regarding decisions related to management of capital projects in their organizations.
Survey interviewers conducted a phone survey with executives in Canada, Germany, the Netherlands, Saudi Arabia, Thailand and the United States. Projects eligible for consideration involved operating assets of at least $1 billion and took more than one yeartodeliver.(SeeFigure2.)
About the research

6
Performance and portfolio growthEffective capital project delivery is critical to high performance…
When asked about the importance of effective capital project delivery to high performance, eight out of nine respondents indicated effective delivery is critical to high performance.3 The survey question defines critical as meaning it is one of the top three drivers of superior performance.
…but the majority of companies are not delivering consistently against their targets
Survey responses indicate organizations are not consistently meeting their owntargets.(SeeFigure3.)Onlytwoexecutives indicated that, for all projects, their company projects consistently delivered expected business value from new assets.
Inarelatedsurveyquestion,“Howwouldyou rate your company’s overall level of maturity in project management delivery?,” seven out of nine respondents indicated average performance.
Projects are increasing in size and complexity
The majority of respondents anticipate the size and complexity of their portfolios will continue to increase in the next five years.
Figure 3. The majority of respondents are not consistently delivering against their own targets.
Please indicate to what extent you usually meet your targets regarding the delivery of capital projects?
Base: All respondents who monitor the information.
Enhance reputation of the company with external stakeholders
Deliver to quality requirements
Deliver reliable production capability
Met for the minority of projects Met for a majority of projects Met for all projects
Deliver the expected business value from new assets
Deliver to approved schedule (within 25%)
Deliver to approved cost (within 25%)
Deliver to approved cost (within 10%)
Deliver to approved schedule (within 10%)
45
4 5
45
1 26
1 4 3
1 52
1 4 3
52 2
Key survey findings

7
Figure 4. Complexity is on the rise, as can be seen in ethylene projects.
Figure 5. Respondents rank their top priorities in the next three years.
Ethylene crackers: Percent of build in countries with poor construction permit environment
Circle = Ten-year average cracker expansions sizes (kmtpy)kmtpy = thousand metric tons per year*Share of new capacity in countries at bottom 20 percent of business environment ranking
Source: Accenture Research analysis. ICIS Consulting. “International Finance Corporation; World Bank. 2012. Doing Business 2012: Doing Business in a More Transparent World. © World Bank. https://openknowledge.worldbank.org/handle/10986/5907 License: CC BY 3.0 Unported.”
New plants are rising in average size and increasingly being built in countries with poor construction environments.
Capa
city
bui
lt in
hig
h-ris
k ar
eas*
0
10
20
30
40
50
60
70
80
90
100
1976–1986
370
1986–1996
450
1996–2006
605
2006–2016
1060
What are the top three priorities for your company to optimize capital project management in the next three years?
Implementing the correct organizational design
Improved contracting strategies
Safety management
Ensuring effective stakeholder engagement
More effective change management
Improved alignment to organization strategy
Top three mentions
Improved front-end loaded planning and scheduling
Ensuring availability of the right leaders and talent for project delivery
7
1
1
2
2
3
5
6
Base: All respondents (n=9).
As companies work with new partners, use new technologies and expand in countries with less mature construction environments, the complications increase. (SeeFigure4.)
Top priorities in the next three yearsRespondents were asked about organizational priorities in the next three years. As illustrated in Figure 5, three themes emerged: availability of the right leaders and talent for project delivery, improvingfront-endloadedplanningandscheduling and improving alignment to organizational strategy.
Top priority: Availability of the right leaders and talent
Attracting and retaining talent has become a major issue in the chemicals industry, and eight out of nine respondents indicated talent shortages are a major concern.
Indevelopedregions,theworkforceis aging, and the chemicals industry has had difficulty competing with the high-techindustryandhigh-growthsectors for top college graduates. Burnout has created havoc in retention of needed personnel, which undermines project management skills. High rates of turnover also weaken the ability to deliver projects up to expectations.
According to the survey, respondents plan to address shortages through a variety of measures, including turnkey contracts with engineering, procurement, construction(EPC)companies;tacticalsourcing;anddevelopmentofinternalresources. Companies also can mitigate some of the shortage by relying on contractors, but that option does not solve the problem as EPC performance issues, for example, can erode substantial business value from what is expected to be delivered. Contracting decisions assign challenges to other parties, and EPCs and subcontractors also are experiencing talent shortages.
8
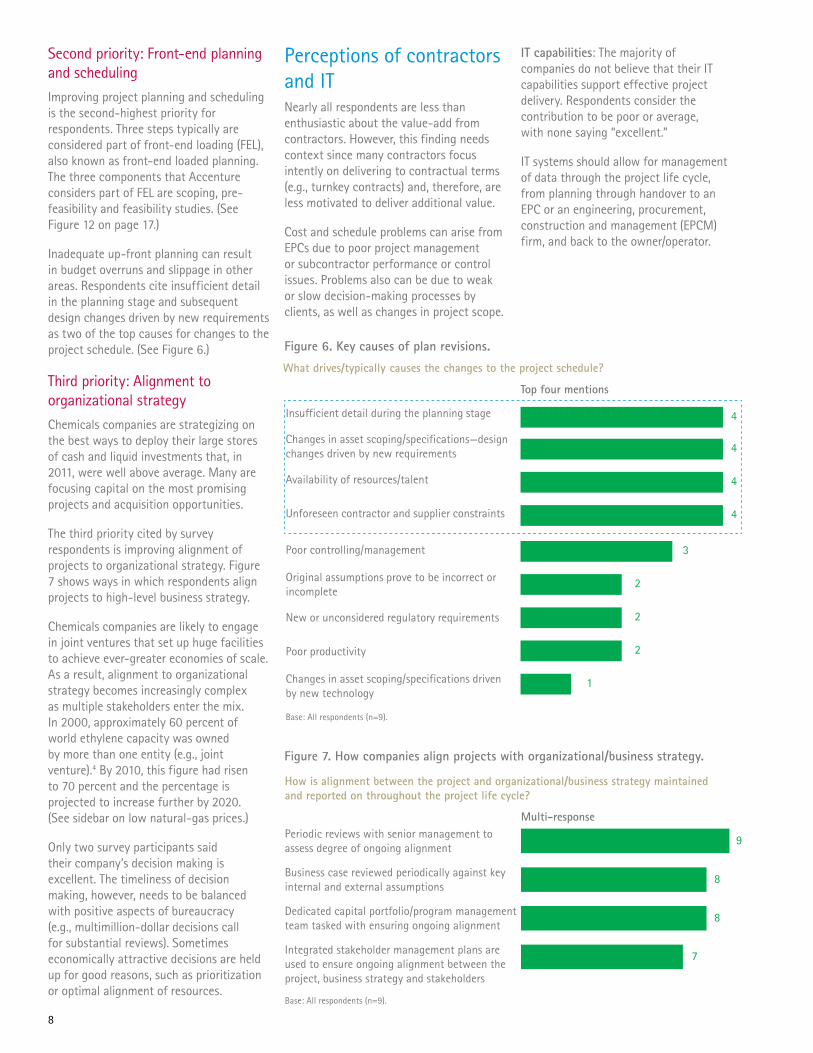
Secondpriority:Front-endplanningand scheduling
Improvingprojectplanningandschedulingisthesecond-highestpriorityforrespondents. Three steps typically are consideredpartoffront-endloading(FEL),alsoknownasfront-endloadedplanning.The three components that Accenture considerspartofFELarescoping,pre-feasibility and feasibility studies. (See Figure12onpage17.)
Inadequateup-frontplanningcanresultin budget overruns and slippage in other areas. Respondents cite insufficient detail in the planning stage and subsequent design changes driven by new requirements as two of the top causes for changes to the projectschedule.(SeeFigure6.)
Third priority: Alignment to organizational strategy
Chemicals companies are strategizing on the best ways to deploy their large stores of cash and liquid investments that, in 2011, were well above average. Many are focusing capital on the most promising projects and acquisition opportunities.
The third priority cited by survey respondents is improving alignment of projects to organizational strategy. Figure 7 shows ways in which respondents align projectstohigh-levelbusinessstrategy.
Chemicals companies are likely to engage in joint ventures that set up huge facilities toachieveever-greatereconomiesofscale.As a result, alignment to organizational strategy becomes increasingly complex as multiple stakeholders enter the mix. In2000,approximately60percentofworld ethylene capacity was owned by more than one entity (e.g., joint venture).4 By 2010, this figure had risen to 70 percent and the percentage is projected to increase further by 2020. (Seesidebaronlownatural-gasprices.)
Onlytwosurveyparticipantssaidtheir company’s decision making is excellent. The timeliness of decision making, however, needs to be balanced with positive aspects of bureaucracy (e.g.,multimillion-dollardecisionscallforsubstantialreviews).Sometimeseconomically attractive decisions are held up for good reasons, such as prioritization or optimal alignment of resources.
Perceptions of contractors andITNearly all respondents are less than enthusiasticaboutthevalue-addfromcontractors. However, this finding needs context since many contractors focus intently on delivering to contractual terms (e.g.,turnkeycontracts)and,therefore,areless motivated to deliver additional value.
Cost and schedule problems can arise from EPCs due to poor project management or subcontractor performance or control issues. Problems also can be due to weak orslowdecision-makingprocessesbyclients, as well as changes in project scope.
IT capabilities: The majority of companiesdonotbelievethattheirITcapabilities support effective project delivery. Respondents consider the contribution to be poor or average, with none saying “excellent.”
ITsystemsshouldallowformanagementof data through the project life cycle, from planning through handover to an EPC or an engineering, procurement, constructionandmanagement(EPCM)firm, and back to the owner/operator.
Figure 6. Key causes of plan revisions.
What drives/typically causes the changes to the project schedule?
Top four mentions
Insufficient detail during the planning stage 4
New or unconsidered regulatory requirements 2
Poor productivity 2
Original assumptions prove to be incorrect or incomplete
2
Poor controlling/management 3
Unforeseen contractor and supplier constraints 4
Availability of resources/talent 4
Changes in asset scoping/specifications—designchanges driven by new requirements 4
Base: All respondents (n=9).
Changes in asset scoping/specifications driven by new technology
1
How is alignment between the project and organizational/business strategy maintained and reported on throughout the project life cycle?
Multi-responsePeriodic reviews with senior management to assess degree of ongoing alignment
9
Integrated stakeholder management plans are used to ensure ongoing alignment between the project, business strategy and stakeholders
7
Dedicated capital portfolio/program managementteam tasked with ensuring ongoing alignment
8
Business case reviewed periodically against key internal and external assumptions
8
Base: All respondents (n=9).
Figure 7. How companies align projects with organizational/business strategy.

9
After the Middle East, North America isnowtheworld’ssecondlowest-costolefins production region.5 By using technology to tap previously unattractive hydrocarbon deposits, such as shale gas, the natural gas supply has increased, pushing gas prices down and decoupling themfromoilprices.(SeeFigure8.)
The industry uses natural gas for fuel and as a feedstock. Several chemicals can be manufactured from its components, such as ethylene (by far the dominant petrochemical),methanolandammonia.While ethylene can be manufactured from liquids, such as refined products (based onoil),flexiblechemicalplantscanswitchto light feedstocks, such as ethane, which is obtained from natural gas.
Many ethylene “crackers” are under study or in development by companies, including Chevron Phillips Chemical, Shell Chemicals, Formosa Plastics, Dow Chemical, ExxonMobil, Sasol, LyondellBasell,SABIC,Braskem,OccidentalandAitherChemicals.6
While all plans will not reach fruition, Accenture Research estimates more than 15 million metric tons per year of new petrochemical capacity may be built in North America—the equivalent of between $30 billion and $50 billion in capital projects in the next 10 years.
Energy price outlook
Source: US Energy Information Administration, Short-Term Energy Outlook, August 7, 2012.
Bren
t cr
ude
oil,
spot
, $/B
BL
US n
atur
al g
as, H
enry
Hub
, spo
t (
$/m
cf)
1q93 2q94 3q95 4q96 1q98 2q99 3q00 4q01 1q03 2q04 3q05 4q06 1q08 2q09 3q10 4q11 1q13
140
120
100
80
60
40
20
0
14
12
10
8
6
4
2
0
Brent crude oil spot price
Natural gas, henry hub, spot price ($/mcf)
Figure 8. Low prices for natural gas are a boon for chemicals companies with North American operations.
Low-pricednaturalgasfuelscapitalprojects in North America

10
Accenture analysis of the survey data shows multiple attributes and capabilities set leading performers apart from other organizations. A group of leading companies outperforms the rest in meeting their own project targets on cost, schedule, quality and delivery of reliable production capacity.
Leading performers’ attributes and advantages

11
12
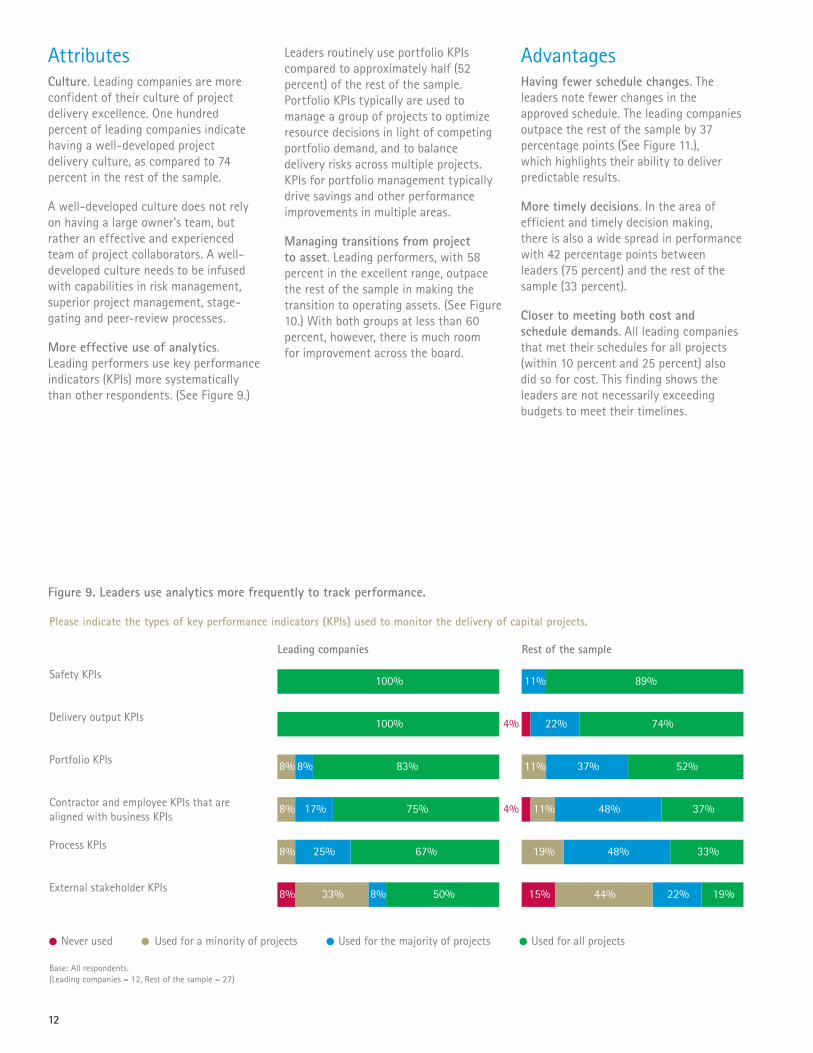
Attributes Culture. Leading companies are more confident of their culture of project deliveryexcellence.Onehundredpercent of leading companies indicate havingawell-developedprojectdelivery culture, as compared to 74 percent in the rest of the sample.
Awell-developedculturedoesnotrelyon having a large owner’s team, but rather an effective and experienced teamofprojectcollaborators.Awell-developed culture needs to be infused with capabilities in risk management, superiorprojectmanagement,stage-gatingandpeer-reviewprocesses.
More effective use of analytics. Leading performers use key performance indicators(KPIs)moresystematicallythanotherrespondents.(SeeFigure9.)
LeadersroutinelyuseportfolioKPIscompared to approximately half (52 percent)oftherestofthesample.PortfolioKPIstypicallyareusedtomanage a group of projects to optimize resource decisions in light of competing portfolio demand, and to balance delivery risks across multiple projects. KPIsforportfoliomanagementtypicallydrive savings and other performance improvements in multiple areas.
Managing transitions from project to asset. Leading performers, with 58 percent in the excellent range, outpace the rest of the sample in making the transition to operating assets. (See Figure 10.)Withbothgroupsatlessthan60percent, however, there is much room for improvement across the board.
AdvantagesHaving fewer schedule changes. The leaders note fewer changes in the approved schedule. The leading companies outpace the rest of the sample by 37 percentagepoints(SeeFigure11.),which highlights their ability to deliver predictable results.
More timely decisions.Intheareaofefficient and timely decision making, there is also a wide spread in performance with 42 percentage points between leaders(75percent)andtherestofthesample(33percent).
Closer to meeting both cost and schedule demands. All leading companies that met their schedules for all projects (within10percentand25percent)alsodid so for cost. This finding shows the leaders are not necessarily exceeding budgets to meet their timelines.
Figure 9. Leaders use analytics more frequently to track performance.
Please indicate the types of key performance indicators (KPIs) used to monitor the delivery of capital projects.
Base: All respondents.(Leading companies = 12, Rest of the sample = 27)
Used for the majority of projectsUsed for a minority of projectsNever used
External stakeholder KPIs
Process KPIs
Contractor and employee KPIs that are aligned with business KPIs
Portfolio KPIs
Delivery output KPIs
Safety KPIs
Leading companies
100%
100%
67%8% 25%
83%8% 8%
50%8% 33% 8%
75%8% 17%
Rest of the sample
89%11%
74%22%
33%19% 48%
52%11% 37%
19%15% 22%44%
37%48%11%
Used for all projects
4%
4%

13
Figure 10. Making the transition to operating asset. Figure 11. Fewer schedule revisions needed among leading performers.
Percent of organizations with effective transition from projects delivery to operation assets (rate 8-10)
Leading companies
58%
Rest of the sample
41%
Base: All respondents.(Leading companies = 12, Rest of the sample = 27)
Percent of organizations where project schedule is delivered as originally specified
Leading companies
67%
Rest of the sample
30%
Base: All respondents.(Leading companies = 12, Rest of the sample = 27)
Criteria used to identify leading performers included 1) having abilities to deliver to cost and schedule (both within 25 percent), and 2) having reliable production capabilities, as well as quality requirements.
Accenture methodology for this section gave three points to companies meeting the above targets for all projects. One point was given for not meeting targets on all projects but for the majority of projects. Companies received no points if failing to meet any targets or not monitoring the information.
The sample size for this analysis section (n=39) is larger than that for the rest of the survey. This portion includes responses from energy (n=30) and chemicals companies (n=9). Accenture asked similar questions of energy executives (November 2011–February 2012), thereby enabling combined analysis of responses.
Analysis of the data reveals a group of companies outperforming the rest in meeting project targets of cost, schedule, quality and delivery of reliable production capacity. Accenture identified 12 companies as leading in capital project delivery.
Methodology for identifying leading performers

14
Four recommendations for effective project delivery
With each megaproject, hundreds of millions of dollars are at stake. Accenture has identified four areas to help chemicals companies improve capital projects delivery:
1. Establish strong project governance, risk management andfront-endplanningtools.
2. Optimizescarcetalentthroughportfoliomanagement,organizational flexibility and training.
3. Integrateinformationsystemsamongcapitalprojectsplayers.
4. Accelerate operational readiness.

15

16
1. Establish strong project governance, risk management and front-end planning tools
Multiyear capital projects have many variables and long time spans. Coming up with the perfect plan from the start is, of course, unfeasible. Strong governance is needed, along with the ability to manage risks. Project management must unify a diverse team capable of responding effectively to changes that arise.
Followafield-testedplanning tool for the validationoffront-endloading activitiesFront-endloadingshouldoccurthroughawell-established,stage-gatephasing.(SeeFigure12.)Teammembersneedtomeet guidelines for each stage, identify gapsandaddresstheminapeer-reviewprocess before moving to the next phase. A highly disciplined approach clarifies engineering needs, and leads to more accurate cost and schedule estimates.
Multiple methodologies for validation ofthequalityofthestage-gateprocessexist, including the Project Definition RatingIndex(PDRI)forindustrialprojects.The choice of tool is not as important as solid commitment and discipline to follow a tested methodology.
Project teams should seek an objective review of project delivery that uncovers areas where innovation could result in a better, more informed plan. These reviews should be independent from the project team, and, as project scale and delivery complexity increases, the objective findings and recommendations become increasingly important.
The ability to greatly influence project cost occurs early on when larger amounts of uncertainty exist and contingencies arehigher.Throughimprovedfront-endplanning, both project delivery, and operations and maintenance performance can be optimized in alignment with organizational strategy.
Follow a comprehensive approach to risk managementAssemblingacross-functionalgrouphelps to identify a wide range of risks, and the ways in which risks interact and magnify the adverse consequences. Furthermore, a diagnostic can help assess if an organization’s capabilities are adequate to meet the level of complexity of the project.
Proactively managing risks helps reduce the number of realized problems, claims and scope changes. Collaborating regularly with contractors and suppliers also can help project owners manage a widerangeofrisks.(SeeFigure13.)
Align teams from the startOneimportanttopicfordiscussionisseeking representation from operations andmaintenanceleadersearlyon.Inaddition, systems need to be designed that capture information at the start, and enable sharing of data easily among teams across the project life cycle, including those who will operate the asset.
Agreeing on data needs and relevant performance indicators lays a solid foundation for capital projects analytics. Analytics provide dashboards for integrated project planning, progress measurement, schedule control, risk management and reporting. Agreeing ondataneedsalsocanavertthetime-consuming challenge of data migration from project to operations.

Sources:IPAandAccentureexperience.
17
Figure 12. Typical capital project phases, with the first three parts of front-end loading (FEL).
Figure 13. Risk management checklist for capital projects.
1. Identify 2. Evaluate 3. Define 4. Execute 5. OperateAreas
Typical scope/phase
Percent engineering complete
Percent capital (CAPEX) estimate accuracy
5% 10% 20-30% 100% N/A
N/A(+/- 40-50%) (+/- 30-40%) (+/- 15-20%) (+/- 5-10%)
FEL 1 (Scoping Study)
FEL 2 (Pre-Feasibility Study)
FEL 3 (Feasibility Study)
EPC/EPCM or PMC Plant operations/sustainability projects/portfolio management
Attributes
Cost estimating and project scheduling• Poorly defined scope• Lack of effective front-end loading • Limited resources for project controls
Project economic forecast• Misalignment in expectations between
technical and commercial functions• Infrastructure access issues not considered
in forecasts
Procurement, contracting and project material logistics• Delays in long lead-time procurement
activities impact project schedule• Ineffective contracts • Supplier inability to deliver equipment in line
with project schedule and quality requirements
• Disruption in supply source
Financial and commercial management• Currency and hedging volatility not
considered • Input costs for major material cost increases
(e.g., piping, steel) not considered
Access to strategic infrastructure• Poor planning to move products to market
via infrastructure• Lack of planning for tie-ins to existing and
future infrastructure
Scope growth and claims management• Poor definition of scope changes• Changes not well coordinated• Weak models to mitigate contract changes
Human capital• Shortage of engineering, management,
construction and operations people• Aging workforce • Poor planning for start-up and operations
Management of contractors• Limited resources for effective oversight of
EPC firms and contractors, who also are experiencing human capital shortages
• Difficulty of managing non-chemical plant components, such as administrative building infrastructure in remote areas
Production ramp-up• Failure to consider production issues to bring
products to market at early stages of the project design
• Risk mitigation of major production problems not done early enough
• Delay in setting up the IT infrastructure and applications
Global program delivery performance• Processes not in place to oversee and
manage complex projects• Treating projects separately rather than
managing them across a region or portfolio • Lack of accounting for possible claims
Accenture identified the following as key areas for chemicals companies to focus attention on in managing capital project risks.
Legal and regulatory compliance• Unclear responsibility for obtaining licenses
and permits• Lack of attention to corruption and
anti-bribery laws • Poor follow-up on immigration and
work-permit requirements• Problematic immigration regulations to bring
in skilled labor
Health, safety, environment and community(HSEC) management• Lack of proactive engagement with
stakeholders• Too little marketing of project benefits and
programs for environmental mitigation • Lack of training, which limits the potential
of creating a positive legacy for communities• Poorly understood interface between the
business enterprise and project/operational teams
• Projects not aligned with business objectives and properly controlled
• Lack of planning for extreme weather • Inadequate measures to protect environment

Companies tended to have experienced project managers 10 to 15 years ago. After the economy declined in 2008, however, managers were laid off, leaving organizations short of experience. Retirements further diminished the ranks of experienced project directors and managers.
Since talent in a wide range of areas will be in high demand for many years, optimal management of existing resources is vital.
Deploy resources in the most strategic wayAs the number of capital projects grows, companies are challenged to allocate scarce resources across complex portfolios. With an abundance ofhigh-returnopportunities,itisessential that companies do not have too many projects running at the same time, thus increasing the risk of overextending resources. Portfolio planning and optimization approaches help to evaluate and prioritize resourcing decisions given competing priorities.
Similarly, at the project level, automated planning and scheduling solutions enable project managers to know when and where scarce or specialized talent needs to be positioned during each project phase. Project directors can extend the benefit by collaborating regularly with contractors to find the appropriate ways to leverage strategic contractor resources across projects.
Companies can further optimize resource planning by integrating scheduling informationwiththree-dimensional(3D)design models to visualize the schedule and improve project planning, along with reducing constructability and safety risks.
Train the next generation of leaders Experienced managers in the industry need to invest time in training younger candidates. Accenture recommends developing a strategic plan to identify and develop talent for capital projects delivery.
Thelong-termprocessneedstobewellmonitored.AlongwithKPIsforretention(e.g., average time at company, employee turnoverandreasonsforattrition),companiescantrackKPIsforattractingtalent (e.g., time to fill internal positions, number of candidates with skills to match)andmetricsrelatedtoengagingtalent (e.g., scores from employee surveys, uptakeofinternaltrainingcourses).
Reduce costs through flexible organizational designOnemethodtobetterleveragescarce,higher-costexperiencedresourcesisto eliminate, or at least shift, tedious, transactional work to other resources.Capital project owners can more efficiently use their critical resources and also reduce costs by outsourcing low value-addedactivitiesthatarenotcentralto engineering and construction. Flexible organizational design promotes the outsourcingofback-officefunctions,suchas procurement, document management, ITandprojectcoordinationsupport.
Improveproductivityandsafety through effective training Training is a critical enabler for project safety, productivity and initial operability. Health and safety training needs to be produced in ways that are easily consumed, communicate desired behaviors and accelerate adoption.
The future lies in training simulations that familiarize staff with how to perform tasks successfully prior to actually doing the work (e.g., installing new equipment, operating new plant systems at turnover, removal of equipment during refurbishmentordecommissioning).Simulation-basedtraining,aspartofthe project execution phase, helps to accelerate operational readiness.
Systems that track training and certification records, and integrate the information into planning and scheduling activities, further support decision making on how to best deploy scarce talent.
18
2. Optimize scarce talent through portfolio management, organizational flexibility and training

19

Inadequateinformationmanagementundermines quality, increases costs and delays commissioning of new assets. Virtually everyone in the project life cycle needs access to reliable and updated data.
Establish electronic data standards early Progress cannot be monitored effectively if proper standards are not established early in project planning. Rules of credit, for example, need to be established to measure engineering, procurement and construction progress, which then leads to more accurate reporting. Improvedaccountingandmanagementof equipment and materials results after chemicals companies consolidate functions that are fragmented among project owners, EPCs and construction contractors. Solid standards also establish the foundation for greater accuracy of transferring materials quantities and specifications.
Project owners need to lead the transition from document management to data management. Ideally,electronicdatastandardsandsystems established early promote integration and improve productivity throughout the project life cycle.
MonitoringsystemsandKPIsgiveprojectmanagers better information about the cost of projects from region to region, and among product groupings. This data can lead to more effective practices and supplier rationalization.
Benefit from recent advances in visualization Intermsofengineeringcapabilities,ITsystemstodayenablemuchbetterup-frontdesignand3Dvisualization.Companies benefit from reduced rework and improved decision making through the use of the latest tools for visual 3D, laser scans and videogrammetry.
Ease access to relevant informationTrying to find the right information on demand is frequently frustrating and time consuming. A number of automated tools can help employees find information, thereby boosting productivity.Virtualtools,includingnext-generation portals, bring project teams closer together, promoting collaboration, learning and knowledge management.
Tools and information sources need to be structured and configured for specific roles. Many employees in the field, for example,couldworkwitheasy-to-use tablet computers, but engineers need more powerful notebooks. Similar to hardware choices, software and data sources need to be configured to simplify information access.
Also, as many are nearing retirement age, formal processes need to be implemented and documented to improve knowledge management and access.
Enhance decision makingWith thorough information integration, organizations can benefit from improved decision support and stronger leadership. Consider the example of taking a 3D model and applying schedule data to make it, in essence, a 4D model. This model illustrates the progress of the physical build according to the project schedule.
Similarly, organizations can extend this type of functionality to cover other dimensions, such as sustainability and total life cycle cost. As the information is visualized, executives are able to make better sense of complexity.
Informationintegrationalsopreventsdelays. “Most companies don’t know what things are actually necessary to get speed. Cutting corners is a fool’swaytogetspeed.…Integrationachieves speed,”7 notes Edward Merrow, founder and chief executive officer of IndependentProjectAnalysis,Inc.
3. Integrate information systems among capital projects players
20

21
Projects need to be executed with the end result of on-time production remaining top of mind throughout the project life cycle. As an example of the cost of delays, Figure 15 presents a view of how profits havebeenreducedduetopoorstart-uptiming of ethylene plants.
Ill-timedstart-upsequatedtoapproximately $700,000 of lost cash flow per day for a new North American ethylene cracker in 2011, according to Accenture Research.8 Based on the past few years of industry performance, the consequences ranged from $0.3 to $1.3 million dollars per day of lost cash flow.
Thus, streamlining the effectiveness of the transition from project to working assets makes good business sense.
Work more closely with operationsThe earlier that a chemical company’s operations department is involved, the better chance there is of building assets that can be operated as planned and completed close to schedule. Operationsexecutivesneedtobeinvolved in determining which assets and what types of skills will be needed. Inaddition,operationswillneedthelatest information on the asset under construction, rather than the original plan, which might be outdated.
Ideally,operatortrainingisconductedin parallel with the final stages of construction. Simulations use advanced technology to give operators a realistic look at what they will be doing on day one.
ITcapabilitiesusedinplanningalsoshould support commissioning. When employees from operations are brought in to give input to design and delivery during planning, they take greater ownership in new assets under development.
Reduce manual processes whenever feasibleChecking equipment for the purposes of commissioning provides an example of how manual procedures can slow down theprocess.Inmanycases,techniciansmanually enter data onto sheets while in the field. This data is then manually re-enteredintoasystematthesiteoffice, and then manually checked against drawings. By segregating technical from transactional activities, project teams can implement remote services to make better use of scarce talent at the project site.
Project directors need to remain keenly aware of better ways to conduct handovers. Data transitions to operations and maintenance departments should be done automatically rather than manually. Too often operations employees are preoccupied with routine activities, such as loading systems, rather than making the systems operationally ready, and becomingmorefamiliarwiththeplant.Inother words, chemicals companies should make the best use of their talent to acceleratecommissioningandstart-up.
4. Accelerate operational readiness
Figure 14. Profit suboptimal due to delayed start-ups of ethylene plants.
1,000
5
Ethylene investment timing (ethane-based) net present value at start-up vs. margin cycle
World ethylene plant start-ups
Profitability, $US, inflation adjusted
Cash
Ope
ratin
g M
argi
n, C
PPkm
tpy
2,0003,0004,000
1980
1982
1984
1986
1988
1990
1992
1994
1996
1998
2000
2002
2006
1980
1982
1984
1986
1988
1990
1992
1994
1996
1998
2000
2002
2004
2006
Net present value (NPV)Cash operating margin Peak start-up yearPeak cycle year
NPV
, $M
M
0 $0
10
15
20
25
$500
$100
$200
$300
$400
Note: Since 2008, US ethane cracking became advantageous. So, the net present value (which is forward looking) is less representative of the world ethylene market after 2004.Sources: Accenture Research and, for start-up data, ICIS Consulting.
1978
$600
$700
1978
2004

Throughout the project life cycle, keep the end objective in mind
Sophisticated skills and experience are needed to manage the increasing scale and complexity of today’s capital projects. The focus extends well beyond the scope of engineering and procurement.
Today’s projects call for increased attention to good governance and risk management, along with integrating information systems. Given the talent squeeze, finding the appropriate resources to execute capital projects is critical. Coordinating effectively with all partnerstogetthebestreturnsfrommultibillion-dollarprojectsisequally critical.
Ithelpstolookattheprojectwiththeendgoalclearlyinsight,andto methodically break projects into manageable pieces and manage risks at each stage before moving on. At a high level, some of the waystodothisincludeimprovingfront-endloading,addressingproject gaps and monitoring the project through objective peer reviews at each stage.
A strong project management organization is invaluable for megaprojects with multiyear horizons. Due to the high stakes involved, capital projects call for targeted objectives, clear delivery strategiesanddiligentmonitoringtotrackprogress.Ideally,capitalprojects should not be run as isolated and independent projects, but instead with a broader perspective, driving synergy across the portfolio for high performance.
Conclusion
22

23
Reference1 Figures in $US unless otherwise noted.
2IndustrialInfoResources,Inc.basedataextrapolatedto2035using©OxfordEconomics Ltd. regional sector output forecasts;includespharmaceuticals, www.industrialinfo.com.
3 Due to the modest size of the base of chemicalsindustryrespondents(n=9),results are reported in absolute numbers rather than in percentages.
4ICISConsultingdata,www.icis.com.
5“GlobalShiftsinIndustrialInvestment:How chemical companies can harness the opportunities,” Accenture, 2012, www.accenture.com.
6ICISChemicalBusinesspressannouncements, www.icis.com.
7 Merrow, Ed, “Managing risk and adding value throughout the upstream oil and gas lifecycle,”27June2012,www.spe-uk.org.
8 Accenture Research analysis of Muse, Stancil&Co.andICISConsultingdata,www.icis.com.
About the authors
Andy Webster is a managing director for Accenture Capital Projects Services (ACPS)supportingthechemicals,energyand utilities industry sectors. ACPS focuses on supporting clients through each phase of a capital project life cycle. Based in Houston, Andy works with clients globally providing consulting and project services to support business planning, building new organizational capabilities, improving project predictability and control and enabling engineering and project information management. His experience spans business transformation, business architecture, program management and information management. [email protected]
Paul Bjacek, a senior manager in Accenture Research, leads global chemicals and natural resources research. He has more than 25 years of experience in chemicals strategy development and research, from base chemicals to specialty chemicals and polymers. Paul also frequent speaks and writes about issues affecting the global materials industry. He is based in Houston. His blog can be found at: www.accenture.com/us-en/blogs/cnr [email protected]
Special thanks to other contributors
James ArnottJohn PoissonCharlotte RautJosé J. SuarezCarmen Uys
About Accenture
Accenture is a global management consulting, technology services and outsourcing company, with approximately 259,000 people serving clients in more than 120 countries. Combining unparalleled experience, comprehensive capabilities across all industries and business functions, and extensive research on the world’s most successful companies, Accenture collaborates with clients to help them becomehigh-performancebusinessesandgovernments. The company generated net revenues of US$27.9 billion for the fiscal yearendedAug.31,2012.Itshomepageiswww.accenture.com.
12-1274/11-5503
This document is produced by consultants atAccentureasgeneralguidance.Itisnotintended to provide specific advice on your circumstances.Ifyourequireadviceorfurtherdetails on any matters referred to, please contact your Accenture representative.
Copyright © 2013 Accenture All rights reserved.
Accenture, its logo, and High Performance Delivered are trademarks of Accenture.