ACER INCORPORATED AND SUBSIDIARIES CONSOLIDATED FINANCIAL ...
114
1 Stock Code:2353 (English Translation of Consolidated Financial Statements and Report Originally Issued in Chinese) ACER INCORPORATED AND SUBSIDIARIES CONSOLIDATED FINANCIAL STATEMENTS December 31, 2017 and 2016 (With Independent Auditors’ Report Thereon) The independent auditors’ report and the accompanying consolidated financial statements are the English translation of the Chinese version prepared and used in the Republic of China. If there is any conflict between, or any difference in the interpretation of the English and Chinese language independent auditors’ report and consolidated financial statements, the Chinese version shall prevail.
Transcript of ACER INCORPORATED AND SUBSIDIARIES CONSOLIDATED FINANCIAL ...

1
Stock Code:2353
(English Translation of Consolidated Financial Statements and Report Originally Issued in Chinese)
ACER INCORPORATEDAND SUBSIDIARIES
CONSOLIDATED FINANCIAL STATEMENTS
December 31, 2017 and 2016
(With Independent Auditors’ Report Thereon)
The independent auditors’ report and the accompanying consolidated financial statements are the English translation of the Chineseversion prepared and used in the Republic of China. If there is any conflict between, or any difference in the interpretation of the Englishand Chinese language independent auditors’ report and consolidated financial statements, the Chinese version shall prevail.

2
Table of contents
Contents Page
1. Cover Page 1
2. Table of Contents 2
3. Representation Letter 3
4. Independent Auditors’ Report 4
5. Consolidated Balance Sheets 5
6. Consolidated Statements of Comprehensive Income (Loss) 6
7. Consolidated Statements of Changes in Equity 7
8. Consolidated Statements of Cash Flows 8
9. Notes to Consolidated Financial Statements
(1) Organization and business 9
(2) Authorization of the Consolidated Financial Statements 9
(3) Application of New and Revised Accounting Standards andInterpretations
9~15
(4) Summary of significant accounting policies 16~39
(5) Critical Accounting Judgments and Key Sources of Estimation andAssumption Uncertainty
40
(6) Significant account disclosures 41~83
(7) Related-party Transactions 84~86
(8) Pledged assets 86
(9) Significant commitments and contingencies 86~87
(10) Significant loss from Casualty 87
(11) Significant subsequent events 87
(12) Others 87
(13) Additional disclosures
(a) Information on significant transactions 88、91~105
(b) Information on investees 88、106~108
(c) Information on investment in Mainland China 88、109
(14) Segment information 89~90

3
Representation Letter
The entities that are required to be included in the combined financial statements of ACER INCORPORATEDas of and for the year ended December 31, 2017 under the Criteria Governing the Preparation of AffiliationReports, Consolidated Business Reports, and Consolidated Financial Statements of Affiliated Enterprises arethe same as those included in the consolidated financial statements prepared in conformity with InternationalFinancial Reporting Standards No. 10 "Consolidated and Separate Financial Statements" endorsed by theFinancial Supervisory Commission. In addition, the information required to be disclosed in the combinedfinancial statements is included in the consolidated financial statements. Consequently, ACERINCORPORATED and its subsidiaries do not prepare a separate set of combined financial statements.
Hereby declare
ACER INCORPORATEDJason ChenChairman March 21, 2018

11049 5 7 68 ( 101 ) Telephone + 886 (2) 8101 6666Fax + 886 (2) 8101 6667Internet kpmg.com/tw
KPMG, a Taiwan partnership and a member firm of the KPMG network of independent member firms affiliated with KPMG International Cooperative ("KPMG International"), a Swiss entity.
KPMG
68F., TAIPEI 101 TOWER, No. 7, Sec. 5, Xinyi Road, Taipei City 11049, Taiwan (R.O.C.)


5
(English Translation of Consolidated Financial Statements and Report Originally Issued in Chinese)
ACER INCORPORATED AND SUBSIDIARIES
Consolidated Balance Sheets
December 31, 2017 and 2016
(Expressed in Thousands of New Taiwan Dollars)
December 31, 2017 December 31, 2016 Assets Amount % Amount %Current assets:
1100 Cash and cash equivalents (note 6(a) & (aa)) $ 33,970,331 22 44,289,673 27
1110 Financial assets at fair value through profit or loss-current (note6(b) & (aa)) 170,803 - 1,577,442 1
1125 Available-for-sale financial assets-current (note 6(c) & (aa)) 118,329 - 100,025 -
1147 Investments in debt instrument without an active market-current(note 6(d) & (aa)) 232,466 - 32,279 -
1170 Notes and accounts receivable, net (note 6(e) & (aa)) 46,761,383 30 44,230,305 27
1180 Accounts receivable from related parties (note 6(e) & (aa) and 7) 126,903 - 81,975 -
1200 Other receivables (note 6(e) & (aa)) 1,023,908 1 738,719 -
1210 Other receivables from related parties (note 6(e) & (aa) and 7) 97 - 6,737 -
1220 Current income tax assets 570,537 - 587,864 -
130X Inventories (note 6(f)) 40,079,221 25 39,095,487 24
1460 Non-current assets held for sale, net (note 6(g)) 161,990 - - -
1470 Other current assets (note 6(m)) 3,078,330 2 3,122,630 2
Total current assets 126,294,298 80 133,863,136 81
Non-current assets:
1510 Financial assets at fair value through profit or loss-non-current(note 6(b) & (aa)) - - 70,340 -
1523 Available-for-sale financial assets-non-current (note 6(c) & (aa)) 5,252,341 3 4,272,766 3
1546 Investments in debt instrument without an active market-non-current (note 6(d) & (aa)) 308,444 - 178,238 -
1550 Investments accounted for using equity method (note 6(h)) 569,405 - 416,343 -
1600 Property, plant and equipment (note 6(j) and 8) 4,106,559 3 4,321,152 3
1760 Investment property (note 6(k)) 1,141,199 1 1,180,317 1
1780 Intangible assets (note 6(l)) 17,184,151 11 18,595,922 11
1840 Deferred income tax assets (note 6(s)) 656,478 - 662,277 -
1900 Other non-current assets (note 6(m) & (r)) 1,101,079 1 1,152,928 1
1980 Other financial assets-non-current (note 6(aa) and 8) 998,817 1 960,643 -
Total non-current assets 31,318,473 20 31,810,926 19
Total assets $ 157,612,771 100 165,674,062 100
See accompanying notes to financial statements.

5-1
(English Translation of Consolidated Financial Statements and Report Originally Issued in Chinese)
ACER INCORPORATED AND SUBSIDIARIES
Consolidated Balance Sheets (Continued)
December 31, 2017 and 2016
(Expressed in Thousands of New Taiwan Dollars)
December 31, 2017 December 31, 2016
Liabilities and Equity Amount % Amount %
Current liabilities:
2100 Short-term borrowings (note 6(n), (aa) & (ab)) $ 482,894 - 103,000 -
2120 Financial liabilities at fair value through profit or loss-current(note 6(b), (aa) & (ab)) 621,947 - 112,606 -
2170 Notes and accounts payable (note 6(aa) & (ab)) 42,749,799 27 52,866,900 32
2180 Accounts payable to related parties (note 6(aa) & (ab) and 7) 1,183 - 3,514 -
2200 Other payables (note 6(d),(x),(aa) & (ab) ) 37,219,141 24 37,104,994 22
2250 Provisions-current (note 6(p) and 9) 6,656,001 4 6,476,306 4
2322 Current portion of long-term debt (note 6(o), (aa) & (ab) and 8) 2,701,958 2 6,000,000 4
2399 Other current liabilities 2,807,010 2 2,754,355 2
Total current liabilities 93,239,933 59 105,421,675 64
Non-current liabilities:
2540 Long-term debt (notes 6(o), (aa) & (ab) and 8) 3,300,499 2 - -
2550 Provisions-non-current (note 6(p) and 9) 45,692 - 60,520 -
2570 Deferred income tax liabilities (note 6(s)) 1,040,696 1 692,713 -
2600 Other non-current liabilities (note 6(r)) 2,010,545 1 1,820,676 1
Total non-current liabilities 6,397,432 4 2,573,909 1
Total liabilities 99,637,365 63 107,995,584 65
Equity (note 6(t) & (u)):
3110 Common stock 30,765,028 19 30,807,328 19
3200 Capital surplus 29,852,184 19 34,743,105 21
Retained earnings:
3310 Legal reserve - - 145,190 -
3320 Special reserve - - 1,306,709 1
3351 Unappropriated earnings (accumulated deficit) 2,815,587 2 (4,900,296) (3)
3400 Other equity (3,198,500) (2) (1,512,785) (1)
3500 Treasury stock (2,914,856) (2) (2,914,856) (2)
Equity attributable to shareholders of the Company 57,319,443 36 57,674,395 35
36XX Non-controlling interests 655,963 1 4,083 -
Total equity 57,975,406 37 57,678,478 35
Total liabilities and equity $ 157,612,771 100 165,674,062 100
See accompanying notes to financial statements.

6
(English Translation of Consolidated Financial Statements and Report Originally Issued in Chinese)
ACER INCORPORATED AND SUBSIDIARIES
Consolidated Statements of Comprehensive Income (Loss)
For the years ended December 31, 2017 and 2016
(Expressed in Thousands of New Taiwan Dollars , Except for Earnings Per Share)
2017 2016
Amount % Amount %
4000 Revenue (note 6(p) & (w), 7 and 14) $ 237,274,883 100 232,724,161 1005000 Cost of revenue (note 6(f), (j), (l), (p), (q) & (r), 7 and 12) 211,913,649 89 209,511,703 90
Gross profit 25,361,234 11 23,212,458 10Operating expenses(note 6(e), (j), (k), (l), (p), (q), (r), (u) & (x), 7 and 12)
6100 Selling expenses 14,855,347 6 16,097,142 76200 Administrative expenses 4,547,263 2 4,153,928 16300 Research and development expenses 2,497,868 1 2,048,469 1
Total operating expenses 21,900,478 9 22,299,539 96500 Other operating income and loss-net (note 6(q) & (y)) 208,978 - 279,594 -
Operating income 3,669,734 2 1,192,513 1Non-operating income and loss:
7010 Other income (note 6(z)) 525,760 - 435,145 -7020 Other gains and losses-net (note 6(d), (i), (z) & (aa)) (574,381) (1) 280,488 -7050 Finance costs (note 6(z)) (225,832) - (250,257) -7060 Share of profits (losses) of associates and joint ventures (note 6(h)) (38,629) - (17,970) -7673 Reversal of impairment loss on property, plant and equipment (note 6(g)) 82,480 - - -7675 Loss on impairment of intangible assets (note 6(l)) - - (6,364,244) (3)
Total non-operating income and loss (230,602) (1) (5,916,838) (3)7900 Income (loss) before taxes 3,439,132 1 (4,724,325) (2)7950 Income tax expense (note 6(s)) 642,399 - 176,415 -
Net income (loss) 2,796,733 1 (4,900,740) (2)Other comprehensive income (loss) (note 6(r), (s), (t) & (aa)):
8310 Items that will not be reclassified subsequently to profit or loss:8311 Remeasurements of defined benefit plans (35,445) - (42,601) -8349 Income tax benefit related to items that will not be reclassified subsequently
to profit or loss 11,050 - 29,720 -(24,395) - (12,881) -
8360 Items that may be reclassified subsequently to profit or loss:8361 Exchange differences on translation of foreign operations (2,132,038) (1) (2,493,748) (1)8362 Change in fair value of available-for-sale financial assets 457,886 - 756,795 -8370 Share of other comprehensive income of associates and joint ventures
(note 6 (19)) 741 - (2,875) -8399 Income tax benefit related to items that may be reclassified subsequently to
profit or loss 18 - 353 -(1,673,393) (1) (1,739,475) (1)
Other comprehensive loss for the year, net of taxes (1,697,788) (1) (1,752,356) (1) Total comprehensive income (loss) for the year $ 1,098,945 - (6,653,096) (3)Net income (loss) attributable to:
8610 Shareholders of the Company $ 2,815,587 1 (4,900,296) (2)8620 Non-controlling interests (18,854) - (444) -
$ 2,796,733 1 (4,900,740) (2)Total comprehensive income (loss) attributable to:
8710 Shareholders of the Company $ 1,115,222 - (6,654,809) (3)8720 Non-controlling interests (16,277) - 1,713 -
$ 1,098,945 - (6,653,096) (3)Earnings (loss) per share (in New Taiwan dollars) (note 6(v)) :
9750 Basic earnings (loss) per share $ 0.93 (1.62)9850 Diluted earnings (loss) per share $ 0.93 (1.62)
See accompanying notes to financial statements.

7
(English Translation of Consolidated and Report Originally Issued in Chinese)
ACER INCORPORATED AND SUBSIDIARIES
Consolidated Statements of Changes in Equity
For the years ended December 31, 2017 and 2016
(Expressed in Thousands of New Taiwan Dollars)
Equity attributable to owners of parentRetained earnings Other equity interest
Commonstock
Capitalsurplus
Legalreserve
Specialreserve
Unappropriatedearnings
(accumulateddeficit) Total
Foreigncurrency
translationdifferences
Unrealizedgain (loss)
from available-for-sale
financial assets
Remeasurementsof defined benefit
plans
Unearnedcompensationcost arising
from restrictedshares of stock
issued toemployees Total
Treasurystock Total
Non-controlling
interests
Totalequity
Balance at January 1, 2016 $ 30,854,428 36,232,755 93,166 838,498 520,235 1,451,899 1,437,412 (1,104,565) (64,376) (39,966) 228,505 (2,914,856) 65,852,731 2,370 65,855,101
Appropriation approved by the stockholders:
Legal reserve - - 52,024 - (52,024) - - - - - - - - - -
Special reserve - - - 468,211 (468,211) - - - - - - - - - -
Other changes in capital surplus:
Change in equity of investments in associates - (19,743) - - - - - - - - - - (19,743) - (19,743)
Cash distributed from capital surplus - (1,517,007) - - - - - - - - - - (1,517,007) - (1,517,007)
Compensation cost arising from restricted sharesof stock issued to employees - - - - - - - - - 13,223 13,223 - 13,223 - 13,223
Retirement of restricted shares of stock issued toemployees (47,100) 47,100 - - - - - - - - - - - - -
Net loss in 2016 - - - - (4,900,296) (4,900,296) - - - - - - (4,900,296) (444) (4,900,740)
Other comprehensive income (loss) for the period - - - - - - (2,498,427) 756,795 (12,881) - (1,754,513) - (1,754,513) 2,157 (1,752,356)
Total comprehensive income (loss) for the period - - - - (4,900,296) (4,900,296) (2,498,427) 756,795 (12,881) - (1,754,513) - (6,654,809) 1,713 (6,653,096)
Balance at December 31, 2016 30,807,328 34,743,105 145,190 1,306,709 (4,900,296) (3,448,397) (1,061,015) (347,770) (77,257) (26,743) (1,512,785) (2,914,856) 57,674,395 4,083 57,678,478
Appropriation approved by the stockholders:
Decrease in legal reserve to offset accumulateddeficits - - (145,190) - 145,190 - - - - - - - - - -
Decrease in special reserve to offsetaccumulated deficits - - - (1,306,709) 1,306,709 - - - - - - - - - -
Decrease in capital surplus to offsetaccumulated deficits - (3,448,397) - - 3,448,397 3,448,397 - - - - - - - - -
Other changes in capital surplus:
Change in equity of investments in associates - 28,571 - - - - - - - - - - 28,571 19 28,590
Cash distributed from capital surplus - (1,515,071) - - - - - - - - - - (1,515,071) - (1,515,071)
Changes in ownership interests in subsidiaries - 1,653 - - - - - - - - - - 1,653 (1,653) -
Acquisition of subsidiaries - - - - - - - - - - - - - 649,886 649,886
Capital injection from non-controlling interests - - - - - - - - - - - - - 19,893 19,893
Compensation cost arising from restricted sharesof stock issued to employees - - - - - - - - - 14,650 14,650 - 14,650 - 14,650
Retirement of restricted shares of stock issued toemployees (42,300) 42,300 - - - - - - - - - - - - -
Stock option compensation cost of subsidiary - 23 - - - - - - - - - - 23 12 35
Net income in 2017 - - - - 2,815,587 2,815,587 - - - - - - 2,815,587 (18,854) 2,796,733
Other comprehensive income (loss) for the period - - - - - - (2,141,146) 459,805 (19,024) - (1,700,365) - (1,700,365) 2,577 (1,697,788)
Total comprehensive income (loss) for the period - - - - 2,815,587 2,815,587 (2,141,146) 459,805 (19,024) - (1,700,365) - 1,115,222 (16,277) 1,098,945
Balance at December 31, 2017 $ 30,765,028 29,852,184 - - 2,815,587 2,815,587 (3,202,161) 112,035 (96,281) (12,093) (3,198,500) (2,914,856) 57,319,443 655,963 57,975,406
See accompanying notes to financial statements.

8
(English Translation of Consolidated Financial Statements and Report Originally Issued in Chinese)
ACER INCORPORATED AND SUBSIDIARIES
Consolidated Statements of Cash Flows
For the years ended December 31, 2017 and 2016
(Expressed in Thousands of New Taiwan Dollars)
2017 2016
Cash flows from operating activities:
Income (loss) before income taxes $ 3,439,132 (4,724,325)
Adjustments for:
Depreciation 508,866 613,178
Amortization 563,486 851,398
Interest expense 225,832 250,257
Interest income (304,605) (210,263)
Dividend income (221,155) (224,882)
Share-based compensation cost 14,685 13,223
Effects of exchange rate changes in investments in debt instrumentwithout an active market (7,000) 11,597
Share of losses of associates and joint ventures 38,629 17,970
Loss on disposal of property, plant and equipment 5,817 7,800
Gain on disposal of intangible assets (32) -
Gain on disposal of investments accounted for using equity method (690) -
Gain on bargain purchase (1,130) -
Other investment loss 36,183 5,861
Impairment loss on non-financial assets - 6,364,244
Impairment loss on financial assets 3,061 -
Reversal of impairment loss on property, plant and equipment (82,480) -
Intangible assets reclassified to expenses 602 -
Total profit and loss 780,069 7,700,383
Changes in operating assets and liabilities:
Net changes in operating assets:
Derivative financial instruments 1,986,320 (936,275)
Notes and accounts receivable (2,264,268) 3,942,722
Receivables from related parties (44,928) (29,226)
Inventories (817,920) (5,072,154)
Other receivables and other current assets (61,070) 498,796
Non-current accounts receivable 33,429 (33,429)
Net changes in operating assets (1,168,437) (1,629,566)
Net changes in operating liabilities:
Notes and accounts payable (10,342,558) 10,130,003
Payables to related parties (2,331) (7,856)
Other payables and other current liabilities (202,344) (2,364,099)
Provisions 125,554 (537,825)
Other non-current liabilities 127,706 (810)
Net changes in operating liabilities (10,293,973) 7,219,413
Total changes in operating assets and liabilities (11,462,410) 5,589,847
Cash provided by (used in) operations (7,243,209) 8,565,905
Interest received 247,245 193,954
Income taxes paid (366,162) (488,234)
Net cash provided by (used in) operating activities (7,362,126) 8,271,625
See accompanying notes to financial statements.

8-1
(English Translation of Financial Report Originally Issued in Chinese)
ACER INCORPORATED AND SUBSIDIARIES
Consolidated Statements of Cash Flows (Continued)
For the years ended December 31, 2017 and 2016
(Expressed in Thousands of New Taiwan Dollars)
2017 2016
Cash flows from investing activities:
Purchase of available-for-sale financial assets (314,312) (429,439)
Proceeds from disposal of available-for-sale financial assets - 16,884
Proceeds from capital return of available-for-sale financial assets 15,691 40,948
Purchase of investments in debt instrument without an active market (12,698) (332,094)
Proceeds from repayments of investments in debt instrument without anactive market 10,229 -
Decrease (increase) in advances to related parties 6,640 (6,461)
Acquisition of investments accounted for using equity method (295,714) (295,056)
Proceeds from disposal of investments accounted for using equity method 899 -
Additions to property, plant and equipment (282,394) (164,670)
Proceeds from disposal of property, plant and equipment 24,121 13,111
Additions to intangible assets (38,846) (5,070)
Proceeds from disposal of intangible assets 1,749 -
Net cash received from acquisition of subsidiaries 496,674 -
Increase in other non-current financial assets and other non-current assets (195,471) (183,818)
Dividend received 242,727 224,882
Net cash used in investing activities (340,705) (1,120,783)
Cash flows from financing activities:
Decrease in short-term borrowings (50,828) (2,481,377)
Repurchase of bonds payable - (6,000,000)
Increase in long-term debt 3,300,000 6,000,000
Repayment of long-term debt (3,300,334) (1,800,000)
Cash distributed from capital surplus (1,515,071) (1,517,007)
Capital injection from non-controlling interest 19,893 -
Interest paid (257,938) (208,722)
Net cash used in financing activities (1,804,278) (6,007,106)
Effects of foreign exchange rate changes (812,233) (1,475,590)
Net decrease in cash and cash equivalents (10,319,342) (331,854)
Cash and cash equivalents at beginning of year 44,289,673 44,621,527
Cash and cash equivalents at end of year $ 33,970,331 44,289,673
See accompanying notes to financial statements.

9
(English Translation of Consolidated Financial Statements and Report Originally Issued in Chinese)
ACER INCORPORATED AND SUBSIDIARIES
Notes to Consolidated Financial Statements
For the years ended December 31, 2017 and 2016
(Expressed in Thousands of New Taiwan Dollars, Unless Otherwise Specified)
1. Organization and business
Acer Incorporated (the “Company”) was incorporated on August 1, 1976, as a company limited by sharesunder the laws of the Republic of China (“ R.O.C.” ) and registered under the Ministry of EconomicAffairs, R.O.C. On October 15, 2007, the Company completed acquisition of 100% equity ownership ofGateway, Inc. (including eMachines brand), a personal computer company in the U.S. The Company alsoacquired 100% equity ownership of Packard Bell B.V., a personal computer company in Europe on March14, 2008. Additionally, on September 1, 2008, the Company acquired 100% equity ownership of E-TenInformation Systems Co., Ltd. In October 2010, in order to expand into the market in China, the Companyacquired the PC business, management team and employees, and regional sales and marketing channels ofFounder Technology Group Corporation. On January 12, 2012, the Company acquired 100% equityownership of iGware Inc. to enhance Acer brand positioning and increase its brand value, as well astransforming it into an enterprise who provides hardware, software and service to clients. On October 20,2017, the Company increased its ownership interest in StarVR Corporation, formerly a joint venture of theCompany, and obtained the control over it in order to accelerate the Company’ s deployment in virtualreality (VR). In addition, on November 24, 2017, the Company acquired the equity ownership of AOPENInc. to strengthen its resource integration and build a smart cloud digital signage business.
The Company primarily engages in the marketing and sale of the aforementioned brand-name IT products,as well as providing electronic information services to its clients. The Company aims at the integratedapplications of Internet of Things (IoT) and service-oriented technology in the future to provide moreproducts and integrated applications combining software, hardware and service for consumer, as well ascommercial markets.
2. Authorization of the Consolidated Financial Statements
These consolidated financial statements were authorized for issuance by the Board of Directors on March21, 2018.
3. Application of New and Revised Accounting Standards and Interpretations:
(a) Impact of adoption of new, revised or amended standards and interpretations endorsed by theFinancial Supervisory Commission, R.O.C. (“FSC”).
In preparing the accompanying consolidated financial statements, the Group has adopted thefollowing International Financial Reporting Standards (“IFRS”), International Accounting Standards(“IAS”), and Interpretations that have been issued by the International Accounting Standards Board(“ IASB” ) (collectively, “ IFRSs” ) and endorsed by the FSC, with effective date from January 1,2017.
New, Revised or Amended Standards and InterpretationsEffective date
per IASBAmendments to IFRS 10, IFRS 12 and IAS 28 Investment Entities: Applying theConsolidation Exception
January 1, 2016
Amendments to IFRS 11 Accounting for Acquisitions of Interests in JointOperations
January 1, 2016
(Continued)

10
ACER INCORPORATED AND SUBSIDIARIES
Notes to Consolidated Financial Statements
New, Revised or Amended Standards and InterpretationsEffective date
per IASBIFRS 14 Regulatory Deferral Accounts January 1, 2016
Amendment to IAS 1 Presentation of Financial Statements-DisclosureInitiative
January 1, 2016
Amendments to IAS 16 and IAS 38 Clarification of Acceptable Methods ofDepreciation and Amortization
January 1, 2016
Amendments to IAS 16 and IAS 41 Agriculture: Bearer Plants January 1, 2016
Amendments to IAS 19 Defined Benefit Plans: Employee Contributions July 1, 2014
Amendment to IAS 27 Equity Method in Separate Financial Statement” January 1, 2016
Amendments to IAS 36 Impairment of Non-Financial assets-RecoverableAmount Disclosures for Non-Financial Assets
January 1, 2014
Amendments to IAS 39 Financial Instruments-Novation of Derivatives andContinuation of Hedge Accounting
January 1, 2014
Annual Improvements to IFRSs 2010 2012 Cycle and 2011 2013 Cycle July 1, 2014
Annual Improvements to IFRSs 2012 2014 Cycle January 1, 2016
IFRIC 21 Levies January 1, 2014
The initial application of the above IFRSs has not had a material impact on the Group’s consolidatedfinancial statements.
(b) Impact of IFRS endorsed by FSC but not yet in effect
According to Ruling No. 1060025773 issued by the FSC on July 14, 2017, commencing from 2018,the Company is required to adopt the IFRSs that have been endorsed by the FSC with effective datefrom January 1, 2018. The related new, revised or amended standards and interpretations are set outbelow:
New, Revised or Amended Standards and InterpretationsEffective date
per IASBAmendments to IFRS 2 Clarifications of Classification and Measurement ofShare-based Payment Transactions
January 1, 2018
Amendments to IFRS 4 Applying IFRS 9 Financial Instruments with IFRS 4Insurance Contracts
January 1, 2018
IFRS 9 Financial Instruments January 1, 2018
IFRS 15 Revenue from Contracts with Customers January 1, 2018
Amendments to IAS 7 Statement of Cash Flows -Disclosure Initiative January 1, 2017
Amendments to IAS 12 Income Taxes-Recognition of Deferred Tax Assets forUnrealized Losses
January 1, 2017
Amendments to IAS 40 Transfers of Investment Property January 1, 2018
Annual Improvements to IFRSs 2014–2016 Cycle:
Amendments to IFRS 12 January 1, 2017
Amendments to IFRS 1 and Amendments to IAS 28 January 1, 2018
(Continued)

11
ACER INCORPORATED AND SUBSIDIARIES
Notes to Consolidated Financial Statements
New, Revised or Amended Standards and InterpretationsEffective date
per IASBIFRIC 22 Foreign Currency Transactions and Advance Consideration January 1, 2018
Except for the items discussed below, the Group believes that the initial adoption of the above IFRSswould not have any material impact on its consolidated financial statements. The extent and impactof signification changes are as follows:
(i) IFRS 9 Financial Instruments
The new standard will replace IAS 39 Financial Instruments: Recognition and Measurement.The standard contains classification and measurement (including measurement of financialinstruments) and introduces a new hedge accounting model.
1) Classification and measurement of financial assets
IFRS 9 contains a new classification and measurement approach for financial assets thatreflects the business model in which assets are managed and their cash flowcharacteristics. IFRS 9 contains three principal classification categories for financialassets: measured at amortized cost, fair value through other comprehensive income(FVOCI) and fair value through profit or loss (FVTPL). The standard eliminates theclassification of financial assets under IAS 39 which are held to maturity, loans andreceivables and available-for-sale. Under IFRS 9, if a hybrid contract contains a host thatis within the scope of IFRS 9, the embedded derivatives would not be separated from thehost contract; instead, the entire hybrid contract is assessed for the classification.
Based on the Group’ s assessment, the application of new classification requirementwould not have material impact to the accounting treatment of accounts receivable,investments in debt instruments and investments in equity instruments which aremanaged on a fair value basis. As of December 31, 2017, the Group had investments in
equity instruments classified as available-for-sale, with a fair value of $5,370,670, whichwere held for long-term strategic purposes. At initial application of IFRS 9, the Grouphas designated these investments as measured at FVOCI. Consequently, all gains andlosses arising from fair value changes will be reported in other comprehensive income,no impairment losses would be recognized in profit or loss and no gains or losses will bereclassified to profit or loss on disposal. In addition, as of December 31, 2017, the Grouphad investments in debt instruments, classified as investment in debt instrument without
an active market, of $540,910, which will be reclassified as FVTPL under IFRS 9, as thecontractual cash flow is not solely for the payments of principal and interest on theprincipal amount outstanding. The Group estimated that the application of classification
requirements under IFRS 9 would result in an increase in retained earnings of $2,245 onJanuary 1, 2018.
2) Impairment of Financial assets and contract assets
IFRS 9 replaces the ‘ incurred loss’ model in IAS 39 with a forward-looking ‘expectedcredit loss’ (ECL) model. This will require considerable judgment as to how changes ineconomic factors affect ECLs, which will be determined on a probability-weighted basis.
(Continued)

12
ACER INCORPORATED AND SUBSIDIARIES
Notes to Consolidated Financial Statements
The new impairment model will apply to financial assets measured at amortized cost orFVOCI, except for investments in equity instruments, and to contract assets.
Under IFRS 9, loss allowances for financial assets will be measured on either of thefollowing bases:
12-month ECLs. These are ECLs that result from possible default events within the 12‧months after the reporting date; and
Lifetime ECLs. These are ECLs that result from all possible default events over the‧expected life of a financial instrument.
If the credit risk of a financial instrument has increased significantly since initialrecognition, a loss allowance is measured at an amount equal to lifetime expected creditlosses; if the credit risk has not significantly increased, the loss allowance is measured atan amount equal to the 12-month expected credit losses. If the financial instrument isdetermined to have low credit risk at the reporting date, it may assume that the credit riskthereof has not increased significantly since initial recognition. However, lifetimeexpected credit loss measurement always applies for trade receivables and contract assetswithout a significant financing component. The Group elected to apply the simplifiedapproach for trade receivables and contract assets to measure the loss allowance at anamount equal to lifetime expected credit losses.
The Group believes that the impairment loss for the assets within the scope of IFRS 9 islikely to increase and become more fluctuant under the new measurement model. Uponthe initial application of IFRS 9, the loss allowance and retained earnings is expected to
increase/decrease by $66,524 on January 1, 2018.
3) Disclosures
IFRS 9 includes extensive disclosure requirements, particularly the disclosure of hedgeaccounting, credit risk and expected credit losses. The Group’s assessment included ananalysis from the current internal process to identify the data gaps and the Group plannedto modify the system as well as the internal control process to obtain the required data.
4) Transition
Changes in accounting policies resulting from the application of IFRS 9 will generally beapplied retrospectively, except as described below.
The‧ Group will not restate its comparative information for the prior periods withrespect to the classification and measurement (including impairment) changes as aresult of the election of exemption. The cumulative effect of initially applying IFRS 9shall be recognized in retained earnings or other equity as at January 1, 2018.
The following assessments have to be made on the basis of the facts and circumstances‧that exist at the date of initial application.
– The business model within which a financial asset is held.
(Continued)

13
ACER INCORPORATED AND SUBSIDIARIES
Notes to Consolidated Financial Statements
– The designation and revocation of financial assets and financial liabilitiespreviously designated as measured at FVTPL.
– The designation of investments in equity instruments not held for trading asmeasured at FVOCI.
(ii) IFRS 15 Revenue from Contracts with Customers
IFRS 15 establishes a five-step model framework for determining whether, how much andwhen revenue is recognized. It replaces the existing revenue recognition guidance, includingIAS 18 Revenue and IAS 11 Construction Contracts and the related interpretations.
1) Sales of goods
Currently, revenue from the sale of goods is recognized when all the followingconditions have been satisfied: (a) the significant risks and rewards of the ownership ofthe goods have been transferred to the buyer, and the timing of the transfer of risks andrewards varies depending on the individual sales agreement and trade terms; (b) theGroup retains neither the continuing managerial involvement to the degree usuallyassociated with its ownership nor effective control over the goods sold; (c) the amount ofrevenue can be measured reliably; (d) it is probable that the economic benefits associatedwith the transaction will flow to the Group; and (e) the cost incurred or to be incurred inrespect of the transaction can be measured reliably. Under IFRS 15, revenue for the salesof goods is recognized when a customer obtains control of the goods. Based on theGroup’ s preliminary assessment, the timing of the transfer of risks and rewards of theownership of the goods to the buyer is similar to the timing that the customer obtain thecontrol of the goods; therefore, the application of IFRS 15 would not result in materialdifferences and impact in the timing of revenue recognition for the sale of goods.
2) Rending of services
The Group provides system implementation services to the customers and the relatedrevenue is currently recognized by reference to the stage of completion at the reportingdate. Under IFRS 15, it requires the Group to determine whether the performanceobligation is satisfied over time and revenue is recognized over time accordingly. TheGroup assessed that the application of IFRS 15 would not have any material difference inthe timing of revenue recognition for the rendering of its services.
3) Transition
The Group elected to apply IFRS 15 using the cumulative effect method. Therefore, thecomparative information will not be restated. The cumulative effect of initially applyingIFRS 15 will be recognized as an adjustment to its retained earnings at January 1, 2018.The Group chose to use the practical expedient for completed contracts, which means,contracts that are completed at the date of the initial application ( i.e. January 1, 2018)will not be restated.
(Continued)

14
ACER INCORPORATED AND SUBSIDIARIES
Notes to Consolidated Financial Statements
(iii) Amendments to IAS 7 Disclosure Initiative
The amendments require an entity to provide disclosures that enable users of financialstatements to evaluate changes in liabilities arising from financing activities, including bothchanges arising from cash flow and non-cash changes.
The Group expects to disclose a reconciliation between the opening and closing balances forliabilities with changes arising from financing activities to meet the abovementioned disclosurerequirements.
The actual impacts of adopting the abovementioned new standards may change depending on theeconomic conditions and events which may occur in the future.
(c) Impact of IFRS issued by IASB but not yet endorsed by the FSC
A summary of new standards and amendments issued by the IASB but not yet endorsed by the FSCis set out below:
New, Revised or Amended Standards and InterpretationsEffective date
per IASBAmendments to IFRS 10 and IAS 28 Sale or Contribution of Assets Between anInvestor and Its Associate or Joint Venture
Effective date tobe determinedby IASB
IFRS 16 Leases January 1, 2019
IFRS 17 Insurance Contracts January 1, 2021
IFRIC 23 Uncertainty over Income Tax Treatments January 1, 2019
Amendments to IFRS 9 Prepayment features with negative compensation January 1, 2019
Amendments to IAS 28 Long-term interests in associates and joint ventures January 1, 2019
Annual Improvements to IFRSs 2015–2017 Cycle January 1, 2019
Amendments to IAS 19 Plan Amendment, Curtailment or Settlement January 1, 2019
(Continued)

15
ACER INCORPORATED AND SUBSIDIARIES
Notes to Consolidated Financial Statements
Those which may be relevant to the Group are set out below:
Issuance / ReleaseDates
Standards orInterpretations Content of amendment
January 13, 2016 IFRS 16 Leases The new standard of accounting for lease isamended as follows:
‧ For a contract that is, or contains, a lease,the lessee shall recognize a right of useasset and a lease liability in the balancesheet. In the statement of profit or loss andother comprehensive income, a lesseeshall present interest expense accrued onthe lease liability separately from thedepreciation expense charged on the right-of-use asset during the lease term.
‧ A lessor classifies a lease as either afinance lease or an operating lease, andtherefore, the accounting remains similarto IAS 17.
June 7, 2017 IFRIC 23 “Uncertainty overIncome Tax Treatments”
‧ In assessing whether and how an uncertaintax treatment affects the determination oftaxable profit (tax loss), tax bases, unusedtax losses, unused tax credits and taxrates, an entity shall assume that a taxationauthority will examine the amounts it hasthe right to examine and have a fullknowledge on all related informationwhen making those examinations.
‧ If an entity concludes that it is probablethat the taxation authority will accept anuncertain tax treatment, the entity shalldetermine the taxable profit (tax loss), taxbases, unused tax losses, unused taxcredits or tax rates consistently with thetax treatment used or planned to be usedin its income tax filings. Otherwise, anentity shall reflect the effect of uncertaintyfor each uncertain tax treatment by usingeither the most likely amount or theexpected value, depending on whichmethod the entity expects to better predictthe resolution of the uncertainty.
The Group is currently evaluating the impact on its financial position and financial performanceupon the initial adoption of the abovementioned standards or interpretations. The results thereof willbe disclosed when the Group completes its evaluation.
(Continued)

16
ACER INCORPORATED AND SUBSIDIARIES
Notes to Consolidated Financial Statements
4. Summary of significant accounting policies
The significant accounting policies presented in the consolidated financial statements are summarized asfollows and have been applied consistently to all periods presented in these financial statements.
(a) Statement of compliance
The Group’ s accompanying consolidated financial statements have been prepared in accordancewith the “ Regulations Governing the Preparation of Financial Reports by Securities Issuers” (the“ Regulations” ) and the IFRSs, IASs, IFRIC Interpretations and SIC Interpretations endorsed andissued into effect by the FSC (collectively as “Taiwan-IFRSs”).
(b) Basis of preparation
(i) Basis of measurement
The accompanying consolidated financial statements have been prepared on a historical costbasis except for the following items in the balance sheets:
1) Financial instruments measured at fair value through profit or loss (including derivativefinancial instruments);
2) Available-for-sale financial assets measured at fair value; and3) Defined benefit assets (liabilities) recognized as the present value of the benefit
obligation less the fair value of plan assets and the effect of the asset ceiling mentionedin note 4(s).
(ii) Functional and presentation currency
The functional currency of each Group entity is determined based on the primary economicenvironment in which the entity operates. The Group’s consolidated financial statements arepresented in New Taiwan dollars, which is the Company’s functional currency. Except whenotherwise indicated, all financial information presented in New Taiwan dollars has beenrounded to the nearest thousand.
(c) Basis of consolidation
(i) Principles of preparation of the consolidated financial statements
The accompanying consolidated financial statements incorporate the financial statements ofthe Company and its controlled entities (the subsidiaries) in which the Company is exposed, orhas right, to variable returns from its involvement with the investee and has the ability to affectthose returns through its power over the investee.
The financial statements of the subsidiaries are included in the consolidated financialstatements from the date that control commences until the date that control ceases. Allsignificant inter-company balances, transactions and resulting unrealized income and loss areeliminated on consolidation. Total comprehensive income (loss) of a subsidiary is attributed tothe shareholders of the Company and the non-controlling interests even if this results in thenon-controlling interests having a deficit balance.
(Continued)

17
ACER INCORPORATED AND SUBSIDIARIES
Notes to Consolidated Financial Statements
When necessary, the financial statements of subsidiaries are adjusted to align their accountingpolicies with those adopted by the Company.
Changes in the Group’s ownership interest in a subsidiary that do not result in a loss of controlare accounted for as equity transactions. The difference between the adjustment of the non-controlling interests and the fair value of the consideration paid or received is recognized inequity and attributed to the shareholders of the Company.
When the Group loses control of a subsidiary, a gain or loss is recognized in profit or loss,which is calculated as the difference between (1) the aggregate of the fair value ofconsideration received and the fair value of any retained interest at the date when control islost, and (2) the previous carrying amount of the former subsidiary's assets (includinggoodwill), liabilities and non-controlling interest at the date when the Group loses control. Allamounts recognized in other comprehensive income in relation to the subsidiary are accountedfor on the same basis as would be required if the Group had directly disposed of the relatedassets and liabilities.
The fair value of any investment retained in a former subsidiary at the date when control is lostis regarded as the cost on initial recognition of an available-for-sale financial asset or aninvestment in an associate.
(ii) List of subsidiaries included in the consolidated financial statements
The subsidiaries included in the consolidated financial statements at the end of the reportingperiod were as follows:
Percentage of Ownership Name ofInvestor Name of Investee
Main Business andProducts
December 31,2017
December 31,2016
The Company Acer Greater China (B.V.I.) Corp.(“AGC”, British Virgin Islands)
Investment and holdingactivity
%100.00 %100.00
AGC Acer Market Services Limited (“AMS”,Hong Kong)
Investment and holdingactivity
%100.00 %100.00
AGC Acer Computer (Far East) Limited(“AFE”, Hong Kong)
Sale of brand-name ITproducts
%100.00 %100.00
AMS Acer Information (Zhong Shan) Co.,Ltd. (“AIZS”, China)
Sale of brand-name ITproducts
%100.00 %100.00
AMS Beijing Acer Information Co., Ltd.(“BJAI”, China)
Sale of brand-name ITproducts
- %100.00
AMS Acer Computer (Shanghai) Ltd.(“ACCN”, China)
Sale of brand-name ITproducts
%100.00 %100.00
AMS Acer (Chongqing) Ltd. (“ACCQ”,China)
Sale of brand-name ITproducts
%100.00 %100.00
The Company Acer European Holdings SA (“AEH”,Switzerland)
Investment and holdingactivity
%100.00 %100.00
AEH Acer Europe B.V. (“AHN”, theNetherlands)
Investment and holdingactivity
%100.00 %100.00
ASIN andAEH
Acer CIS Incorporated (“ACR”, BritishVirgin Islands)
Sale of brand-name ITproducts
%100.00 %100.00
AEH Acer BSEC Incorporated (“AUA”,British Virgin Islands)
Sale of brand-name ITproducts
- %100.00
AEH Acer Computer (M.E.) Ltd. (“AME”,British Virgin Islands)
Sale of brand-name ITproducts
%100.00 %100.00
AEH Acer Africa (Proprietary) Limited(“AAF”, South Africa)
Marketing, repair andmaintenance of brand-name IT products
%100.00 %100.00
(Continued)

18
ACER INCORPORATED AND SUBSIDIARIES
Notes to Consolidated Financial Statements
Percentage of Ownership Name ofInvestor Name of Investee
Main Business andProducts
December 31,2017
December 31,2016
AEH AGP Insurance (Guernsey) Limited(“AGU”, Guernsey)
Insurance captive %100.00 %100.00
AEH Acer Sales International SA (“ASIN”,Switzerland)
Sale of brand-name ITproducts
%100.00 %100.00
AHN Acer Computer France S.A.S.U.(“ACF”, France)
Sale of brand-name ITproducts
%100.00 %100.00
AHN Acer U.K. Limited (“AUK”, the UnitedKingdom)
Sale of brand-name ITproducts
%100.00 %100.00
AHN Acer Italy S.R.L. (“AIT”, Italy) Sale of brand-name ITproducts
%100.00 %100.00
AHN Acer Computer GmbH (“ACG”,Germany)
Sale of brand-name ITproducts
%100.00 %100.00
AHN Acer Austria GmbH (“ACV”, Austria) Marketing of brand-name IT products
%100.00 %100.00
AHN Acer Europe SA (“AEG”, Switzerland) Sale of brand-name ITproducts
%100.00 %100.00
AHN Acer Czech Republic S.R.O. (“ACZ”,Czech Republic)
Marketing, repair andmaintenance of brand-name IT products
%100.00 %100.00
AHN Acer Computer Iberica, S.A. (“AIB”,Spain)
Sale of brand-name ITproducts
%100.00 %100.00
AHN Acer Computer (Switzerland) AG(“ASZ”, Switzerland)
Sale of brand-name ITproducts
%100.00 %100.00
AHN Acer Slovakia s.r.o. (“ASK”, Slovakia) Sale of brand-name ITproducts
%100.00 %100.00
AHN Asplex Sp. z.o.o. (“APX”, Poland) Repair and maintenanceof brand-name ITproducts
%100.00 %100.00
AHN Acer Marketing Services LLC (“ARU”,Russia)
Marketing of brand-name IT products
%100.00 %100.00
AHN Acer Hellas Limited Liability Companyof Marketing and Sales Services(“AGR”, Greece)
Marketing of brand-name IT products
- %100.00
AHN Acer Poland sp. z.o.o. (“APL”, Poland) Marketing of brand-name IT products
%100.00 %100.00
AHN Acer Bilisim Teknolojileri LimitedSirketi (“ATR”, Turkey)
Marketing of brand-name IT products
%100.00 %100.00
AHN Acer Computer B.V. (“ACH”, theNetherlands)
Sale of brand-name ITproducts
%100.00 %100.00
AHN Sertec 360 SA (“SER”, Switzerland) Repair and maintenanceof IT products
%100.00 %100.00
ACH Acer Computer Norway AS (“ACN”,Norway)
Marketing, repair andmaintenance of brand-name IT products
%100.00 %100.00
ACH Acer Computer Finland Oy (“AFN”,Finland)
Marketing, repair andmaintenance of brand-name IT products
%100.00 %100.00
ACH Acer Computer Sweden AB (“ACW”,Sweden)
Marketing of brand-name IT products
%100.00 %100.00
ACH Acer Denmark A/S (“ACD”, Denmark) Marketing of brand-name IT products
%100.00 %100.00
The Companyand AEH
Boardwalk Capital Holdings Limited(“Boardwalk”, British Virgin Islands)
Investment and holdingactivity
%100.00 %100.00
Boardwalk Acer Computer Mexico, S.A. de C.V.(“AMEX”, Mexico)
Sale of brand-name ITproducts
%99.95 %99.95
Boardwalk Acer American Holdings Corp.(“AAH”, U.S.A.)
Investment and holdingactivity
%100.00 %100.00
(Continued)

19
ACER INCORPORATED AND SUBSIDIARIES
Notes to Consolidated Financial Statements
Percentage of Ownership Name ofInvestor Name of Investee
Main Business andProducts
December 31,2017
December 31,2016
Boardwalk AGP Tecnologia em Informatica doBrasil Ltda. (“ATB”, Brazil)
Sale of brand-name ITproducts
%100.00 %100.00
AMEX Aurion Tecnologia, S.A. de C.V.(“Aurion”, Mexico)
Service company %99.95 %99.95
AAH Acer Cloud Technology Inc. (“ACTI”,U.S.A.)
Investment and holdingactivity
%100.00 %100.00
ACTI Acer Cloud Technology (US), Inc.(“ACTUS”, U.S.A.)
Cloud technologyservice and research,development, anddesign of IoT platform
%100.00 %100.00
AAH Gateway, Inc. (“GWI”, U.S.A.) Investment and holdingactivity
%100.00 %100.00
GWI Acer America Corporation. (“AAC”,U.S.A.)
Sale of brand-name ITproducts
%100.00 %100.00
GWI Acer Service Corporation (“ASC”,U.S.A.)
Repair and maintenanceof brand-name ITproducts
%100.00 %100.00
The Company Acer Holdings International,Incorporated (“AHI”, British VirginIslands)
Investment and holdingactivity
%100.00 %100.00
AHI Acer Computer Co., Ltd. (“ATH”,Thailand)
Sale of brand-name ITproducts
%100.00 %100.00
AHI Acer Japan Corp. (“AJC”, Japan) Sale of brand-name ITproducts
%100.00 %100.00
AHI Acer Computer Australia Pty. Limited(“ACA”, Australia)
Sale of brand-name ITproducts
%100.00 %100.00
AHI Acer Sales and Services SDN BHD(“ASSB”, Malaysia)
Sale of brand-name ITproducts
%100.00 %100.00
AHI Acer Asia Pacific Sdn Bhd (“AAPH”,Malaysia)
Sale of brand-name ITproducts
%100.00 %100.00
AHI Acer Computer (Singapore) Pte. Ltd.(“ACS”, Singapore)
Sale of brand-name ITproducts
%100.00 %100.00
AHI Acer Computer New Zealand Limited(“ACNZ”, New Zealand)
Sale of brand-name ITproducts
%100.00 %100.00
AHI PT. Acer Indonesia (“AIN”, Indonesia) Sale of brand-name ITproducts
%100.00 %100.00
AIN PT. Acer Manufacturing Indonesia(“AMI”, Indonesia)
Assembly of brand-name IT products
%100.00 %100.00
AHI Acer India Private Limited (“AIL”,India)
Sale of brand-name ITproducts
%100.00 %100.00
AHI Acer Vietnam Co., Ltd. (“AVN”,Vietnam)
Sale of brand-name ITproducts
%100.00 %100.00
AHI Acer Philippines, Inc. (“APHI”,Philippines)
Sale of brand-name ITproducts
%100.00 %100.00
ASSB Highpoint Service Network Sdn Bhd(“HSN”, Malaysia)
Repair and maintenanceof IT products
%100.00 %100.00
ASSB Servex (Malaysia) Sdn Bhd (“SMA”,Malaysia)
Sale of computers andcommunicationproducts
%100.00 %100.00
The Company Weblink International Inc. (“WLII”,Taiwan)
Sale of computers andcommunicationproducts
%99.79 %99.79
WLII Weblink (H.K.) International Ltd.(“WHI”, Hong Kong)
Sale of computers andcommunicationproducts
%99.79 %99.79
(Continued)

20
ACER INCORPORATED AND SUBSIDIARIES
Notes to Consolidated Financial Statements
Percentage of Ownership Name ofInvestor Name of Investee
Main Business andProducts
December 31,2017
December 31,2016
WLII Wellife Inc. (“WELL”, Taiwan) Matchmaking ofprofessional services,platform of clientservice and sale ofproducts, and providingof professional seminarsand courses
%99.79 %99.79
WLII International Smart Union Corporation(“ISU”, Taiwan)
System integrationservice
%99.79 -
The Company Acer Digital Service Co. (“ADSC”,Taiwan)
Investment and holdingactivity
%100.00 %100.00
ADSC Acer Property Development Inc.(“APDI”, Taiwan)
Property development %100.00 %100.00
ADSC Aspire Service & Development Inc.(“ASDI”, Taiwan)
Property development %100.00 %100.00
The Company Acer Worldwide Incorporated (“AWI”,British Virgin Islands)
Investment and holdingactivity
%100.00 %100.00
The Company Cross Century Investment Limited(“CCI”, Taiwan)
Investment and holdingactivity
%100.00 %100.00
The Company Acer Digital Services (B.V.I.) HoldingCorp. (“ADSBH”, British VirginIslands)
Investment and holdingactivity
%100.00 %100.00
ADSBH Acer Digital Services (Cayman Islands)Corp. (“ADSCC”, Cayman Islands)
Investment and holdingactivity
%100.00 %100.00
ADSCC Longwick Enterprises Inc. (“LONG”,Seychelles)
Investment and holdingactivity
%100.00 %100.00
LONG S. Excel. Co., Ltd. (“SURE”, Samoa) Investment and holdingactivity
%100.00 %100.00
The Company Acer SoftCapital Incorporated(“ASCBVI”, British Virgin Islands)
Investment and holdingactivity
%100.00 %100.00
ASCBVI ASC Cayman, Limited (“ASCCAM”,Cayman Islands)
Investment and holdingactivity
%100.00 %100.00
The Company E-ten Information Systems Co., Ltd.(“ETEN”, Taiwan)
Research, design andsale of smart handheldproducts
%100.00 %100.00
The Company Acer BeingWare Holding Inc. (“ABH”,Taiwan)
Investment and holdingactivity
%100.00 %100.00
ABH Acer Cloud Technology (Taiwan) Inc.(“ACTTW”, Taiwan)
Development of Internetof Beings and cloudtechnology, andintegration of cloudtechnology, softwareand hardware
%100.00 %100.00
ABH Altos Computing Inc. (“ALT”, Taiwan)(Formerly Acer Being Health Inc.)
High performancecomputing, cloudcomputing, software-defined storage, and ITsolution
%100.00 %100.00
ABH MPS Energy Inc. (“MPS”, Taiwan) Research, development,and sale of batteries
%100.00 %100.00
(Continued)
21
ACER INCORPORATED AND SUBSIDIARIES
Notes to Consolidated Financial Statements
Percentage of Ownership Name ofInvestor Name of Investee
Main Business andProducts
December 31,2017
December 31,2016
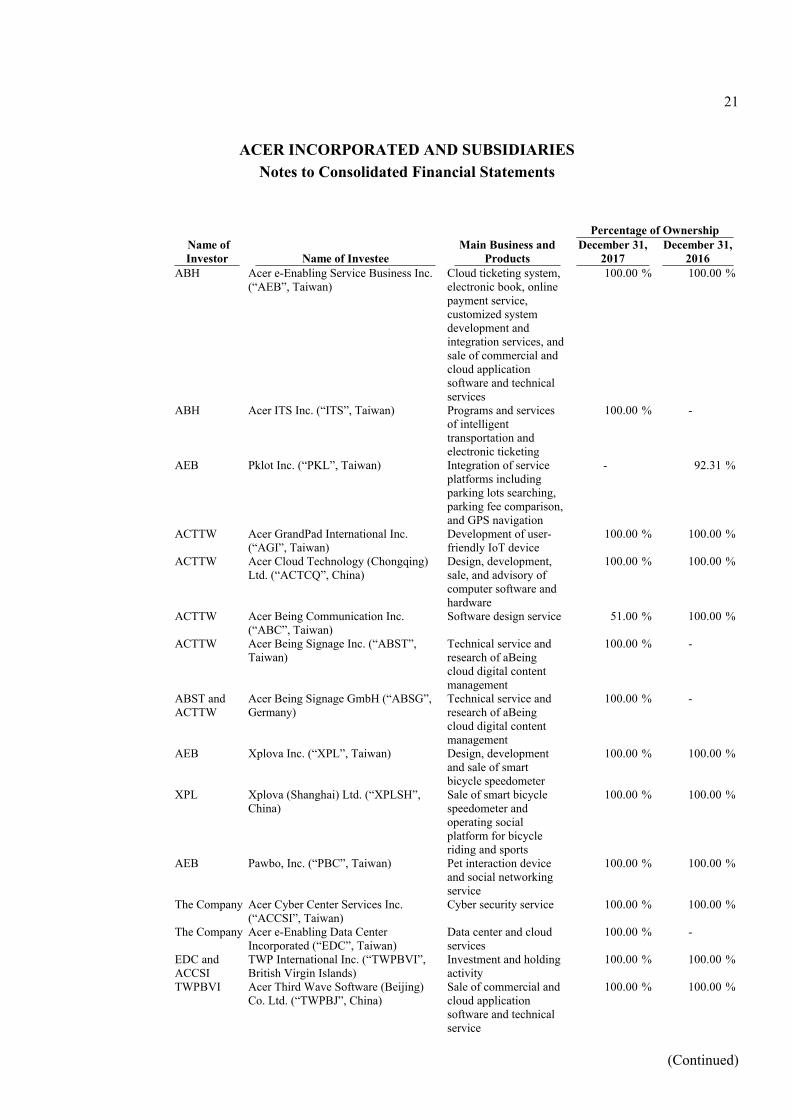
ABH Acer e-Enabling Service Business Inc.(“AEB”, Taiwan)
Cloud ticketing system,electronic book, onlinepayment service,customized systemdevelopment andintegration services, andsale of commercial andcloud applicationsoftware and technicalservices
%100.00 %100.00
ABH Acer ITS Inc. (“ITS”, Taiwan) Programs and servicesof intelligenttransportation andelectronic ticketing
%100.00 -
AEB Pklot Inc. (“PKL”, Taiwan) Integration of serviceplatforms includingparking lots searching,parking fee comparison,and GPS navigation
- %92.31
ACTTW Acer GrandPad International Inc.(“AGI”, Taiwan)
Development of user-friendly IoT device
%100.00 %100.00
ACTTW Acer Cloud Technology (Chongqing)Ltd. (“ACTCQ”, China)
Design, development,sale, and advisory ofcomputer software andhardware
%100.00 %100.00
ACTTW Acer Being Communication Inc.(“ABC”, Taiwan)
Software design service %51.00 %100.00
ACTTW Acer Being Signage Inc. (“ABST”,Taiwan)
Technical service andresearch of aBeingcloud digital contentmanagement
%100.00 -
ABST andACTTW
Acer Being Signage GmbH (“ABSG”,Germany)
Technical service andresearch of aBeingcloud digital contentmanagement
%100.00 -
AEB Xplova Inc. (“XPL”, Taiwan) Design, developmentand sale of smartbicycle speedometer
%100.00 %100.00
XPL Xplova (Shanghai) Ltd. (“XPLSH”,China)
Sale of smart bicyclespeedometer andoperating socialplatform for bicycleriding and sports
%100.00 %100.00
AEB Pawbo, Inc. (“PBC”, Taiwan) Pet interaction deviceand social networkingservice
%100.00 %100.00
The Company Acer Cyber Center Services Inc.(“ACCSI”, Taiwan)
Cyber security service %100.00 %100.00
The Company Acer e-Enabling Data CenterIncorporated (“EDC”, Taiwan)
Data center and cloudservices
%100.00 -
EDC andACCSI
TWP International Inc. (“TWPBVI”,British Virgin Islands)
Investment and holdingactivity
%100.00 %100.00
TWPBVI Acer Third Wave Software (Beijing)Co. Ltd. (“TWPBJ”, China)
Sale of commercial andcloud applicationsoftware and technicalservice
%100.00 %100.00
(Continued)

22
ACER INCORPORATED AND SUBSIDIARIES
Notes to Consolidated Financial Statements
Percentage of Ownership Name ofInvestor Name of Investee
Main Business andProducts
December 31,2017
December 31,2016
The Company Acer China Venture Corp (“ACVC”,China)
Fund companymanagement
%100.00 -
The Companyand ACVC
Acer China Venture Partnership(“ACVP”, China)
Investment fund %100.00 -
The Company Sertec (Beijing) Ltd. (“SEB”, China) Repair and maintenanceof IT products
%100.00 -
The Company StarVR Corporation (“ASBZ”, Taiwan) Solutions provider ofB2B virtual reality
%66.67 Note 6(h)
The Company AOPEN Inc. (“AOI”, Taiwan) Sale, manufacture,import and export ofcommercial computerproducts, software,components, peripheralequipment andapparatus; repair andmaintenance service ofcomputer products
%40.55 -
AOI AOPEN America Inc. (“AOA”, U.S.A.) Sale of computer,apparatus system, andperipheral equipment
%40.55 -
AOI AOPEN Computer B.V. (“AOE”,Netherlands)
Sale of computer,apparatus system, andperipheral equipment
%40.55 -
AOI AOPEN Technology Inc. (“AOTH”,British Virgin Islands)
Sale of computer,apparatus system, andperipheral equipment
%40.55 -
AOI AOPEN Japan Inc. (“AOJ”, Japan) Sale of computer,apparatus system, andperipheral equipment
%40.55 -
AOI Great Connection Corporation (“GCC”,Taiwan)
Sale of computer,apparatus system, andperipheral equipment
%40.55 -
AOI Heartware Alliance and IntegrationLimited (“HTW”, Hong Kong)
Software developmentand agency
%40.55 -
AOI AOPEN Global Solutions PTY Ltd.(“AOGS”, Australia)
Sale of computer,apparatus system, andperipheral equipment
%28.39 -
AOTH Great Connection LTD. (“GCL”, HongKong)
Sale of computer,apparatus system, andperipheral equipment
%40.55 -
AOTH AOPEN International (ShangHai) Co.,Ltd (“AOC”, China)
Sale of computer,apparatus system, andperipheral equipment
%40.55 -
AOTH AOPEN Information Products(Zhongshan) Inc. (“AOZ”, China)
Manufacture and sale ofcomputer parts andcomponents
%40.55 -
AOGS AOPEN Australia & New Zealand PTYLtd. (“AOAU”, Australia)
Sale of computer,apparatus system, andperipheral equipment
%28.39 -
(Continued)

23
ACER INCORPORATED AND SUBSIDIARIES
Notes to Consolidated Financial Statements
ISU, ITS, ABST, EDC, AOI and its subsidiaries, ABSG, ACVC, ACVP and SEB were newlyestablished subsidiaries or were acquired during 2017. PKL was merged into ITS in 2017.Formerly ASBZ was a joint venture accounted for using equity method; the Group acquiredadditional interest in ASBZ and obtained control over it in the fourth quarter of 2017;accordingly, ASBZ was included in the accompanying consolidated financial statements fromthe date the control commenced.
In 2017, the subsidiaries, BJAI, AUA and AGR, were liquidated and excluded from theaccompanying consolidated financial statements since the date the control ceased.
(iii) List of subsidiaries which are not included in the consolidated financial statements: None.
(d) Foreign currency
(i) Foreign currency transactions
Foreign currency transactions are translated into the functional currency using the exchangerates prevailing at the dates of the transactions. Foreign exchange gains and losses resultingfrom the settlement of such transactions and from the translation at exchange rates at the endof the period (the "reporting date") of monetary assets and liabilities denominated in foreigncurrencies are recognized in profit or loss.
Non-monetary assets and liabilities denominated in foreign currencies that are measured at fairvalue are retranslated at the exchange rate prevailing at the date when the fair value isdetermined. Exchange differences arising on the translation of non-monetary items arerecognized in profit or loss, except for exchange differences arising on the retranslation of non-monetary items in respect of which gains and losses are recognized directly in othercomprehensive income, in which case, the exchange differences are also recognized directly inother comprehensive income. Non-monetary items denominated in foreign currencies that aremeasured at historical cost are not retranslated.
(ii) Foreign operations
The assets and liabilities of foreign operations, including goodwill and fair value adjustmentsarising from acquisition, are translated into the presentation currency of the Group’ sconsolidated financial statements at the exchange rates at the reporting date. The income andexpenses of foreign operations, excluding foreign operations in hyperinflationary economies,are translated into the presentation currency of the Group’s consolidated financial statements atthe average exchange rates for the period. All resulting exchange differences are recognized inother comprehensive income.
On the disposal of a foreign operation which involves a loss of control over a subsidiary or lossof significant influence over an associate that includes a foreign operation, all of the exchangedifferences accumulated in equity in respect of that operation attributable to the shareholdersof the Company are entirely reclassified to profit or loss. In the case of a partial disposal thatdoes not result in the Group losing control over a subsidiary, the proportionate share ofaccumulated exchange differences is reclassified to non-controlling interests. For a partialdisposal of the Group’s ownership interest in an associate or joint venture, the proportionateshare of the accumulated exchange differences in equity is reclassified to profit or loss.
(Continued)

24
ACER INCORPORATED AND SUBSIDIARIES
Notes to Consolidated Financial Statements
When the settlement of a monetary receivable from or payable to a foreign operation is neitherplanned nor likely to occur in the foreseeable future, the monetary item is, in substance, a partof net investment in that foreign operation, and the related foreign exchange gains and lossesthereon are recognized as other comprehensive income.
(e) Classification of current and non-current assets and liabilities
An asset is classified as current when one of following criteria is met; all other assets are classifiedas non-current assets:
(i) It is expected to be realized, or intended to be sold or consumed in the normal operating cycle;(ii) It is held primarily for the purpose of trading;(iii) It is expected to be realized within twelve months after the reporting period; or (iv) The asset is cash or a cash equivalent unless the asset is restricted from being exchanged or
used to settle a liability for at least twelve months after the reporting period.
A liability is classified as current when one of following criteria is met; all other liabilities areclassified as non-current liabilities:
(i) It is expected to be settled in the normal operating cycle;(ii) It is held primarily for the purpose of trading;(iii) It is due to be settled within twelve months after the reporting period; or (iv) The entity does not have an unconditional right to defer settlement of the liability for at least
twelve months after the reporting period. Terms of a liability that could, at the option of thecounterparty, result in its settlement by the issue of equity instruments do not affect itsclassification.
(f) Cash and cash equivalents
Cash consists of cash on hand, checking deposits, and demand deposits. Cash equivalents consist ofshort-term and highly liquid investments that are readily convertible to known amounts of cash andare subject to an insignificant risk of changes in value. Time deposits that meet the aforesaid criteriaand are not held for investing purposes are also classified as cash equivalents.
Bank overdrafts that are repayable on demand and form an integral part of the Group’ s cashmanagement are included as a component of cash and cash equivalents for the purpose of theconsolidated statement of cash flows.
(g) Financial instruments
Financial assets and financial liabilities are initially recognized when the Group becomes a party tothe contractual provisions of the instruments.
(i) Financial assets
Financial assets are classified into the following categories: financial assets at fair valuethrough profit or loss, loans and receivables, and available-for-sale financial assets. Regularway purchases or sales of financial assets are recognized or derecognized on a trade-date basis.
(Continued)

25
ACER INCORPORATED AND SUBSIDIARIES
Notes to Consolidated Financial Statements
1) Financial assets at fair value through profit or loss
Financial assets at fair value through profit or loss consist of financial assets held fortrading and those designated as at fair value through profit or loss at inception. Afinancial asset is classified in this category if acquired principally for the purpose ofselling in the short term. Derivatives are also categorized as financial assets at fair valuethrough profit or loss unless they are designated as hedges. The Group designatesfinancial assets, other than ones classified as held for trading, as at fair value throughprofit or loss at initial recognition under one of the following situations:
a) Such designation eliminates or significantly reduces a measurement or recognitioninconsistency that would otherwise arise from measuring assets or liabilities orrecognizing the gains and losses on them on a different basis;
b) Performance of the financial asset is evaluated on a fair value basis; c) A hybrid instrument contains one or more embedded derivatives.
At initial recognition, financial assets carried at fair value through profit or loss arerecognized at fair value. Any attributable transaction costs are recognized in profit or lossas incurred. Subsequent to the initial recognition, changes in fair value (includingdividend income and interest income) are recognized in profit or loss.
2) Loans and receivables
Loans and receivables are non-derivative financial assets with fixed or determinablepayments that are not quoted in an active market. Loans and receivables compriseaccounts receivable, other receivables and investments in debt instrument without anactive market. At initial recognition, such assets are recognized at fair value, plus, anydirectly attributable transaction costs. Subsequent to initial recognition, loans andreceivables other than insignificant interest on short-term receivables are measured atamortized cost using the effective interest method, less, any impairment losses. Interestincome is recognized as non-operating income in profit or loss.
3) Available-for sale financial assets
Available-for-sale financial assets are non-derivative financial assets that are designatedas available for sale or are not classified in any of the other categories of financial assets.At initial recognition, available-for-sale financial assets are recognized at fair value, plus,any directly attributable transaction costs. Subsequent to initial recognition, these assetsare measured at fair value, and changes therein, other than impairment losses, interestincome calculated using the effective interest method, dividend income, and foreigncurrency differences on monetary financial assets, are recognized in other comprehensiveincome and presented in “unrealized gain/loss from available-for-sale financial assets” inequity. When the financial asset is derecognized, the gain or loss previously accumulatedin equity is reclassified to profit or loss.
Dividends received from equity investments are recognized as non-operating income onthe date of entitlement to receive the dividends (usually the ex-dividend date).
(Continued)

26
ACER INCORPORATED AND SUBSIDIARIES
Notes to Consolidated Financial Statements
4) Impairment of financial assets
Financial assets, other than those carried at fair value through profit or loss, are assessedfor indicators of impairment at the end of each reporting period. Those financial assetsare considered to be impaired when there is objective evidence that, as a result of one ormore events that occurred after the initial recognition of the financial assets, theirestimated future cash flows have been affected.
Evidence of impairment may include indications that the debtor is experiencingsignificant financial difficulty, default or delinquency in interest or principal payments,indications that the debtor or issuer will probably enter bankruptcy or other financialreorganization, and the disappearance of an active market for that financial asset becauseof financial difficulties. For available-for-sale equity investments, a significant orprolonged decline in the fair value of the security below its cost is also evidence that theassets are impaired.
If the Group determines that no objective evidence of impairment exists for anindividually assessed financial asset, whether significant or not, such asset is included ina group of financial assets with similar credit risk characteristics which are thencollectively assessed for impairment. Objective evidence that receivables are impairedincludes the Group’s collection experience in the past, an increase of delayed payments,and national or local economic conditions that correlate with arrears of receivables.
An impairment loss is recognized by reducing the carrying amount of the respectivefinancial assets with the exception of receivables, where the carrying amount is reducedthrough an allowance account. Except for the write-off of uncollectible receivablesagainst the allowance account, changes in the amount of the allowance account arerecognized in profit or loss.
An impairment loss in respect of a financial asset measured at amortized cost is measuredas the excess of the asset’s carrying amount over the present value of the estimated futurecash flows discounted at the financial asset’ s original effective interest rate. If, in asubsequent period, the amount of the impairment loss decreases and the decrease can berelated objectively to an event occurring after the impairment was recognized, thepreviously recognized impairment loss is reversed to the extent that the carrying amountof the financial assets at the date the impairment loss is reversed does not exceed whatthe amortized cost would have been had the impairment loss not been recognized.
When an impairment loss is recognized for an available-for-sale asset, the cumulativegains or loss that had been recognized in other comprehensive income is reclassifiedfrom equity to profit or loss. Any subsequent recovery in the fair value of an impairedavailable-for-sale equity security is recognized in other comprehensive income, andaccumulated in other equity. If, in a subsequent period, the fair value of an impairedavailable-for-sale debt security increases and the increase can be related objectively to anevent occurring after the impairment loss was recognized, then the impairment loss isreversed, with the amount of the reversal recognized in profit or loss.
Impairment losses and recoveries of accounts receivable are recognized as operatingexpenses; impairment losses and recoveries of other financial assets are recognized asother gains and losses under non-operating income and loss.
(Continued)

27
ACER INCORPORATED AND SUBSIDIARIES
Notes to Consolidated Financial Statements
5) Derecognition of financial assets
Financial assets are derecognized when the contractual rights of the cash inflow from theasset are terminated, or when the Group transfers out substantially all the risks andrewards of ownership of the financial assets to other enterprises.
On derecognition of a financial asset in its entirety, the difference between the carryingamount and the sum of the consideration received or receivable and any cumulative gainor loss that had been recognized in other comprehensive income and accumulated inother equity – unrealized gains or losses from available-for-sale financial assets isrecognized in profit or loss, and included in the non-operating income and loss of theconsolidated statement of comprehensive income.
On derecognition of part of a financial asset, the previous carrying amount of thefinancial asset shall be allocated between the part that continues to be recognized and thepart that is derecognized, on the basis of relative fair values of those parts on the date oftransfer. The difference between the carrying amount allocated to the part derecognizedand the sum of the consideration received or receivable for the part of the financial assetderecognized and the cumulative gain or loss that has been recognized in othercomprehensive income allocated to the part derecognized is charged to profit or loss. Acumulative gain or loss that had been recognized in other comprehensive income isallocated between the part that continues to be recognized and the part that isderecognized, based on the relative fair values of those parts.
(ii) Financial liabilities and equity instruments
1) Classification of debt or equity
Debt or equity instruments issued by the Group are classified as financial liabilities orequity in accordance with the substance of the contractual agreement. An equityinstrument is any contract that evidences a residual interest in the assets of the Groupafter deducting all of its liabilities. Equity instruments are recognized at the amount ofconsideration received less the direct issuing cost.
Interest and gain or loss related to the financial liability are recognized in profit or lossand included in non-operating income and loss of the consolidated statement ofcomprehensive income.
On conversion, the financial liability is reclassified to equity, and no gain or loss isrecognized.
(Continued)
28
ACER INCORPORATED AND SUBSIDIARIES
Notes to Consolidated Financial Statements
2) Financial liabilities at fair value through profit or loss
A financial liability is classified in this category if it is classified as held for trading or isdesignated as a financial liability at fair value through profit or loss on initial recognition.A financial liability is classified as held for trading if it is acquired principally for thepurpose of selling or repurchasing in the short term. Derivatives are also categorized asfinancial liabilities at fair value through profit or loss unless they are designated ashedges. The Group designates financial liabilities, other than those classified as held fortrading, as measured at fair value through profit or loss at initial recognition under one ofthe following situations:
a) Such designation eliminates or significantly reduces a measurement or recognitioninconsistency that would otherwise arise from measuring assets or liabilities orrecognizing the gains and losses on them on a different basis;
b) Performance of the financial liabilities is evaluated on a fair value basis; c) A hybrid instrument contains one or more embedded derivatives.
At initial recognition, this type of financial liability is recognized at fair value, and anyattributable transaction costs are recognized in profit or loss as incurred. Subsequent toinitial recognition, the financial liabilities are measured at fair value, and changestherein, which take into account any interest expense, are recognized in profit or loss andincluded in the non-operating income and loss of the consolidated statement ofcomprehensive income.
3) Financial liabilities measured at amortized cost
Financial liabilities not classified as held for trading or not designated as at fair valuethrough profit or loss, which comprise loans and borrowings, accounts payable, and otherpayables, are measured at fair value plus any directly attributable transaction costs atinitial recognition. Subsequent to initial recognition, these financial liabilities aremeasured at amortized cost using the effective interest method.
4) Derecognition of financial liabilities
The Group derecognizes a financial liability when its contractual obligation has beenfulfilled or cancelled, or has expired. The difference between the carrying amount of afinancial liability derecognized and the consideration paid (including any non-cash assetstransferred or liabilities assumed) is recognized in profit or loss and included in the non-operating income and loss of the consolidated statement of comprehensive income.
5) Offsetting of financial assets and liabilities
Financial assets and liabilities are presented on a net basis only when the Group has thelegally enforceable right to offset and intends to settle such financial assets and liabilitieson a net basis or to realize the assets and settle the liabilities simultaneously.
(Continued)

29
ACER INCORPORATED AND SUBSIDIARIES
Notes to Consolidated Financial Statements
(iii) Derivative financial instruments and hedge accounting
Derivative financial instruments are held to hedge the Group’ s foreign currency exposures.Derivatives are recognized initially at fair value, and attributable transaction costs arerecognized in profit or loss as incurred. Subsequent to initial recognition, derivatives aremeasured at fair value, and changes therein are recognized in profit or loss immediately unlessthe derivative financial instrument is designated and effective as a hedging instrument, inwhich the timing of the recognition in profit or loss depends on the nature of the hedgerelationship. If the valuation of a derivative instrument results in a positive fair value, it isclassified as a financial asset; otherwise, it is classified as a financial liability.
Certain derivatives are designated as either (i) hedges of the fair value of recognized assets orliabilities (fair value hedge) or (ii) hedges of highly probable forecast transactions (cash flowhedge). The Group documents at the inception of the transaction the relationship betweenhedging instruments and hedged items, as well as its risk management objectives and strategyfor undertaking various hedging transactions. The Group also documents its assessment, bothat hedge inception and on an ongoing basis, of whether the derivatives used in hedgingtransactions are highly effective in offsetting changes in fair values or cash flows of hedgeditems.
1) Fair value hedge
Changes in the fair value of a hedging instrument designated and qualified as a fair valuehedge, together with any changes in the fair value of the hedged asset or liability that areattributable to the hedged risk are recognized in profit or loss.
2) Cash flow hedge
The effective portion of changes in the fair value of derivatives that are designated andqualified as cash flow hedges is recognized in other comprehensive income andaccumulated in “cash flow hedge reserve”. The gain or loss relating to the ineffectiveportion is recognized immediately in profit or loss.
Amounts previously recognized in other comprehensive income and accumulated inequity are reclassified to profit or loss in the periods when the hedged item is recognizedin profit or loss.
(h) Inventories
Inventories are measured at the lower of cost and net realizable value. Inventories are recorded atstandard cost and adjusted to approximate weighted-average cost at the end of the reporting period.Net realizable value represents the estimated selling price in the ordinary course of business, less allestimated costs of completion and necessary selling expenses.
(i) Non-current assets held for sale
Non-current assets or disposal groups comprising assets and liabilities that are expected to berecovered primarily through a sale transaction, rather than through continuing use, are reclassified asnon-current assets held for sale. Such non-current assets or disposal group must be available forimmediate sale in their present condition, and the sale is highly probable within one year.
(Continued)

30
ACER INCORPORATED AND SUBSIDIARIES
Notes to Consolidated Financial Statements
Immediately before the initial classification of the non-current assets (or disposal groups) as held forsale, the carrying amount of the assets (or all the assets and liabilities in the group) is measured inaccordance with the Group’s applicable accounting policies. Thereafter, the assets are measured atthe lower of their carrying amount and fair value less costs to sell. Any impairment loss on adisposal group will first be allocated to goodwill, and then the remaining balance of impairment lossis allocated to assets and liabilities on a pro rata basis, except for the assets within the scope of IAS36 – Impairment of Assets, which are continue to be measured in accordance with the Group’ saccounting policies. Impairment losses for assets initially classified as held for sale and anysubsequent gains or losses on re-measurement are recognized in profit or loss; nevertheless, thereversal. Gains are not recognized in excess of the cumulative impairment loss.
Intangible assets and property, plant and equipment are no longer amortized or depreciated whenthey are classified as held for sale.
(j) Investments accounted for using equity method
Investments accounted for using the equity method include investments in associates and interests injoint venture.
An associate is an entity over which the Group has significant influence and that is neither asubsidiary nor a joint venture. Significant influence is the power to participate in the financial andoperating policy decisions of the investee but is not control or joint control over those policies.
A joint venture is a joint arrangement whereby the Group and other parties that have joint control ofthe arrangement have rights to the net assets of the joint arrangement. Joint control is thecontractually agreed sharing of control of an arrangement, which exists only when decisions aboutthe relevant activities require unanimous consent of the parties sharing control.
The operating results as well as assets and liabilities of associates and joint venture are incorporatedin these consolidated financial statements using the equity method of accounting. Under the equitymethod, an investment in an associate or a joint venture is initially recognized in the consolidatedbalance sheet at cost, and adjusted thereafter, to recognize the Group’s share of profit or loss andother comprehensive income (loss) of the associate and joint venture, as well as the distributionreceived. The Group also recognizes its share in the changes in the equities of associates and jointventure.
Any excess of the cost of acquisition over the Group’s share of the net fair value of the identifiableassets, liabilities, and contingent liabilities of an associate or a joint venture recognized at the date ofacquisition, is recognized as goodwill, which is included within the carrying amount of theinvestment. Any excess of the Group’s share of the net fair value of the identifiable assets, liabilitiesand contingent liabilities over the cost of acquisition, after reassessment, is recognized immediatelyin profit or loss.
When necessary, the entire carrying amount of the investment (including goodwill) is tested forimpairment as a single asset by comparing its recoverable amount (higher of value in use and fairvalue, less, costs to sell) with its carrying amount. Any impairment loss recognized forms part of thecarrying amount of the investment. Any reversal of that impairment loss is recognized to the extentthat the recoverable amount of the investment subsequently increases.
(Continued)

31
ACER INCORPORATED AND SUBSIDIARIES
Notes to Consolidated Financial Statements
The Group discontinues the use of equity method from the date when the Group ceases to havesignificant influence over an associate. When the Group retains an interest in the former associate,the Group measures the retained interest at fair value at that date. The difference between thecarrying amount of the associate at the date the equity method was discontinued, and the fair valueof any retained interest and any proceeds from disposing of a part interest in the associate, isincluded in the determination of the gain or loss on disposal of the associate. In addition, the Groupshall account for all amounts recognized in other comprehensive income in relation to that associateon the same basis as would be required if the associate had directly disposed of the related assets orliabilities. If the Group’s ownership interest in an associate is reduced as a result of disposal, withthe investment continues to be an associate, the Group should reclassify only a proportionate amountof the gain or loss previously recognized in other comprehensive income to profit or loss.
When the Group subscribes to additional shares in an associate or a joint venture at a percentagedifferent from its existing ownership percentage, the resulting carrying amount of the investmentdiffers from the amount of the Group’ s proportionate interest in the net assets of the associate orjoint venture. The Group records such a difference as an adjustment to investments with thecorresponding amount charged or credited to capital surplus. If the Group’ s ownership interest isreduced due to the additional subscription to the shares of associate or joint venture by otherinvestors, the proportionate amount of the gains or losses previously recognized in othercomprehensive income in relation to that associate or joint venture shall be reclassified to profit orloss on the same basis as would be required if the associate or joint venture had directly disposed ofthe related assets or liabilities.
Unrealized profits resulting from transactions between the Group and an associate or joint ventureare eliminated to the extent of the Group’ s interest in the associate or joint venture. Unrealizedlosses on transactions with associates or joint venture are eliminated in the same way, except to theextent that the underlying asset is impaired.
Adjustments are made to associates’ and joint ventures’ financial statements to conform to theaccounting polices applied by the Group.
(k) Property, plant and equipment
(i) Recognition and measurement
Property, plant and equipment are measured at cost less accumulated depreciation andaccumulated impairment losses. Cost includes expenditure that is directly attributed to theacquisition of the asset and bringing the asset to the location and condition necessary for it tobe capable of operating in the manner intended by management, the initial estimate of the costsof dismantling and removing the item and restoring the site on which it is located, and anyborrowing cost that is eligible for capitalization. Purchased software that is integral to thefunctionality of the related equipment is capitalized as part of that equipment.
The gain or loss arising from the disposal of an item of property, plant and equipment isdetermined as the difference between the net disposal proceeds, if any, and the carryingamount of the item, and is recognized as non-operating income and loss.
(Continued)

32
ACER INCORPORATED AND SUBSIDIARIES
Notes to Consolidated Financial Statements
(ii) Reclassification to investment property
A property is reclassified to investment property at its carrying amount when the purpose ofthe property changes from owner-occupied to investment.
(iii) Subsequent costs
Subsequent costs are capitalized only when it is probable that future economic benefitsassociated with the costs will flow to the Group and the cost of the item can be measuredreliably. The carrying amount of the replaced part is derecognized in profit and loss. All otherrepairs and maintenance are charged to expense as incurred.
(iv) Depreciation
Depreciation is provided for property, plant and equipment over the estimated useful livesusing the straight-line method. When an item of property, plant and equipment comprisessignificant individual components for which different depreciation methods or useful lives areappropriate, each component is depreciated separately. Land is not depreciated. Thedepreciation is recognized in profit or loss.
The estimated useful lives of property, plant and equipment for the current and comparativeperiods are as follows: buildings-main structure - 30 to 50 years; air-conditioning system - 10years; other equipment pertaining to buildings - 20 years; computer and communicationequipment - 2 to 5 years; and other equipment - 3 to 10 years.
If there is reasonable certainty that the Group will obtain the ownership of the leased propertyand equipment by the end of the lease term, the depreciation is provided over the estimateduseful life of the asset; otherwise, the asset is depreciated over the shorter of the lease term andits useful life.
Depreciation methods, useful lives, and residual values are reviewed at each financial year-end, with the effect of any changes in estimate accounted for on a prospective basis.
(l) Investment property
Investment property is property held either to earn rental income or for capital appreciation or forboth, but not for sale in the ordinary course of business or use for administrative purposes.Investment property is measured at cost on initial recognition. Subsequent to initial recognition,investment property is measured at initial acquisition cost less accumulated depreciation andaccumulated impairment losses. The methods for depreciating and determining the useful life andresidual value of investment property are the same as those adopted for property, plant andequipment.
Cost includes expenditure that is directly attributable to the acquisition of the investment property,bringing the investment property to the condition necessary for it to be available for use, and anyborrowing cost that is eligible for capitalization.
An investment property is reclassified to property, plant and equipment at its carrying amount whenthe purpose of the investment property has been changed from investment to owner-occupied.
(Continued)

33
ACER INCORPORATED AND SUBSIDIARIES
Notes to Consolidated Financial Statements
(m) Leases
Leases are classified as finance leases when the Group assumes substantially all the risks andrewards incidental to ownership of the assets. All other leases are classified as operating leases.
(i) The Group as lessor
Lease income from an operating lease is recognized in profit or loss on a straight-line basisover the lease term. Initial direct costs incurred in negotiating and arranging an operating leaseare added to the carrying amount of the leased asset and recognized as expense over the leaseterm on a straight-line basis. Incentives granted to the lessee to enter into the operating leaseare recognized as a reduction of rental income over the lease term on a straight-line basis.Contingent rents are recognized as income in the period when the lease adjustments areconfirmed.
(ii) The Group as lessee
Payments made under operating leases (excluding insurance and maintenance expenses) arecharged to expense over the lease term on a straight-line basis. Lease incentives received fromthe lessor are recognized as a reduction of rental expense over the lease term on a straight-linebasis. Contingent rents are recognized as expense in the period when the lease adjustments areconfirmed.
(n) Intangible assets
(i) Goodwill
Goodwill arising from acquisitions of subsidiaries is accounted for as intangible assets. Referto note 4(v) for the description of the measurement of goodwill at initial recognition. Goodwillarising from acquisitions of associates is included in the carrying amount of investments inassociates. Goodwill is not amortized but is measured at cost less accumulated impairmentlosses.
(ii) Trademarks
Trademarks acquired in a business combination are measured at fair value at the acquisitiondate. Subsequent to the initial recognition, trademarks with definite useful lives are carried atcost less accumulated amortization and accumulated impairment losses. Amortization isrecognized on a straight-line basis over the estimated useful lives of 7 years. Trademarks withindefinite useful lives are carried at cost less any accumulated impairment losses and are testedfor impairment annually. The useful life of an intangible asset not subject to amortization isreviewed annually at each financial year-end to determine whether events and circumstancescontinue to support an indefinite useful life assessment for the asset. Any change in the usefullife assessment from indefinite to definite is accounted for as a change in accounting estimate.
(Continued)

34
ACER INCORPORATED AND SUBSIDIARIES
Notes to Consolidated Financial Statements
(iii) Other intangible assets
Other separately acquired intangible assets are carried at cost or fair value at the acquisitiondate less accumulated amortization and accumulated impairment losses. Amortization isrecognized in profit or loss on a straight-line basis over the following estimated useful lives:customer relationships - 7 to 10 years; developed technology - 10 years; channel resources -8.8 years; developing technology - 15 years; patents - 4 to 15 years; acquired software - 1 to 3years.
The residual value, amortization period, and amortization method are reviewed at least at eachfinancial year-end, with the effect of any changes in estimate accounted for on a prospectivebasis.
(o) Impairment of non-financial assets
(i) Goodwill
For the purpose of impairment testing, goodwill arising from a business combination isallocated to each of the Group’ s cash-generating units (CGUs) that are expected to benefitfrom the synergies of the combination. The CGUs with goodwill are tested annually (or whenthere are indications that a CGU may have been impaired) for impairment. When therecoverable amount of a CGU is less than the carrying amount of the CGU, the impairmentloss is recognized firstly by reducing the carrying amount of any goodwill allocated to theCGU and then proportionately allocated to the other assets of the CGU on the basis of thecarrying amount of each asset in the CGU. Any impairment loss is recognized immediately inprofit or loss. A subsequent reversal of the impairment loss on goodwill is prohibited.
(ii) Other tangible and intangible assets
Non-financial assets other than inventories, deferred income tax assets, and assets arising fromemployee benefits are reviewed for impairment at each reporting date to determine whetherthere is any indication of impairment. When there exists an indication of impairment for anasset, the recoverable amount of the asset is estimated. If the recoverable amount of anindividual asset cannot be determined, the Group estimates the recoverable amount of the CGUto which the asset has been allocated.
The recoverable amount for an individual asset or a CGU is the higher of its fair value lesscosts to sell or its value in use. In assessing value in use, the estimated future cash flows arediscounted to their present value using a pre-tax discount rate that reflects current marketassessments of the time values of money and the risks specific to the asset for which theestimates of future cash flows have not been adjusted. When the recoverable amount of anasset or a CGU is less than its carrying amount, the carrying amount of the asset or CGU isreduced to its recoverable amount, and an impairment loss is recognized in profit or lossimmediately.
(Continued)

35
ACER INCORPORATED AND SUBSIDIARIES
Notes to Consolidated Financial Statements
The Group assesses at each reporting date whether there is any evidence that an impairmentloss recognized in prior periods for an asset other than goodwill may no longer exist or mayhave decreased. If so, an impairment loss recognized in prior periods for an asset other thangoodwill is reversed, and the carrying amount of the asset or CGU is increased to its revisedestimate of recoverable amount. The increased carrying amount shall not exceed the carryingamount (net of amortization or depreciation) that would have been determined had noimpairment loss been recognized in prior years.
Intangible assets with indefinite useful lives or those not yet available for use are testedannually for impairment. An impairment loss is recognized for the excess of the asset’ scarrying amount over its recoverable amount.
(p) Provisions
Provisions are recognized when the Group has a present obligation (legal or constructive) as a resultof a past event, it is probable that the Group will be required to settle the obligation, and a reliableestimate can be made of the amount of the obligation.
(i) Warranties
A provision for warranties is recognized when the underlying products or services are sold.This provision reflects the historical warranty claim rate and the weighting of all possibleoutcomes against their associated probabilities.
(ii) Sales return provision
A provision for sales returns is recognized when the underlying products are sold. Thisprovision is estimated based on historical sales return data.
(iii) Others
Provisions for litigation claims and environmental restoration are recognized when the Grouphas a present obligation (legal or constructive) as a result of a past event, it is probable that theGroup will be required to settle the obligation, and a reliable estimate can be made of theamount of the obligation.
(q) Treasury stock
Common stock repurchased by the Company treated as treasury stock (a contra-equity account) isreported at acquisition cost (including all directly accountable costs). When treasury stock is sold,the excess of sales proceeds over cost is accounted for as capital surplus- treasury stock. If thesales proceeds are less than cost, the deficiency is accounted for as a reduction of the remainingbalance of capital surplus- treasury stock. If the remaining balance of capital surplus- treasurystock is insufficient to cover the deficiency, the remainder is recorded as a reduction of retainedearnings. The cost of treasury stock is computed using the weighted-average method.
If treasury stock is retired, the weighted-average cost of the retired treasury stock is written offagainst the par value and the capital surplus premium, if any, of the stock retired on a pro rata basis.If the weighted-average cost written off exceeds the sum of the par value and the capital surplus, thedifference is accounted for as a reduction of capital surplus- treasury stock, or a reduction ofretained earnings for any deficiency where capital surplus-treasury stock is insufficient to cover thedifference. If the weighted-average cost written off is less than the sum of the par value and capital
(Continued)

36
ACER INCORPORATED AND SUBSIDIARIES
Notes to Consolidated Financial Statements
surplus, if any, of the stock retired, the difference is accounted for as an increase in capital surplus-treasury stock.
(r) Revenue recognition
Revenue from the sale of goods or services is measured at the fair value of consideration received orreceivable, net of returns, rebates, and other similar discounts.
(i) Sale of goods
Revenue from the sale of goods is recognized when all the following conditions have beensatisfied: (a) the significant risks and rewards of ownership of the goods have been transferredto the buyer; (b) the Group retains neither continuing managerial involvement to the degreeusually associated with ownership nor effective control over the goods sold; (c) the amount ofrevenue can be measured reliably; (d) it is probable that the economic benefits associated withthe transaction will flow to the Group; and (e) the cost incurred or to be incurred in respect ofthe transaction can be measured reliably.
The timing of the transfers of risks and rewards varies depending on the individual terms of thesales agreement. Revenue is not recognized for the sale of key components to an originaldesign manufacturer for manufacture or assembly as the significant risks and rewards of theownership of materials are not transferred.
Revenue from extended warranty contracts is deferred and amortized as earned over thecontract period, ranging from one to three years.
(ii) Services
Revenue from services rendered is recognized by reference to the stage of completion at thereporting date.
(iii) Rental income, interest income, and dividend income
Rental income from investment property is recognized over the lease term on a straight-linebasis.
Dividend income from investments is recognized when the shareholder’ s right to receivepayment has been established, provided that it is probable that the economic benefits will flowto the Group and the amount of income can be measured reliably.
Interest income is accrued on a time basis, by reference to the principal outstanding and at theeffective interest rate applicable.
(iv) Government grant
A government grant is recognized only when there is reasonable assurance that the Group willcomply with the conditions attached to it and that the grant will be received.
A government grant that becomes receivable as compensation for expenses or losses alreadyincurred or for the purpose of giving immediate financial support to the Group with no futurerelated costs is recognized in profit or loss in the period in which it becomes receivable.
(Continued)

37
ACER INCORPORATED AND SUBSIDIARIES
Notes to Consolidated Financial Statements
(s) Employee benefits
(i) Defined contribution plans
Obligations for contributions to defined contribution pension plans are expensed during theyear in which employees render services.
(ii) Defined benefit plans
The liability recognized in respect of defined benefit pension plans is the present value of thedefined benefit obligation at the reporting date less the fair value of plan assets. The discountrate for calculating the present value of the defined benefit obligation refers to the interest rateof high-quality government bonds that are denominated in the currency in which the benefitswill be paid and that have terms to maturity approximating the terms of the related pensionobligation.
The defined benefit obligation is calculated annually by qualified actuaries using the projectedunit credit method. When the calculation results in a benefit to the Group, the recognized assetis limited to the total amount of the present value of the economic benefits available in theform of refunds from the plan or reductions in future contributions to the plan. The minimumfunding requirements of any plans applicable to the Group should be taken into considerationwhen determining the present value of the economic benefits. An economic benefit isavailable to the Group if it is realizable during the life of the plan or upon settlement of theplan liabilities.
When the benefits of a plan are improved, the expenses related to the increased obligationsresulting from the services rendered by employees in the past years are recognized in profit orloss immediately.
The remeasurements of the net defined benefit liability (asset) comprise (i) actuarial gains andlosses; (ii) return on plan assets, excluding amounts included in net interest on the net definedbenefit liability (asset); and (iii) any change in the effect of the asset ceiling, excludingamounts included in net interest on the net defined benefit liability (asset). Theremeasurements of the net defined benefit liability (asset) are recognized in othercomprehensive income and reflected in other equity.
The Group recognizes gains or losses on the curtailment or settlement of a defined benefit planwhen the curtailment or settlement occurs. The gain or loss on curtailment or settlementcomprises any resulting change in the fair value of plan assets and any change in the presentvalue of the defined benefit obligation.
(iii) Short-term employee benefits
Short-term employee benefit obligations are measured on an undiscounted basis and areexpensed during the period in which employees render services. A liability is recognized forthe amount expected to be paid under short-term cash bonus or profit-sharing plans if theGroup has a present legal or constructive obligation to make such payments as a result of pastservice provided by the employees, and the obligation can be estimated reliably.
(Continued)

38
ACER INCORPORATED AND SUBSIDIARIES
Notes to Consolidated Financial Statements
(t) Share-based payment
Share-based payment awards granted to employees are measured at fair value at the date of grant.The fair value determined at the grant date is expensed over the period that the employees becomeunconditionally entitled to the awards, with a corresponding increase in equity. The compensationcost is adjusted to reflect the number of awards given to employees for which the performance andnon-market conditions are expected to be met, such that the amount ultimately recognized shall bebased on the number of equity instruments that eventually vested.
The grant date of options for employees to subscribe new shares for a cash injection is the date whenthe Board of Directors approves the exercise price and the shares to which employees can subscribe.
(u) Income taxes
Income tax expenses include both current taxes and deferred taxes. Current and deferred taxes arerecognized in profit or loss unless they relate to business combinations or items recognized directlyin equity or other comprehensive income.
Current tax is the expected tax payable or receivable on the taxable income or loss for the year, usingtax rates enacted or substantively enacted at the reporting date, and any adjustments to tax payable inrespect of previous years.
Deferred income taxes are recognized in respect of temporary differences between the carryingamounts of assets and liabilities for financial reporting purposes and the amounts used for taxationpurposes. Deferred taxes are not recognized for:
(i) Temporary differences on the initial recognition of assets or liabilities in a transaction that isnot a business combination and that affects neither accounting nor taxable profit nor loss;
(ii) Temporary differences arising from investments in subsidiaries and joint ventures to the extentthat the Group is able to control the timing of the reversal of the temporary differences, and itis probable that the differences will not reverse in the foreseeable future; and
(iii) Temporary differences arising from initial recognition of goodwill.
Deferred tax assets are recognized for unused tax losses, tax credits, and deductible temporarydifferences to the extent that it is probable that future taxable profits will be available against whichthey can be utilized. Deferred tax assets are reviewed at each reporting date and reduced to theextent that it is no longer probable that the related tax benefit will be realized.
Deferred tax is measured based on the expected manner of realization or settlement of the carryingamount of the assets and liabilities, using tax rates enacted or substantively enacted at the reportingdate.
Deferred tax assets and liabilities are offset when where is a legally enforceable right to offsetcurrent tax assets against current tax liabilities and when the deferred tax assets and liabilities relateto income taxes levied by the same tax authority on either the same taxable entity or different taxableentities where there is an intention to settle the balances on a net basis.
(Continued)

39
ACER INCORPORATED AND SUBSIDIARIES
Notes to Consolidated Financial Statements
(v) Business combinations
Goodwill is measured as the excess of the acquisition-date fair value of consideration transferred(including any non-controlling interest in the acquiree) over the net of the acquisition-date amountsof the identifiable assets acquired and liabilities assumed (generally at fair value). If the residualbalance is negative, the Group shall re-assess whether it has correctly identified all of the assetsacquired and liabilities assumed and recognize any additional assets or liabilities that are identifiedin that review, and shall recognize a gain on the bargain purchase thereafter.
Acquisition-related costs are expensed as incurred except for the costs related to issuance of debt orequity instruments.
For each business combination, non-controlling interest in the acquiree is measured either at fairvalue or at the non-controlling interest’ s proportionate share of the fair value of the acquiree’ sidentifiable net assets.
In a business combination achieved in stages, the Group shall re-measure its previously held equityinterest in the acquiree at its acquisition-date fair value and recognize the resulting gain or loss inprofit or loss. The amount previously recognized in other comprehensive income in relation to thechanges in the value of the Group’ s equity interest should be reclassified to profit or loss on thesame basis as would be required if the Group had disposed directly of the previously held equityinterest.
If the initial accounting for a business combination is incomplete by the end of the reporting periodin which the combination occurs, provisional amounts for the items for which the accounting isincomplete are reported in the financial statements. During the measurement period, the provisionalamounts recognized at the acquisition date are retrospectively adjusted to reflect new informationobtained about facts and circumstances that existed as of the acquisition date. The measurementperiod shall not exceed one year from the acquisition date.
(w) Earnings per share (“EPS”)
The basic and diluted EPS attributable to stockholders of the Company are disclosed in theconsolidated financial statements. Basic EPS is calculated by dividing net income attributable tostockholders of the Company by the weighted-average number of common shares outstanding duringthe year. In calculating diluted EPS, the net income attributable to stockholders of the Company andweighted-average number of common shares outstanding during the year are adjusted for the effectsof dilutive potential common shares. The Group’ s dilutive potential common shares includerestricted shares of stock issued to employees and profit sharing for employees to be settled in theform of common stock.
(x) Operating segments
An operating segment is a component of the Group that engages in business activities from which itmay earn revenues and incur expenses (including revenues and expenses relating to transactions withother components of the Group). Operating results of the operating segment are regularly reviewedby the Group’ s chief operating decision maker, who decides on the allocation of resources to thesegment and assesses its performance for which discrete financial information is available.
(Continued)
40
ACER INCORPORATED AND SUBSIDIARIES
Notes to Consolidated Financial Statements
5. Critical Accounting Judgments and Key Sources of Estimation and Assumption Uncertainty
The preparation of the consolidated financial statements in conformity with the Regulations and Taiwan-IFRSs requires management to make judgments, estimates and assumptions that affect the application ofthe accounting policies and the reported amount of assets, liabilities, income and expenses. Actual resultsmay differ from these estimates.
The estimates and underlying assumptions are reviewed on an ongoing basis. Revisions to accountingestimates are recognized in the period in which the estimate is revised and in the future periods affected.
Information about assumptions and estimation uncertainties that have a significant risk of resulting in amaterial adjustment within the next financial year is included as follows:
(a) Revenue recognition (accrual of sales return and allowance)
The Group recognizes revenue when the earning process is completed. The Group also records aprovision for estimated future returns and other allowances in the same period the related revenue isrecorded. Provision for estimated sales returns and other allowances is generally made and adjustedbased on historical experience, market and economic conditions, and any other known factors thatwould significantly affect the allowance. The adequacy of estimations is reviewed periodically. Thefierce market competition and rapid evolution of technology could result in significant adjustmentsto the provision made.
(b) Valuation of inventory
Inventories are measured at the lower of cost or net realizable value. The Group uses judgment andestimates to determine the net realizable value of inventory at each reporting date.
Due to rapid technological changes, the Group estimates the net realizable value of inventory, takingobsolescence and unmarketable items into account at the reporting date, and then writes down thecost of inventories to net realizable value. The net realizable value of the inventory is mainlydetermined based on assumptions of future demand within a specific time horizon, which couldresult in significant adjustments. Refer to note 6(f) for further description of inventory write-downs.
(c) Impairment of goodwill
The assessment of impairment of goodwill requires the Group to make subjective judgments toidentify cash-generating units, allocate the goodwill to relevant cash-generating units, and estimatethe recoverable amount of relevant cash-generating units. Refer to note 6(l) for further description ofthe impairment of goodwill. Any changes in these estimates based on changed economic conditionsor business strategies could result in significant adjustments in future years.
(Continued)
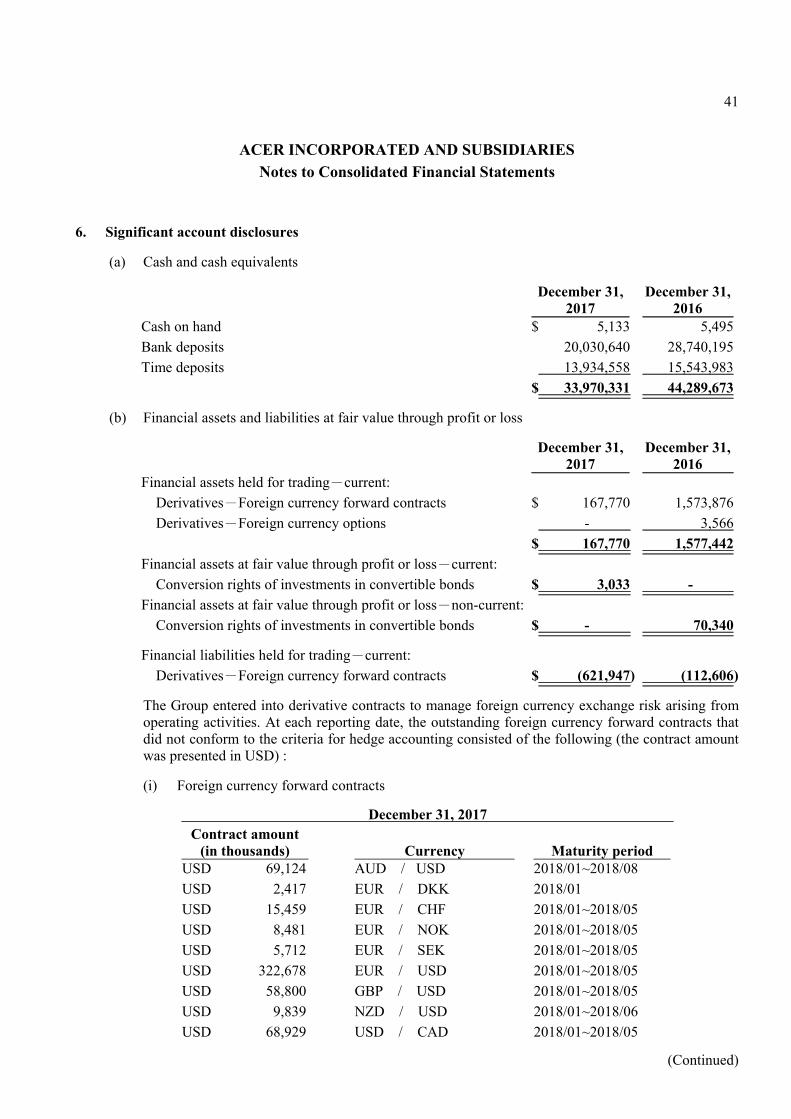
41
ACER INCORPORATED AND SUBSIDIARIES
Notes to Consolidated Financial Statements
6. Significant account disclosures
(a) Cash and cash equivalents
December 31,2017
December 31,2016
Cash on hand $ 5,133 5,495
Bank deposits 20,030,640 28,740,195
Time deposits 13,934,558 15,543,983
$ 33,970,331 44,289,673
(b) Financial assets and liabilities at fair value through profit or loss
December 31,2017
December 31,2016
Financial assets held for trading-current:
Derivatives-Foreign currency forward contracts $ 167,770 1,573,876
Derivatives-Foreign currency options - 3,566
$ 167,770 1,577,442
Financial assets at fair value through profit or loss-current:
Conversion rights of investments in convertible bonds $ 3,033 -
Financial assets at fair value through profit or loss-non-current:
Conversion rights of investments in convertible bonds $ - 70,340
Financial liabilities held for trading-current:
Derivatives-Foreign currency forward contracts $ (621,947) (112,606)
The Group entered into derivative contracts to manage foreign currency exchange risk arising fromoperating activities. At each reporting date, the outstanding foreign currency forward contracts thatdid not conform to the criteria for hedge accounting consisted of the following (the contract amountwas presented in USD) :
(i) Foreign currency forward contracts
December 31, 2017
Contract amount(in thousands) Currency Maturity period
USD 69,124 AUD / USD 2018/01~2018/08
USD 2,417 EUR / DKK 2018/01
USD 15,459 EUR / CHF 2018/01~2018/05
USD 8,481 EUR / NOK 2018/01~2018/05
USD 5,712 EUR / SEK 2018/01~2018/05
USD 322,678 EUR / USD 2018/01~2018/05
USD 58,800 GBP / USD 2018/01~2018/05
USD 9,839 NZD / USD 2018/01~2018/06
USD 68,929 USD / CAD 2018/01~2018/05
(Continued)

42
ACER INCORPORATED AND SUBSIDIARIES
Notes to Consolidated Financial Statements
December 31, 2017
Contract amount(in thousands) Currency Maturity period
USD 9,500 USD / CLP 2018/01~2018/05
USD 71,000 USD / CNY 2018/01~2018/03
USD 4,000 USD / COP 2018/01~2018/02
USD 23,600 USD / IDR 2018/01~2018/02
USD 155,801 USD / INR 2018/01~2018/07
USD 32,000 USD / JPY 2018/01~2018/07
USD 43,150 USD / MXN 2018/01~2018/04
USD 15,400 USD / MYR 2018/01~2018/02
USD 651,900 USD / NTD 2018/01
USD 5,400 USD / PHP 2018/01~2018/04
USD 40,185 USD / RUB 2018/01~2018/04
USD 1,500 USD / SGD 2018/01
USD 38,000 USD / THB 2018/01~2018/03
December 31, 2016
Contract amount(in thousands) Currency Maturity period
USD 66,330 AUD / USD 2017/01~2017/04
USD 10,667 EUR / CHF 2017/01~2017/05
USD 6,330 EUR / NOK 2017/01~2017/05
USD 8,941 EUR / SEK 2017/01~2017/05
USD 463,689 EUR / USD 2017/01~2017/05
USD 72,055 GBP / USD 2017/01~2017/06
USD 8,644 NZD / USD 2017/01~2017/04
USD 70,371 USD / CAD 2017/01~2017/05
USD 15,000 USD / CLP 2017/01~2017/05
USD 84,000 USD / CNY 2017/01~2017/03
USD 18,600 USD / IDR 2017/01~2017/02
USD 134,457 USD / INR 2017/01~2017/08
USD 29,000 USD / JPY 2017/01~2017/06
USD 38,300 USD / MXN 2017/01~2017/04
USD 30,100 USD / MYR 2017/01~2017/04
USD 627,440 USD / NTD 2017/01
USD 8,400 USD / PHP 2017/01~2017/03
USD 46,144 USD / RUB 2017/01~2017/05
USD 5,000 USD / SGD 2017/01~2017/02
USD 47,000 USD / THB 2017/01~2017/04
(Continued)

43
ACER INCORPORATED AND SUBSIDIARIES
Notes to Consolidated Financial Statements
(ii) Foreign currency option contracts
December 31, 2017
Contract amount(in thousands) Maturity period
USD / INR USD 4,000 2018/01
December 31, 2016
Contract amount(in thousands) Maturity period
USD / INR USD 3,000 2017/05
USD / CNY USD 6,000 2017/03~2017/04
(c) Available-for-sale financial assets
December 31,2017
December 31,2016
Domestic listed stock $ 3,619,007 3,119,549
Unlisted stock 1,751,663 1,253,242
$ 5,370,670 4,372,791
Current $ 118,329 100,025
Non-current 5,252,341 4,272,766
$ 5,370,670 4,372,791
(d) Investments in debt instrument without an active market
December 31,2017
December 31,2016
Convertible bond and convertible notes $ 232,466 210,517
Right of profit-sharing in VR parks 308,444 -
$ 540,910 210,517
Current $ 232,466 32,279
Non-current 308,444 178,238
$ 540,910 210,517
ASBZ, a subsidiary of the Company, entered into separate agreements with Starbreeze Publishing
AB and Enterspace AB to develop VR parks, with the total investment amount of US$10,500thousand. Therefore, ASBZ obtained its profit sharing rights during the contract period (1.5 to 5
years). As of December 31, 2017, the amount of $37,310 of the aforementioned investment includedin “other payables” has yet to be paid.
The Group recognized an impairment loss on the investments in debt instrument amounting to
$3,061, which was included in other gains or losses in 2017 based on the present value of the netfuture cash flow.
(Continued)

44
ACER INCORPORATED AND SUBSIDIARIES
Notes to Consolidated Financial Statements
(e) Notes and accounts receivable–net and other receivables
December 31,2017
December 31,2016
Notes receivable $ 539,595 730,648
Accounts receivable 46,396,275 43,615,762
Less: allowance for doubtful receivables (174,487) (116,105)
46,761,383 44,230,305
Notes and accounts receivable from related parties 126,903 81,975
Other receivables 1,023,908 738,719
Other receivables from related parties 97 6,737
$ 47,912,291 45,057,736
Aging analysis of notes and accounts receivable that are overdue but not impaired is as follows:
December 31,2017
December 31,2016
Past due 1-30 days $ 4,467,737 4,843,595
Past due 31-60 days 555,299 700,342
Past due 61-90 days 74,466 286,700
Past due 91 days or over 71,582 250,375
$ 5,169,084 6,081,012
For the years ended December 31, 2017 and 2016, movements of the allowance for doubtfulreceivables were as follows:
Individuallyassessed
impairment
Collectivelyassessed
impairment TotalBalance at January 1, 2017 $ 103,457 12,648 116,105
Acquisition through business combination - 44,719 44,719
Impairment loss recognized 28,432 5,750 34,182
Write-off (14,867) (3,123) (17,990)
Effect of exchange rate changes (2,529) - (2,529)
Balance at December 31, 2017 $ 114,493 59,994 174,487
Individuallyassessed
impairment
Collectivelyassessed
impairment TotalBalance at January 1, 2016 $ 135,800 8,150 143,950
Impairment loss recognized (reversed) (29,201) 4,498 (24,703)
Write-off (19,143) - (19,143)
Effect of exchange rate changes 16,001 - 16,001
Balance at December 31, 2016 $ 103,457 12,648 116,105
(Continued)

45
ACER INCORPORATED AND SUBSIDIARIES
Notes to Consolidated Financial Statements
In principle, the average credit term granted to customers for the sale of goods ranged from 30 to 90days. To assess the recoverability of the notes and accounts receivable, the Group assesses anychanges in the credit quality between the initial transaction date and the reporting date. Theallowance for doubtful receivables is assessed by referring to the collectability of receivables basedon an individual trade term analysis, the historical payment behavior and current financial conditionof customers, and the provision for sales returns and allowances. Notes and accounts receivable thatare past due but for which the Group has not recognized a specific allowance for doubtfulreceivables after the assessment are still considered recoverable.
In addition, the Group expected the abovementioned other receivables could be collected within oneyear and no allowance was provided for after the assessment.
The Group entered into factoring contracts with several banks to sell part of their accountsreceivable without recourse. At each reporting date, details of these contracts were as follows:
December 31, 2017
Underwriting bankFactoring
credit limitReceivables
soldReceivables
derecognized Interest rate CollateralTaishin International Bank $ 100,000 11,145 11,145 - Nil
December 31, 2016
Underwriting bankFactoring
credit limitReceivables
soldReceivables
derecognized Interest rate CollateralTaishin International Bank $ 170,000 9,049 9,049 - Nil
The factoring credit limit is revolving. According to the factoring contracts, the Group does notassume the risk of uncollectible accounts receivable, but only the risk of loss due to commercialdisputes.
(f) Inventories
December 31,2017
December 31,2016
Raw materials $ 12,895,613 12,332,166
Work in process 27,685 2,871
Finished goods and merchandise 18,120,785 17,867,421
Spare parts 1,045,815 1,151,600
Inventories in transit 7,989,323 7,741,429
$ 40,079,221 39,095,487
For the years ended December 31, 2017 and 2016, the amounts of inventories recognized as cost ofrevenue were as follows:
2017 2016Cost of inventories sold $ 181,399,087 175,756,434
Write-down of (Reversal of) inventories 201,243 (728,757)
$ 181,600,330 175,027,677
(Continued)

46
ACER INCORPORATED AND SUBSIDIARIES
Notes to Consolidated Financial Statements
The reversal of write-down of inventories arose from the increase in the net realizable value or useof raw materials or sale of inventories.
(g) Non-current assets held for sale
On November 9, 2017, the Company’s Board of Directors resolved to sell GWI’s property and plantlocated in North Sioux City. The transaction has been completed in January 2018. The originalcarrying amount of the property and plant was $79,881 (net of accumulated impairment losses of$365,628), with the net disposal proceeds of $161,990; accordingly, the Group reversed itspreviously recognized impairment loss amounting to $82,480, which did not exceed the carryingamount that would have been determined had no impairment loss been recognized in prior years. Thecarrying amount after reversal of accumulated impairment losses was reclassified as non-currentassets held for sale.
(h) Investments accounted for using equity method
A summary of the Group’s financial information for investments in associates and joint ventures atthe reporting date is as follows:
December 31, 2017 December 31, 2016Name of Associates and joint
venturesPercentage of
ownershipCarryingamount
Percentage ofownership
Carryingamount
Associates:
Aegis Semiconductor TechnologyInc. (“ATI”) 44.04 $ 6,969 44.04 15,776
GrandPad Inc. (“GrandPad”) 43.28 261,457 41.03 227,343
ECOM Software Inc. (“ECS”) 33.93 28,456 33.93 27,415
Bluechip Infotech Pty Ltd.(“Bluechip”) 46.29 107,622 29.98 67,262
Innovation and CommercializationAccelerator Inc. (“ICA”) 30.00 21,484 30.00 25,700
Consumer Insights Research(Chongqing) Inc. (“CIR”) 30.00 12,370 - -
Piovision International Inc.(“HPT”) 30.22 16,271 30.22 14,509
Kbest Technology Inc. (“KBest”) 29.84 91,095 22.38 -
Meldcx Pty Ltd. (“MPL”) 40.00 23,309 - -
Others - 372 - 5,291
Joint Ventures:
StarVR Corporation (“ASBZ”,Formerly Acer StarbreezeCorporation) - - 50.00 33,047
$ 569,405 416,343
(Continued)
47
ACER INCORPORATED AND SUBSIDIARIES
Notes to Consolidated Financial Statements
On October 20, 2017, the Group acquired additional 16.67% interest in ASBZ and gained controlover it; accordingly, ASBZ became a subsidiary of the Group since then. Refer to note 6(i) for theinformation related to acquisition of subsidiaries.
Aggregated financial information on associates that were not individually material to the Group wassummarized as follows.
2017 2016Attributable to the Group:
Net loss $ (37,791) (19,017)
Other comprehensive income 741 (2,875)
Total comprehensive income $ (37,050) (21,892)
Financial information on joint venture that was not individually material to the Group wassummarized as follows.
2017 2016Attributable to the Group:
Net income (loss) $ (838) 1,047
Other comprehensive income - -
Total comprehensive income $ (838) 1,047
(i) Acquisition of subsidiaries
(i) Acquisition of AOPEN Inc. and its subsidiaries (AOI)
1) The cost of acquisition
In order to enhance resource integration and competitiveness of digital signage business,on November 24, 2017, the Company subscribed to 28,970,000 shares of AOI through
the private placement conducted by AOI for cash of $333,155 ($11.5 (dollars) per share),
resulting in 40.55% ownership of AOI. The Company is the largest shareholder of AOIand obtained control over it since then.
(Continued)

48
ACER INCORPORATED AND SUBSIDIARIES
Notes to Consolidated Financial Statements
2) In accordance with IFRSs, the identifiable assets acquired and liabilities assumed at theacquisition date are measured at fair value. Based on the evaluation performed by thespecialist, the consideration paid for the acquisition and fair value information of assetsacquired and liabilities assumed from the acquisition on the acquisition date are asfollows:
Purchase consideration $ 333,155
Add: Non-controlling interest in the acquiree (proportionateshare of the fair value of the identifiable net assets) 489,747
Less: fair value of identifiable assets acquired and liabilitiesassumed
Cash and cash equivalents $ 820,168
Notes and accounts receivable, net 264,898
Other receivables 18,168
Inventories 178,523
Other current assets 117,723
Available-for-sale financial assets-non-current 330,473
Investments accounted for using equity method 48,783
Property, plant and equipment 16,504
Intangible assets 4,880
Other non-current assets 9,549
Short-term borrowings (430,722)
Notes and accounts payable (206,440)
Other payables (130,813)
Provisions-current (29,772)
Current income tax liabilities (8,885)
Other current liabilities (94,624)
Deferred income tax liabilities (57,941)
Other non-current liabilities (26,718) (823,754)
Gain on bargain purchase $ (852)
The above-mentioned gain on bargain purchase of $852 was included in non-operatingincome and loss in the consolidated statement of comprehensive income for the yearended December 31, 2017.
3) Pro forma information
From the acquisition date to December 31, 2017, AOI and its subsidiaries contributedrevenue of $91,753 and net loss of $(14,047) to the Group's results. If the acquisition hadoccurred on January 1, 2017, the management estimates that consolidated revenue wouldhave been $238,537,983, and consolidated net income after tax would have been$2,692,379.
(Continued)

49
ACER INCORPORATED AND SUBSIDIARIES
Notes to Consolidated Financial Statements
(ii) Acquisition of StarVR Corporation (ASBZ)
1) The cost of acquisition
To enhance development on design, manufacture, and marketing of virtual reality (VR)products, the Company subscribed to 16,000,000 shares of ASBZ, formerly a jointventure of the Company, for cash of $160,000 on October 20, 2017, which resulted in anincrease in its ownership of ASBZ from 50% to 66.67%, and obtained control overASBZ.
2) In accordance with IFRSs, the identifiable assets and liabilities assumed at theacquisition date are measured at fair value. Based on the evaluation performed by thespecialist, the consideration paid for the acquisition and fair value information of assetsacquired and liabilities assumed from the acquisition on the acquisition date are asfollows:
Purchase consideration $ 160,000
Add: Non-controlling interest in the acquiree (proportionateshare of the fair value of the identifiable net assets) 160,139
Fair value of pre-existing interest in the acquiree 160,000
Cash and cash equivalents $ 185,746
Notes and accounts receivable, net 83,891
Other receivables 164
Inventories 14,514
Other current assets 20,007
Property, plant and equipment 6,551
Other non-current assets 360
Investments in debt instrument without an active market-non-current 296,555
Notes and accounts payable (31,809)
Other payables (86,019)
Provisions-current (9,541)
Other current liabilities (2) (480,417)
Gain on bargain purchase $ (278)
The Company remeasured the fair value of its existing 50% share ownership of ASBZ atthe acquisition date, and recognized a loss on disposal of investments of $209accordingly. The resulting loss, as well as the gain on bargain purchase of $278, wereclassified under non-operating income and loss in the consolidated statement ofcomprehensive income for the year ended December 31, 2017.
(Continued)

50
ACER INCORPORATED AND SUBSIDIARIES
Notes to Consolidated Financial Statements
3) Pro forma information
From the acquisition date to December 31, 2017, ASBZ contributed revenue of $18,346and net loss of $(23,848) to the Group's results. If the acquisition had occurred onJanuary 1, 2017, the management estimates that consolidated revenue would have been$237,308,781, and consolidated net income after tax would have been $2,716,981.
(j) Property, plant and equipment
The movements of cost, and accumulated depreciation and impairment loss of the property, plantand equipment were as follows:
Land Buildings
Computer andcommunication
equipmentOther
equipmentConstructionin progress Total
Cost or deemed cost:
Balance at January 1, 2017 $ 1,508,489 3,725,781 4,310,786 2,870,852 970 12,416,878
Acquisition through businesscombination (note 6(i)) - 7,207 28,670 352,011 224 388,112
Additions - 14,145 157,006 109,809 1,434 282,394
Disposals (7,998) (106,934) (140,968) (214,714) - (470,614)
Reclassification from investmentproperty 39,903 - - - - 39,903
Reclassification to Non-currentassets held for sale (51,753) (591,073) - - - (642,826)
Other reclassification and effect ofexchange rate changes 3,779 (28,279) 12,819 (29,479) (1,075) (42,235)
Balance at December 31, 2017 $ 1,492,420 3,020,847 4,368,313 3,088,479 1,553 11,971,612
Balance at January 1, 2016 $ 1,528,566 3,755,664 4,371,018 3,157,734 1,533 12,814,515
Additions - 16,769 67,416 77,488 2,997 164,670
Disposals (3,007) - (128,394) (228,407) (3,503) (363,311)
Reclassification to investmentproperty - (482) - - - (482)
Other reclassification and effect ofexchange rate changes (17,070) (46,170) 746 (135,963) (57) (198,514)
Balance at December 31, 2016 $ 1,508,489 3,725,781 4,310,786 2,870,852 970 12,416,878
Accumulated depreciation and impairment loss:
Balance at January 1, 2017 $ 159,682 2,504,352 3,303,924 2,127,768 - 8,095,726
Acquisition through businesscombination (note 6(i)) - 5,948 45,832 309,287 - 361,067
Reversal of impairment loss (note6(g)) - (82,480) - - - (82,480)
Depreciation - 80,172 266,927 147,862 - 494,961
Disposals - (102,055) (137,894) (200,727) - (440,676)
Reclassification from investmentproperty 14,690 - - - - 14,690
Reclassification to non-currentassets held for sale (30,646) (450,190) - - - (480,836)
Other reclassification and effect ofexchange rate changes (2,495) (29,842) (5,268) (59,794) - (97,399)
Balance at December 31, 2017 $ 141,231 1,925,905 3,473,521 2,324,396 - 7,865,053
(Continued)

51
ACER INCORPORATED AND SUBSIDIARIES
Notes to Consolidated Financial Statements
Land Buildings
Computer andcommunication
equipmentOther
equipmentConstructionin progress Total
Balance at January 1, 2016 $ 160,490 2,444,758 3,149,217 2,232,638 - 7,987,103
Depreciation - 94,606 299,304 206,404 - 600,314
Disposals - - (127,623) (214,777) - (342,400)
Other reclassification and effect ofexchange rate changes (808) (35,012) (16,974) (96,497) - (149,291)
Balance at December 31, 2016 $ 159,682 2,504,352 3,303,924 2,127,768 - 8,095,726
Carrying amounts:
Balance at December 31, 2017 $ 1,351,189 1,094,942 894,792 764,083 1,553 4,106,559
Balance at December 31, 2016 $ 1,348,807 1,221,429 1,006,862 743,084 970 4,321,152
Refer to note 8 for a description of the Group's property, plant and equipment pledged as collateralfor bank loans.
(k) Investment property
Land Buildings TotalCost or deemed cost:
Balance at January 1, 2017 $ 1,195,613 3,234,411 4,430,024
Reclassification to property, plant and equipment (39,903) - (39,903)
Balance at December 31, 2017 $ 1,155,710 3,234,411 4,390,121
Balance at January 1, 2016 $ 1,195,613 3,233,929 4,429,542
Reclassification from property, plant and equipment - 482 482
Balance at December 31, 2016 $ 1,195,613 3,234,411 4,430,024
Accumulated depreciation and impairment loss:
Balance at January 1, 2017 $ 443,724 2,805,983 3,249,707
Depreciation - 13,905 13,905
Reclassification to property, plant and equipment (14,690) - (14,690)
Balance at December 31, 2017 $ 429,034 2,819,888 3,248,922
Balance at January 1, 2016 $ 443,724 2,793,119 3,236,843
Depreciation - 12,864 12,864
Balance at December 31, 2016 $ 443,724 2,805,983 3,249,707
Carrying amounts:
Balance at December 31, 2017 $ 726,676 414,523 1,141,199
Balance at December 31, 2016 $ 751,889 428,428 1,180,317
Fair value:
Balance at December 31, 2017 $ 1,654,828
Balance at December 31, 2016 $ 1,628,750
(Continued)

52
ACER INCORPORATED AND SUBSIDIARIES
Notes to Consolidated Financial Statements
The fair value of the investment property is determined by referring to the market price of similarreal estate transaction, the valuation (the inputs used in the fair value measurement were classified tolevel 3) by an independent appraiser or the value in use of the investment property. The value in useis the present value of the future cash flows from continuous lease activities. On December 31, 2017and 2016, the estimated discount rate used for calculating the present value of the future cash flows
was 4.90% and 3.78%, respectively.
For certain land acquired, the ownership registration has not been transferred to the land acquirer,APDI, a subsidiary of the Company. To protect its interests, APDI has obtained signed deeds ofassignment from the titleholders assigning all rights and obligations related to the land to APDI.Additionally, the land title certificates are held by APDI, and APDI has registered its liens thereon.
(l) Intangible assets
(i) The movements of costs, and accumulated amortization and impairment loss of intangibleassets were as follows:
Goodwill
Trademarksand trade
names Others TotalBalance at January 1, 2017
Cost $ 26,488,199 10,339,474 12,362,876 49,190,549
Accumulated amortization and impairment loss (8,878,494) (10,326,979) (11,389,154) (30,594,627)
Balance at January 1, 2017 $ 17,609,705 12,495 973,722 18,595,922
Additions - - 38,846 38,846
Acquisition through business combination (note 6(i)) - - 25,308 25,308
Disposals - - (2,319) (2,319)
Reclassification - - 9,395 9,395
Amortization - (12,113) (515,769) (527,882)
Effect of exchange rate changes (931,899) (382) (22,838) (955,119)
Balance at December 31, 2017 $ 16,677,806 - 506,345 17,184,151
Balance at December 31, 2017
Cost $ 24,913,482 10,308,445 10,680,053 45,901,980
Accumulated amortization and impairment loss (8,235,676) (10,308,445) (10,173,708) (28,717,829)
Carrying amount $ 16,677,806 - 506,345 17,184,151
Balance at January 1, 2016
Cost $ 27,276,201 10,566,908 12,762,694 50,605,803
Accumulated amortization and impairment loss (4,802,337) (10,385,722) (8,808,317) (23,996,376)
Balance at January 1, 2016 22,473,864 181,186 3,954,377 26,609,427
Additions - - 5,070 5,070
Reclassification - - 3,367 3,367
Amortization - (17,068) (777,544) (794,612)
Impairment loss (4,145,685) (149,641) (2,068,918) (6,364,244)
Effect of exchange rate changes (718,474) (1,982) (142,630) (863,086)
Balance at December 31, 2016 $ 17,609,705 12,495 973,722 18,595,922
Balance at December 31, 2016
Cost $ 26,488,199 10,339,474 12,362,876 49,190,549
Accumulated amortization and impairment loss (8,878,494) (10,326,979) (11,389,154) (30,594,627)
Carrying amount $ 17,609,705 12,495 973,722 18,595,922
(Continued)

53
ACER INCORPORATED AND SUBSIDIARIES
Notes to Consolidated Financial Statements
The amortization and impairment loss of intangible assets were included in the following lineitems of the statement of comprehensive income:
2017 2016Cost of revenue $ 4,395 1,453
Operating expenses 523,487 793,159
Non-operating loss - 6,364,244
$ 527,882 7,158,856
(ii) Impairment test on goodwill and other intangible assets
The carrying amounts of goodwill arising from a business combination and the respectiveCGUs to which the goodwill was allocated for impairment test purpose as of December 31,2017 and 2016 were as follows:
RO-EMEA RO-PA RO-PAP BYOC
MultipleCGUs
withoutsignificantgoodwill Total
Balance at January 1, 2017 $ 10,205,982 1,649,760 5,736,241 - 17,722 17,609,705
Effect of exchange ratechanges (583,228) (116,071) (232,600) - - (931,899)
Balance at December 31, 2017 $ 9,622,754 1,533,689 5,503,641 - 17,722 16,677,806
Balance at January 1, 2016 $ 12,340,616 2,009,719 8,105,807 - 17,722 22,473,864
Reallocation (1,869,631) (322,383) (2,098,755) 4,290,769 - -
Impairment loss - - - (4,145,685) - (4,145,685)
Effect of exchange ratechanges (265,003) (37,576) (270,811) (145,084) - (718,474)
Balance at December 31, 2016 $ 10,205,982 1,649,760 5,736,241 - 17,722 17,609,705
Each CGU to which the goodwill is allocated represents the lowest level within the Group, atwhich the goodwill is monitored for internal management purpose.
The Group activated an organizational restructuring with respect to its new business and corebusiness in 2016. In the fourth quarter of 2016, the new organization structure was ascertainedand the new companies had been set up. Consequently, the Group re-defined CGU and BYOCwas identified as an individual CGU.
Based on the results of impairment tests conducted by the Group in the fourth quarter of 2016,the expected recoverable amount of CGU-BYOC was less than its carrying amount; as a result,the Group recognized an impairment loss on goodwill and developed & developing technology
of $4,145,685 and $2,068,918, respectively.
The Group adjusted its brand strategy and re-allocated its resources in the fourth quarter of2016, under which the Group expected the future cash flow, arising from the trademarks ofGateway and Packard Bell, will be minimal considering that the related trade names, as well astheir related maintenance costs, will only be used and promoted in specific areas. As a result,
the Group recognized an impairment loss on trademarks of $149,641 in 2016.
(Continued)

54
ACER INCORPORATED AND SUBSIDIARIES
Notes to Consolidated Financial Statements
The recoverable amount of a CGU was determined based on the value in use, and the relatedkey assumptions were as follows:
1) The cash flow projections were based on historical operating performance and futurefinancial budgets, covering a period of 5 years, approved by management and estimatedterminal values at the end of the 5-year period. Cash flows beyond that 5-year periodhave been extrapolated using the following growth rates:
RO-EMEA RO-PA RO-PAP BYOC2017.12.31 0% 0% 0% -
2016.12.31 0% 0% 0% %5.0
2) Discount rates used to determine the value in use for each CGU were as follows:
RO-EMEA RO-PA RO-PAP BYOC2017.12.31 %19.4 %11.1 %23.3 -
2016.12.31 %18.7 %12.1 %19.4 %14.5
The estimation of discount rate is based on the weighted average cost of capital.
(m) Other current assets and other non-current assets
December 31,2017
December 31,2016
Tax overpaid retained for offsetting against futurebusiness tax payable
$ 2,259,644 2,328,881
Prepaid income tax 921,297 783,180
Prepaid royalty and other prepayments 802,829 841,657
Others 195,639 321,840
$ 4,179,409 4,275,558
Current $ 3,078,330 3,122,630
Non-current 1,101,079 1,152,928
$ 4,179,409 4,275,558
(n) Short-term borrowings
December 31,2017
December 31,2016
Unsecured bank loans $ 482,894 103,000
Unused credit facilities $ 29,583,089 30,647,073
Interest rate 0.98%~4.30% 1.00%~1.27%
(Continued)

55
ACER INCORPORATED AND SUBSIDIARIES
Notes to Consolidated Financial Statements
(o) Long-term debt
December 31,2017
December 31,2016
Unsecured bank loans $ 6,000,000 6,000,000
Secured bank loans 2,457 -
Less: current portion of long-term debt (2,701,958) (6,000,000)
$ 3,300,499 -
(i) Bank loans
Type ofLoan Creditor Credit Line Term
December 31,2017
December 31,2016
Unsecuredloan
Bank ofTaiwan andother banks
The term trancheof $6 billion maybe withdrawnseparately withintwelve monthsfrom the date ofthe initialwithdrawal; three-year limit, duringwhich, revolvingcredits aredisallowed
The loan is repayablein 6 quarterlyinstallments ($0.9billion for the first tothe fifth installments,and $1.5 billion for thesixth installment)starting February 2018.The Company earlyrepaid $3.3 billion inadvance in November2017.
2,700,000 6,000,000
Revolving trancheof $6 billion;three-year limit
One-time repayment infull when due. Thecredit facility has notbeen used.
- -
Unsecuredloan
Bank ofTaiwan
The term trancheof $4 billion maybe withdrawnseparately withinsix months fromthe contract date;revolving creditsare allowed.
The interest is paidmonthly startingNovember 2017. Theprincipal will have tobe repaid in lump sumamount when due inAugust 2019. Interestrate is adjustedquarterly.
3,300,000 -
Securedloan
2,457 -
Less: current portion of long-term debt (2,701,958) (6,000,000)
$ 3,300,499 -
Unused credit facilities $ 6,700,000 6,000,000
Interest rate 0.98%~3.92% 1.80%
(Continued)
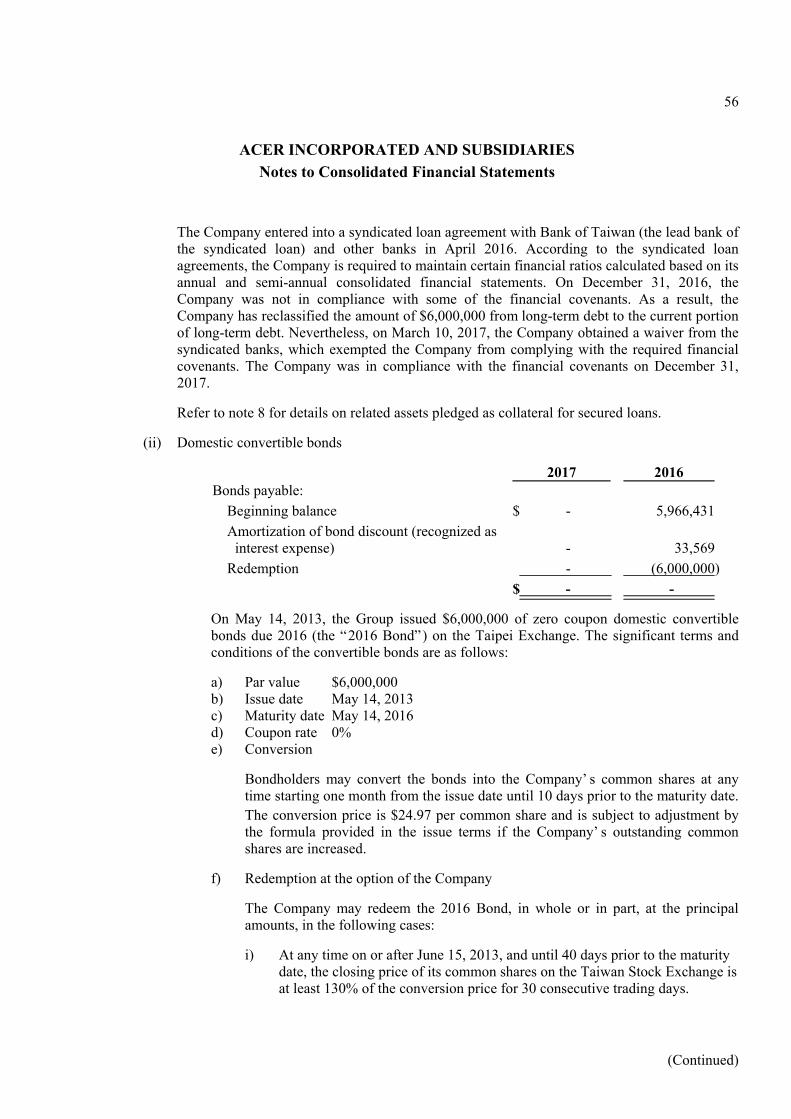
56
ACER INCORPORATED AND SUBSIDIARIES
Notes to Consolidated Financial Statements
The Company entered into a syndicated loan agreement with Bank of Taiwan (the lead bank ofthe syndicated loan) and other banks in April 2016. According to the syndicated loanagreements, the Company is required to maintain certain financial ratios calculated based on itsannual and semi-annual consolidated financial statements. On December 31, 2016, theCompany was not in compliance with some of the financial covenants. As a result, theCompany has reclassified the amount of $6,000,000 from long-term debt to the current portionof long-term debt. Nevertheless, on March 10, 2017, the Company obtained a waiver from thesyndicated banks, which exempted the Company from complying with the required financialcovenants. The Company was in compliance with the financial covenants on December 31,2017.
Refer to note 8 for details on related assets pledged as collateral for secured loans.
(ii) Domestic convertible bonds
2017 2016Bonds payable:
Beginning balance $ - 5,966,431
Amortization of bond discount (recognized asinterest expense) - 33,569
Redemption - (6,000,000)
$ - -
On May 14, 2013, the Group issued $6,000,000 of zero coupon domestic convertiblebonds due 2016 (the “2016 Bond”) on the Taipei Exchange. The significant terms andconditions of the convertible bonds are as follows:
a) Par value $6,000,000b) Issue date May 14, 2013c) Maturity date May 14, 2016d) Coupon rate 0%e) Conversion
Bondholders may convert the bonds into the Company’ s common shares at anytime starting one month from the issue date until 10 days prior to the maturity date.
The conversion price is $24.97 per common share and is subject to adjustment bythe formula provided in the issue terms if the Company’ s outstanding commonshares are increased.
f) Redemption at the option of the Company
The Company may redeem the 2016 Bond, in whole or in part, at the principalamounts, in the following cases:
i) At any time on or after June 15, 2013, and until 40 days prior to the maturitydate, the closing price of its common shares on the Taiwan Stock Exchange isat least 130% of the conversion price for 30 consecutive trading days.
(Continued)

57
ACER INCORPORATED AND SUBSIDIARIES
Notes to Consolidated Financial Statements
ii) At any time on or after June 15, 2013, and until 40 days prior to the maturitydate, the outstanding balance of the convertible bonds is less than 10% of theoriginal issuance amount.
g) Redemption at maturity
Unless previously redeemed, repurchased and cancelled, or converted, theCompany shall redeem the bonds at their par value in cash.
The Company redeemed the domestic convertible bonds at the redemption price of
$6,000,000 in 2016.
(p) Provisions
Warranties LitigationSales
returns
Environmentalprotection and
others TotalBalance at January 1, 2017 $ 4,830,430 289,160 1,186,327 230,909 6,536,826
Assumed in a business combination 38,700 - - 613 39,313
Additions 5,429,579 17,252 4,057,256 100,608 9,604,695
Amount utilized and reversed (5,289,614) (19,862) (3,869,730) (160,591) (9,339,797)
Effect of exchange rate changes (23,951) (20,430) (92,730) (2,233) (139,344)
Balance at December 31, 2017 $ 4,985,144 266,120 1,281,123 169,306 6,701,693
Current $ 4,985,144 262,942 1,281,123 126,792 6,656,001
Non-current - 3,178 - 42,514 45,692
$ 4,985,144 266,120 1,281,123 169,306 6,701,693
Balance at January 1, 2016 $ 5,410,999 360,927 1,074,649 228,076 7,074,651
Additions 5,693,275 271,248 4,312,681 105,584 10,382,788
Amount utilized and reversed (6,053,369) (317,347) (4,175,225) (97,734) (10,643,675)
Effect of exchange rate changes (220,475) (25,668) (25,778) (5,017) (276,938)
Balance at December 31, 2016 $ 4,830,430 289,160 1,186,327 230,909 6,536,826
Current $ 4,830,430 286,098 1,186,327 173,451 6,476,306
Non-current - 3,062 - 57,458 60,520
$ 4,830,430 289,160 1,186,327 230,909 6,536,826
(i) Warranties
The provision for warranties is made based on the number of units sold currently underwarranty, historical rates of warranty claim on those units, and cost per claim to satisfy thewarranty obligation. The Group reviews the estimation basis on an ongoing basis and revisesit when appropriate.
(ii) Litigation
Litigation provisions are recorded for pending litigation when it is determined that anunfavorable outcome is probable and the amount of loss can be reasonably estimated.
(iii) Sales returns
Expected sales returns are estimated based on historical experience.
(Continued)
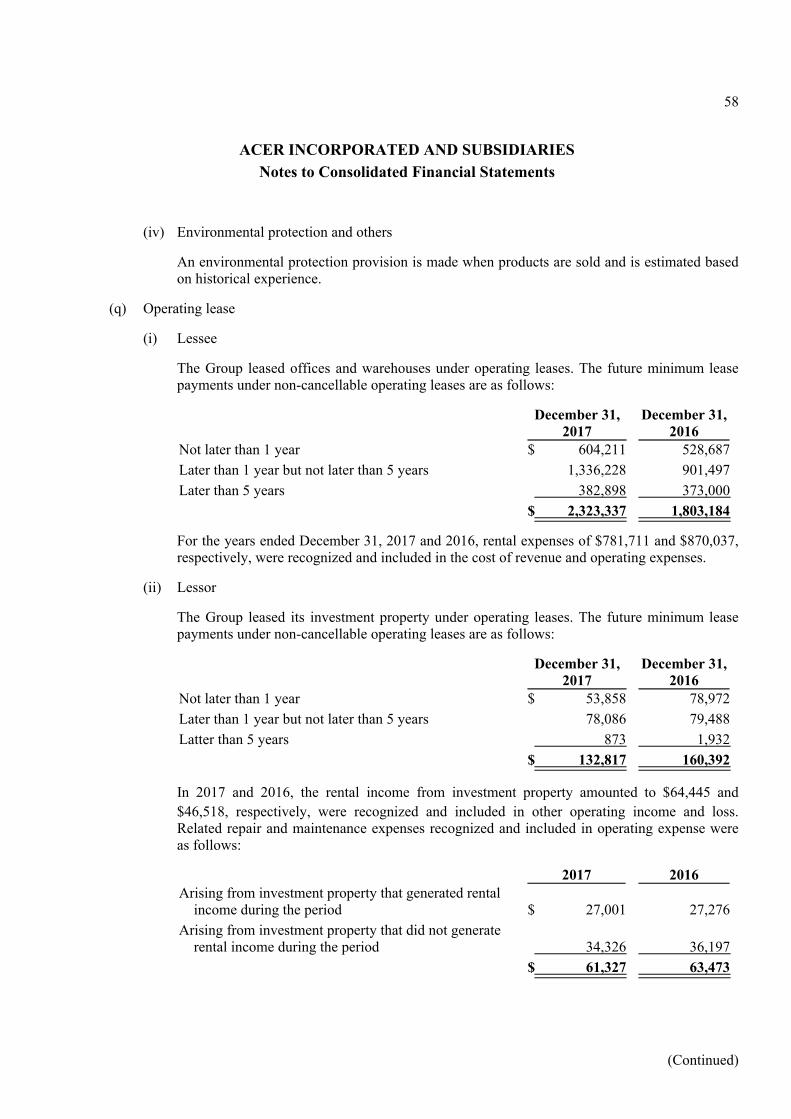
58
ACER INCORPORATED AND SUBSIDIARIES
Notes to Consolidated Financial Statements
(iv) Environmental protection and others
An environmental protection provision is made when products are sold and is estimated basedon historical experience.
(q) Operating lease
(i) Lessee
The Group leased offices and warehouses under operating leases. The future minimum leasepayments under non-cancellable operating leases are as follows:
December 31,2017
December 31,2016
Not later than 1 year $ 604,211 528,687
Later than 1 year but not later than 5 years 1,336,228 901,497
Later than 5 years 382,898 373,000
$ 2,323,337 1,803,184
For the years ended December 31, 2017 and 2016, rental expenses of $781,711 and $870,037,respectively, were recognized and included in the cost of revenue and operating expenses.
(ii) Lessor
The Group leased its investment property under operating leases. The future minimum leasepayments under non-cancellable operating leases are as follows:
December 31,2017
December 31,2016
Not later than 1 year $ 53,858 78,972
Later than 1 year but not later than 5 years 78,086 79,488
Latter than 5 years 873 1,932
$ 132,817 160,392
In 2017 and 2016, the rental income from investment property amounted to $64,445 and
$46,518, respectively, were recognized and included in other operating income and loss.Related repair and maintenance expenses recognized and included in operating expense wereas follows:
2017 2016Arising from investment property that generated rental
income during the period $ 27,001 27,276
Arising from investment property that did not generate rental income during the period 34,326 36,197
$ 61,327 63,473
(Continued)

59
ACER INCORPORATED AND SUBSIDIARIES
Notes to Consolidated Financial Statements
(r) Employee benefits
(i) Defined benefit plans
The reconciliation between the present value of defined benefit obligations and the net definedbenefit liabilities (assets) for defined benefit plans was as follows:
December 31,2017
December 31,2016
Present value of benefit obligations $ 2,428,616 2,219,704
Fair value of plan assets (999,201) (892,353)
Net defined benefit liabilities (reported under other non-current liabilities) $ 1,429,415 1,327,351
December 31,2017
December 31,2016
Present value of benefit obligations $ 43,017 40,483
Fair value of plan assets (73,517) (72,804)
Net defined benefit assets (reported under other non-current assets) $ (30,500) (32,321)
The Company and its domestic subsidiaries make defined benefit plan contributions to thepension fund account at Bank of Taiwan that provides pension benefits for employees uponretirement. The plans (covered by the Labor Standards Law) entitle a retired employee toreceive a payment based on years of service and average salary for the six months prior to theemployee’s retirement.
Foreign subsidiaries, including AJC, ATH, AIN, AMI, AIL, APHI, AEG, ASZ, AIT, ASIN,ACF and AOJ, also have defined benefit pension plans based on their respective local laws andregulations.
1) Composition of plan assets
The pension fund (the “Fund”) contributed by the Company and its domestic subsidiariesis managed and administered by the Bureau of Labor Funds of the Ministry of Labor (theBureau of Labor Funds). According to the “ Regulations for Revenues, Expenditures,Safeguard and Utilization of the Labor Retirement Fund”, with regard to the utilizationof the Fund, minimum earnings shall be no less than the earnings attainable from two-year time deposits with interest rates offered by local banks. The Company and itsdomestic subsidiaries also established pension funds in accordance with the “RegulationsGoverning the Management, Investment, and Distribution of the Employees’ RetirementFund Established by a Profit-seeking Enterprise”, which are funded by time deposits andbank deposits deposited in the designated financial institutions. The administration ofpension funds is separate from the Group, and the principal and interest from such fundsshall not be used in any form except for the payment of pension and severance toemployees.
(Continued)

60
ACER INCORPORATED AND SUBSIDIARIES
Notes to Consolidated Financial Statements
Foreign subsidiaries with defined benefit pension plans make pension contributions topension management institutions in accordance with their respective local regulations.
As of December 31, 2017 and 2016, the Group’ s fair value of plan assets, by majorcategories, was as follows:
December 31,2017
December 31,2016
Cash $ 481,557 459,438
Equity instruments 332,136 269,283
Instruments with fixed return 58,661 79,018
Real estate 200,364 157,418
$ 1,072,718 965,157
Cash includes the labor pension fund assets. For information on the domestic laborpension fund assets (including the asset portfolio and yield of the fund), please refer tothe website of the Bureau of Labor Funds.
2) Movements in present value of the defined benefit obligations
2017 2016Defined benefit obligations at January 1 $ 2,260,187 2,347,157
Current service costs 210,124 221,691
Net interest expense 28,054 34,454
Remeasurement on the net defined benefit liabilities(assets) :
Actuarial loss (gain) arising from experienceadjustments 61,023 (35,063)
Actuarial loss (gain) arising from changes inpopulation assumption 2,431 (28,970)
Actuarial loss (gain) arising from changes infinancial assumption (8,890) 90,888
Benefits paid by the Group and the plan (145,648) (363,699)
Past service costs and settlement loss 203 2,166
Liabilities assumed in a business combination 63,261 -
Effect of exchange rate changes (19,211) (33,337)
Contributions by plan participants 20,099 24,900
Defined benefit obligations at December 31 $ 2,471,633 2,260,187
(Continued)

61
ACER INCORPORATED AND SUBSIDIARIES
Notes to Consolidated Financial Statements
3) Movements in fair value of plan assets
2017 2016Fair value of plan assets at January 1 $ 965,157 1,157,220
Interest income 10,363 15,438
Remeasurement on the net defined benefit liabilities(assets):
Return on plan assets (excluding amountsincluded in net interest expense) 19,119 (15,746)
Benefits paid by the plan (135,291) (358,846)
Contributions by plan participants 20,099 24,900
Contributions by the employer 123,533 145,320
Assets acquired through business combination 37,666 -
Effect of exchange rate changes 32,072 (3,129)
Fair value of plan assets at December 31 $ 1,072,718 965,157
4) Changes in the effect of the asset ceiling
In 2017 and 2016, there was no effect of the asset ceiling.
5) Expenses recognized in profit or loss
2017 2016Current service costs $ 210,124 221,691
Net interest expense 17,691 19,016
Past service costs and settlement loss 203 2,166
$ 228,018 242,873
Classified under operating expense $ 228,018 242,873
6) Remeasurement of the net defined benefit liabilities (assets) recognized in othercomprehensive income
2017 2016Cumulative amount at January 1 (102,675) (60,074)
Recognized during the period (35,445) (42,601)
Cumulative amount at December 31 $ (138,120) (102,675)
7) Actuarial assumptions
The principal assumptions of the actuarial valuation were as follows:
December 31,2017
December 31,2016
Discount rate 0.30%~7.63% 0.30%~8.40%
Future salary increases rate 1.00%~6.00% 1.00%~6.50%
(Continued)

62
ACER INCORPORATED AND SUBSIDIARIES
Notes to Consolidated Financial Statements
The weighted average duration of the defined benefit plans is ranged from 6 years to 28years. The Group expects to make contribution of $121,265 to the defined benefit plansin the year following December 31, 2017.
8) Sensitivity analysis
When calculating the present value of the defined benefit obligations, the Group usesjudgments and estimations to determine the actuarial assumptions for each measurementdate, including discount rates and future salary changes. Any changes in the actuarialassumptions may significantly impact the amount of the defined benefit obligations.
The following table summarizes the impact of a change in the assumptions on the presentvalue of the defined benefit obligation on December 31, 2017 and 2016.
December 31, 2017 December 31, 2016
0.25% Increase
0.25%Decrease
0.25%Increase
0.25%Decrease
Discount rate $ (102,352) 115,350 (97,254) 109,766
Future salary change $ 61,642 (59,065) 60,417 (58,388)
Each sensitivity analysis considers the change in one assumption at a time, leaving theother assumptions unchanged. This approach shows the isolated effect of changing oneindividual assumption but does not take into account that some assumptions are related.The method used to carry out the sensitivity analysis is the same as the calculation of thenet defined benefit liabilities recognized in the balance sheets. The method used to carryout the sensitivity analysis is the same as in the prior year.
(ii) Defined contribution plans
The Company and its domestic subsidiaries contribute monthly an amount equal to 6% of eachemployee’s monthly wages to the employee’s individual pension fund account at the Bureau ofLabor Insurance in accordance with the provisions of the Labor Pension Act. Under thisdefined contribution plan, the Group has no legal or constructive obligation to pay additionalamounts after contributing a fixed amount to the Bureau of Labor Insurance. Foreignsubsidiaries make contributions in compliance with their respective local regulations.
For the years ended December 31, 2017 and 2016, the Group recognized pension expenses of$350,873 and $368,239, respectively, in relation to the defined contribution plans.
(Continued)

63
ACER INCORPORATED AND SUBSIDIARIES
Notes to Consolidated Financial Statements
(s) Income taxes
(i) Income tax returns of the Group are filed individually by each entity and not on a combinedbasis. The Company and its subsidiaries incorporated in the R.O.C. are subject to R.O.C.income tax at a rate of 17% for the years 2017 and 2016. Foreign subsidiaries calculatedincome tax in accordance with their respective local tax law and regulations. The componentsof income tax expense were as follows:
2017 2016Current income tax expense
Current period $ 471,755 319,654
Adjustments for prior years (150,444) 402,930
321,311 722,584
Deferred tax expense (benefit)
Origination and reversal of temporary differences 3,194,749 (973,607)
Change in unrecognized deductible temporarydifferences and tax losses (2,873,661) 427,438
321,088 (546,169)
Income tax expense $ 642,399 176,415
The components of income tax benefit recognized in other comprehensive income were asfollows:
2017 2016Items that will not be reclassified subsequently to profit
or loss:
Remeasurement of defined benefit plans 11,050 29,720
Items that may be reclassified subsequently to profit orloss:
Exchange differences on translation of foreignoperations 18 353
11,068 30,073
Reconciliation between the expected income tax expense calculated based on the Company'sstatutory tax rate and the actual income tax expense reported in the consolidated statements ofcomprehensive income (loss) was as follows:
2017 2016Income (loss) before taxes $ 3,439,132 (4,724,325)
Income tax using the Company’s statutory tax rate $ 584,652 (803,135)
Effect of different tax rates in foreign jurisdictions 371,004 (888,022)
Adjustments for prior-year income tax expense (150,444) 402,930
Change in unrecognized temporary differences and tax losses (696,550) 427,438
Loss on impairment of goodwill - 1,450,990
Others 533,737 (413,786)
$ 642,399 176,415
(Continued)

64
ACER INCORPORATED AND SUBSIDIARIES
Notes to Consolidated Financial Statements
(ii) Deferred income tax assets and liabilities
1) Unrecognized deferred income tax assets
December 31,2017
December 31,2016
Tax losses $ 5,361,238 7,144,728
Loss associated with investments in subsidiaries 2,818,394 2,741,033
Deductible temporary differences 3,768,943 4,610,005
$ 11,948,575 14,495,766
The tax benefits from tax losses that each entity in the Group is entitled to in accordancewith the respective local tax regulations of each jurisdiction were not recognized asdeferred income tax assets as management believed that it is not probable that futuretaxable profits will be available against which the Group can utilize the benefitstherefrom.
As of December 31, 2017, the unrecognized tax losses and the respective expiry yearswere as follows:
Tax effects of tax losses Year of expiry$ 133,496 2018
276,694 2019
106,635 2020
349,684 2021
4,494,729 2022 and thereafter
$ 5,361,238
2) Unrecognized deferred income tax liabilities
December 31,2017
December 31,2016
Net profits associated with investments in subsidiaries$ 4,161,413 4,241,957
The Company is able to control the timing of the reversal of the temporary differencesassociated with investments in subsidiaries. As management believed that it is probablethat the temporary differences will not reverse in the foreseeable future, such temporarydifferences were not recognized as deferred income tax liabilities.
(Continued)

65
ACER INCORPORATED AND SUBSIDIARIES
Notes to Consolidated Financial Statements
3) Recognized deferred income tax assets and liabilities
Changes in the amount of deferred income tax assets and liabilities were as follows:
Deferred income tax assets:
Inventory
Accruedexpenses
andprovisions
Unused taxloss
carryforwards Others TotalBalance at January 1, 2017 $ 160,791 266,522 116,972 117,992 662,277
Recognized in profit or loss 8,442 (17,056) (2,458) (19,974) (31,046)
Recognized in other comprehensiveincome (loss) - - - 11,068 11,068
Effect of exchange rate changes - - - 14,179 14,179
Balance at December 31, 2017 $ 169,233 249,466 114,514 123,265 656,478
Balance at January 1, 2016 $ 169,811 377,754 252,066 38,515 838,146
Recognized in profit or loss (9,020) (111,232) (135,094) 57,049 (198,297)
Recognized in other comprehensiveincome (loss) - - - 30,073 30,073
Effect of exchange rate changes - - - (7,645) (7,645)
Balance at December 31, 2016 $ 160,791 266,522 116,972 117,992 662,277
Deferred income tax liabilities:
Unremittedearnings fromsubsidiaries
Unrealized foreignexchange gain andunrealized gain on
valuation offinancial
instrumentsIntangible
assets Others Total
Balance at January 1, 2017 $ 564,619 8,117 106,126 13,851 692,713
Assumed through businesscombination 57,863 - - 78 57,941
Recognized in profit or loss 74,404 143,980 75,341 (3,683) 290,042
Balance at December 31, 2017 $ 696,886 152,097 181,467 10,246 1,040,696
Balance at January 1, 2016 $ 560,770 7,865 854,281 14,263 1,437,179
Recognized in profit or loss 3,849 252 (748,155) (412) (744,466)
Balance at December 31, 2016 $ 564,619 8,117 106,126 13,851 692,713
(iii) The Company’s income tax returns for the years through 2014 were examined and approved bythe R.O.C. income tax authorities.
(iv) Information about the integrated income tax system
December 31,2017
December 31,2016
Unappropriated earnings earned (accumulated deficit)commencing from January 1, 1998 (Note) $ (4,900,296)
Balance of imputation credit account (Note) $ 1,821,486
(Continued)

66
ACER INCORPORATED AND SUBSIDIARIES
Notes to Consolidated Financial Statements
2017(estimated)
2016(actual)
Creditable ratio for distribution of earnings to R.O.C.residents (Note) - %
The abovementioned integrated income tax information was prepared in accordance withDecree No. 10204562810 announced by the Ministry of Finance of the R.O.C. on October 17,2013.
Note: According to the amendments to the "Income Tax Act” enacted by the office of thePresident of the Republic of China (Taiwan) on February 7, 2018, effective January 1, 2018,companies will no longer be required to establish, record, calculate, and distribute their ICAdue to the abolishment of the imputation tax system.
(t) Capital and other equity
(i) Common stock
The Company had issued 17,460,000 shares of restricted stock to its employees on August 26,2014. In 2017 and 2016, the Company recalled 4,230,000 and 4,710,000 shares, respectively,of restricted stock due to the resignation and retirement of certain employees, as well as failingto meet certain vesting conditions. The Board of Directors had approved a resolution of theretirement of restricted shares of stock issued to employees and the related registration processhas been completed.
As of December 31, 2017 and 2016, the Company had issued 6,446 thousand units and 6,588thousand units, respectively, of global depository receipts (GDRs). The GDRs were listed onthe London Stock Exchange, and each GDR represents five common shares.
As of December 31, 2017 and 2016, the Company’ s authorized shares of common stock
consisted of 3,500,000,000 shares, of which 3,076,502,828 shares and 3,080,732,828 shares,
respectively, were issued. The par value of the Company’s common stock is $10 per share.All issued shares were paid up upon issuance.
Certain shares of common stock were not outstanding as they were held by the Company’ ssubsidiaries or were non-vested restricted stock. The movements in outstanding shares ofcommon stock in 2017 and 2016 were as follows (in thousands of shares):
2017 2016Balance at January 1 (at December 31) 3,026,277 3,026,277
(Continued)

67
ACER INCORPORATED AND SUBSIDIARIES
Notes to Consolidated Financial Statements
(ii) Capital surplus
December 31,2017
December 31,2016
Share premium:
Paid-in capital in excess of par value $ 13,173,098 14,711,477
Surplus from mergers 16,027,221 19,475,618
Surplus related to treasury stock transactions and cashdividend 307,802 284,494
Others:
Employee share options 90,000 90,000
Surplus from equity-method investments 173,516 143,269
Restricted stock issued to employees 80,547 38,247
$ 29,852,184 34,743,105
Pursuant to the Company Act, any realized capital surplus is initially used to coveraccumulated deficit, and the balance, if any, could be transferred to common stock as stockdividends or distributed by cash based on the original shareholding ratio. Realized capitalsurplus includes the premium derived from the issuance of shares of stock in excess of parvalue and donations received by the Company. In accordance with the “ RegulationsGoverning the Offering and Issuance of Securities by Securities Issuers”, distribution of stockdividends from capital surplus in any one year shall not exceed 10% of paid-in capital.
(iii) Legal reserve, special reserve, and dividend policy
The Company’s Articles of Incorporation stipulate that at least 10% of annual net income, afterdeducting accumulated deficit, if any, must be retained as legal reserve until such retentionequals the amount of paid-in capital. In addition, a special reserve shall be set aside inaccordance with applicable laws and regulations. The remaining balance, together with theunappropriated earnings from the previous years, after retaining a certain portion of it forbusiness considerations, can be distributed as dividends to stockholders. Except for thedistribution of capital surplus and legal reserve in accordance with applicable laws andregulations, the Company cannot distribute any earnings when there are no retained earnings.
Since the Company operates in an industry experiencing rapid change and development,earnings are distributed in consideration of the current year’s earnings, the overall economicenvironment, related laws and decrees, and the Company’ s long-term development andstability in its financial position. The Company has adopted a stable dividend policy, in whicha cash dividend comprises at least 10% of the total dividend distribution.
Additionally, according to the Company Act, a company shall first retain 10% of its incomeafter taxes as legal reserve until such retention equals the amount of paid-in capital. If acompany has no accumulated deficit, it may, pursuant to a resolution approved by thestockholders, distribute its legal reserve by issuing new shares or distributing cash for theportion of legal reserve which exceeds 25% of the paid-in capital.
(Continued)

68
ACER INCORPORATED AND SUBSIDIARIES
Notes to Consolidated Financial Statements
In accordance with Ruling No. 1010047490 issued by the FSC on November 21, 2012, aspecial reserve shall be retained at an amount equal to the proportionate share of the carryingvalue of the treasury stock held by subsidiaries in excess of the market value at the reportingdate. The special reserve may be reversed when the market value recovers in subsequentperiods.
In accordance with Ruling No. 1010012865 issued by the FSC on April 6, 2012, a specialreserve equal to the total amount of items that are accounted for as deductions fromstockholders’ equity shall be set aside from current and prior-year earnings. This specialreserve shall revert to retained earnings and be made available for distribution when the itemsthat are accounted for as deductions from stockholders’ equity are reversed in subsequentperiods.
On June 21, 2017, the Company’s shareholders approved a decrease in its special reserve, legal
reserve and capital surplus of $1,306,709, $145,190 and $3,448,397, respectively, to offset theaccumulated deficit. Additionally, the Company’ s shareholders decided to distribute cash
deriving from the capital surplus of $1,538,379 ($0.5 dollars per share), of which $23,308 wasdistributed to the subsidiaries holding the Company’s common shares of stock.
The balance of 2015 net income was reduced to zero, after offsetting the deficit of $83,446arising from the retirement of treasury stock and adoption 2013 Taiwan-IFRSs, and theappropriation of legal reserve and special reserve of $52,024 and $468,211, respectively.Therefore, the Company’ s shareholders resolved not to distribute any dividend during theirmeeting held on June 24, 2016. Nevertheless, the Company’ s shareholders decided todistribute cash deriving from the capital surplus of $1,540,501 ($0.5 dollars per share), ofwhich $23,494 was distributed to the subsidiaries holding the Company’s common shares ofstock. Related information on the appropriation of earnings proposed by the Board of Directorsand approved by the shareholders is available on the Market Observation Post System websiteof the Taiwan Stock Exchange.
The appropriation of 2017 earnings had been proposed by the Company’s Board of Directorson March 21, 2018, which included the appropriation of legal reserve and special reserve of$281,559 and $2,534,028, respectively, as well as the cash distribution at $0.7 dollars per sharefrom the capital surplus.
(iv) Treasury stock
As of December 31, 2017 and 2016, details of the GDRs (for the implementation of anoverseas employee stock option plan) held by subsidiary AWI and the Company’ s commonstock held by subsidiaries AWI (to maintain the Company’ s shareholders’ equity), CCI (tomaintain the Company’s shareholders’ equity), and ETEN (resulting from the acquisition ofETEN) were as follows (expressed in thousands of shares):
December 31, 2017
Number ofshares
Carryingamount Market value
Common stock 21,809 $ 945,239 526,687
GDRs 24,937 1,969,617 558,991
$ 2,914,856 1,085,678
(Continued)
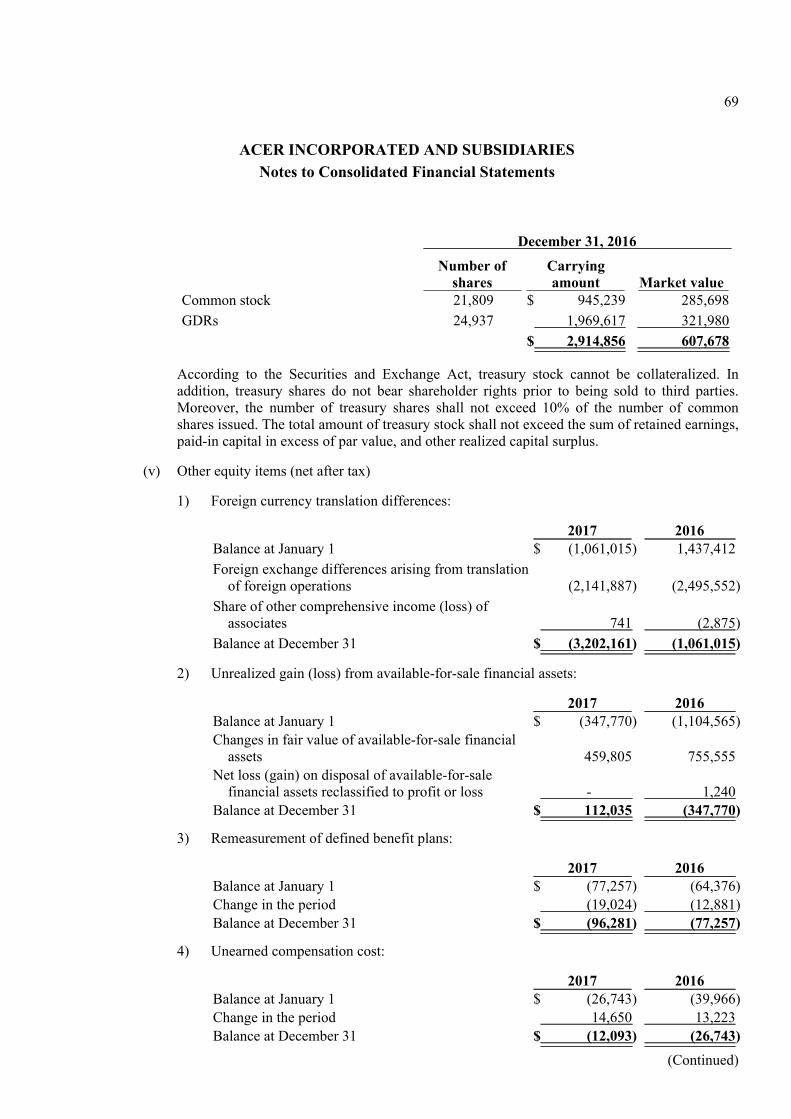
69
ACER INCORPORATED AND SUBSIDIARIES
Notes to Consolidated Financial Statements
December 31, 2016
Number ofshares
Carryingamount Market value
Common stock 21,809 $ 945,239 285,698
GDRs 24,937 1,969,617 321,980
$ 2,914,856 607,678
According to the Securities and Exchange Act, treasury stock cannot be collateralized. Inaddition, treasury shares do not bear shareholder rights prior to being sold to third parties.Moreover, the number of treasury shares shall not exceed 10% of the number of commonshares issued. The total amount of treasury stock shall not exceed the sum of retained earnings,paid-in capital in excess of par value, and other realized capital surplus.
(v) Other equity items (net after tax)
1) Foreign currency translation differences:
2017 2016Balance at January 1 $ (1,061,015) 1,437,412
Foreign exchange differences arising from translationof foreign operations (2,141,887) (2,495,552)
Share of other comprehensive income (loss) ofassociates 741 (2,875)
Balance at December 31 $ (3,202,161) (1,061,015)
2) Unrealized gain (loss) from available-for-sale financial assets:
2017 2016Balance at January 1 $ (347,770) (1,104,565)
Changes in fair value of available-for-sale financialassets 459,805 755,555
Net loss (gain) on disposal of available-for-salefinancial assets reclassified to profit or loss - 1,240
Balance at December 31 $ 112,035 (347,770)
3) Remeasurement of defined benefit plans:
2017 2016Balance at January 1 $ (77,257) (64,376)
Change in the period (19,024) (12,881)
Balance at December 31 $ (96,281) (77,257)
4) Unearned compensation cost:
2017 2016Balance at January 1 $ (26,743) (39,966)
Change in the period 14,650 13,223
Balance at December 31 $ (12,093) (26,743)
(Continued)

70
ACER INCORPORATED AND SUBSIDIARIES
Notes to Consolidated Financial Statements
(vi) Non-controlling interests (net after tax)
2017 2016Balance at January 1 $ 4,083 2,370
Equity attributable to non-controlling interests
Net loss (18,854) (444)
Share-based compensation cost of subsidiaries 12 -
Capital injection from non-controlling interests 19,893 -
Changes in ownership interest in subsidiaries (1,634) -
Foreign currency translation differences 9,867 2,157
Unrealized gain (loss) from available-for-salefinancial assets (1,919) -
Remeasurement of defined benefit plans (5,371) -
Acquisition of subsidiaries 649,886 -
Balance at December 31 $ 655,963 4,083
(u) Share-based payment
(i) ASBZ – Employee stock option plans (ESOPs)
Grant Date 2017/12/15
Numbers of options granted 3,580 units
Numbers of common shares eligible to be subscribed for (each unit)
1,000 shares
Contract period until 2018/01/31
Vesting period 2017/12/15~2018/01/22
Qualified employees Employees of ASBZ
ASBZ used the Black-Scholes Model in measuring the fair value of its employee stock optionat the date of grant. The main inputs to the valuation model were as follows:
Fair value of options granted (NT$/ share) 0.0756
Fair value of stock at grant date (NT$/ share) 23.52
Exercise price (NT$/ share) 30.00
Expected volatility 43.92%
Expected life (in years) 0.11
Risk-free interest rate 0.34%
Expected volatility was determined based on the vesting period and historical volatility of thecomparable companies. The risk-free interest rate was determined based on government bonds.
(Continued)

71
ACER INCORPORATED AND SUBSIDIARIES
Notes to Consolidated Financial Statements
Details of the employee stock options were as follows:
2017
Number ofoptions
Weightedaverage
exercise priceOutstanding at 1 January - $ -
Granted during the year 3,580 30.00
Outstanding at 31 December 3,580 30.00
Exercisable at 31 December - -
Information on outstanding ESOPs at reporting date was as follows:
December 31, 2017
Year of
grant
Numbers
outstanding
Weighted-
average
remaining
contractual
years
Weighted-average
exercise priceNumbers
exercisable2017 3,580 0.085 $ 30.00 -
For the year ended December 31, 2017, the Group recognized the compensation cost of $35 forthe aforementioned ESOPs.
(ii) The Company-restricted stock to employees
During their meeting on June 18, 2014, the Company’s shareholders approved a resolution toissue 50,000,000 shares of restricted stock to full-time employees who conformed to certainrequirements. The Company has filed an effective registration with the Securities and FuturesBureau of the FSC for the issuance.
On August 26, 2014, the Company issued 17,460,000 shares of restricted stock to itsemployees, and the effective date of capital increase was set on the same date. The employeeswho were granted restricted stock are entitled to purchase the shares of restricted stock at theexercise price of $ 0. The vesting period of the restricted stock is 1~4 years subsequent to thegrant date, and the restricted shares of stock will be vested from 0% to 25% considering theCompany’s and individual employee’s performance conditions. The restricted stock receivedby the employees shall be deposited and held in an escrow account and could not be sold,pledged, transferred, gifted, or disposed of in any other forms during the vesting period;nevertheless, the rights of a shareholder (such as voting and election at the shareholders’meeting) are the same as the rights of the Company’ s shareholders but are executed by thecustodian. During the vesting period, the restricted shares of stock are entitled to any earningsdistribution. The Company will take back the restricted stock from employees and retire thoseshares when the vesting conditions cannot be met.
(Continued)

72
ACER INCORPORATED AND SUBSIDIARIES
Notes to Consolidated Financial Statements
The movements in number of restricted shares of stock issued (in thousands) in 2017 and 2016were as follows:
2017 2016Balance at January 1 11,415 16,062
Forfeited during the period (4,140) (4,647)
Balance at December 31 7,275 11,415
Accumulated vested shares (3,915) (3,915)
Unvested shares 3,360 7,500
The fair value of the restricted stock was $24.15 (in New Taiwan dollars) per share, which wasdetermined by reference to the closing price of the Company’s common stock traded on the TaiwanStock Exchange at the grant date. For the years ended December 31, 2017 and 2016, thecompensation cost for the restricted stock amounted to $14,650 and $13,223, respectively, whichwas reported in the operating expenses.
(v) Earnings (loss) per share (“EPS”)
(i) Basic earnings (loss) per share
The basic earnings (loss) per share were calculated as the earnings (loss) attributable to theshareholders of the Company divided by the weighted-average number of ordinary sharesoutstanding as follows:
2017 2016Net income (loss) attributable to the shareholders of the
Company $ 2,815,587 (4,900,296)
Weighted-average number of ordinary shares outstanding(in thousands) 3,026,277 3,026,277
Basic earnings (loss) per share (in New Taiwandollars) $ 0.93 (1.62)
(ii) Diluted earnings (loss) per share
2017 2016Net income (loss) attributable to the shareholders of the
Company $ 2,815,587 (4,900,296)
Weighted-average number of ordinary shares outstanding(in thousands) 3,026,277 3,026,277
Effect of dilutive potential common stock:
Restricted stock issued to employees 5,163 -
Compensation to employees 5,261 -
Weighted-average shares of common stock outstanding(including effect of dilutive potential common stock) 3,036,701 3,026,277
Diluted earnings (loss) per share (in New Taiwandollars) $ 0.93 (1.62)
(Continued)

73
ACER INCORPORATED AND SUBSIDIARIES
Notes to Consolidated Financial Statements
When the dilutive potential common shares including restricted stock issued to employees andcompensation to employees have an anti-dilutive effect, they are not included in the calculationof diluted EPS.
(w) Revenue
2017 2016Revenue from sale of goods $ 230,527,987 225,735,406
Revenue from services rendered 5,410,430 4,442,001
Others 1,336,466 2,546,754
$ 237,274,883 232,724,161
(x) Remuneration to employees and directors
The Company’s Articles of Incorporation require that earning shall first be offset against any deficit,then, a minimum of 4% will be distributed as employee remuneration and a maximum of 0.8% willbe allocated as directors' remuneration. Employees who are entitled to receive the above-mentionedemployee remuneration, in share or cash, include the employees of subsidiaries of the Company whomeet certain specific requirement.
For the year ended December 31, 2017, the Company accrued its remuneration to employees anddirectors amounting to $121,049 and $4,263, respectively, which were calculated by using theCompany’s pre-tax net profit for the current period before deducting the amount of the remunerationto employees and directors, multiplied by the distribution ratio of remuneration to employees anddirectors under the Company’s Article of Incorporation, and recognized them as operating expenses.The aforementioned accrued remuneration to employees was same as the amount approved by theBoard of Directors on March 21, 2018, and was paid in cash. For the year ended December 31, 2016,the Company did not accrue any remuneration to its employees and directors as it incurred a net lossin 2016.
Furthermore, according to the Company’s Article of Incorporation, regardless of whether there is netincome or loss, the remuneration for directors is determined based on their involvement andcontribution to the Company, as well as by taking into consideration the industry-wide standard andpractice. The amount is proposed by the remuneration committee and approved by the Board ofDirectors. For the years ended December 31, 2017 and 2016, the remuneration for directors of$14,100 and $12,500, respectively, were recognized regardless of whether there were earnings in thesaid years. Related information is available on the Market Observation Post System website of theTaiwan Stock Exchange.
(y) Other operating income and loss – net
2017 2016Rental income (note 6(q)) $ 108,175 105,726
Government grants 100,803 173,868
$ 208,978 279,594
(Continued)

74
ACER INCORPORATED AND SUBSIDIARIES
Notes to Consolidated Financial Statements
(z) Non-operating income and loss
(i) Other income
2017 2016Interest income from bank deposits $ 247,049 193,113
Interest income from corporate bonds 57,556 17,150
Dividend income 221,155 224,882
$ 525,760 435,145
(ii) Other gains and losses
2017 2016Foreign currency exchange gain (loss) $ 2,335,176 (809,380)
Gain (loss) on financial assets and liabilities at fair valuethrough profit or loss (2,956,232) 897,333
Loss on disposal of property, plant and equipment, net (5,817) (7,800)
Impairment loss of investments in debt instrument withoutan active market (3,061) -
Other investment loss (36,183) (5,861)
Gain on disposal of investments accounted for using equitymethod 690 -
Gain on bargain purchase 1,130 -
Others 89,916 206,196
$ (574,381) 280,488
(iii) Finance costs
2017 2016Interest expense from convertible bonds $ - 33,569
Interest expense from bank loans 225,832 189,988
Others - 26,700
$ 225,832 250,257
(Continued)

75
ACER INCORPORATED AND SUBSIDIARIES
Notes to Consolidated Financial Statements
(aa) Financial instruments and fair value information
(i) Categories of financial instruments
1) Financial assets
December 31,2017
December 31,2016
Financial assets at fair value through profit or loss $ 170,803 1,647,782
Available-for-sale financial assets 5,370,670 4,372,791
Loans and receivables:
Cash and cash equivalents 33,970,331 44,289,673
Notes and accounts receivable and otherreceivables (including receivables from relatedparties) 47,912,291 45,057,736
Investments in debt instrument without an activemarket 540,910 210,517
Other financial assets – non-current 998,817 960,643
$ 88,963,822 96,539,142
2) Financial liabilities
December 31,2017
December 31,2016
Financial liabilities at fair value through profit orloss $ 621,947 112,606
Financial liabilities measured at amortized cost:
Short-term borrowings 482,894 103,000
Notes and accounts payable (including payables torelated parties) 42,750,982 52,870,414
Other payables 33,510,853 33,719,995
Long-term debt (including current portion) 6,002,457 6,000,000
$ 83,369,133 92,806,015
(ii) Fair value information-financial instruments not measured at fair value
Except for those described in the table below, the Group considers that the carrying amounts offinancial assets and financial liabilities measured at amortized cost approximate their fairvalues:
December 31, 2017 December 31, 2016CarryingAmount Fair Value
CarryingAmount Fair Value
Financial assets:
Investments in debt instrument without anactive market $ 540,910 543,155 210,517 214,453
(Continued)

76
ACER INCORPORATED AND SUBSIDIARIES
Notes to Consolidated Financial Statements
The hierarchy of the above-mentioned fair value is as below:
December 31, 2017Fair value
Level 1 Level 2 Level 3 TotalInvestments in debt instrument without an active
market $ - 229,488 313,667 543,155
December 31, 2016Fair value
Level 1 Level 2 Level 3 TotalInvestments in debt instrument without an active
market $ - 214,453 - 214,453
The above-mentioned fair value of investments categorized as level 2 is measured onMultifactor Evaluation Model; fair value of investments categorized as level 3 is estimatedusing the valuation approach and measured by discounting the future cash flows as a result ofthe unavailability of neither the quoted prices in active markets nor observable inputs formeasuring the fair value. The quantitative information of significant unobservable inputs is asfollows:
1) The future cash flows estimated by management is based on the net sharing profitsduring contract period,
2) The discount rate is 15.7%, which is determined based on return on equity.
(iii) Fair value information-Financial instruments measured at fair value
1) Fair value hierarchy
The Group’s financial assets at fair value through profit or loss, financial liabilities at fairvalue through profit or loss, and available-for-sale financial assets are measured at fairvalue on a recurring basis.
The table below analyzes the financial instruments measured at fair value subsequent toinitial recognition, grouped into Levels 1 to 3, based on the degree to which the fair valueis observable. The different levels have been defined as follows:
a) Level 1: quoted prices (unadjusted) in active markets for identified assets orliabilities.
b) Level 2: inputs other than quoted prices included within Level 1 that are observablefor the asset or liability, either directly (i.e. as prices) or indirectly (i.e. derivedfrom prices).
c) Level 3: inputs for the assets or liabilities that are not based on observable marketdata (unobservable inputs).
(Continued)

77
ACER INCORPORATED AND SUBSIDIARIES
Notes to Consolidated Financial Statements
December 31, 2017Fair value
Level 1 Level 2 Level 3 TotalFinancial assets at fair value through profit
or loss:
Foreign currency forward contracts $ - 167,770 - 167,770
Conversion right of investments inconvertible bonds - 3,033 - 3,033
$ - 170,803 - 170,803
Available-for-sale financial assets:
Domestic listed stock $ 3,619,007 - - 3,619,007
Unlisted stock - - 1,751,663 1,751,663
$ 3,619,007 - 1,751,663 5,370,670
Financial liabilities at fair value throughprofit or loss:
Foreign currency forward contracts $ - (621,947) - (621,947)
December 31, 2016Fair value
Level 1 Level 2 Level 3 TotalFinancial assets at fair value through profit
or loss:
Foreign currency forward contracts $ - 1,573,876 - 1,573,876
Foreign currency option contracts - 3,566 - 3,566
Conversion right of investments inconvertible bonds - 70,340 - 70,340
$ - 1,647,782 - 1,647,782
Available-for-sale financial assets:
Domestic listed stock $ 3,119,549 - - 3,119,549
Unlisted stock - - 1,253,242 1,253,242
$ 3,119,549 - 1,253,242 4,372,791
Financial liabilities at fair value throughprofit or loss:
Foreign currency forward contracts $ - (112,606) - (112,606)
There were no transfers among fair value hierarchies for the years ended December 31,2017 and 2016.
2) Movement in financial assets included Level 3 fair value hierarchy (available-for-salefinancial assets)
2017 2016Balance at January 1 $ 1,253,242 948,058
Total gains or losses:
Recognized in gains and losses (32,843) 1,240
Recognized in other comprehensive income (41,572) (58,968)
Acquisition through business combination 330,473 -
Additions 314,312 429,439
Disposal (15,691) (57,148)
Effect of exchange rate changes (56,258) (9,379)
Balance at December 31 $ 1,751,663 1,253,242
(Continued)

78
ACER INCORPORATED AND SUBSIDIARIES
Notes to Consolidated Financial Statements
The above-mentioned total gains or losses were included in “other gains and losses” and“unrealized gain (loss) from available-for-sale financial assets”, respectively. The gainsor losses attributable to the financial assets held on December 31, 2017 and 2016 were asfollows:
2017 2016Total gains or losses:
Recognized in other comprehensive income(included in “unrealized gain (loss) fromavailable-for-sale financial assets”) $ (41,572) (58,968)
3) Valuation techniques and inputs used for financial instruments measured at fair value
a) The fair values of financial assets with standard terms and conditions and traded onactive liquid markets are determined with reference to quoted market prices (e.g.publicly traded stocks).
b) The fair value of derivative financial instruments is determined using a valuationtechnique, with estimates and assumptions consistent with those used by marketparticipants that are readily available to the Group. The fair value of foreigncurrency forward contracts and foreign currency option contracts is computedindividually by each contract using the valuation technique.
c) The fair value of privately held stock in Level 3 fair value hierarchy is estimated byusing the market approach and is determined by reference to recent financingactivities, valuations of similar companies, market conditions, and other economicindicators. The significant unobservable input is the liquidity discount. Noquantitative information is disclosed due to that the possible changes in liquiditydiscount would not cause significant potential financial impact.
4) Offsetting of financial assets and liabilities
The Group has financial instrument transactions which are set off in accordance withparagraph 42 of IAS 32; the related financial assets and liabilities are presented in thebalance sheets on a net basis.
The table below summarizes the related information of offsetting of financial assets andliabilities:
December 31, 2017Financial assets subject to offsetting, enforceable master arrangements and similar agreements
Grossamounts ofrecognizedfinancial
assets
Gross amountsof recognized
financialliabilities set offin the balance
sheet
Net amounts offinancial assetspresented in the
balance sheetRelated amount not set off in
the balance sheet (d) Net amounts
(a) (b) (c)=(a)-(b)Financial
instrumentsCash collateral
received (e)=(c)-(d)Notes and accounts
receivable, net $ 80,035,059 33,273,676 46,761,383 - - 46,761,383
(Continued)

79
ACER INCORPORATED AND SUBSIDIARIES
Notes to Consolidated Financial Statements
December 31, 2017Financial liabilities subject to offsetting, enforceable master arrangements and similar agreements
Grossamounts ofrecognizedfinancialliabilities
Gross amountsof recognized
financial assetsset off in thebalance sheet
Net amounts offinancialliabilities
presented in thebalance sheet
Related amount not set off inthe balance sheet (d) Net amounts
(a) (b) (c)=(a)-(b)Financial
instrumentsCash collateral
received (e)=(c)-(d)Notes and accounts
payable $ 76,023,475 33,273,676 42,749,799 - - 42,749,799
December 31, 2016Financial assets subject to offsetting, enforceable master arrangements and similar agreements
Grossamounts ofrecognizedfinancial
assets
Gross amountsof recognized
financialliabilities set offin the balance
sheet
Net amounts offinancial assetspresented in the
balance sheetRelated amount not set off in
the balance sheet (d) Net amounts
(a) (b) (c)=(a)-(b)Financial
instrumentsCash collateral
received (e)=(c)-(d)Notes and accounts
receivable, net $ 78,455,722 34,225,417 44,230,305 - - 44,230,305
December 31, 2016Financial liabilities subject to offsetting, enforceable master arrangements and similar agreements
Grossamounts ofrecognizedfinancialliabilities
Gross amountsof recognized
financial assetsset off in thebalance sheet
Net amounts offinancialliabilities
presented in thebalance sheet
Related amount not set off inthe balance sheet (d) Net amounts
(a) (b) (c)=(a)-(b)Financial
instrumentsCash collateral
received (e)=(c)-(d)Notes and accounts
payable $ 87,092,317 34,225,417 52,866,900 - - 52,866,900
(ab) Financial risk management
The Group is exposed to credit risk, liquidity risk, and market risk (including currency risk, interestrate risk, and other market price risk). The Group has disclosed the information on exposure to theaforementioned risks and the Group’s policies and procedures to measure and manage those risks aswell as the quantitative information below.
The Board of Directors are responsible for developing and monitoring the Group’s risk managementpolicies. The Group’ s risk management policies are established to identify and analyze the risksfaced by the Group, to set appropriate risk limits and controls, and to monitor adherence to thecontrols. Risk management policies and systems are reviewed regularly to reflect changes in marketconditions and the Group’s operations.
The Group’ s management monitors and reviews the financial activities in accordance withprocedures required by relevant regulations and internal controls. Internal auditors undertake bothregular and ad hoc reviews of risk management controls and procedures, the results of which arereported to the Board of Directors.
(Continued)

80
ACER INCORPORATED AND SUBSIDIARIES
Notes to Consolidated Financial Statements
(i) Credit risk
Credit risk is the risk of financial loss to the Group if a customer or counterparty of a financialinstrument fails to meet its contractual obligations, and arises principally from the Group’ scash and cash equivalents, derivative instruments, receivables from customers, and otherreceivables. The maximum exposure to credit risk is equal to the carrying amount of theGroup’s financial assets.
The Group maintains cash and enters into derivative transactions with reputable financialinstitutions; therefore, the exposure related to the potential default by those counter-parties isnot considered significant.
The Group has established a credit policy under which each customer is analyzed individuallyfor creditworthiness for purposes of setting the credit limit. Additionally, Group continuouslyevaluates the credit quality of customers and utilizes insurance to minimize the credit risk.
The Group primarily sells and markets its multi-branded IT products through distributors indifferent geographic areas. The Group believes that there is no significant concentration ofcredit risk due to the Group’s large number of customers and their wide geographical spread.
(ii) Liquidity risk
Liquidity risk is the risk that the Group will encounter difficulty in settling its financialliabilities by delivering cash or another financial assets. The Group manages liquidity risk bymonitoring regularly the current and mid- to long-term cash demand, maintaining adequatecash and banking facilities, and ensuring compliance with the terms of the loan agreements. As
of December 31, 2017 and 2016, the Group had unused credit facilities of $36,283,089 and
$36,647,073, respectively.
The table below summarizes the maturity profile of the Group’s financial liabilities based oncontractual undiscounted payments, including principal and interest.
Contractualcash flows Within 1 year 1-2 years 2-5 years
December 31, 2017
Non-derivative financial liabilities:
Short-term borrowings carrying floating interest rates $ 483,880 483,880 - -
Long-term borrowings carrying floating interest rates 6,094,618 2,765,560 3,328,738 320
Notes and accounts payable (including relatedparties) 42,750,982 42,718,730 17,076 15,176
Other payables 33,510,853 31,903,287 1,607,566 -
$ 82,840,333 77,871,457 4,953,380 15,496
Derivative financial instruments:
Foreign currency forward contracts-settled in gross:
Outflow $ 68,231,610 68,231,610 - -
Inflow (67,780,674) (67,780,674) - -
$ 450,936 450,936 - -
Foreign currency option contracts-settled in gross:
Outflow $ 127,107 127,107 - -
Inflow (119,392) (119,392) - -
$ 7,715 7,715 - -
(Continued)
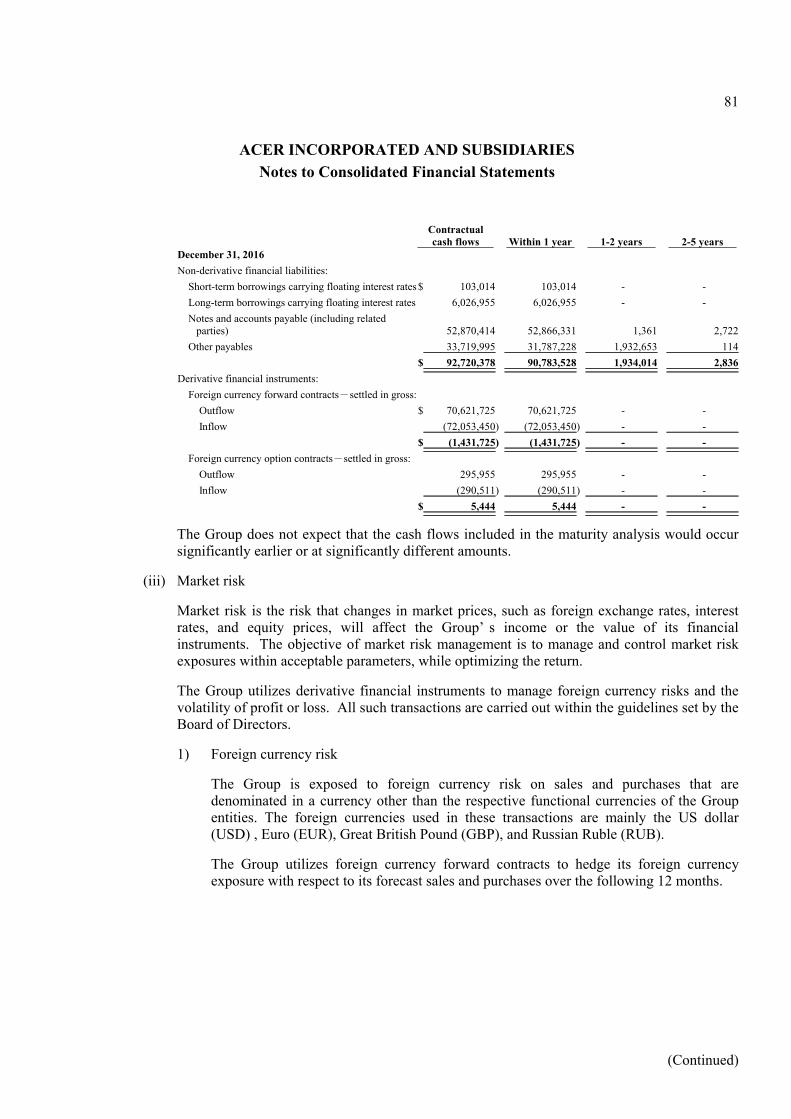
81
ACER INCORPORATED AND SUBSIDIARIES
Notes to Consolidated Financial Statements
Contractualcash flows Within 1 year 1-2 years 2-5 years
December 31, 2016
Non-derivative financial liabilities:
Short-term borrowings carrying floating interest rates $ 103,014 103,014 - -
Long-term borrowings carrying floating interest rates 6,026,955 6,026,955 - -
Notes and accounts payable (including relatedparties) 52,870,414 52,866,331 1,361 2,722
Other payables 33,719,995 31,787,228 1,932,653 114
$ 92,720,378 90,783,528 1,934,014 2,836
Derivative financial instruments:
Foreign currency forward contracts-settled in gross:
Outflow $ 70,621,725 70,621,725 - -
Inflow (72,053,450) (72,053,450) - -
$ (1,431,725) (1,431,725) - -
Foreign currency option contracts-settled in gross:
Outflow 295,955 295,955 - -
Inflow (290,511) (290,511) - -
$ 5,444 5,444 - -
The Group does not expect that the cash flows included in the maturity analysis would occursignificantly earlier or at significantly different amounts.
(iii) Market risk
Market risk is the risk that changes in market prices, such as foreign exchange rates, interestrates, and equity prices, will affect the Group’ s income or the value of its financialinstruments. The objective of market risk management is to manage and control market riskexposures within acceptable parameters, while optimizing the return.
The Group utilizes derivative financial instruments to manage foreign currency risks and thevolatility of profit or loss. All such transactions are carried out within the guidelines set by theBoard of Directors.
1) Foreign currency risk
The Group is exposed to foreign currency risk on sales and purchases that aredenominated in a currency other than the respective functional currencies of the Groupentities. The foreign currencies used in these transactions are mainly the US dollar(USD) , Euro (EUR), Great British Pound (GBP), and Russian Ruble (RUB).
The Group utilizes foreign currency forward contracts to hedge its foreign currencyexposure with respect to its forecast sales and purchases over the following 12 months.
(Continued)

82
ACER INCORPORATED AND SUBSIDIARIES
Notes to Consolidated Financial Statements
a) Exposure to foreign currency risk and sensitivity analysis
The Group’ s exposure to foreign currency risk arises from cash and cashequivalents, notes and accounts receivable (including related-party receivables),notes and accounts payable (including related-party payables), investments in debtinstrument without an active market, other receivables (including related-partyreceivables), and other payables. At the reporting date, the carrying amounts of theGroup’s significant monetary assets and liabilities denominated in a currency otherthan the respective functional currencies of Group entities and their sensitivityanalysis were as follows (including the monetary items that have been eliminated inthe accompanying consolidated financial statements):
December 31, 2017
Foreigncurrency
(in thousands)Exchange
rateNTD
(in thousands)Change inmagnitude
Pre-tax effecton profit or
loss (in thousands)
Financial assets
GBP $ 27,665 40.3336 1,115,829 %1 11,158
EUR 52,458 35.8325 1,879,701 %1 18,797
USD 1,187,460 29.8480 35,443,306 %1 354,433
RUB 1,293,499 0.5174 669,256 %1 6,693
Financial liabilities
GBP 18,531 40.3336 747,422 %1 7,474
EUR 37,658 35.8325 1,349,380 %1 13,494
USD 2,052,676 29.8480 61,268,273 %1 612,683
December 31, 2016
Foreigncurrency
(in thousands)Exchange
rateNTD
(in thousands)Change inmagnitude
Pre-tax effecton profit or
loss (in thousands)
Financial assets
GBP $ 38,180 39.8323 1,520,797 %1 15,208
EUR 212,321 33.9478 7,207,831 %1 72,078
USD 1,243,444 32.2790 40,137,129 %1 401,371
RUB 1,086,091 0.5245 569,655 %1 5,697
Financial liabilities
GBP 16,453 39.8323 655,361 %1 6,554
EUR 7,130 33.9478 242,048 %1 2,420
USD 2,298,460 32.2790 74,191,990 %1 741,920
With varieties of functional currencies within the consolidated entities of theGroup, the Group disclosed net realized and unrealized foreign exchange gain(loss) on monetary items in aggregate. Please refer to note 6(z) for furtherinformation.
(Continued)

83
ACER INCORPORATED AND SUBSIDIARIES
Notes to Consolidated Financial Statements
2) Interest rate risk
The Group’s short-term borrowings and long-term debt carried floating interest rates, andthe Group has not entered into interest rate swap contracts to convert floating interestrates to fixed interest rates. To manage the interest rate risk, the Group periodicallyassesses the interest rates of bank loans and maintains good relationships with financialinstitutions to obtain lower financing costs. The Group also strengthens the managementof working capital to reduce the dependence on bank loans as well as the risk arisingfrom fluctuation of interest rates.
The following sensitivity analysis is based on the risk exposure to floating-interest-rateliabilities on the reporting date. The sensitivity analysis assumes the liabilities recordedat the reporting date had been outstanding for the entire period. The change in interestrate reported to the key management in the Group is based on 100 basis points (1%),which is consistent with the assessment made by the key management in respect of thepossible change in interest rate.
If the interest rate had been 100 basis points (1%) higher/lower with all other variablesheld constant, pre-tax income (loss) for the years ended December 31, 2017 and 2016
would have been $64,854 and $61,030, respectively, lower/higher, which mainly resultedfrom the borrowings with floating interest rates.
3) Other market price risk
The Group is exposed to the risk of price fluctuation in securities market resulting fromits investment in publicly traded stocks. The Group supervises the equity price riskactively and manages the risk based on fair value. The Group also has strategicinvestments in privately held stocks, in which the Group does not actively participate intheir trading.
Assuming a hypothetical increase or decrease of 5% in equity prices of the equityinvestments at each reporting date, the other comprehensive income for the years ended
December 31, 2017 and 2016, would have increased or decreased by $268,534 and
$218,640, respectively.
(ac) Capital management
In consideration of the industry dynamics and future developments, as well as external environmentfactors, the Group maintains an optimal capital structure to enhance long-term shareholder value bymanaging its capital in a manner to ensure that it has sufficient and necessary financial resources tofund its working capital needs, research and development activities, dividend payments, and otherbusiness requirements for continuing operations and to reward shareholders and take intoconsideration the interests of other stakeholders.
(Continued)

84
ACER INCORPORATED AND SUBSIDIARIES
Notes to Consolidated Financial Statements
7. Related-party Transactions
(a) Related party name and categories
The transactions between the Group and its related parties during the reporting period are set out asfollows:
Name of related party Relationship with the GroupAegis Semiconductor
Technology Inc.Associates
GrandPad Inc. Associates
Piovision International Inc. Associates
Bluechip Infotech Pty Ltd. Associates
ECOM Software Inc. Associates
Kbest Technology Inc. Associates
StarVR Corporation ("ASBZ") Prior to October 20, 2017, ASBZ was a joint venture entity ofthe Group accounted for using equity method. The Groupobtained control over ASBZ on October 20, 2017 and itbecame one of the consolidated entities since then.
Erics Co., LTD The entity's chairman is the second-degree relatives of one ofthe key management personnel of the Company
iD Softcapital Inc. The entity's chairman is one of the key management personnelof the Company
(b) Significant related-party transactions
(i) Revenue
2017 2016Associates $ 345,482 297,379
Joint venture 33,506 17,989
Other related parties 169 46
$ 379,157 315,414
The sales prices and trade term with related parties are not comparable to those with third-party customers for certain transactions due to different product specifications; other than that,the determination of sales prices and payment terms for related parties were not significantlydifferent from those for sales to non-related parties.
(ii) Purchases
2017 2016Associates $ 34,256 49,797
Joint venture 18,600 -
$ 52,856 49,797
(Continued)

85
ACER INCORPORATED AND SUBSIDIARIES
Notes to Consolidated Financial Statements
The purchase price with related parties are not comparable to the purchase price with third-party vendors as the specifications of products are different.
(iii) Operating expenses
The operating expenses related to the management consulting service and system maintenanceservice provided by related parties were as follows:
AccountRelated-party
categories 2017 2016
Operating expense Associates 3,710 3,000
Operating expense Other related parties 625 8,125
4,335 11,125
(iv) Receivables
AccountRelated-party
categoriesDecember 31,
2017December 31,
2016Notes and accounts receivable Associates $ 126,903 80,321
Notes and accounts receivable Joint venture - 1,644
Notes and accounts receivable Other related parties - 10
Other receivables Associates 97 14
Other receivables Joint venture - 6,714
Other receivables Other related parties - 9
$ 127,000 88,712
(v) Payables
AccountRelated party
categoriesDecember 31,
2017December 31,
2016Accounts payable Associates $ 1,183 3,514
(vi) Lease
The Group leased portion of its buildings and rental facilities to its related parties. The relatedrental income was included in “ other operating income and loss-net” and summarized asfollows:
2017 2016Associates $ 124 124
Joint venture 41 11
Other related parties - 34
$ 165 169
(Continued)

86
ACER INCORPORATED AND SUBSIDIARIES
Notes to Consolidated Financial Statements
(vii) Service income
The service income related to the management consulting service and system maintenanceservice provided to related parties was included in “ other gains and losses- net” andsummarized as follows:
2017 2016Associates $ 48 88
Joint venture 4,524 -
Other related parties 1,584 -
$ 6,156 88
(c) Compensation for key management personnel
2017 2016Short-term employee benefits $ 289,329 272,994
Post-employment benefits 7,374 10,387
Termination benefits 3,980 -
Share-based payments 2,242 2,688
$ 302,925 286,069
Refer to note 6(u) for the information related to share-based payments.
8. Pledged assets
Assets Pledged to secureDecember 31,
2017December 31,
2016Cash in bank and time
deposits (reported underother financial assets-non-current)
Contract bidding, security for letters ofcredit, project fulfillment, importtariffs, and lease guarantee
$ 493,817 542,573
Other equipment Bank loans 2,457 -
$ 496,274 542,573
9. Significant commitments and contingencies
(a) The Company has entered into software and royalty license agreements with Microsoft, IBM, andother companies. The Company has fulfilled its obligations according to the contracts.
(b) An American company has filed a lawsuit in California State Court against Acer for violatingconfidential agreement and trade secret. The Group had appointed outside counsel to handle thecase. The case is still in progress. However, the Group has properly accrued its provisions based onthe development of the aforesaid lawsuit. Therefore, the management foresees no immediatematerial adverse effect on the Group’ business operations and finance.
(Continued)

87
ACER INCORPORATED AND SUBSIDIARIES
Notes to Consolidated Financial Statements
(c) In the ordinary course of its business, from time to time, the Group received notices from thirdparties asserting that Acer has infringed certain patents and demanded that Acer obtain certain patentlicenses. Although the Group does not expect that the outcome in any of these legal proceedings,individually or collectively, will have a material adverse effect on the Group’s business operationsand finance, the litigation is inherently unpredictable. Therefore, the Group could incur judgments orenter into settlements of claims that could adversely affect its operating results or cash flows in aparticular period.
(d) The Group faces severe taxation challenges globally due to the rapid changes in international taxenvironment. The Group held different position with local tax authorities for certain tax audits andhas properly provided the accruals for the cases that met the criteria for recognizing a provision.Nevertheless, the tax disputes are inherently complicated and may take years to be approved by thetax authorities. The ultimate result is unpredictable and could adversely affect the Group’s operatingresults or cash flows in a particular period.
(e) As of December 31, 2017 and 2016, the Group had outstanding stand-by letters of credit totaling$43,319 and $52,778, respectively, for purposes of bids and contracts.
(f) As of December 31, 2017 and 2016, the Group had issued promissory notes amounting to$45,376,282 and $45,159,050, respectively, as collateral for obtaining credit facilities from financialinstitutions.
10. Significant loss from Casualty: None
11. Significant subsequent events:
According to the amendments to the ROC Income Tax Act enacted by the office of the President of theRepublic of China (Taiwan) on February 7, 2018, an increase in the corporate income tax rate from 17%to 20% is applicable upon filing the corporate income tax return commencing year 2018 onwards. Thisincrease does not affect the amounts of the current or deferred income taxes recognized on December 31,2017. However, it will increase the Group’ s current and deferred tax charge accordingly in the future.Assuming the new tax rate is applied in calculating the taxable temporary differences and unused taxlosses carry forwards recognized on December 31, 2017, the deferred tax assets and deferred tax liabilitieswould increase by $17,474 and $117,321, respectively.
12. Others
2017 2016Cost of revenue
Operatingexpenses Total
Cost of revenue
Operatingexpenses Total
Employee benefits:
Salaries 1,032,126 9,415,271 10,447,397 1,141,686 8,995,797 10,137,483
Insurance 139,705 970,752 1,110,457 153,163 1,020,922 1,174,085
Pension 20,394 558,497 578,891 21,473 589,639 611,112
Others 69,268 888,010 957,278 76,538 949,150 1,025,688
Depreciation 20,009 488,857 508,866 24,712 588,466 613,178
Amortization 14,203 549,283 563,486 1,453 849,945 851,398
(Continued)

88
ACER INCORPORATED AND SUBSIDIARIES
Notes to Consolidated Financial Statements
13. Additional disclosures
(a) Information on significant transactions:
(i) Financing provided to other parties: Table 1 (attached)
(ii) Guarantees and endorsements provided to other parties: Table 2 (attached)
(iii) Marketable securities held at reporting date (excluding investments in subsidiaries, associates,and jointly controlled entities): Table 3 (attached)
(iv) Marketable securities for which the accumulated purchase or sale amounts for the periodexceed $300 million or 20% of the paid-in capital: Table 4 (attached)
(v) Acquisition of real estate which exceeds $300 million or 20% of the paid-in capital: None
(vi) Disposal of real estate which exceeds $300 million or 20% of the paid-in capital: None
(vii) Total purchases from and sales to related parties which exceed $100 million or 20% of thepaid-in capital: Table 5 (attached)
(viii) Receivables from related parties which exceed $100 million or 20% of the paid-in capital:Table 6 (attached)
(ix) Information about derivative instruments transactions: Please refer to notes 6(b).
(i) Business relationships and significant intercompany transactions: Table 7 (attached)
(b) Information on investees: Table 8 (attached)
(c) Information on investment in Mainland China:
(i) The names of investees in Mainland China, the main businesses and products, paid-in capital,method of investment, information on inflow or outflow of capital, ownership, investment gainor loss, ending balance, amount received as earnings distributions from the investment, andlimitation on investment: Table 9 (attached)
(ii) Significant direct or indirect transactions with investee companies, the prices and terms ofpayment, unrealized gain or loss, and other related information which is helpful to understandthe impact of investment in Mainland China on financial reports: For the Group’s significantdirect or indirect transactions (eliminated when compiling the consolidated financial report)with investee companies in Mainland China for the year ended December 31, 2017, pleaserefer to “Information on significant transactions” and “Business relationships and significantintercompany transactions” above.
(Continued)

89
ACER INCORPORATED AND SUBSIDIARIES
Notes to Consolidated Financial Statements
14. Segment information
(a) General information
The Group’s reportable segments comprise the device business group (“IT Hardware Products”) andother business groups. The IT Hardware Products engages mainly in the research, design, andmarketing of personal computers, IT products, and tablet products. Other business groups which donot meet the quantitative reporting threshold mainly engage in the activities of e-commerce, cloudservices, smart devices, distribution of IT products, virtual reality devices, digital signage, handhelddevices and real estate services.
Strategic investment expenditures (such as global branding expenditures, the amortization of thecapital expenditures for the strengthening of the global information structure, and non-routine long-term strategic expenditures) are not allocated to reportable segments. Operating profit is used as themeasurement for segment profit and the basis for performance evaluation. The reporting amount isconsistent with the report used by chief operating decision maker. There was no materialinconsistency between the accounting policies adopted for the operating segments and theaccounting policies described in note 4.
The Group’s operating segment information and reconciliation are as follows:
2017
ITHardwareProducts Others
Adjustmentsand
eliminations TotalRevenues from external customers $ 220,052,289 17,222,594 - 237,274,883
Intra-group revenue 2,050,507 238,361 (2,288,868) -
Total revenues $ 222,102,796 17,460,955 (2,288,868) 237,274,883
Segment profit (loss) $ 5,353,023 (970,341) (712,948) 3,669,734
2016
ITHardwareProducts Others
Adjustmentsand
eliminations TotalRevenues from external customers $ 218,212,513 14,511,648 - 232,724,161
Intra-group revenue 1,368,016 820,815 (2,188,831) -
Total revenues $ 219,580,529 15,332,463 (2,188,831) 232,724,161
Segment profit (loss) $ 2,694,899 (764,695) (737,691) 1,192,513
Loss on impairment of assets $ (149,641) (6,214,603) - (6,364,244)
(Continued)

90
ACER INCORPORATED AND SUBSIDIARIES
Notes to Consolidated Financial Statements
(b) Product information
Revenues from external customers are detailed below:
Products 2017 2016Personal computers $ 185,078,676 181,455,410
Peripherals and others 52,196,207 51,268,751
$ 237,274,883 232,724,161
(c) Geographic information
In presenting information on the basis of geography, segment revenue is based on the geographicallocation of customers, and segment assets are based on the geographical location of the assets.
Revenues from external customers are detailed below:
Region 2017 2016Americas $ 52,570,406 51,467,767
Mainland China 15,253,845 15,791,910
Taiwan 25,072,956 21,646,029
Others 144,377,676 143,818,455
$ 237,274,883 232,724,161
Non-current assets:
Region December 31,2017
December 31,2016
Americas $ 11,802,846 12,982,873
Taiwan 6,180,387 6,678,345
Mainland China 2,405,684 2,613,669
Others 3,113,571 2,909,682
$ 23,502,488 25,184,569
Non-current assets include property, plant and equipment, investment property and intangible assets,and do not include financial instruments, deferred tax assets, and pension fund assets.
(d) Major customers’ information
2017 2016Customer A $ 21,187,083 21,950,687

Table 1(Amounts in Thousands of New Taiwan Dollars)
Item Value
0 The Company ACCQ Other receivables from related parties
Yes 813,366 - - 0%~4% 2 - Operatingrequirements
- None - 5,678,488 28,392,438
0 The Company APDI Other receivables from related parties
Yes 2,000 2,000 - 0%~4% 2 - Operatingrequirements
- None - 5,678,488 28,392,438
0 The Company ABH Other receivables from related parties
Yes 29,000 29,000 - 0%~4% 2 - Operatingrequirements
- None - 5,678,488 28,392,438
0 The Company CCI Other receivables from related parties
Yes 5,000 5,000 - 0%~4% 2 - Operatingrequirements
- None - 5,678,488 28,392,438
0 The Company ADSC Other receivables from related parties
Yes 35,000 35,000 - 0%~4% 2 - Operatingrequirements
- None - 5,678,488 28,392,438
0 The Company AEB Other receivables from related parties
Yes 224,000 224,000 224,000 0%~4% 2 - Operatingrequirements
- None - 5,678,488 28,392,438
0 The Company ALT Other receivables from related parties
Yes 19,000 19,000 - 0%~4% 2 - Operatingrequirements
- None - 5,678,488 28,392,438
0 The Company XPL Other receivables from related parties
Yes 6,000 6,000 - 0%~4% 2 - Operatingrequirements
- None - 5,678,488 28,392,438
0 The Company ACTTW Other receivables from related parties
Yes 163,000 163,000 - 0%~4% 2 - Operatingrequirements
- None - 5,678,488 28,392,438
0 The Company ASDI Other receivables from related parties
Yes 87,000 87,000 - 0%~4% 2 - Operatingrequirements
- None - 5,678,488 28,392,438
0 The Company ABC Other receivables from related parties
Yes 17,000 17,000 - 0%~4% 2 - Operatingrequirements
- None - 5,678,488 28,392,438
0 The Company MPS Other receivables from related parties
Yes 16,000 16,000 - 0%~4% 2 - Operatingrequirements
- None - 5,678,488 28,392,438
0 The Company ACCSI Other receivables from related parties
Yes 824,000 824,000 - 0%~4% 2 - Operatingrequirements
- None - 5,678,488 28,392,438
1 GWI AAC Other receivables from related parties
Yes 435,767 173,118 173,118 0%~4% 2 - Operatingrequirements
- None - 5,678,488 28,392,438
2 AAH AAC Other receivables from related parties
Yes 1,872,182 - - 0%~4% 2 - Operatingrequirements
- None - 5,678,488 28,392,438
2 AAH AAC Other receivables from related parties
Yes 1,072,750 1,044,680 1,044,680 0%~4% 2 - Operatingrequirements
- None - 5,678,488 28,392,438
2 AAH AAC Other receivables from related parties
Yes 3,253,432 3,253,432 3,253,432 0%~4% 2 - Operatingrequirements
- None - 5,678,488 28,392,438
3 AEB PBC Other receivables from related parties
Yes 5,000 - - 0%~4% 2 - Operatingrequirements
- None - 5,678,488 28,392,438
3 AEB The Company Other receivables from related parties
Yes 224,000 224,000 - 0%~4% 2 - Operatingrequirements
- None - 5,678,488 28,392,438
Acer Incorporated and SubsidiariesFinancing provided to other parties
For the year ended December 31, 2017
No. FinancingCompany
Counter-partyFinancial Statement
Account(Note 3)
RelatedParty
MaximumBalance forthe Period
EndingBalance
CollateralFinancing Limit
for EachBorrowingCompany(Note 2)
FinancingCompany's Total
FinancingAmount Limits
(Note 2)
Actuallydrawndown
AmountsInterest Rate
Nature ofFinancing(Note 1)
TransactionAmounts
Reasons forShort-termFinancing
Allowancefor Doubtful
Accounts
~91~

Item ValueNo. Financing
CompanyCounter-party
Financial StatementAccount(Note 3)
RelatedParty
MaximumBalance forthe Period
EndingBalance
CollateralFinancing Limit
for EachBorrowingCompany(Note 2)
FinancingCompany's Total
FinancingAmount Limits
(Note 2)
Actuallydrawndown
AmountsInterest Rate
Nature ofFinancing(Note 1)
TransactionAmounts
Reasons forShort-termFinancing
Allowancefor Doubtful
Accounts
4 BJAI ACCN Other receivables from related parties
Yes 37,182 - - 0%~4% 2 - Operatingrequirements
- None - 5,678,488 28,392,438
5 AIZS ACCN Other receivables from related parties
Yes 211,011 211,011 211,011 0%~4% 2 - Operatingrequirements
- None - 5,678,488 28,392,438
6 ADSC The Company Other receivables from related parties
Yes 691,000 - - 0%~4% 2 - Operatingrequirements
- None - 5,678,488 28,392,438
6 ADSC The Company Other receivables from related parties
Yes 710,000 710,000 710,000 0%~4% 2 - Operatingrequirements
- None - 5,678,488 28,392,438
7 CCI The Company Other receivables from related parties
Yes 347,000 - - 0%~4% 2 - Operatingrequirements
- None - 5,678,488 28,392,438
7 CCI The Company Other receivables from related parties
Yes 100,000 100,000 100,000 0%~4% 2 - Operatingrequirements
- None - 5,678,488 28,392,438
8 APDI The Company Other receivables from related parties
Yes 40,000 - - 0%~4% 2 - Operatingrequirements
- None - 5,678,488 28,392,438
8 APDI The Company Other receivables from related parties
Yes 40,000 40,000 - 0%~4% 2 - Operatingrequirements
- None - 5,678,488 28,392,438
9 ABH The Company Other receivables from related parties
Yes 672,000 - - 0%~4% 2 - Operatingrequirements
- None - 5,678,488 28,392,438
9 ABH The Company Other receivables from related parties
Yes 590,000 590,000 46,000 0%~4% 2 - Operatingrequirements
- None - 5,678,488 28,392,438
10 ACTTW ABSG Other receivables from related parties
Yes 4,064 - - 0%~4% 2 - Operatingrequirements
- None - 5,678,488 28,392,438
10 ACTTW ABSG Other receivables from related parties
Yes 10,792 10,750 10,750 0%~4% 2 - Operatingrequirements
- None - 5,678,488 28,392,438
10 ACTTW ABSG Other receivables from related parties
Yes 7,194 7,167 5,375 0%~4% 2 - Operatingrequirements
- None - 5,678,488 28,392,438
10 ACTTW ABSG Other receivables from related parties
Yes 71,665 71,665 - 0%~4% 2 - Operatingrequirements
- None - 5,678,488 28,392,438
10 ACTTW The Company Other receivables from related parties
Yes 163,000 163,000 115,000 0%~4% 2 - Operatingrequirements
- None - 5,678,488 28,392,438
11 ALT The Company Other receivables from related parties
Yes 19,000 19,000 19,000 0%~4% 2 - Operatingrequirements
- None - 5,678,488 28,392,438
12 XPL The Company Other receivables from related parties
Yes 6,000 6,000 - 0%~4% 2 - Operatingrequirements
- None - 5,678,488 28,392,438
13 ASDI The Company Other receivables from related parties
Yes 87,000 87,000 - 0%~4% 2 - Operatingrequirements
- None - 5,678,488 28,392,438
14 ABC The Company Other receivables from related parties
Yes 17,000 17,000 4,000 0%~4% 2 - Operatingrequirements
- None - 5,678,488 28,392,438
15 MPS The Company Other receivables from related parties
Yes 16,000 16,000 5,000 0%~4% 2 - Operatingrequirements
- None - 5,678,488 28,392,438
16 ACCSI The Company Other receivables from related parties
Yes 824,000 824,000 - 0%~4% 2 - Operatingrequirements
- None - 5,678,488 28,392,438
17 AGU AEG Other receivables from related parties
Yes 719,435 716,650 716,650 0%~4% 2 - Operatingrequirements
- None - 5,678,488 28,392,438
18 ASDI APDI Other receivables from related parties
Yes 50,000 50,000 35,000 0%~4% 2 - Operatingrequirements
- None - 5,678,488 28,392,438
~92~

Item ValueNo. Financing
CompanyCounter-party
Financial StatementAccount(Note 3)
RelatedParty
MaximumBalance forthe Period
EndingBalance
CollateralFinancing Limit
for EachBorrowingCompany(Note 2)
FinancingCompany's Total
FinancingAmount Limits
(Note 2)
Actuallydrawndown
AmountsInterest Rate
Nature ofFinancing(Note 1)
TransactionAmounts
Reasons forShort-termFinancing
Allowancefor Doubtful
Accounts
19 ITS The Company Other receivables from related parties
Yes 117,000 117,000 - 0%~4% 2 - Operatingrequirements
- None - 5,678,488 28,392,438
Note 1: Nature for Financing:
Type 2: Short-term financing purpose
Note 2: The aggregate financing amount shall not exceed 50% of the most recent audited or reviewed net worth of the Company (the amount shown above is based on the net worth as of September 30, 2017), within which
the short-term financing amount shall not exceed 20% of the most recent audited or reviewed net worth of the Company.
For an entity which the Company owns more than 50% of its outstanding common shares, the individual financing amounts shall not exceed 10% of the most recent audited or reviewed net worth of the Company.
When a subsidiary is directly or indirectly wholly owned by the Company who provides financing to other parties, the aforementioned limitation of aggregate amount and individual financing amount is applied.
Note 3: The above transactions are eliminated when preparing the consolidated financial statements.
~93~

Table 2(Amounts in Thousands of New Taiwan Dollars)
NameNature of
Relationship(Note 1)
0 The Company AJC 3 11,356,975 834,043 794,605 - - 1.40% 56,784,876 Y0 The Company ATH 3 11,356,975 171,079 158,194 12,478 - 0.28% 56,784,876 Y0 The Company Acer Asia Pacific subsidiaries 3 11,356,975 4,357,665 4,029,480 388,555 - 7.10% 56,784,876 Y0 The Company AEG 3 11,356,975 392,632 391,961 391,961 - 0.69% 56,784,876 Y0 The Company Acer EMEA subsidiaries 3 11,356,975 4,196,270 3,880,240 292,456 - 6.83% 56,784,876 Y0 The Company ACN/ACD/ACW/AFN 3 11,356,975 15,218 14,590 14,590 - 0.03% 56,784,876 Y0 The Company ATB 3 11,356,975 483,570 298,480 - - 0.53% 56,784,876 Y0 The Company Acer Pan America subsidiaries 3 11,356,975 5,487,430 5,074,160 253,542 - 8.94% 56,784,876 Y0 The Company AMEX 3 11,356,975 290,511 268,632 - - 0.47% 56,784,876 Y0 The Company Acer Greater China subsidiaties 3 11,356,975 1,775,345 1,641,640 71,260 - 2.89% 56,784,876 Y Y0 The Company ACCSI 2 11,356,975 316,270 300,000 - - 0.53% 56,784,876 Y0 The Company AEB 3 11,356,975 1,850,000 1,850,000 653,249 - 3.26% 56,784,876 Y0 The Company SMA 3 11,356,975 110,644 110,644 2,505 - 0.19% 56,784,876 Y0 The Company ACA 3 11,356,975 347,856 298,480 298,480 - 0.53% 56,784,876 Y0 The Company AIL 3 11,356,975 2,607,120 2,607,120 713,057 - 4.59% 56,784,876 Y0 The Company ACCN 3 11,356,975 1,252,351 1,215,920 - - 2.14% 56,784,876 Y Y0 The Company AME 3 11,356,975 48,419 44,772 31,693 - 0.08% 56,784,876 Y0 The Company ACTTW 3 11,356,975 62,020 61,696 2,000 - 0.11% 56,784,876 Y1 AOI AOA 2 235,958 14,526 13,432 - - 1.70% 786,527 Y
Note 1: Relationships between the endorsement/guarantee provider and the guaranteed party: Type 2: a subsidiary directly owned by the Company over 50%Type 3: a subsidiary indirectly owned by the Company over 50%
Note 2: The aggregate endorsement/guarantee amount provided shall not exceed the most recent audited or reviewed net worth of the Company (the amount shown above is based on the net worth as of September 30, 2017).The endoresement/guarantee provided to individual guarantee party shall not exceed 20% of the most recent audited or reviewed net worth of the Company.
Note 3: The aggregate endorsement/guarantee amount provided shall not exceed the most recent audited or reviewed net worth of AOI (the amount shown above is based on the net worth as of December 31, 2017).The endoresement/guarantee provided to individual guarantee party shall not exceed 30% of the most recent audited or reviewed net worth of AOI.
GuaranteeProvided to
Subsidiaries inMainland China
Acer Incorporated and SubsidiariesGuarantees and endorsements provided to other parties
For the year ended December 31, 2017
No.Endorsement/
GuaranteeProvider
Guaranteed Party Limits onEndorsement/
Guarantee AmountProvided to EachGuaranteed Party(Note 2)(Note 3)
MaximumBalance
for the PeriodEnding Balance
AmountActuallyDrawn
Amount ofEndorsement/
GuaranteeCollateralizedby Properties
Ratio of AccumulatedEndorsement/
Guarantee to NetEquity per Latest
Financial Statements
MaximumEndorsement/
GuaranteeAmount
Allowable(Note 2)(Note 3)
GuaranteeProvided by
ParentCompany
GuaranteeProvided byA Subsidiary
~94~

Table 3(Amounts in Thousands of New Taiwan Dollars / Shares)
Number of Shares/Units (in thousands) Carrying Value Percentage of
Ownership Fair Value Shares/ Units(in thousands)
Percentage ofOwnership
The Company Stock: Hon Hai - Available-for-sale financial assets - Current 705 67,077 - 67,077 705 -The Company Stock: Qisda - Available-for-sale financial assets - Non Current 81,713 1,728,223 4.15% 1,728,223 81,713 4.15%The Company Stock: WPG Holdings - Available-for-sale financial assets - Non Current 4,360 171,799 0.24% 171,799 4,360 0.24%The Company Stock: Wistron - Available-for-sale financial assets - Non Current 53,252 1,275,384 1.94% 1,275,384 53,252 1.94%The Company Stock: iDSoftCapital Inc. - Available-for-sale financial assets - Non Current 398 3,675 19.90% 3,675 398 19.90%The Company Stock: World Venture, Inc. - Available-for-sale financial assets - Non Current 8,505 44,318 19.35% 44,318 8,505 19.35%The Company Stock: Dragon Investment Co. Ltd. - Available-for-sale financial assets - Non Current 13,459 20,711 19.94% 20,711 13,459 19.94%The Company Stock: Venture Power - Available-for-sale financial assets - Non Current 15 391 4.15% 391 15 4.15%The Company Convertible bonds: Starbreeze - Investments in debt instrument without an active market - Current - 227,243 - 227,243 - -ADSC Stock: Wistron - Available-for-sale financial assets - Non Current 12,674 303,541 0.46% 303,541 12,674 0.46%ADSC Stock: PChome Pay - Available-for-sale financial assets - Non Current 12,600 126,000 14.82% 126,000 12,600 14.82%ADSC Stock: Benepet Biomedical Co., Ltd. - Available-for-sale financial assets - Non Current 700 14,000 18.92% 14,000 700 18.92%ASCBVI Stock: ID5 Fund L.P. - Available-for-sale financial assets - Non Current 3,800 241,196 19.39% 241,196 3,800 19.39%ASCBVI Stock: IP Cathay One, L.P. - Available-for-sale financial assets - Non Current 5,442 15,548 8.00% 15,548 5,442 8.00%ASCBVI Stock: ID5 Annex I fund - Available-for-sale financial assets - Non Current 565 19,510 19.15% 19,510 565 19.15%ASCBVI Stock: ATS - Available-for-sale financial assets - Non Current 3,171 44,772 11.07% 44,772 3,171 11.07%ASCBVI Stock: Trutag - Available-for-sale financial assets - Non Current 1,346 89,559 1.69% 89,559 1,346 1.69%ASCBVI Stock: Gorilla - Available-for-sale financial assets - Non Current 244 59,696 2.19% 59,696 244 2.19%ASCBVI Stock: Jibo - Available-for-sale financial assets - Non Current 5,659 59,696 1.68% 59,696 5,659 1.68%ASCBVI Stock: GCR - Available-for-sale financial assets - Non Current 600 35,818 10.00% 35,818 600 10.00%ASCBVI Stock: Locix - Available-for-sale financial assets - Non Current 1,000 44,772 6.27% 44,772 1,000 6.27%ASCBVI Stock: BoniO - Available-for-sale financial assets - Non Current 463 119,392 14.07% 119,392 463 14.07%ASCBVI Stock: Delight - Available-for-sale financial assets - Non Current 13 59,707 11.50% 59,707 13 11.50%ASCBVI Stock: IMAX VR Content Fund - Available-for-sale financial assets - Non Current 211 6,305 39.10% 6,305 211 39.10%ASCBVI Convertible notes: ATS - Investments in debt instrument without an active market - Current - 5,223 - 5,223 - -AWI Stock: Acer Inc. Parent/Subsidiary Treasury stock 12,730 522,237 0.41% 307,426 12,730 0.41%AWI GDR: Acer Inc. Parent/Subsidiary Treasury stock 4,987 1,969,617 0.81% 558,991 4,987 0.81%CCI Stock: China Development Financial
Holding Co.- Available-for-sale financial assets - Current 5,049 51,252 0.03% 51,252 5,049 0.03%
CCI Stock: Acer Inc. Parent/Subsidiary Available-for-sale financial assets - Non Current 4,774 115,286 0.16% 115,286 4,774 0.16%ETEN Stock: RoyalTek - Available-for-sale financial assets - Non Current 1,015 21,731 2.01% 21,731 1,015 2.01%ETEN Stock: Acer Inc. Parent/Subsidiary Available-for-sale financial assets - Non Current 4,305 103,975 0.14% 103,975 4,305 0.14%
Acer Incorporated and SubsidiariesMarketable securities held
(Excluding investments in subsidiaries, associates, and joint controlled entities)December 31, 2017
Ending Balance Maximum ownership during 2017Note Investing
CompanyMarketable Securities
Type and NameRelationship with
the Securities Issuer Financial Statement Account
~95~

Number of Shares/Units (in thousands) Carrying Value Percentage of
Ownership Fair Value Shares/ Units(in thousands)
Percentage ofOwnership
Ending Balance Maximum ownership during 2017Note Investing
CompanyMarketable Securities
Type and NameRelationship with
the Securities Issuer Financial Statement Account
ETEN Stock: Abico Shi-pro Co., Ltd. - Available-for-sale financial assets - Non Current 284 2,931 7.89% 2,931 284 7.89%WLII Stock: Antung Trading Co. - Available-for-sale financial assets - Non Current 3,000 67,227 10.00% 67,227 3,000 10.00%ACTI Stock: Physiosigns Inc., DE - Available-for-sale financial assets - Non Current 800 238,784 12.50% 238,784 800 12.50%ABST Stock: PilotTV Holdings - Available-for-sale financial assets - Non Current 2,676 57,462 19.18% 57,462 2,676 19.18%AOI Stock: Apex Material Technology Corp. - Available-for-sale financial assets - Non Current 5,786 343,496 19.17% 343,496 5,786 19.17%ACVP Stock: Thinputer Technology Corporation - Available-for-sale financial assets - Non Current 889 36,697 13.79% 36,697 889 13.79%
~96~

Table 4(Amounts in Thousands of New Taiwan Dollars / Shares)
Shares(in thousands)
Amount Shares(in thousands)
Amount Shares(in thousands)
Amount CarryingValue
Gain (Loss) onDisposal
Shares(in thousands)
Amount(Note1)
ACCN China Merchants BankCNY Financial Plan
Other financial asset China Merchants Bank - - - 1,560,000 7,001,942 1,560,000 7,014,622 7,001,942 12,680 - -
ACCN Fubon Bank (China)CNY SDRMBC 16030000
Other financial asset Fubon Bank (China) Co., Ltd
- - - 2,750,000 12,262,010 2,750,000 12,291,444 12,262,010 29,434 - -
ASIN ACR Investment accounted for using equity method AEH Parent - - 4,600 487,744 - - - - 4,600 526,265AEH ACR Investment accounted for using equity method ASIN Subsidiary 4,600 522,719 - - 4,600 487,744 487,744 - - -The Company ABH Investment accounted for using equity method Note 2 Subsidiary 173,305 1,479,013 41,900 419,004 - - - - 215,205 1,529,848ABH ACTTW Investment accounted for using equity method Note 2 Subsidiary 60,000 408,889 52,540 525,400 - - - - 112,540 611,732The Company AOI Investment accounted for using equity method Note 3 Parent - - 28,970 333,155 - - - - 28,970 331,350
Note 1: The ending balance includes unrealized gains/losses on financial assets, share of gains/losses of investees, foreign currency translation adjustments and other related adjustments.Note 2: Capital increase by cash Note 3: Private placement of common stock
Acer Incorporated and SubsidiariesMarketable securities for which the accumulated purchase or sale amounts for the period exceed NT$300 million or 20% of the paid-in capital
For the year ended December 31, 2017
Name ofRelationship
Beginning Balance Acquisitions Disposal Ending BalanceCompanyName
Marketable Securities Typeand Name Financial Statement Account Counter-Party
~97~

Table 5(Amounts in Thousands of New Taiwan Dollars)
Purchases/(Sales)
The Company AAC Parent/Subsidiary (Sales) (53,002,734) (30.41)% OA90 - - 7,235,970 39.26%The Company AAPH Parent/Subsidiary (Sales) (30,853,237) (17.70)% OA60 - - 4,282,878 23.23%The Company ACCQ Parent/Subsidiary (Sales) (10,248,480) (5.88)% OA60 - - 1,286,591 6.98%The Company AEG Parent/Subsidiary (Sales) (64,880,178) (37.23)% OA60 - - 458,625 2.49%The Company AFE Parent/Subsidiary (Sales) (811,319) (0.47)% OA60 - - 174,216 0.95%The Company APHI Parent/Subsidiary (Sales) (111,114) (0.06)% OA60 - - 71,791 0.39%The Company APX Parent/Subsidiary (Sales) (216,898) (0.12)% OA60 - - 409 -The Company ASC Parent/Subsidiary (Sales) (107,740) (0.06)% OA60 - - 7,895 0.04%The Company ASSB Parent/Subsidiary (Sales) (606,407) (0.35)% OA60 - - 218,639 1.19%The Company WLII Parent/Subsidiary (Sales) (2,020,865) (1.16)% EM45 - - 264,709 1.44%The Company ACCSI Parent/Subsidiary Purchases 330,167 0.20% OA60 - - (263) -The Company ACTTW Parent/Subsidiary Purchases 154,369 0.09% OA60 - - (27,517) (0.08)%The Company AEB Parent/Subsidiary Purchases 1,841,231 1.10% EM60 - - (66,251) (0.19)%The Company WLII Parent/Subsidiary Purchases 134,126 0.08% EM45 - - (14,124) (0.04)%ACCSI The Company Parent/Subsidiary (Sales) (330,167) (33.43)% OA60 - - 263 0.21%ACTTW The Company Parent/Subsidiary (Sales) (154,369) (60.22)% OA60 - - 27,517 31.62%AEB The Company Parent/Subsidiary (Sales) (1,841,231) (41.93)% EM60 - - 66,251 11.21%AEB WLII Fellow subsidiary Purchases 146,956 3.74% EM60 - - (48,795) (7.24)%AOI AOA Parent/Subsidiary (Sales) (171,719) 21.34% OA90 - - 93,502 42.87%AOI AOAU Parent/Subsidiary (Sales) (136,796) 17.00% OA60 - - 25,783 11.82%AOI AOE Parent/Subsidiary (Sales) (255,958) 31.80% OA60 - - 58,598 26.86%AOI AOTH Parent/Subsidiary Purchases 466,573 65.80% OA60 - - (22,486) 40.34%WLII The Company Parent/Subsidiary (Sales) (134,126) (1.28)% EM45 - - 14,124 0.68%WLII AEB Fellow subsidiary (Sales) (146,956) (1.41)% EM60 - - 48,795 2.34%WLII The Company Parent/Subsidiary Purchases 2,020,865 20.43% EM45 - - (264,709) (17.19)%AAC AMEX Fellow subsidiary (Sales) (3,163,280) (5.69)% OA60 - - 1,340,972 17.00%
Acer Incorporated and SubsidiariesTotal purchases from and sales to related parties which exceed NT$100 million or 20% of the paid-in capital
For the year ended December 31, 2017
CompanyName Related Party Name of
Relationship
Transaction DetailsTransactions with
Terms Different fromOthers (Note 1)
Notes/Accounts Receivable or(Payable)
Note
Amount% of Total
Purchases/(Sales)Payment
TermsUnitPrice
PaymentTerms
EndingBalance % of Total
~98~

Purchases/(Sales)
CompanyName Related Party Name of
Relationship
Transaction DetailsTransactions with
Terms Different fromOthers (Note 1)
Notes/Accounts Receivable or(Payable)
Note
Amount% of Total
Purchases/(Sales)Payment
TermsUnitPrice
PaymentTerms
EndingBalance % of Total
AAC ASC Fellow subsidiary (Sales) (232,236) (0.42)% OA60 - - 27,064 0.34%AAC ATB Fellow subsidiary (Sales) (431,430) (0.78)% OA60 - - 129,913 1.65%AAC The Company Parent/Subsidiary Purchases 53,002,734 95.41% OA90 - - (7,235,970) (88.08)%AAPH ACA Fellow subsidiary (Sales) (5,347,585) (16.44)% OA60 - - 1,869,605 21.03%AAPH ACNZ Fellow subsidiary (Sales) (773,065) (2.38)% OA60 - - 169,423 1.91%AAPH ACS Fellow subsidiary (Sales) (2,076,692) (6.38)% OA60 - - 250,593 2.82%AAPH AIL Fellow subsidiary (Sales) (6,095,798) (18.74)% OA60 - - 3,762,346 42.32%AAPH AIN Fellow subsidiary (Sales) (3,957,161) (12.16)% OA60 - - 890,811 10.02%AAPH AJC Fellow subsidiary (Sales) (1,970,467) (6.06)% OA60 - - 939,917 10.57%AAPH AMI Fellow subsidiary (Sales) (281,450) (0.87)% OA60 - - 67,068 0.75%AAPH APHI Fellow subsidiary (Sales) (906,346) (2.79)% OA60 - - 62,258 0.70%AAPH ASSB Fellow subsidiary (Sales) (2,104,913) (6.47)% OA60 - - - -AAPH ATH Fellow subsidiary (Sales) (5,458,313) (16.78)% OA60 - - 771,781 8.68%AAPH The Company Parent/Subsidiary Purchases 30,853,237 95.67% OA60 - - (4,282,878) (97.88)%ACA ACNZ Fellow subsidiary (Sales) (148,742) (2.14)% OA60 - - 38,792 2.73%ACA Bluechip Other related party (Sales) (257,821) (3.71)% OA60 - - 78,367 5.51%ACA AAPH Fellow subsidiary Purchases 5,347,585 100.00% OA60 - - (1,869,605) (97.46)%ACCN ACCQ Fellow subsidiary (Sales) (105,395) (0.74)% OA60 - - 128,118 8.51%ACCN ACCQ Fellow subsidiary Purchases 12,591,664 89.36% OA60 - - (1,856,817) (99.87)%ACCQ ACCN Fellow subsidiary (Sales) (12,591,664) (99.91)% OA60 - - 1,856,817 99.92%ACCQ ACCN Fellow subsidiary Purchases 105,395 0.78% OA60 - - (128,118) (7.09)%ACCQ The Company Parent/Subsidiary Purchases 10,248,480 86.48% OA60 - - (1,286,591) (71.22)%ACF AEG Fellow subsidiary (Sales) (258,981) (2.09)% OA60 - - 686,945 17.94%ACF AEG Fellow subsidiary Purchases 11,223,729 93.31% OA60 - - (1,472,809) (96.54)%ACF APX Fellow subsidiary Purchases 126,137 1.05% OA60 - - (9,265) (0.61)%ACG AEG Fellow subsidiary (Sales) (574,777) (2.06)% OA60 - - 1,883,535 23.06%ACG APX Fellow subsidiary (Sales) (161,730) (0.58)% OA60 - - 25,082 0.31%ACG AEG Fellow subsidiary Purchases 25,798,281 95.40% OA60 - - (4,834,199) (98.16)%ACG APX Fellow subsidiary Purchases 329,270 1.22% OA45 - - (49,837) (1.01)%ACH AEG Fellow subsidiary (Sales) (185,327) (2.97)% OA60 - - 416,087 26.27%ACH AEG Fellow subsidiary Purchases 5,734,271 95.37% OA60 - - (741,401) (97.86)%ACH APX Fellow subsidiary Purchases 104,934 1.75% OA60 - - (15,707) (2.07)%
~99~

Purchases/(Sales)
CompanyName Related Party Name of
Relationship
Transaction DetailsTransactions with
Terms Different fromOthers (Note 1)
Notes/Accounts Receivable or(Payable)
Note
Amount% of Total
Purchases/(Sales)Payment
TermsUnitPrice
PaymentTerms
EndingBalance % of Total
ACNZ AAPH Fellow subsidiary Purchases 773,065 83.74% OA60 - - (169,423) (78.64)%ACNZ ACA Fellow subsidiary Purchases 148,742 16.11% OA60 - - (38,792) (18.01)%ACS AAPH Fellow subsidiary Purchases 2,076,692 96.96% OA60 - - (250,593) (97.47)%ACZ ASIN Fellow subsidiary (Sales) (284,611) (48.10)% OA30 - - - -ACZ APX Fellow subsidiary Purchases 193,729 36.34% OA90 - - (31,743) (92.04)%AEG ACF Fellow subsidiary (Sales) (11,223,729) (13.55)% OA60 - - 1,472,809 9.49%AEG ACG Fellow subsidiary (Sales) (25,798,281) (31.15)% OA60 - - 4,834,199 31.14%AEG ACH Fellow subsidiary (Sales) (5,734,271) (6.92)% OA60 - - 741,401 4.78%AEG AIB Fellow subsidiary (Sales) (3,823,342) (4.62)% OA60 - - 307,168 1.98%AEG AIT Fellow subsidiary (Sales) (5,834,556) (7.04)% OA60 - - 1,219,026 7.85%AEG AME Fellow subsidiary (Sales) (500,657) (0.60)% OA60 - - - -AEG APX Fellow subsidiary (Sales) (285,073) (0.34)% OA60 - - 85,226 0.55%AEG ASIN Fellow subsidiary (Sales) (18,985,080) (22.92)% OA60 - - 4,806,473 30.96%AEG ASZ Fellow subsidiary (Sales) (2,589,243) (3.13)% OA60 - - 427,359 2.75%AEG AUK Fellow subsidiary (Sales) (7,539,879) (9.10)% OA60 - - 1,057,483 6.81%AEG SER Fellow subsidiary (Sales) (348,616) (0.42)% OA60 - - 60,253 0.39%AEG ACF Fellow subsidiary Purchases 258,981 0.32% OA60 - - (686,945) (6.76)%AEG ACG Fellow subsidiary Purchases 574,777 0.72% OA60 - - (1,883,535) (18.53)%AEG ACH Fellow subsidiary Purchases 185,327 0.23% OA60 - - (416,087) (4.09)%AEG AIB Fellow subsidiary Purchases 293,571 0.37% OA60 - - (372,758) (3.67)%AEG AIT Fellow subsidiary Purchases 249,959 0.31% OA60 - - (374,022) (3.68)%AEG APX Fellow subsidiary Purchases 394,071 0.49% OA60 - - (14,290) (0.14)%AEG The Company Parent/Subsidiary Purchases 64,880,178 81.03% OA60 - - (458,625) (4.51)%AFE The Company Parent/Subsidiary Purchases 811,319 96.85% OA60 - - (174,216) (97.94)%AIB AEG Fellow subsidiary (Sales) (293,571) (6.59)% OA60 - - 372,758 28.52%AIB AEG Fellow subsidiary Purchases 3,823,342 89.18% OA60 - - (307,168) (100.00)%AIB APX Fellow subsidiary Purchases 145,211 3.39% OA60 - - (17,799) (5.85)%AIL AAPH Fellow subsidiary Purchases 6,095,798 54.02% OA60 - - (3,762,346) (93.59)%AIN AMI Parent/Subsidiary (Sales) (301,383) (5.85)% OA60 - - 69,362 57.06%AIN AAPH Fellow subsidiary Purchases 3,957,161 79.72% OA60 - - (890,811) (91.27)%AIN AMI Parent/Subsidiary Purchases 619,588 12.98% OA90 - - (78,152) (8.01)%AIT AEG Fellow subsidiary (Sales) (249,959) (3.95)% OA60 - - 374,022 14.07%
~100~

Purchases/(Sales)
CompanyName Related Party Name of
Relationship
Transaction DetailsTransactions with
Terms Different fromOthers (Note 1)
Notes/Accounts Receivable or(Payable)
Note
Amount% of Total
Purchases/(Sales)Payment
TermsUnitPrice
PaymentTerms
EndingBalance % of Total
AIT AEG Fellow subsidiary Purchases 5,834,556 94.99% OA60 - - (1,219,026) (99.19)%AJC AAPH Fellow subsidiary Purchases 1,970,467 92.58% OA60 - - (939,917) (97.37)%AME AEG Fellow subsidiary Purchases 500,657 54.50% OA60 - - - -AMEX AAC Fellow subsidiary Purchases 3,163,280 97.92% OA60 - - (1,340,972) (100.00)%AMI AIN Parent/Subsidiary (Sales) (619,588) (99.78)% OA90 - - 78,152 99.98%AMI AAPH Fellow subsidiary Purchases 281,450 45.04% OA60 - - (67,068) (47.16)%AMI AIN Parent/Subsidiary Purchases 301,383 48.23% OA60 - - (69,362) (48.78)%AOA AOI Parent/Subsidiary Purchases 171,719 80.14% OA90 - - (93,502) 87.21%AOAU AOI Parent/Subsidiary Purchases 136,796 89.19% OA60 - - (25,783) 74.59%AOE AOI Parent/Subsidiary Purchases 255,958 86.35% OA60 - - (58,598) 91.25%AOTH AOZ Parent/Subsidiary (Sales) (388,291) 41.67% OA60 - - 50,389 40.82%AOTH AOI Parent/Subsidiary (Sales) (466,573) 50.08% OA60 - - 22,486 18.22%AOTH AOZ Parent/Subsidiary Purchases 429,192 40.48% OA60 - - (112,201) 48.58%AOZ AOTH Parent/Subsidiary (Sales) (429,192) 83.26% OA60 - - 112,201 88.10%AOZ AOTH Parent/Subsidiary Purchases 388,291 83.72% OA60 - - (50,389) 80.77%APHI AAPH Fellow subsidiary Purchases 906,346 95.19% OA60 - - (62,258) (37.46)%APHI The Company Parent/Subsidiary Purchases 111,114 10.23% OA60 - - (71,791) (43.19)%APX ACF Fellow subsidiary (Sales) (126,137) (6.61)% OA60 - - 9,265 4.05%APX ACG Fellow subsidiary (Sales) (329,270) (17.26)% OA45 - - 49,837 21.79%APX ACH Fellow subsidiary (Sales) (104,934) (5.50)% OA60 - - 15,707 6.87%APX ACZ Fellow subsidiary (Sales) (193,729) (10.15)% OA90 - - 31,743 13.88%APX AEG Fellow subsidiary (Sales) (394,071) (20.65)% OA60 - - 14,290 6.25%APX AIB Fellow subsidiary (Sales) (145,211) (7.61)% OA60 - - 17,799 7.78%APX ACG Fellow subsidiary Purchases 161,730 10.06% OA60 - - (25,082) (12.22)%APX AEG Fellow subsidiary Purchases 285,073 17.73% OA60 - - (85,226) (41.52)%APX The Company Parent/Subsidiary Purchases 216,898 13.49% OA60 - - (409) (0.20)%ARU ASIN Fellow subsidiary (Sales) (152,657) (100.00)% OA60 - - 12,255 100.00%ASC AAC Fellow subsidiary Purchases 232,236 36.20% OA60 - - (27,064) (26.72)%ASC The Company Parent/Subsidiary Purchases 107,740 16.80% OA60 - - (7,895) (7.79)%ASIN ACZ Fellow subsidiary Purchases 284,611 1.53% OA30 - - - -ASIN AEG Fellow subsidiary Purchases 18,985,080 97.65% OA60 - - (4,806,473) (99.44)%ASIN ARU Fellow subsidiary Purchases 152,657 0.82% OA60 - - (12,255) (0.25)%
~101~

Purchases/(Sales)
CompanyName Related Party Name of
Relationship
Transaction DetailsTransactions with
Terms Different fromOthers (Note 1)
Notes/Accounts Receivable or(Payable)
Note
Amount% of Total
Purchases/(Sales)Payment
TermsUnitPrice
PaymentTerms
EndingBalance % of Total
ASSB SMA Parent/Subsidiary (Sales) (582,958) (18.98)% OA60 - - 1,227 0.50%ASSB AAPH Fellow subsidiary Purchases 2,104,913 76.12% OA60 - - - -ASSB The Company Parent/Subsidiary Purchases 606,407 21.93% OA60 - - (218,639) (92.94)%ASZ AEG Fellow subsidiary Purchases 2,589,243 96.14% OA60 - - (427,359) (98.72)%ATB AAC Fellow subsidiary Purchases 431,430 10.11% OA60 - - (129,913) (7.15)%ATH AAPH Fellow subsidiary Purchases 5,458,313 94.19% OA60 - - (771,781) (91.92)%AUK AEG Fellow subsidiary Purchases 7,539,879 96.41% OA60 - - (1,057,483) (98.88)%SER AEG Fellow subsidiary Purchases 348,616 100.00% OA60 - - (60,253) (99.94)%SMA ASSB Parent/Subsidiary Purchases 582,958 16.02% OA60 - - (1,227) (2.76)%
Note 2: The above transactions between parent and subsidiary are eliminated when preparing the consolidated financial statements.
Note 1: The trade terms and price of sales with related parties are not comparable to the trading terms and prices with third-party customers as they are determined by the economic environment and market competition of specific locations. The trading terms of purchase with related parties are not comparable to the trading terms with third-party vendors as the specifications of products are different.
~102~

Table 6(Amounts in Thousands of New Taiwan Dollars)
Amount Action TakenThe Company AAC Parent/Subsidiary 7,235,970 6.62 - 6,859,434The Company AAPH Parent/Subsidiary 4,282,878 6.10 146,352 Under collection 4,055,633The Company ACCQ Parent/Subsidiary 1,286,591 7.54 - 1,286,591The Company AEG Parent/Subsidiary 458,625 19.66 16 Under collection 453,891The Company AFE Parent/Subsidiary 174,216 5.46 9,485 Under collection 131,972The Company ASSB Parent/Subsidiary 218,639 5.55 - 218,639The Company AEB Parent/Subsidiary 229,113 2.60 3,004 Under collection 1,312The Company WLII Parent/Subsidiary 274,045 11.52 - 274,045ACTTW The Company Parent/Subsidiary 142,570 4.10 - -ADSC The Company Parent/Subsidiary 714,178 - - -CCI The Company Parent/Subsidiary 100,589 - - -AAC AMEX Fellow subsidiary 1,341,691 2.73 885,478 Under collection 420,936AAC ASC Fellow subsidiary 440,487 9.84 - 25,233AAC ATB Fellow subsidiary 129,913 2.70 243 Under collection 91,549AAH AAC Parent/Subsidiary 4,310,000 - - -AAPH ACA Fellow subsidiary 1,869,605 2.40 21,162 Under collection 1,028,775AAPH ACNZ Fellow subsidiary 169,423 4.18 - 166,062AAPH ACS Fellow subsidiary 250,593 8.87 - 238,784AAPH AIL Fellow subsidiary 3,762,346 1.66 1,831,145 Under collection 635,844AAPH AIN Fellow subsidiary 890,811 4.44 - 863,348AAPH AJC Fellow subsidiary 939,917 2.17 - 390,954AAPH ATH Fellow subsidiary 771,781 6.31 - 771,781ACCN ACCQ Fellow subsidiary 128,118 1.64 - 125,356ACCQ ACCN Fellow subsidiary 1,856,817 5.00 - 1,840,287
Acer Incorporated and SubsidiariesReceivables from related parties which exceed NT$100 million or 20% of the paid-in capital
December 31, 2017
Nature ofRelationship
TurnoverRate
OverdueCompanyName Related Party Ending Balance Amount Received in
Subsequent PeriodAllowance for
Bad Debts
~103~

Amount Action TakenNature of
RelationshipTurnover
RateOverdueCompany
Name Related Party Ending Balance Amount Received inSubsequent Period
Allowance forBad Debts
ACF AEG Fellow subsidiary 930,235 0.45 - 59,393ACG AEG Fellow subsidiary 2,531,284 0.34 - 187,534ACH AEG Fellow subsidiary 445,666 0.50 - 30,777AEG ACF Fellow subsidiary 1,472,809 12.47 - 1,472,809AEG ACG Fellow subsidiary 4,834,199 5.11 377 Under collection 4,827,988AEG ACH Fellow subsidiary 741,401 9.18 - 741,401AEG AIB Fellow subsidiary 307,168 11.75 - 307,168AEG AIT Fellow subsidiary 1,219,026 5.77 - 1,219,026AEG ASIN Fellow subsidiary 4,814,688 4.87 - 4,449,543AEG ASZ Fellow subsidiary 427,359 6.87 - 427,359AEG AUK Fellow subsidiary 1,057,483 5.72 356 Under collection 1,057,127AGU AEG Fellow subsidiary 719,009 - - -AIB AEG Fellow subsidiary 443,323 0.89 - 105,838AIT AEG Fellow subsidiary 476,178 0.73 - -AIZS ACCN Fellow subsidiary 211,011 - - -AOZ AOTH Parent/Subsidiary 112,201 4.38 51,371 Under collection 26,863ASCBVI LONG Fellow subsidiary 298,481 - - -ASIN AEG Fellow subsidiary 816,142 - - 867ASZ AEG Fellow subsidiary 283,924 0.28 - 10,279AUK AEG Fellow subsidiary 848,792 0.12 - 28,903GWI AAC Parent/Subsidiary 173,506 - - -LONG SURE Parent/Subsidiary 298,481 - - -
Note: The above transactions between parent and subsidiary are eliminated when preparing the consolidated financial statements.
~104~

Table 7(Amounts in Thousands of New Taiwan Dollars)
Intercomapny relationships and significant intercompany transactions for the year ended December 31, 2017 were as follows:
Account Amount TransactionTerms
0 The Company AEG 1 Sales 64,880,178 OA60 27.34%0 The Company AAC 1 Sales 53,002,734 OA90 22.34%0 The Company AAPH 1 Sales 30,853,237 OA60 13.00%0 The Company ACCQ 1 Sales 10,248,480 OA60 4.32%0 The Company AAC 1 Accounts receivable 7,235,970 OA90 4.59%0 The Company AAPH 1 Accounts receivable 4,282,878 OA60 2.72%
Note 1: Parties to the intercompany transactions are identified and numbered as follows: 1. "0" represents the Company. 2. Subsidiaries are numbered from "1".Note 2: No. 1 represents the transactions from parent company to subsidiary. No. 2 represents the transactions from subsidiary to parent company.Note 3: Intercompany relationships and significant intercompany transactions are disclosed only for the amounts that exceed 1% of consolidated net revenue or total assets. The corresponding purchases and accounts payables are not disclosed.
Acer Incorporated and SubsidiariesIntercompany relationships and significant intercompany transactions
For the year ended December 31, 2017
Number(Note 1) Company Name Counter Party
Nature ofRelationship
(Note 2)
Intercompany Transactions Percentage of ConsolidatedNet Revenue or Total
Assets
~105~

Table 8(Amounts in Thousands of New Taiwan Dollars/Shares)
December 31,2017
December 31,2016
Shares(in thousands)
Percentage ofOwnership
Carrying Value Shares(in thousands)
Percentage ofOwnership
The Company ADSC Taiwan Investing and holding company 1,746,549 1,746,549 128,282 100.00 1,854,630 128,282 100.00 66,043 66,043 Parent/SubsidiaryThe Company Boardwalk BritishVirgin Islands Investing and holding company 41,496,383 41,496,383 1,263,432 92.02 24,939,560 1,263,432 92.02 295,672 272,063 Parent/SubsidiaryThe Company AEH Switzerland Investing and holding company 2,464,262 2,464,262 150 100.00 16,788,129 150 100.00 (302,596) (302,596) Parent/SubsidiaryThe Company AHI BritishVirgin Islands Investing and holding company 1,130,566 1,130,566 33,550 100.00 8,717,637 33,550 100.00 327,262 327,262 Parent/SubsidiaryThe Company Bluechip Australia Sale of peripheral and software system 24,249 24,249 1,073 30.23 69,399 1,073 30.23 14,971 4,489 AssociateThe Company AWI BritishVirgin Islands Investing and holding company 4,069,764 4,069,764 1,326,193 100.00 282,289 1,326,193 100.00 482 482 Parent/SubsidiaryThe Company ASCBVI BritishVirgin Islands Investing and holding company 1,900,347 1,718,547 43,067 100.00 1,236,767 43,067 100.00 (28,505) (28,505) Parent/SubsidiaryThe Company CCI Taiwan Investing and holding company 1,299,817 1,299,817 - 100.00 543,159 - 100.00 1,909 1,909 Parent/SubsidiaryThe Company ADSBH BritishVirgin Islands Investing and holding company 1,175,933 1,175,933 2,246 100.00 (290,863) 2,246 100.00 (291) (291) Parent/SubsidiaryThe Company ACCSI Taiwan Cyber sercurity service 1,242,578 2,943,044 4,000 100.00 124,226 187,092 100.00 (8,705) (8,705) Parent/SubsidiaryThe Company AGC BritishVirgin Islands Investing and holding company 4,941,292 4,941,292 160,989 100.00 4,803,049 160,989 100.00 (135,310) (135,310) Parent/SubsidiaryThe Company WLII Taiwan Sale of computers and communication products 1,115,474 1,115,474 70,088 99.79 1,318,664 70,088 99.79 69,816 69,669 Parent/SubsidiaryThe Company ATI Taiwan Integrated circuit test service 819,792 819,792 1,203 19.39 3,068 1,203 19.39 (20,000) (3,877) AssociateThe Company ETEN Taiwan Research, design and sale of smart handheld
products6,800,751 6,800,751 20,000 100.00 2,166,180 20,000 100.00 (203,055) (203,055) Parent/Subsidiary
The Company ABH Taiwan Investing and holding company 1,919,004 1,500,000 215,205 100.00 1,529,848 215,205 100.00 (368,170) (368,170) Parent/SubsidiaryThe Company ASBZ Taiwan Solutions provider of B2B virtual reality 320,000 32,000 32,000 66.67 300,689 32,000 66.67 (31,096) (20,450) Parent/SubsidiaryThe Company EDC Taiwan Date center and cloud service 1,700,466 - 186,593 100.00 1,700,905 186,593 100.00 - - Parent/SubsidiaryThe Company AOI Taiwan Sale, manufacture, import and export of
commercial computer products, software,components, peripheral equipment andapparatus; repair and maintenance services ofcomputer products
333,155 - 28,970 40.55 331,350 28,970 40.55 (12,422) (5,037) Parent/Subsidiary
ACCSI TWPBVI BritishVirgin Islands Investing and holding company - 32,298 - - - 11,068 100.00 4,800 4,800 Fellow subsidiariesEDC TWPBVI BritishVirgin Islands Investing and holding company 32,298 - 11,068 100.00 4,120 11,068 100.00 4,800 - Parent/SubsidiaryADSC ECS Taiwan Business integration system 40,851 40,851 1,244 24.88 20,869 1,244 24.88 15,980 3,824 AssociateADSC APDI Taiwan Property development 29,577 29,577 2,958 100.00 101,312 2,958 100.00 (468) (468) Parent/SubsidiaryADSC ASDI Taiwan Property development 500,000 500,000 22,593 100.00 223,467 22,593 100.00 3,760 3,760 Parent/SubsidiaryADSC KBest Taiwan Development and manufacturing of radio and
microwave equipment129,293 69,668 4,427 28.03 88,114 4,427 28.03 (16,841) 28,489 Associate
WLII HPT Taiwan Retail service of software 23,668 23,668 882 30.22 16,271 882 30.22 11,480 3,469 AssociateWLII WHI Hong Kong Sale of computers and communication products 55,895 55,895 12,872 100.00 17,938 12,872 100.00 (65) (65) Parent/SubsidiaryWLII WELL Taiwan Matchmaking of professional services, platform
of client service and sale of products, andproviding of professional seminars and courses
10,000 10,000 1,000 100.00 3,251 1,000 100.00 (2,811) (2,811) Parent/Subsidiary
WLII ISU Taiwan System integration service 70,000 - 7,000 100.00 70,112 10,000 100.00 112 112 Parent/SubsidiaryAEH Boardwalk BritishVirgin Islands Investing and holding company 3,333,032 3,333,032 109,639 7.98 2,168,131 109,639 7.98 295,672 23,609 Fellow subsidiariesACTI GrandPAD USA Development of user-friendly IoT device 350,477 258,256 436 43.28 261,457 436 43.28 (148,422) (69,493) Associate
Acer Incorporated and SubsidiariesNames, Locations, and Related Information of Investees over which The Company Exercises Significant Influence
December 31, 2017
Original Investment Amount Balances as of December 31, 2017 Maximum ownership during 2017Investor Investee Location Main Businesses and Products
Net Income(Loss) of the
Investee
Share of profits/losses of investee Note
~106~

December 31,2017
December 31,2016
Shares(in thousands)
Percentage ofOwnership
Carrying Value Shares(in thousands)
Percentage ofOwnership
Original Investment Amount Balances as of December 31, 2017 Maximum ownership during 2017Investor Investee Location Main Businesses and Products
Net Income(Loss) of the
Investee
Share of profits/losses of investee Note
ABH AEB Taiwan Cloud ticketing system, electronic book, onlinepayment service, customized systemdevelopment and integration services, and saleof commercial and cloud application softwareand technical services
549,650 583,046 53,563 100.00 549,613 60,000 100.00 26,693 26,693 Parent/Subsidiary
ABH ACTTW Taiwan Development of Internet of Beings and cloudtechnology, and integration of cloud technology,software and hardware
1,125,400 600,000 112,540 100.00 611,732 112,540 100.00 (327,719) (327,719) Parent/Subsidiary
ABH MPS Taiwan Research, development, and sale of batteries 81,711 81,711 10,000 100.00 12,487 10,000 100.00 (28,265) (28,265) Parent/SubsidiaryABH ALT Taiwan High performance computing, cloud computing,
software-defined storage , and IT solution48,000 48,000 4,800 100.00 49,542 4,800 100.00 1,577 1,577 Parent/Subsidiary
ABH ITS Taiwan Program and service of intelligent transportationand electronic ticketing
300,000 - 30,000 100.00 258,293 30,000 100.00 (41,668) (41,668) Parent/Subsidiary
AEB XPL Taiwan Design, development and sale of smart bicyclespeedometer
131,640 66,040 8,372 100.00 43,112 8,372 100.00 (39,702) (39,702) Parent/Subsidiary
AEB PBC Taiwan Pet interaction device and social networkingservice
102,400 46,400 6,742 100.00 27,878 6,742 100.00 (39,170) (39,170) Parent/Subsidiary
AEB PKL Taiwan Integration of service platforms includingparking lots searching, parking feecomparison,and GPS navigation
- 24,000 - - - 26,000 100.00 (51,001) (13,603) Fellow subsidiaries
ITS PKL Taiwan Integration of service platforms includingparking lots searching, parking feecomparison,and GPS navigation
- - - - - 52,000 100.00 (51,001) (37,398) Parent/Subsidiary
ACTTW ABC Taiwan Software design service 76,371 76,371 2,071 51.00 18,986 8,000 100.00 (26,485) (26,485) Parent/SubsidiaryACTTW AGI Taiwan Development of user-friendly IoT device 29,000 29,000 2,900 100.00 18,307 2,900 100.00 (8,597) (8,597) Parent/SubsidiaryACTTW ABST Taiwan Technical service and research of aBeing cloud
digital content management272,400 - 27,240 100.00 251,945 27,240 100.00 (26,191) (26,191) Parent/Subsidiary
ACTTW ABSG Germany Technical service and research of aBeing clouddigital content management
- - - - - 1,925 100.00 (53,384) (27,835) Parent/Subsidiary
ABST ABSG Germany Technical service and research of aBeing clouddigital content management
148,347 - 4,485 100.00 128,414 4,485 100.00 (53,384) (25,549) Parent/Subsidiary
AOI Bluechip Australia Sale of peripheral and software system 36,915 - 570 16.06 38,223 570 16.06 14,971 295 AssociateAOI AOA USA Sale of computer, apparatus system, and
peripheral equipment295,771 - 15,000 100.00 (178,256) 15,000 100.00 32,563 44,214 Parent/Subsidiary
AOI AOE Netherland Sale of computer, apparatus system, andperipheral equipment
214,094 - 1 100.00 (30,286) 1 100.00 21,156 2,613 Parent/Subsidiary
AOI AOTH BritishVirgin Islands Sale of computer, apparatus system, andperipheral equipment
1,623 - 50 100.00 223,764 50 100.00 (23,641) (14,456) Parent/Subsidiary
AOI AOJ Japan Sale of computer, apparatus system, andperipheral equipment
2,899 - 1 100.00 25,531 1 100.00 1,667 (432) Parent/Subsidiary
AOI GCC Taiwan Sale of computer, apparatus system, andperipheral equipment
60,000 - 6,000 100.00 38,204 6,000 100.00 3,212 8,599 Parent/Subsidiary
AOI AOGS Australia Sale of computer, apparatus system, andperipheral equipment
2,956 - 105 70.00 17,960 105 70.00 4,754 (3,789) Parent/Subsidiary
AOI HTW Hong Kong Software development and agency 405 - 100 100.00 921 100 100.00 85 1 Parent/Subsidiary
~107~

December 31,2017
December 31,2016
Shares(in thousands)
Percentage ofOwnership
Carrying Value Shares(in thousands)
Percentage ofOwnership
Original Investment Amount Balances as of December 31, 2017 Maximum ownership during 2017Investor Investee Location Main Businesses and Products
Net Income(Loss) of the
Investee
Share of profits/losses of investee Note
AOI MPL Australia Sale of computer, apparatus system, andperipheral equipment
23,444 - 40 40.00 23,309 40 40.00 - - Associate
AOTH GCL Hong Kong Sale of computer, apparatus system, andperipheral equipment
2,675 - 300 100.00 3,763 300 100.00 86 68 Parent/Subsidiary
AOGS AOAU Australia Sale of computer, apparatus system, andperipheral equipment
3 - 1 100.00 27,938 1 100.00 4,717 (5,413) Parent/Subsidiary
Note: On November 24, 2017, the Company obtained control over AOI and its subsidiaries. Therefore, the share of profits/losses recognized by the company only included the profit (loss) of AOI and its subsidiaries from November 24 to December 31, 2017.
~108~
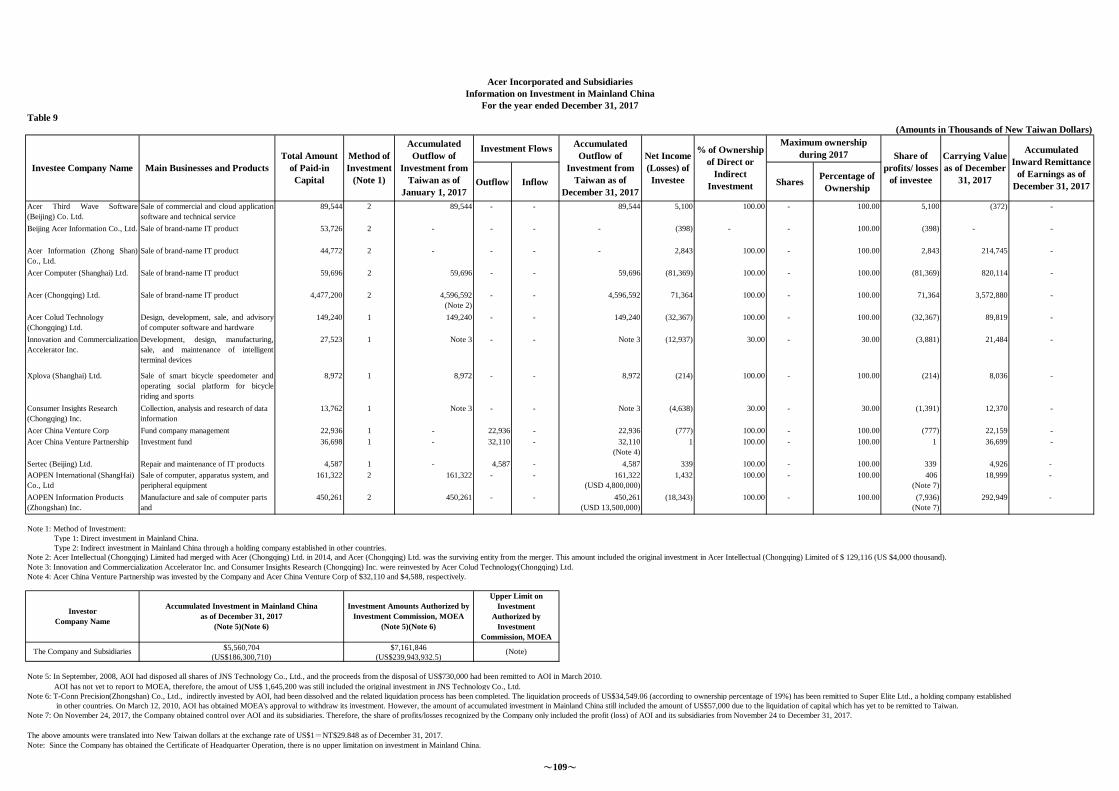
Table 9(Amounts in Thousands of New Taiwan Dollars)
Outflow Inflow Shares Percentage ofOwnership
Acer Third Wave Software(Beijing) Co. Ltd.
Sale of commercial and cloud applicationsoftware and technical service
89,544 2 89,544 - - 89,544 5,100 100.00 - 100.00 5,100 (372) -
Beijing Acer Information Co., Ltd. Sale of brand-name IT product 53,726 2 - - - - (398) - - 100.00 (398) - -
Acer Information (Zhong Shan)Co., Ltd.
Sale of brand-name IT product 44,772 2 - - - - 2,843 100.00 - 100.00 2,843 214,745 -
Acer Computer (Shanghai) Ltd. Sale of brand-name IT product 59,696 2 59,696 - - 59,696 (81,369) 100.00 - 100.00 (81,369) 820,114 -
Acer (Chongqing) Ltd. Sale of brand-name IT product 4,477,200 2 4,596,592(Note 2)
- - 4,596,592 71,364 100.00 - 100.00 71,364 3,572,880 -
Acer Colud Technology(Chongqing) Ltd.
Design, development, sale, and advisoryof computer software and hardware
149,240 1 149,240 - - 149,240 (32,367) 100.00 - 100.00 (32,367) 89,819 -
Innovation and CommercializationAccelerator Inc.
Development, design, manufacturing,sale, and maintenance of intelligentterminal devices
27,523 1 Note 3 - - Note 3 (12,937) 30.00 - 30.00 (3,881) 21,484 -
Xplova (Shanghai) Ltd. Sale of smart bicycle speedometer andoperating social platform for bicycleriding and sports
8,972 1 8,972 - - 8,972 (214) 100.00 - 100.00 (214) 8,036 -
Consumer Insights Research(Chongqing) Inc.
Collection, analysis and research of datainformation
13,762 1 Note 3 - - Note 3 (4,638) 30.00 - 30.00 (1,391) 12,370 -
Acer China Venture Corp Fund company management 22,936 1 - 22,936 - 22,936 (777) 100.00 - 100.00 (777) 22,159 -Acer China Venture Partnership Investment fund 36,698 1 - 32,110 - 32,110
(Note 4)1 100.00 - 100.00 1 36,699 -
Sertec (Beijing) Ltd. Repair and maintenance of IT products 4,587 1 - 4,587 - 4,587 339 100.00 - 100.00 339 4,926 -AOPEN International (ShangHai)Co., Ltd
Sale of computer, apparatus system, andperipheral equipment
161,322 2 161,322 - - 161,322(USD 4,800,000)
1,432 100.00 - 100.00 406.(Note 7)
18,999 -
AOPEN Information Products(Zhongshan) Inc.
Manufacture and sale of computer partsand
450,261 2 450,261 - - 450,261(USD 13,500,000)
(18,343) 100.00 - 100.00 (7,936)(Note 7)
292,949 -
Note 1: Method of Investment: Type 1: Direct investment in Mainland China. Type 2: Indirect investment in Mainland China through a holding company established in other countries.
Note 3: Innovation and Commercialization Accelerator Inc. and Consumer Insights Research (Chongqing) Inc. were reinvested by Acer Colud Technology(Chongqing) Ltd.Note 4: Acer China Venture Partnership was invested by the Company and Acer China Venture Corp of $32,110 and $4,588, respectively.
Note 5: In September, 2008, AOI had disposed all shares of JNS Technology Co., Ltd., and the proceeds from the disposal of US$730,000 had been remitted to AOI in March 2010. AOI has not yet to report to MOEA, therefore, the amout of US$ 1,645,200 was still included the original investment in JNS Technology Co., Ltd. Note 6: T-Conn Precision(Zhongshan) Co., Ltd., indirectly invested by AOI, had been dissolved and the related liquidation process has been completed. The liquidation proceeds of US$34,549.06 (according to ownership percentage of 19%) has been remitted to Super Elite Ltd., a holding company established in other countries. On March 12, 2010, AOI has obtained MOEA's approval to withdraw its investment. However, the amount of accumulated investment in Mainland China still included the amount of US$57,000 due to the liquidation of capital which has yet to be remitted to Taiwan.Note 7: On November 24, 2017, the Company obtained control over AOI and its subsidiaries. Therefore, the share of profits/losses recognized by the Company only included the profit (loss) of AOI and its subsidiaries from November 24 to December 31, 2017.
The above amounts were translated into New Taiwan dollars at the exchange rate of US$1=NT$29.848 as of December 31, 2017.Note: Since the Company has obtained the Certificate of Headquarter Operation, there is no upper limitation on investment in Mainland China.
The Company and Subsidiaries $5,560,704 $7,161,846 (Note)(US$186,300,710) (US$239,943,932.5)
InvestorCompany Name
Note 2: Acer Intellectual (Chongqing) Limited had merged with Acer (Chongqing) Ltd. in 2014, and Acer (Chongqing) Ltd. was the surviving entity from the merger. This amount included the original investment in Acer Intellectual (Chongqing) Limited of $ 129,116 (US $4,000 thousand).
Accumulated Investment in Mainland Chinaas of December 31, 2017
(Note 5)(Note 6)
Investment Amounts Authorized byInvestment Commission, MOEA
(Note 5)(Note 6)
Upper Limit onInvestment
Authorized byInvestment
Commission, MOEA
AccumulatedOutflow of
Investment fromTaiwan as of
January 1, 2017
% of Ownershipof Direct or
IndirectInvestment
AccumulatedInward Remittance
of Earnings as ofDecember 31, 2017
Acer Incorporated and SubsidiariesInformation on Investment in Mainland China
For the year ended December 31, 2017
Investee Company Name Main Businesses and ProductsTotal Amount
of Paid-inCapital
Investment FlowsNet Income(Losses) ofInvestee
Maximum ownershipduring 2017 Share of
profits/ lossesof investee
Carrying Valueas of December
31, 2017
Method ofInvestment
(Note 1)
AccumulatedOutflow of
Investment fromTaiwan as of
December 31, 2017
~109~