Acer Incorporated 2008 Annual Report · 7.3 Supervisor’s Audit Report ... we expect to boost our...
65
Acer Incorporated 2008 Annual Report Published Date: April 30, 2009 www.acer-group.com
Transcript of Acer Incorporated 2008 Annual Report · 7.3 Supervisor’s Audit Report ... we expect to boost our...

Acer Incorporated 2008 Annual Report
Published Date: April 30, 2009 www.acer-group.com
1.Business Report to Shareholders1.1 Acer’s Core Values 1.2 2008 Operating Report 1.3 2009 Business Plan
2.Company In General2.1 Brief Account of the Company
3.Corporate Governance Principles3.1 Organization of the Company3.2 Information Regarding Board of Directors, Supervisors and Key Managers3.3 Corporate Governance Status
4.Capital and Shares4.1 Sources of Capital4.2 Corporate Bonds4.3 Special Shares4.4 Global Depository Receipts (GDRs) Issuance4.5 Employee Stock Options4.6 Mergers, Acquisitions, and Issuance of New Shares Due to Company Acquisitions
060809
13
182024
323535363637
40404144
485051
54565859
117117
120121
Index
5.Acer’s Winning Formula5.1 Acer’s Winning Formula5.2 The Five Keys to a Sustainable Future5.3 Employees5.4 Important Contracts
6.Corporate Social Responsibility6.1 Environmental, Safety and Health Management6.2 Stakeholders Communication and Management6.3 Social Welfare
7.Financial Standing7.1 Five-year Consolidated Financial Information7.2 Five-year Financial Analysis7.3 Supervisor’s Audit Report7.4 Financial Statements Consolidated With Subsidiaries Audited by CPAs of the Past Year7.5 Disclosure of the Impact on Company’s Financial Status Due to Financial Difficulties7.6 Financial Prediction and Achievements
8.Risk Management8.1 Recent Annual Investment Policy and Main Reasons of Gain or Loss and Improvement Plan8.2 Important Notices for Risk Management and Evaluation
02
30
38
46
52
118
1016

Acer Incorporated 2008 Annual Report2 Acer Incorporated 2008 Annual Report 3
1.Business Report to Shareholders

Acer Incorporated 2008 Annual Report Acer Incorporated 2008 Annual Report4 5
Business Report to Shareholders
Acer Incorporated 2008 Annual Report Acer Incorporated 2008 Annual Report4 5
Business Report to Shareholders
In year 2008, Acer once again achieved record-breaking revenue and profit figures. The consolidated revenues rose 18% on-year to reach NT$546.27B (US$16.65B), operating income grew 38% on-year to reach NT$14.1B (US$429M), profit after tax was NT$11.7B (US$357.6M), and earnings-per-share was NT$4.72.
Acer’s share in the global PC market grew significantly, drawing vast attention from the industry and media in the second half of 2008 with the highly successful launch of Aspire One netbooks. According to leading IT research firm, Gartner, Acer ranked No. 3 for Total PCs with 55% growth, and No. 2 for notebooks (including netbooks) with 60% growth, globally. In both categories, Acer’s on-year growth rates were the highest among the top players.
Since the acquisition of Gateway and Packard Bell, Acer has completed the integration of its resources and is now operating with powerful synergy. We conducted in-depth research and defined a new multi-brand strategy. Acer, Gateway, eMachines and Packard Bell each have clear brand positioning by geography and customer segment, and with differentiated product line design.
During this global economic downturn, our competitors are inclined to taking a conservative approach; Acer, however, remains positive, firmly believing that current conditions present hidden opportunities. With our sustainable business model and lower operating costs, we aim to continue expanding market share and improve our worldwide ranking. In 2009, we expect to boost our notebook market share by 2~3% from the previous year with netbooks playing a key role, and to maintain healthy revenue and profit growths.
Acer shall focus on the effective implementation of our multi-brand strategy - a key factor of our success that encompasses global brand management and differentiated product line design. We will continue to minimize operational costs, improve our customer order fulfillment to meet the fast-changing demands of the PC market. Opportunities lie ahead, we’ve set our sights on attaining significant growth in the U.S., China and Japan markets, and ultimately, gaining a more even spread of revenues from our worldwide markets.
Acer’s business model has proved to be the best in high-uncertainty business environments. We regard ourselves to be in the favorable position compared to the key PC players, and are confident that our goal of becoming the world’s No. 1 notebook vendor is in close proximity.
Finally, we thank all our shareholders for their relentless support and guidance.
Sincerely,
J.T. WangAcer Group CEO and Acer Inc. Chairman

Acer Incorporated 2008 Annual Report Acer Incorporated 2008 Annual Report6 7
Business Report to Shareholders
Acer Incorporated 2008 Annual Report Acer Incorporated 2008 Annual Report6 7
Core Value Rational Meaning Emotional Meaning
Value-creating Generating profit for shareholders Growing the business by achieving the challenging financial and strategic objectives Leveraging our key assets: Brands, People, Customers and Channel
Value for shareholders (good dividends and shares value) Value for customers (good products, services, easy to do business) Value for employees (good company, environment, opportunities)
Customer-centric Recognizing that customers are the essence of our business Placing first priority on listening to and satisfying customer needs Delivering first-class products and services
Love and respect for our customers Listen, learn and improve Walk the talk (delivering on our promises)
Ethical Being a good corporate citizen by playing a role in social growth Caring for the environment all across the business value chain Building on trust and honesty internally and externally by respecting people, diversities and cultures
Trust, respect and honesty Care for the environment An example to others
Caring Creating an attractive workplace and ensuring a proper work-life balance Providing employees with development and professional growth opportunities Fostering teamwork and collaboration
Energetic and inspiring workplace Growth potential Teamwork
Innovative Challenging the way of doing things and adopting new ideas Supporting continuous improvement in processes and products Creating impact through original thinking
Think big Think smart Think outside of the box (innovatively)
Fast Putting speed in execution at the heart of our operations Being proactive in making decisions Anticipating changes ahead of competition as key to success
Think fast Act quickly Get there first
Effective Doing the right things right Creating an empowered environment with clear responsibilities and targets Recognizing the power of being simple and attentive to basics
Clear objectives Clear responsibilities Keep it simple
1.1 Acer’s Core Values
The challenge for all businesses is to be unique. Whether you’re a customer, an employee or a shareholder, the only way any business will attract you is if it stands out from the crowd.
Being unique, however, isn’t a quality you can simply switch on and off.
At Acer, we have built our reputation on creating value in every aspect of the company throughout our history: • We create value for our customers by offering a continuous stream of innovative and empowering solutions that
anticipate and satisfy their needs. • We create value for our investors by consistently providing positive returns year after year. • We create value for our employees, allowing us to realized our full potential and achieve our goals. • We create value for our business partners with win-win solutions with our vendors and our valuable channel
partners.
Creating value through brand recognition is the way forward rather than competitive pricing. There’s no other way to win tomorrow’s business than to believe in the power of our brands right now.
To be a successful global brand company, it is critical that employees have a consistent set of core values as a solid basis. The defi ned core values will bring to the Company both short-term benefi ts and long-term advantages.
The approaches that we must base our actions: Value-creating, Customer-centric, Ethical and Caring. The way we must act: Innovative, Fast and Effective.
We encourage all employees to understand, practice and emphasize the core values in our respective roles.
Sincerely,
Gianfranco Lanci CEO & Corp. President
Acer’s Core Values
Acer Incorporated 2008 Annual Report Acer Incorporated 2008 Annual Report8 9
Business Report to Shareholders
Acer Incorporated 2008 Annual Report Acer Incorporated 2008 Annual Report8 9
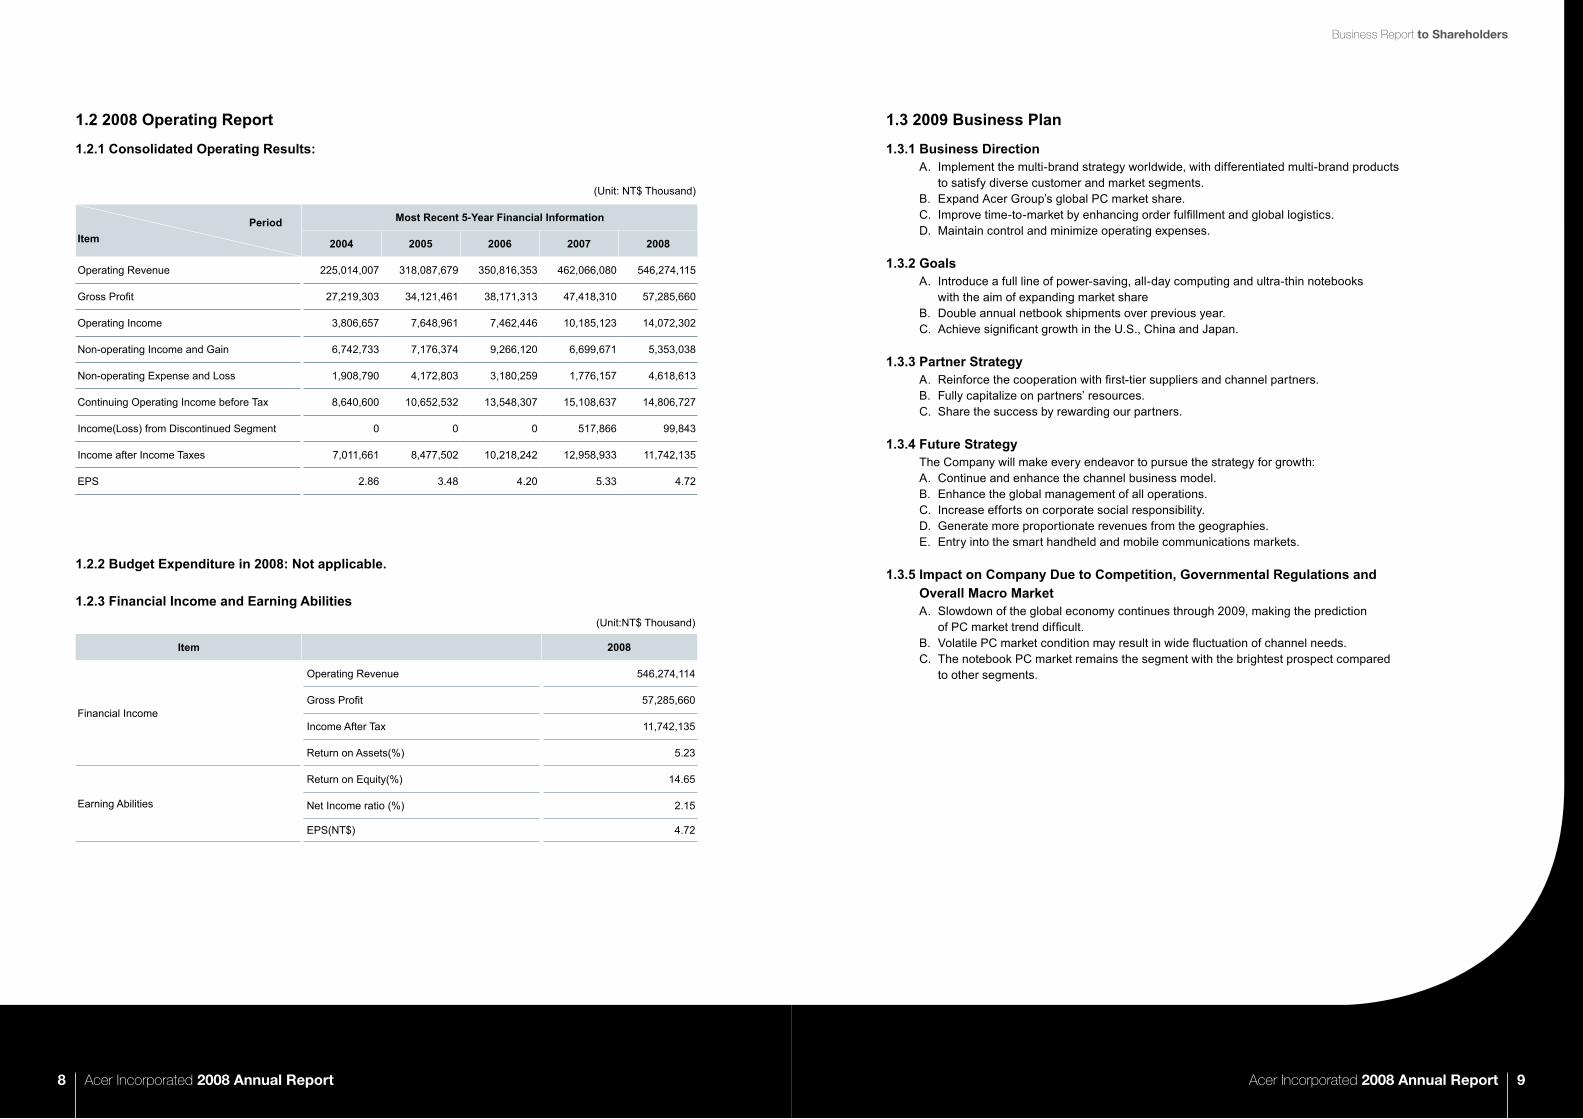
1.2 2008 Operating Report
1.2.1 Consolidated Operating Results:
(Unit: NT$ Thousand)
PeriodItem
Most Recent 5-Year Financial Information
2004 2005 2006 2007 2008
Operating Revenue 225,014,007 318,087,679 350,816,353 462,066,080 546,274,115
Gross Profit 27,219,303 34,121,461 38,171,313 47,418,310 57,285,660
Operating Income 3,806,657 7,648,961 7,462,446 10,185,123 14,072,302
Non-operating Income and Gain 6,742,733 7,176,374 9,266,120 6,699,671 5,353,038
Non-operating Expense and Loss 1,908,790 4,172,803 3,180,259 1,776,157 4,618,613
Continuing Operating Income before Tax 8,640,600 10,652,532 13,548,307 15,108,637 14,806,727
Income(Loss) from Discontinued Segment 0 0 0 517,866 99,843
Income after Income Taxes 7,011,661 8,477,502 10,218,242 12,958,933 11,742,135
EPS 2.86 3.48 4.20 5.33 4.72
1.2.2 Budget Expenditure in 2008: Not applicable.
1.2.3 Financial Income and Earning Abilities(Unit:NT$ Thousand)
Item 2008
Financial Income
Operating Revenue 546,274,114
Gross Profit 57,285,660
Income After Tax 11,742,135
Return on Assets(%) 5.23
Earning Abilities
Return on Equity(%) 14.65
Net Income ratio (%) 2.15
EPS(NT$) 4.72
1.3 2009 Business Plan
1.3.1 Business DirectionA. Implement the multi-brand strategy worldwide, with differentiated multi-brand products to satisfy diverse customer and market segments.B. Expand Acer Group’s global PC market share.C. Improve time-to-market by enhancing order fulfillment and global logistics.D. Maintain control and minimize operating expenses.
1.3.2 GoalsA. Introduce a full line of power-saving, all-day computing and ultra-thin notebooks with the aim of expanding market shareB. Double annual netbook shipments over previous year.C. Achieve significant growth in the U.S., China and Japan.
1.3.3 Partner StrategyA. Reinforce the cooperation with first-tier suppliers and channel partners.B. Fully capitalize on partners’ resources.C. Share the success by rewarding our partners.
1.3.4 Future StrategyThe Company will make every endeavor to pursue the strategy for growth:A. Continue and enhance the channel business model.B. Enhance the global management of all operations.C. Increase efforts on corporate social responsibility.D. Generate more proportionate revenues from the geographies.E. Entry into the smart handheld and mobile communications markets.
1.3.5 Impact on Company Due to Competition, Governmental Regulations and Overall Macro Market
A. Slowdown of the global economy continues through 2009, making the prediction of PC market trend difficult.B. Volatile PC market condition may result in wide fluctuation of channel needs.C. The notebook PC market remains the segment with the brightest prospect compared to other segments.

Acer Incorporated 2008 Annual Report10 Acer Incorporated 2008 Annual Report 11
2.Company In General

Acer Incorporated 2008 Annual Report Acer Incorporated 2008 Annual Report12 13
Company In General
Acer Incorporated 2008 Annual Report Acer Incorporated 2008 Annual Report12 13
2.1 Brief Account of the Company
2.1.1 Founded: August 1, 1976
1976 – 1986: • Commercialized microprocessor technology
1987 – 2000: • Created the Acer brand name and went global
2001 – 2007: • Transformed from manufacturing to a marketing and
sales company
2008 – beyond: • Enhancing worldwide presence with a new multi-
brand strategy
1976• Acer was founded under the name Multitech,
focusing on trade and product design.
1978• Acer established the Microprocessor Training
Centre, training 3,000 engineers for Taiwan's information industry.
1979• Acer designed Taiwan's f irst mass-produced
computer for export.
1981• Acer manufacturing operations were established in
the Hsinchu Science-based Industrial Park, Taiwan.• MicroProfessor-I debuted as Acer's first branded
product.
1982• MicroProfessor-II was unveiled as Taiwan's first 8-bit
home computer.
1983 • Acer was the first company to promote 16-bit PC
products in Taiwan.
1984 • Acer Peripherals, Inc. (now BenQ Corp.) and
Multiventure Investments, Inc. were established.
1985 • AcerLand, Taiwan's first and largest franchised
computer retail chain was founded.
1986• Acer beat IBM with 32-bit PCs.
1987 • The Acer name was created.
1988 • Acer Inc. launched IPO.
1989 • TI-Acer DRAM joint venture with Texas Instruments
was formed.• Acer initiated the Aspire Park project, based on the
idea of providing housing for Acer employees.
1991 • Acer introduced ChipUp™ technology - the world's
first 386-to-486 single-chip CPU upgrade solution.
1992 • Acer created the world's first 386SX-33 chipset.• Stan Shih introduced the Smiling Curve concept.• Acer initiated its first corporate re-engineering.
1993 • Acer developed a 64-bit performance-enhanced I/O
and CPU architecture to link MIPS RISC CPUs with Microsoft® Windows® NT.
1994 • Acer introduced the world's first dual Intel® Pentium®
PC.
1995 • The popular Aspire multimedia PC brought Acer
closer to the consumer electronics market.
1996 • Acer announced its commitment to providing fresh
technology to be enjoyed by everyone, everywhere.
1997• Of f ic ial groundbreaking ceremony was held
for Aspire Park, Acer's multifunction high-tech intelligence park.
1998 • Acer was the official IT Sponsor of the 13th Asian
Games in Bangkok, introducing the world’s first PC-based management system for a major international sporting event.

Acer Incorporated 2008 Annual Report Acer Incorporated 2008 Annual Report14 15
Company In General
Acer Incorporated 2008 Annual Report Acer Incorporated 2008 Annual Report14 15
1999 • Aspire Academy was set up in Aspire Park to help
managers of Asian firms and MNCs with offices in Asia to improve their organizational and leadership effectiveness.
2000 • As part of Acer’s latest re-engineering, Acer split off
its OEM business unit to create Wistron Corp., an independent design and IT manufacturing company.
2001 • Acer adopted a new corporate identity to reflect the
Company's commitment to enhancing people's lives through technology.
• Acer revealed a new generation of e-business: MegaMicro e-Enabling Services.
2002 • The new Acer Aspire was launched, bringing fresh
standards to the global home-PC arena.• The Product Value Labs were inaugurated to
enhance Acer 's customer-centr ic focus, and integrated technologies that add value to customers' lives.
• Launched the TravelMate C100 Convertible Tablet PC, the first convertible Tablet PC available in the worldwide market.
2003 • The next-generation Empowering Technology
plat form was launched, integrating hardware, sof tware and service to provide end-to -end technologies that are dependable and easy-to-use.
2004 • Launched a new Folio design for notebooks,
featuring pure functional simplicity, smooth curves and subtle elegance.
• BusinessWeek selected Stan Shih as one of the “25 Stars of Asia.”
• Acer Founder Stan Shih retired from the Group.
2005 • J.T. Wang assumed the positions of Chairman and
Chief Executive Officer, while Gianfranco Lanci stepped into the role of President of Acer Inc.
• Acer launched the Ferrari 4000, the first carbon-fiber notebook available in the worldwide market.
• A series of Empowering Technology products were unveiled.
• Acer became the worldwide No. 4 vendor for Total PCs and notebooks.
• Acer became the No. 1 brand in EMEA and Western Europe for notebooks.
2006 • Acer was the first-to-market with a full line of Intel®
Centrino® Duo mobile technology notebooks.• Acer became a Sponsor of Scuderia Ferrari.• Acer celebrated its 30th anniversary.• Acer AT3705-MGW LCD TV became the world's
f irst digital TV to pass Intel® Viiv™ technology verification.
• Acer became the No. 3 notebook and No. 4 desktop brand worldwide.
2007 • Acer announced readiness for Windows Vista™ with
full range of Vista-certified LCD monitors.• Acer set the trend in product design with new Aspire
Gemstone-design consumer notebooks.• Acer set the trend in product design with new Aspire
Gemstone-design consumer notebooks.• Acer disclosed plans to sell partial Apacer shares to
Powerchip Semiconductor Corp.• Acer completed the merger of Gateway, Inc.• Acer announced its joining as an Olympic Worldwide
Partner for the Vancouver 2010 Olympic Winter Games and London 2012 Olympic Games.
• Acer became the No. 2 notebook and No. 3 desktop PC vendor worldwide.
2008 • Acer was voted Reader’s Digest gold-medal Computer
TrustedBrand in Asia for the ninth consecutive year.• Acer launched a new generation of the Aspire
Gemstone Blue design notebooks, the f irst to incorporate ful l HD 18.4” and 16” LCDs with widescreen 16:9 aspect ratio, Blue-Ray Disc™ drive, and the latest generation of Dolby® Surround sound.
• The Aspire One launched as the Company’s first mobile internet device, and won the coveted Japan Good Design award – an internationally-recognized mark of design quality.
• Acer ranked No. 3 for Total PCs and No. 2 for notebooks worldwide.

Acer Incorporated 2008 Annual Report16 Acer Incorporated 2008 Annual Report 17
3.Corporate Governance Principles

Acer Incorporated 2008 Annual Report Acer Incorporated 2008 Annual Report18 19
Corporate Governance Principles
Acer Incorporated 2008 Annual Report Acer Incorporated 2008 Annual Report18 19
3.1 Organization of the Company
3.1.1 Department Functions
Corporate Functions
Auditor‧ Evaluation, planning and improvement of Acer’s
internal operations
CFO & Spokesperson‧ Management of Acer ’s long - term f inance,
investments and is the corporate spokesperson
Corp. Sustainability Office‧ Strategic planning and management in corporate
sustainability, with the aim of fulfilling corporate social responsibilities.
Corporate Strategy Office‧ C onso l i da t i on , management , des ign and
implementation of key global initiatives
IT Products Global Operations‧ Development and management of Acer ’s IT
products and services
Taiwan Operations‧ Sales, marketing and after-sales service of Acer’s
IT products in Taiwan
China Operations‧ Sales, marketing and after-sales service of Acer’s
IT products in China
Pan America Operations‧ Sales, marketing and after-sales service of Acer’s
IT products in Pan America
Asia Pacific Operations‧ Sales, marketing and after-sales service of Acer’s
IT products in Asia Pacific
EMEA Operations‧ Sales, marketing and after-sales service of Acer’s
IT products in Europe, Middle East and Africa
Smart Handheld Business‧ Responsible for global sales, marketing, and
development of the smart handheld business.
Finance PDA Business‧ Development, sales, marketing and customer
service of Finance PDA products
e-Enabling Services Business‧ ICT solutions and services provider, including
informat ion secur i ty management, mobi l i t y applications, software systems development, systems integration, system operation services, value-added business solutions, and Internet data center services
3C Channel Business‧ Channel distribution of non-Acer branded 3C
products in Taiwan
Finance‧ Corporate finance, investment, treasury, credit and
risk control and accounting services management
Human Resources‧ Human resources and organizational strategy
Information Technology‧ Corpora te in fo rmat ion in f ras t r uc tu re and
information systems management
Legal‧ Corporate legal consulting, contracts and patents,
and other intellectual property management
Customer Service‧ Global services strategy and global service center
management
Marketing & Branding‧ Corporate brand management, consolidation and
development of global marketing strategies
Shareholder’s Meeting
CFO & Spokesperson
Corp. Strategy Office
IT ProductsGlobal
Operations
Taiwan Operations
China Operations
Pan America Operations
Asia Pacific Operations
EMEA Operations
Smart Handheld Business
Finance PDA Business
FIinance Human Resources
Information Technology
Legal Customer Service
Marketing & Branding
e-Enabling Services Business
3C Channel Business
Board of Directors Chairman &
Acer Group CEO
CEO & Corp. President
Supervisor
Auditor
Corp. Sustainability Office
Acer Organization Chart

Acer Incorporated 2008 Annual Report Acer Incorporated 2008 Annual Report20 21
Corporate Governance Principles
Acer Incorporated 2008 Annual Report Acer Incorporated 2008 Annual Report20 21
3.2 Information Regarding Board of Directors, Supervisors and Key Managers
(1) Board of Directors and Supervisors (April 21, 2009)
Title Name Date of Election TermShares Held When Elected Shares Held at Present
Shares Held by Spouse & Minors
Education Main Curriculum Vitae
Spouse or Immediate Family Holding Managerial Position
Number Percentage Number Percentage Number Percentage Title NameRelation-
ship
Chairman J.T. Wang 06/13/2008 3 10,806,070 0.45 13,038,161 0.49 204,520 0 Bachelor
• Chairman of HiTRUST.COM Inc.• Chairman of Cross Century Investment• Chairman of Acer Cyber Center Services Inc.• Director of Minly Tech. Corp.• Director of Weblink International Inc.• Director of Acer Investment Inc.
- - -
Director Stan Shih 06/13/2008 3 72,927,824 3.03 74,021,741 2.80 17,514,543 0.66 Master
• Director of Dragon Investment Co., Ltd.• Director of Qisda Corp.• Director of Wistron Corp.• Director of Acer Investment Inc.• Independent director of TSMC Co, Ltd.• Director of Acer SoftCapital• Director of Acer Worldwide Inc.
SupervisorCarolyn
YehWife
Director Gianfranco Lanci 06/13/2008 3 406,925 0.02 969,978 0.04 0 0 Bachelor - - - -
Director Walter Deppeler 06/13/2008 3 0 0 0 0 0 0 Master - - - -
Director Hsin-I Lin 06/13/2008 3 0 0 0 0 0 0 Master
• Independent director of Sinyi Realty Inc.• Independent director of Nan Ya Plastics Co.• Director of Yulon Motor Co, Ltd• Director of China Motor Corp. Co.• Independent director of E.Sun Financial Holdings
Co Ltd
- - -
DirectorPhilip Peng
(Representative of Smart Capital Corp.)
06/13/2008 3 10,974 0 11,138 0 0 0 Master
• Director of Cross Century Investment• Director of Multiventure Investment Inc.• Supervisor of Acer Laboratories Inc.• Supervisor of Aspire Incubation Venture Capital• Supervisor of Wistron Corp.• Supervisor of Apacer Technology Inc.• Director of iDSoftCapital Inc.• Supervisor of Dragon Investment Co., Ltd.• Chairman of Acer Capital Corp.
- - -
DirectorHung Rouan
Investment Corp.06/13/2008 3 66,069,816 2.75 67,060,863 2.54 0 0 - -
Supervisor George Huang 06/13/2008 3 6,102,022 0.25 6,193,653 0.23 1,844,489 0.07 Bachelor
• Director of Apacer Technology Inc.• Independent Supervisor of Les Enphants Ltd.• Independent Supervisor of Mtech Industries Inc• Independent Supervisor of PChome Online Inc• Director of China Productivity Center• Director of Eslite Corp.
- - -
Supervisor Carolyn Yeh 06/13/2008 3 17,255,708 0.72 17,514,543 0.66 74,021,741 2.80 Bachelor• Director of Aspire Incubation Venture Capital• Chairman of iDSoftCapital Inc.• Supervisor of Acer Capital Corp.
Director Stan Shih Husband

Acer Incorporated 2008 Annual Report Acer Incorporated 2008 Annual Report22 23
Corporate Governance Principles
Acer Incorporated 2008 Annual Report Acer Incorporated 2008 Annual Report22 23
Major Institutional Shareholders(April 21, 2009)
Name Name of Major Shareholders Percentage of Shares
Hung Rouan Investment Corp.
Carolyn Yeh 20.13%
Shih Hsuen Rouan Charity Foundation 1.60%
Shih Hsuen Rouan 17.25%
Shih Hsuen Huei 26.09%
Shih Hsuen Lin 17.16%
Shih Fang Cheng 8.93%
Yeh Ting Yu 8.84%
Smart Capital Corp.Philip Peng 66.67%
Jill Ho 33.33%
(2) Key Managers (April 21, 2009)
Title NameDate of
AccessionShares Held Directly
Shares Held by Spouse & Minors
Shares Held by the Other’s Education Main Curriculum Vitae
Spouse or Immediate Family Holding Position as President or
Vice PresidentNumber Percentage Number Percentage Number Percentage Title Name Relationship
CEO of Acer Inc. & Corp. President Gianfranco Lanci 01/01/2005 969,978 0.04 0 0 0 0 Bachelor - - - -
Sr. Corp. VP & EMEA Deputy President
Walter Deppeler 09/29/2007 0 0 0 0 0 0 Bachelor - - - -
Sr. Corp. VP & SHBG PresidentAymar de Lencquesaing
01/01/2009 0 0 0 0 0 0 Bachelor - - -
Sr. Corp. VP & ITGO President Jim Wong 11/01/2001 4,361,812 0.17 0 0 0 0 Master - - - -
Corp. VP & PA President Rudi Schmidleithner 09/29/2007 29,705 0 0 0 0 0 Bachelor - - - -
Corp. VP & AP President Steve Lin 11/01/2001 3,305,497 0.13 0 0 0 0 Bachelor - - - -
Corp. VP & ACCN President Oliver Ahrens 04/01/2009 0 0 0 0 0 0 Bachelor - - -
Corp. VP, Marketing & Branding Gianpiero Morbello 05/01/2008 0 0 0 0 0 0 Bachelor - - - -
Corp. VP & TWN Operation President
Scott Lin 11/01/2001 1,248,264 0.05 7,511 0 0 0 Bachelor • Chairman of Minly Technology Corp.. - - -
Corp. VP & CBG President James Chiang 01/01/2002 1,604,536 0.06 21,944 0 0 0 Bachelor• Chairman of Weblink International Inc. • Director of Lottery Technology Services Corp.• Director of Minly Technology Corp.
- - -
Corp. VP & ETBG President Simon Hwang 09/01/2008 11,250,591 0.43 3,400,428 0.13 0 0 Bachelor
• Director of RoyalTek Co., Ltd.• Director of ETEN Investment Co., Ltd.• Director of PROTEK Investment Co., Ltd.• Director of LITEN Technology Co., Ltd.• Director of TOPTEK Investment Co., Ltd.
- - -
Corp. VP & ACCN President T.Y Lay 11/01/2001 2,532,833 0.10 16,039 0 0 0 Bachelor - - - -
EBG President Ben Wan 05/16/2002 28,840 0 0 0 0 0 Master• Director of Acer Cyber Center Services Inc.• Director of ARC Consultants Ltd.
- - -
CFO Howard Chan 01/19/2000 818,786 0.03 21,226 0 0 0 Master• Chairman of Acer Investment Inc.• Director of Lottery Technology Services Corp.• Director of Cross Century Investment
- - -
VP of ITGO Campbell Kan 03/28/2007 870,821 0.03 8,784 0 0 0 Bachelor - - - -

Acer Incorporated 2008 Annual Report Acer Incorporated 2008 Annual Report24 25
Corporate Governance Principles
Acer Incorporated 2008 Annual Report Acer Incorporated 2008 Annual Report24 25
Title NameDate of
AccessionShares Held Directly
Shares Held by Spouse & Minors
Shares Held by the Other’s Education Main Curriculum Vitae
Spouse or Immediate Family Holding Position as President or
Vice PresidentNumber Percentage Number Percentage Number Percentage Title Name Relationship
VP of ITGO Jackson Lin 02/16/2004 735,185 0.03 7,250 0 0 0 Bachelor - - - -
VP of ITGO Towny Huang 01/01/2008 149,408 0.01 0 0 0 0 Bachelor • Chairman of Lottery Technology Services Corp. - - -
VP of ITGO Wayne Ma 11/01/2008 3,308,585 0.13 684,434 0.03 0 0 Bachelor • Director of RoyalTek Co., Ltd. - - -
VP of TWN Operation Peter Shieh 11/01/2001 855,179 0.03 77,534 0 0 0 Bachelor - - - -
VP of TWN Operation Jafa Lin 07/01/1996 210,938 0.01 0 0 0 0 Bachelor - - - -
VP of EBG Angelina Hwang 09/01/2002 136,778 0 8,891 0 0 0 Bachelor - - - -
VP of EBG Michael Wang 11/01/2008 905 0 0 0 0 0 Bachelor - - - -
VP of TWN Operation Calvin Chang 11/01/2001 155,258 0.01 0 0 0 0 Bachelor
Head of Branch Office PH Wu 01/12/2006 139,121 0 0 0 0 0 Bachelor - - - -
Head of Branch Office Tc Yang 01/12/2006 383,618 0.01 0 0 0 0 Bachelor - - - -
Head of Branch Office YS Shiau 01/12/2006 437,808 0.02 0 0 0 0 Bachelor - - - -
3.3 Corporate Governance Status
3.3.1 Meetings Held by the Board of DirectorsThe Board of Directors held four meetings. The record of their attendances is shown below:
Title NameNo. of Meetings
AttendedNo. of Meetings
Attended by Proxy
Meeting Attendance Rate
(%)Note
Chairman J.T. Wang 4 0 100%
Director Stan Shih 4 0 100%
Director Hung Rouan Investment Corp 4 0 100%
Director Gianfranco Lanci 4 0 100%
Director Walter Deppeler 4 0 100%
DirectorPhilip Peng(Representative of Smart Capital Corp.)
4 0 100%
Director Hsin-I Lin 4 0 100%
3.3.2 Operational Situation of the Audit Committee: Not applicable.
3.3.3 Supervisor’s Participation of Meetings Held by the BoardThe Board of Directors held four meetings. The record of the supervisors’ attendances is shown below:
Title NameNo. of Meetings
AttendedNo. of Meetings
Attended by Proxy
Meeting Attendance Rate
(%)Note
Supervisor Carolyn Yeh 4 0 100%
Supervisor George Huang 4 0 100%
3.3.4 Enforcement of Corporate Governance Implemented by the Company and Reasons for Discrepancy
Items Enforcement Status
Discrepancy between the corporate governance principles implemented by the Company and the Principles, and the reason for discrepancy
A. The ownership structure and shareholders' rights
a. The handling of the shareholders’ proposals and disputes
The Company has designated the Office of Shareholders’ Affairs to handle the shareholders’ proposals and disputes.
No discrepancy
b. Information held on the identities of major shareholders and their ultimate controlling persons
The Company holds information on the identities of major shareholders and their ultimate controlling persons.
No discrepancy
c. The establishment of risk control mechanism and firewalls with affiliates
The Company has established the appropriate risk control mechanism and firewalls according to internal rules such as rules of supervision over subsidiaries, rules governing endorsement and guarantee, and the rules governing acquisitions and dispositions of assets etc.
No discrepancy
B. The composition and duties of Board of Directors
a. The election of independent directors
The composition of the Board has been taken into considerations on the business needs and operations of the Board. The Articles of Incorporation has been amended to elect independent directors, which should be followed in future elections.
No discrepancy

Acer Incorporated 2008 Annual Report Acer Incorporated 2008 Annual Report26 27
Corporate Governance Principles
Acer Incorporated 2008 Annual Report Acer Incorporated 2008 Annual Report26 27
Items Enforcement Status
Discrepancy between the corporate governance principles implemented by the Company and the Principles, and the reason for discrepancy
b. The regular evaluation of the independence of CPA
The evaluation of the CPA is one of the main duties of the Financial Statement and Internal Control Review Committee
No discrepancy
C. The establishment of communication channels with stakeholders
The Company has established the appropriate communication channels with suppliers, buyers, banks, investors and other stakeholders.
No discrepancy
D. The disclosure of information
a. The utilization of website to disclose the information on finance, operations and corporate governance
The Company has set up a website containing the information regarding its finance and operations. The Company also discloses the enforcement of corporate governance in the shareholders’ meeting and other institutional investor meetings.
No discrepancy
b. Others means of disclosing information
The Company has one chief speaker, one acting speakers and designated team to be responsible for gathering and disclosing the information.
No discrepancy
E. The establishment and enforcement of Nomination and Compensation Committee and other Functional Committees
The Company has established a Compensation Committee
No discrepancy
F. If the Company has implemented the corporate governance principles according to TSE Corporate Governance Best-Practice Principles, please identify the discrepancy between your principles and their implementation:
‧ Not applicable.
G. Other important information that may facilitate better understanding of the status of corporate governance (e.g. human rights, employee rights, investors relationships, the relationship with suppliers, interested parties' rights, D&O liabilities insurance, and such):‧ The Company has actively participated in community or charitable activities such as:
1. sponsoring sport and literature/arts events,2. sponsoring the Council of Agriculture for Production Resume Scheme though assisting the use of IT products in remote
districts.3. organizing the Acer Volunteer Team to take good care of disadvantaged children.
‧ The Company has set up an exclusive web site for the new labor pension system containing information for employees regarding the laws and regulations, and to offer assistance.
‧ In addition to the training courses required by authorities, the Company has held related training courses for members of the Board
‧ The Company clearly sets forth in the rules for the proceedings of Board meetings, that a director shall voluntarily abstain from voting on a proposal involved with his/her own interests.
‧ The Chairman of the Company does not act as the President, and both of them are not spouses or relatives within one degree of kinship.
‧ The Company has purchased liability insurance for directors and officers.
3.3.5 Statement of Internal Control System
Date: March 31, 2009
Based on the findings of a self-assessment, Acer Incorporated (hereinafter, the “Company”) states the following with regard to its internal control system during the period from January 1, 2008 to December 31, 2008:
1. The Company is fully aware that establishing, operating, and maintaining an internal control system are the responsibility of its Board of Directors and managers. The Company has established such a system aimed at providing reasonable assurance regarding the achievement of objectives in the following categories: (1) effectiveness and efficiency of operations (including profitability, performance, and safe-guarding of assets), (2) reliability of financial reporting, and (3) compliance with applicable laws and regulations.
2. An internal control system has inherent limitations. No matter how perfectly designed, an effective internal control system can provide only reasonable assurance of accomplishing the three objectives mentioned above. Moreover, the effectiveness of an internal control system may be subject to changes of environment or circumstances. Nevertheless, the internal control system of the Company contains self-monitoring mechanisms, and the Company promptly takes corrective actions whenever a deficiency is identified.
3. The Company evaluates the design and operating effectiveness of its internal control system based on the criteria provided in the “Regulations Governing Establishment of Internal Control Systems by Public Companies” promulgated by the Securities and Futures Bureau of the Financial Supervisory Commission (hereinafter, the “Regulations”). The criteria adopted by the Regulations identify five constituent elements of internal control based on the process of management control: (1) control environment, (2) risk assessment, (3) control activities, (4) information and communication, and (5) monitoring. Each constituent element further contains several items. Please refer to the Regulations for details.
4. The Company has evaluated the design and operating effectiveness of its internal control system according to the aforesaid criteria.
5. Based on the findings of the evaluation mentioned in the preceding paragraph, the Company believes that, during the year 2008, its internal control system (including its supervision of subsidiaries), as well as its internal controls to monitor the achievement of its objectives concerning operational effectiveness and efficiency, reliability of financial reporting, and compliance with applicable laws and regulations, were effective in design and operation, and reasonably assured the achievement of the achievement of the above-stated objectives.
6. This Statement will be an essential content of the Company’s Annual Report for the year 2008 and Prospectus, and will be publicly disclosed. Any false-hood, concealment, or other illegality in the content made public will entail legal liability under Articles 20, 32, 171, and 174 of the Securities and Exchanged Act.
7. This Statement has been passed by the Board of Directors in their meeting held on March 31, 2009, with none of the 7 attending directors expressing dissenting opinions, and the remainder all affirming the content of this Statement.
Acer Incorporated
Chairman of the Board of Directors CEO of Acer Inc. & Corp. President

Acer Incorporated 2008 Annual Report Acer Incorporated 2008 Annual Report28 29
Corporate Governance Principles
Acer Incorporated 2008 Annual Report Acer Incorporated 2008 Annual Report28 29
3.3.6 Resolutions of the General Shareholder’s Meeting and the Meeting of the Board of DirectorsResolutions of the General Shareholder’s Meeting and the Meeting of the Board of Directors
Date Meeting Major ResolutionsMar 3, 2008 First 2008 Special
BOD MeetingI. To Enter a Share Exchange Agreement with E-ten Information Systems Co. Ltd. (E-ten ) II. The New Issuance of Common Shares Through Capital Increases for the Share Exchange III. To Purchase the Common Shares of E-ten from the Stock Market
Mar 27, 2008 First 2008 BOD Meeting
I. The FY2007 Financial Statements and Business Report II. The Election of Acer’s Board of Directors and SupervisorsIII. Amendments to Acer’s “Articles of IncorporationIV. Amendments to Acer’s “Procedures of Acquiring or Disposing of Assets”V. To Release the Non-competition Restriction of Acer’s Board of DirectorsVI. The Agenda and Logistics of 2008 General Shareholder’s Meeting VII. The Appointment of the Auditors of Acer Inc. VIII. Acer’s Statement of Internal Control System for 2007IX. To Endow Gianpiero Morbello, the Incumbent Head of Marketing and Branding Unit, with
the Title of Corporate Vice President.
Apr 23, 2008 Second 2008 BOD Meeting
I. The First Quarter of FY2008 Non-consolidated and Consolidated Financial StatementsII. The Proposal for Distribution of FY2007 Retained EarningsIII. The New Issuance of Common Shares through Capital IncreasesIV. Amendments to Acer’s “Articles of Incorporation”V. “The Procedure of Proxy Statistic Verification”
May 2,2008 Second 2008 Special BOD Meeting
I. The Approve Taking Necessary Legal Actions against Keypoint regarding Keypoint Would Infringe Acer Incorporated’s Trademark Rights in Malaysia.
II. To Approve Amendments to Acer’s Foreign Exchange Risk Management Policy and Guidelines.
III. To Approve Amendments to Acer’s Articles of Incorporation.IV. To Approve Issuance of Discounted Employee Stock Options and Acer Incorporated 2008
Discounted Employee Stock Option PlanV. To Amend the Convene Issue of the Company’s 2008 General Shareholder’s Meeting
Jun 13, 2008 Third 2008 Special BOD Meeting
I. To Elect The Chairman of Acer IncorporatedII. To Approve Amendments to Criteria for Authorities of Assents Management and Handling
CommitteeIII. To Elect The Members of Acer’s Assets Management and Handling Committee,
Compensation Committee, and Financial Statement and Internal Control Review Committee
IV. To Endow Mr. Gianfranco Lanci with the title of Acer Inc. CEO & Corporate PresidentV. To Endow Chairman, Mr. J.T. Wang with the title of Acer Group CEO, concurrentlyVI. To Approve the Ex-dividend and Ex-right DateVII. The Ratio of Share Exchange Between Acer and E-Ten (Acer : E-Ten=1 : 1.07)VIII. To Amend the Date of Share Exchange between Acer and E-TenIX. To Sell out All the Common Shares of Apacer Technology Inc
Aug 28, 2008 Third 2008 BOD Meeting
I. The First Half of FY2008 Financial StatementII. Amendments to Acer Incorporated 2008 Employee Stock Option Plan III. Amendments to Regulations Governing Procedure for Board Directors MettingsIV. To Approve Acer’s Regulations Governing Shareholder ServicesV. To Endow Mr. Aymar de Lencquesaing the President of Smart Handheld Business Group,
with the Title of Senior Corporate Vice PresidentVI. To Appoint Mr.Simon Hwang as the President of ET Business Group along with the Top
Manager of the New Business Concurrently and to Endow Mr.Hwang with the Title of Corporate Vice President
VII. The Budget of Donation to Acer Foundation for Sponsoring Pubic Activities
Date Meeting Major ResolutionsOct 31, 2008 Fourth 2008 BOD
MeetingI. The Third Quarter of FY2008 Financial StatementsII. To Issue 14,000 units of Acer Incorporated 2008 Employee Stock Option III. To Decide the Effective Date of the New Issued Shared for the Execution of E-ten
Employee Stock Option IV. To Proposed to Invest in FUHU,INC., through Acer Inc. Subsidiaries and AffiliatesV. To Participate in the Re-construction Project of Oriental Technopolis Building A&B Located
in Hsichih, TaipeiVI. The Appoint Mr. Wayne Ma as the Vice President of Smart Handheld Business UnitVII. To Promote Mr. Michael Wang as the Vice President of Commercial Software Business Unit
Dec 18, 2008 Fourth 2008 Special BOD Meeting
I. Acer’s 2009 Annual Audit PlanII. To Acquire Trademarks Currently Owned by Gateway US Retail, Inc. and Packard Bell B.V.III. It’s Proposed a Total Accrual of NT$1,500,000,000 as the FY2008 Employee Bonus
Mar 31,2009 First 2009 BOD Meeting
I. The FY2008 Financial Statements and Business ReportII. Amendments to Acer’s “Procedures Governing Lending of Capital to Others”III. Amendments to Acer’s “Procedures Governing Endorsement and Guarantee”IV. The Agenda and Logistics of 2009 General Shareholder’s MeetingV. The Appointment of the Auditors of Acer Inc. VI. Acer’s Statement of Internal Control System for 2008VII. To Decide the Effective Date of New Issued Shares for the Execution of E-ten Employee
Stock OptionVIII. To Remove Mr. T.Y. Lay from Acer Management TeamIX. To Appoint Mr. Oliver Ahrens as the President of Acer China Operations, and to Endow
him with the Title of Corporate Vice President
Implementation of Resolutions in 2008 General Shareholder’s Meeting
Major Resolutions Carries out the situation1. To accept the 2007 Financial Statements and Business Report Approved by 2008 General Shareholder’s Meeting
2. To approve the proposal for distribution of 2007 profits Has distributed stock and cash dividends to the shareholders on August 15, 2008.
3. To approve the New Issuance of Common Shares through Capital Increases
Has amended the capital’s registration to the Ministry of Economic Affairs
4. To approve the Company’s proposal to merge E-TEN Information Systems Co., Ltd. as its wholly-owned subsidiary by stock exchange and issuing new shares.
Has amended the registration to the Ministry of Economic Affairs
5. To approve amendments to the Articles of Incorporation Has amended Acer’s Article of Incorporated to the Ministry of Economic Affairs
6. To approve issuance of discounted Employee Stock Option Approved by 2008 General Shareholder’s Meeting
7. To approve amendments to Acer’s “Procedures of Acquiring Or Disposing of Assets”
Approved by 2008 General Shareholder’s Meeting
8. To approve amendments to Acer’s “Foreign Exchange Risk Management Policy and Guidelines”
Approved by 2008 General Shareholder’s Meeting
9. To release the non-competition restriction of a board of director elected as an individual or as a legal representative
To release the non-competition restriction of Acer’s new 7 members of the board of directors and 2 members of supervisors

Acer Incorporated 2008 Annual Report30 Acer Incorporated 2008 Annual Report 31
4.Capital and Shares

Acer Incorporated 2008 Annual Report Acer Incorporated 2008 Annual Report32 33
Capital and Shares
Acer Incorporated 2008 Annual Report Acer Incorporated 2008 Annual Report32 33
4.1 Sources of the Capital
4.1.1 Sources of the Capital (April 21, 2009) Unit: Share/NT$ Thousand
DatePrice of
IssuanceAuthorized Common stock Paid-in Common stock Notes
Shares Value Shares Value Source of the capital
April,2009 Share/NT$10 3,500,000,000 35,000,000 2,642,982,993 26,429,830
Unit: Share
Shares CategoryAuthorized capital
NotesIssued shares Non-issued Total
Common shares 2,642,982,993 857,017,007 3,500,000,000
4.1.2 Shareholding Structure (April 21, 2009)
Category/NumberGovernment
InstitutionFinancial Institution
Other Institution IndividualFINI and Foreign
InvestorsTotal
No. of Shareholders 19 31 673 304,748 1,272 306,743
Shares 173,269,174 35,195,183 298,069,491 1,022,368,583 1,114,080,562 2,642,982,993
Percentage 6.56% 1.33% 11.28% 38.68% 42.15% 100.00%
4.1.3 The Distribution of Shareholdings (April 21, 2009)
Category No. of Shareholders Shares Percentage
1 ~ 999 161,687 52,264,493 1.977%
1,000 ~ 5,000 108,926 231,996,525 8.778%
5,001 ~ 10,000 19,637 135,499,093 5.127%
10,001 ~ 15,000 6,776 79,792,333 3.019%
15,001 ~ 20,000 2,806 48,441,115 1.833%
20,001 ~ 30,000 2,598 61,991,711 2.346%
30,001 ~ 50,000 1,734 65,920,573 2.494%
50,001 ~ 100,000 1,155 79,631,458 3.013%
100,001 ~ 200,000 505 69,801,481 2.641%
200,001 ~ 400,000 342 96,360,504 3.646%
400,001 ~ 600,000 166 81,629,152 3.089%
600,001 ~ 800,000 79 55,324,451 2.093%
800,001 ~ 1,000,000 58 51,599,391 1.952%
1,000,001 and above 274 1,532,730,713 57.992%
Total 306,743 2,642,982,993 100.000%
4.1.4 The List of Major Shareholders (April 21, 2009)
ItemName
Shares Percentage
National Financial Stabilization Fund 74,850,000 2.83%
Stan Shih 74,021,741 2.80%
Hong Rong Investment Corp. 67,060,863 2.54%
Management Board of Public Service Pension Fund 52,154,978 1.97%
Acer Incorporated Global Depositary Receipt 51,659,897 1.95%
Government of Singapore Fund 43,142,880 1.63%
Saudi Arabian Monetary Agency 36,790,290 1.39%
JPMorgan Chase Bank N.A. Taipei Branch in custody for Capital World Growth and Income Fund Inc.
31,753,338 1.20%
Capital Income Builder, Inc. 31,631,866 1.20%
Bureau of Labor Insurance 30,051,891 1.14%
4.1.5 Market Price Per Share, Net Value, Earning& Dividend For Latest Two Years
Unit: NT$
PeriodItem
2007 2008Until Mar. 31st,
2009
Market Price Per Share
Highest 75.96 70.20 51.00
Lowest 53.59 39.75 39.65
Average 62.35 55.51 45.48
Net Value Per Share
Before Distribution 32.49 31.70 32.99
After Distribution 28.55 Un-appropriated Un-appropriated
Earning Per Share
Weighted Average Share Numbers2,432,594 2,487,238 2,596,619
Thousand shares Thousand shares thousand shares
Earning Per ShareCurrent 5.48 4.72 0.78
Adjusted 5.33 Un-appropriated Un-appropriated
Dividend Per Share
Cash Dividend (NT$) 3.6 2
Un-appropriatedStock Dividend
Retained Earning (%) 0.15 0.1
Capital Surplus (%) - -
Accumulated Unpaid Dividends - - -
Return on Investment Analysis
P/E Ratio 11.70 11.76 -
P/D Ratio 17.32 27.76 -
Cash Dividend Yield 5.77% 3.60% -
Acer Incorporated 2008 Annual Report Acer Incorporated 2008 Annual Report34 35
Capital and Shares
Acer Incorporated 2008 Annual Report Acer Incorporated 2008 Annual Report34 35
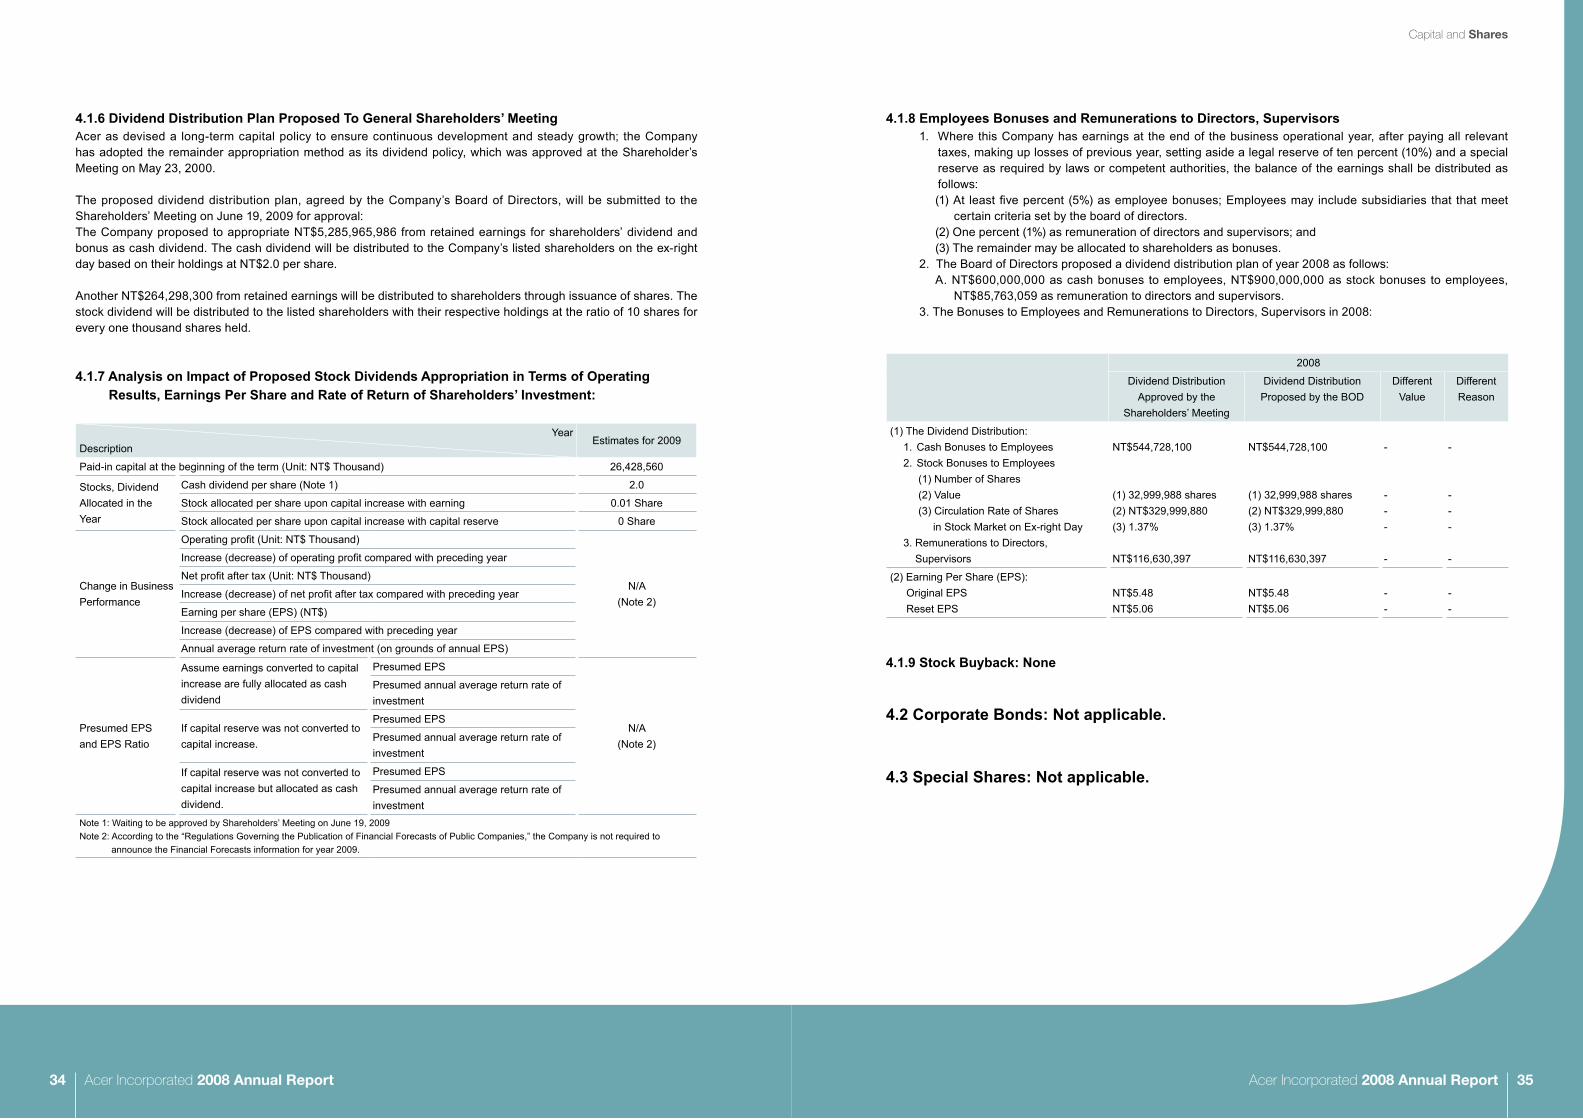
4.1.6 Dividend Distribution Plan Proposed To General Shareholders’ MeetingAcer as devised a long-term capital policy to ensure continuous development and steady growth; the Company has adopted the remainder appropriation method as its dividend policy, which was approved at the Shareholder’s Meeting on May 23, 2000.
The proposed dividend distribution plan, agreed by the Company’s Board of Directors, will be submitted to the Shareholders’ Meeting on June 19, 2009 for approval:The Company proposed to appropriate NT$5,285,965,986 from retained earnings for shareholders’ dividend and bonus as cash dividend. The cash dividend will be distributed to the Company’s listed shareholders on the ex-right day based on their holdings at NT$2.0 per share.
Another NT$264,298,300 from retained earnings will be distributed to shareholders through issuance of shares. The stock dividend will be distributed to the listed shareholders with their respective holdings at the ratio of 10 shares for every one thousand shares held.
4.1.7 Analysis on Impact of Proposed Stock Dividends Appropriation in Terms of Operating Results, Earnings Per Share and Rate of Return of Shareholders’ Investment:
YearDescription
Estimates for 2009
Paid-in capital at the beginning of the term (Unit: NT$ Thousand) 26,428,560
Stocks, Dividend Allocated in the Year
Cash dividend per share (Note 1) 2.0
Stock allocated per share upon capital increase with earning 0.01 Share
Stock allocated per share upon capital increase with capital reserve 0 Share
Change in Business Performance
Operating profit (Unit: NT$ Thousand)
N/A(Note 2)
Increase (decrease) of operating profit compared with preceding year
Net profit after tax (Unit: NT$ Thousand)
Increase (decrease) of net profit after tax compared with preceding year
Earning per share (EPS) (NT$)
Increase (decrease) of EPS compared with preceding year
Annual average return rate of investment (on grounds of annual EPS)
Presumed EPS and EPS Ratio
Assume earnings converted to capital increase are fully allocated as cash dividend
Presumed EPS
N/A(Note 2)
Presumed annual average return rate of investment
If capital reserve was not converted to capital increase.
Presumed EPS
Presumed annual average return rate of investment
If capital reserve was not converted to capital increase but allocated as cash dividend.
Presumed EPS
Presumed annual average return rate of investment
Note 1: Waiting to be approved by Shareholders’ Meeting on June 19, 2009Note 2: According to the “Regulations Governing the Publication of Financial Forecasts of Public Companies,” the Company is not required to
announce the Financial Forecasts information for year 2009.
4.1.8 Employees Bonuses and Remunerations to Directors, Supervisors1. Where this Company has earnings at the end of the business operational year, after paying all relevant
taxes, making up losses of previous year, setting aside a legal reserve of ten percent (10%) and a special reserve as required by laws or competent authorities, the balance of the earnings shall be distributed as follows:(1) At least five percent (5%) as employee bonuses; Employees may include subsidiaries that that meet
certain criteria set by the board of directors. (2) One percent (1%) as remuneration of directors and supervisors; and(3) The remainder may be allocated to shareholders as bonuses.
2. The Board of Directors proposed a dividend distribution plan of year 2008 as follows:A. NT$600,000,000 as cash bonuses to employees, NT$900,000,000 as stock bonuses to employees,
NT$85,763,059 as remuneration to directors and supervisors.3. The Bonuses to Employees and Remunerations to Directors, Supervisors in 2008:
2008
Dividend Distribution Approved by the
Shareholders’ Meeting
Dividend Distribution Proposed by the BOD
Different Value
Different Reason
(1) The Dividend Distribution:1. Cash Bonuses to Employees2. Stock Bonuses to Employees
(1) Number of Shares(2) Value(3) Circulation Rate of Shares in Stock Market on Ex-right Day
3. Remunerations to Directors, Supervisors
NT$544,728,100
(1) 32,999,988 shares (2) NT$329,999,880(3) 1.37%
NT$116,630,397
NT$544,728,100
(1) 32,999,988 shares (2) NT$329,999,880(3) 1.37%
NT$116,630,397
-
---
-
-
---
-
(2) Earning Per Share (EPS): Original EPS Reset EPS
NT$5.48NT$5.06
NT$5.48NT$5.06
--
--
4.1.9 Stock Buyback: None
4.2 Corporate Bonds: Not applicable.
4.3 Special Shares: Not applicable.

Acer Incorporated 2008 Annual Report Acer Incorporated 2008 Annual Report36 37
Capital and Shares
Acer Incorporated 2008 Annual Report Acer Incorporated 2008 Annual Report36 37
4.4 Global Depository Receipts (GDRs) Issuance (March 31, 2009)
Date of issuanceDescription
November 1,1995 July 23, 1997
Date of issuance November 1,1995 July 23, 1997
Location of issuance and transaction London London
Total amount of issuance US$220,830,000 US$160,600,000
Unit price of issuance US$32.475 US$40.15
Total number of units issued 6,800,000units 4,000,000units
Sources of valuable securities demonstrated
Capital increased in cash Capital increased in cash
Number of valuable securities demonstrated
Each unit stands for Acer’s 5 common shares
Each unit stands for Acer’s 5 common shares
Rights and obligations of GDR holders Same as Acer’s common shareholders Same as Acer’s common shareholders
Consignee None None
Depository organization Citicorp Citicorp
Custodian organization Citibank Taipei Branch Citibank Taipei Branch
Balance not retrieved9,927,667 units of Global Deposit Receipt as representing
49,638,422 shares of common stocks
Method to allocate fees incurred during the period of issuance and existence
The expenses incurred by issuance being taken to offset premium reserve. Expenses incurred during existence being taken as expenses of the current term.
The expenses incurred by issuance being taken to offset premium reserve. Expenses incurred during existence being taken as expenses of the current term.
Any key issue for the depository and custodian agreements
None None
Market Price Per
Share
2008
Highest US$11.50
Lowest US$ 5.95
Average US$ 8.86
Until Mar. 31th, 2009
Highest US$ 7.55
Lowest US$ 5.94
Average US$ 6.65
4.5 Employee Stock Options: (March 31, 2009)
Employee Stock Option Granted First Grant of 2008
Approval Date by the Authority September 15, 2008
Grant Date November 03, 2008
Number of Options Granted 14,000 units
Percentage of Shares Exercisable to Outstanding Common Shares (%)
0.5297
Option Duration 3 years
Source of Option Shares new Common stocks
Vesting ScheduleFrom the 2nd anniversary of the grant date, except that all or partial options revoked by the company, 100% vested options can be exercised without conditions
Shares Exercised 0
Value of Shares Exercised NT$ 0
Shares Unexercised 14,000,000 shares
Adjusted Exercise Price Per Share NT$ 25.28
Percentage of Shares Unexercised to Outstanding Common Shares (%)
0.52975
Impact on Shareholders’ Equity Dilution to Shareholders’ Equity is limited.
4.6 Issuance of New Shares Due to Company’s Mergers and Acquisitions:
4.6.1 Underwriter’s Opinion for the Mergers and Acquisitions1. Underwriter’s Opinion of the Impact of Acer’s Operating Business, Financial Aspect and Stock Holders’ Equity
(1) Impact of Acer’s Operating Business after Acquisition Acer ranked among the world’s top five PC vendors, and E-ten was a leading vendor of smart handheld devices.
The merger of the two companies was anticipated to expand Acer’s product offering and client base, and increase sales.
When E-ten became a wholly-owned subsidiary of Acer and merged its R&D resources, the launch of Acer branded smartphones in Q4 2008 immediately enhanced our product offering in the mobile Internet device (MID) market segment.
In Q4 2008, smartphone sales increased to NT$110.24 billion, representing 10.69% on-year growth. This significant increase goes to prove the new synergies that were expected, in terms of expanded product offering and client base.
(2) Financial Impact on Acer after Acquisition The acquisition of E-ten not only benefited Acer in terms of technology in the MID segment, but also enhanced
our scale of procurement. With the greater scale, Acer was able to negotiate better costs and reflect the savings in our product competitiveness.
On the balance sheet, Acer issued 168,158,878 new shares for this acquisition, and increased long term investments by NT$8.7 billion. Growth in the Q4 2008 sales again shows the acquisition has increased Acer’s profitability.
(3) Influence on Stockholders’ Equity after Acquisition As for stockholder’s equity, Acer issued 168,158,878 new shares in exchange for 179,930,000 E-ten shares;
hence Acer’s long term investment increased by NT$8.7 billion and then increase its book value per share. Overall, the acquisition has a positive impact on Acer stockholder’s equity.
(4) Evaluation of the Acquisition The date of Acer’s and E-ten’s share conversion was September 1, 2008, and the Company has issued the
shares and registered on October 14, 2008. After this acquisition, both sides will gain better purchasing bargaining power through Acer’s supply chain and reduce the overall purchase cost so that the company can increase its stockholder’s equity and profitability. Both sides also can enhance company’s competitiveness and profitability by sharing resources of financial, business, channels, purchasing, R&D and Acer’s global brand image. It’s foreseen that the coalition synergy will gradually emerge.
2. Execution Update and Impact of Acer’s Stock Holders’ Equity of the Unachieved Goals: Not applicable.
4.6.2 Resolutions of Mergers and Acquisitions in the Meeting of the Board of Directors in the Previous Year: None

Acer Incorporated 2008 Annual Report38 Acer Incorporated 2008 Annual Report 39
5.Acer’s Winning Formula

Acer Incorporated 2008 Annual Report Acer Incorporated 2008 Annual Report40 41
Acer’s Winning Formula
Acer Incorporated 2008 Annual Report Acer Incorporated 2008 Annual Report40 41
Appendix
1. Key Buyers and Suppliers Accounting Over 10% of Total Net Sales and Purchase:(1) Key Buyers for Acer Inc. (Parent Company)
Unit: NT$ Thousand
Item
Year 2007 Year 2008
From AmountPercentage of total net sales (%)
Relationship with Acer Inc.
From AmountPercentage of total net sales
(%)
Relationship with Acer Inc.
1 AEG 156,272,182 49 (Note 1) AEG 175,166,900 42 (Note 1)
2Acer
America53,157,861 17 (Note 1)
Acer America
77,740,860 19 (Note 1)
3 AAPH 0 0 (Note 1) AAPH 39,997,623 10 (Note 1)Note 1: Subsidiary of the Company.
(2) Key Suppliers for Acer Inc. (Parent Company) Unit: NT$ Thousand
Item
Year 2007 Year 2008
From AmountPercentage of total net purchase (%)
Relationship with Acer Inc.
From AmountPercentage of total net purchase (%)
Relationship with Acer Inc.
1 Supplier A 108,314,055 23 none Supplier A 132,799,596 20 none
2 Supplier B 64,575,335 13 (Note 2) Supplier B 80,334,992 12 none
3 Supplier C 51,409,143 11 noneNote 2: Investee of the Company
2. Production Value in the Most Recent Two Years: Not applicable.
5.3 Employees
5.3.1 Global Human Asset ManagementEmployees are the Company’s key assets and the main driver of business growth. Acer has fostered a work environment that empowers employees by entrusting them with the tasks matched to their skill or qualification. There are clear objectives and reward for achievement, extensive communication and interaction among coworkers, constant encouragement for innovations, and an effective decision making process. On-the-job training provides the ideal platform for learning and development.
As a result of employees’ joint effort, Acer has received numerous industry and media recognition. For example, Acer was voted by Reader’s Digest readers as a “Trusted Brand” in Asia for 10 consecutive years from 1999~2008; in 2006, Acer was honored for excellent service standards by Taiwan’s renowned business magazine – CommonWealth; in 2007 Forbes selected Acer as one of the “Fabulous 50” – a list of the best of Asia-Pacific’s biggest listed companies; also in 2007, we achieved our goal of becoming the world’s No. 3 PC vendor.
5.1 Acer’s Winning FormulaSince the Company’s inception in 1976, Acer has grown to become the world’s No. 3 vendor for Total PCs and No.2 for notebooks. Focusing on research and development, marketing, sales and after-services of IT and communications devices, Acer’s range of product offering includes notebooks, desktop PCs, LCD monitors, projectors, servers, and smartphones. Under the Acer Group umbrella consists of four brands – Acer, Gateway, Packard Bell and eMachines. In 2008, the consolidated financial results showed revenues of NT$546.27B (US$16.65B) and the operating income of NT$14.07B (US$428.8M).
In the past five years, Acer has demonstrated a strong growing momentum in global PC shipments; our annual growth rate was more than twice the industry average and far surpassed the top PC players. According to the 2008 global PC shipment data by Gartner Dataquest, Acer’s growth of 55.2% year-on-year was the highest among the top 3 vendors.
The successful mergers of Gateway (2007) and Packard Bell (2008) together complete Acer’s global footprint by strengthening our presence in the U.S. and allowing a deeper penetration into the European and Asian markets. These acquisitions also marked the beginning of a new era for Acer with a multi-brand strategy to target different geographic- and consumer segments. In 2008 Acer also acquired E-ten; a decision that reflects our anticipation of an accelerating convergence between PC and handheld communication devices over the next few years.
5.2 The Five Keys to a Sustainable Future
5.2.1 Multi-brand StrategyThe PC is becoming a commodity. Aware of the vast diversity among consumer tastes, a single brand cannot cover the preferences of all market segments. Acer saw the opportunity to adopt a multi-brand strategy by acquiring Gateway and Packard Bell. The results so far have assured us the multi-brand approach was and is the right response to an ever-changing market. In just over a year, Acer has set up a global multi-brand management framework, and launched differentiated product designs to precisely target all major market segments.
5.2.2 Sustainable and Profitable Business ModelAcer adheres to a channel business model that involves collaboration with first-class suppliers and distributors, leveraging their resources and ultimately, sharing the fruits of success among all partners. Besides, our low capital- and operating expense policy has been beneficial to the steady growth of our business operations.
5.2.3 Efficient Global OperationsBased upon the management philosophy of upholding a “simple” and “focused” approach, Acer spun off the manufacturing operations in 2000 to concentrate all resources on building its brand name business. Our top management from product development, marketing and the regions gather on a regular basis to discuss key issues. This practice ensures clear understanding and smooth internal communication, which lead to efficient decision making followed by accurate implementation. In addition, Acer has a flexible and dynamic global logistics network to ensure time-to-market delivery of our products.
5.2.4 End-to-End Marketing StrengthsTo begin with, our products are designed around customer needs – that means understanding exactly what our customers want, and using our knowledge and skills to exceed their expectations by making technology simple to use, stylish to own and accessible to everyone. Combined with Acer’s fast decision making, call to action and timely release of products to market, to form an end-to-end marketing prowess that ensures continuing business success ahead.
5.2.5 Growth and ScaleThe recent mergers and combined scales have already created new synergies as predicted. With remarkable growths in revenue, operating income and market share worldwide, Acer is today more competitive than ever.

Acer Incorporated 2008 Annual Report Acer Incorporated 2008 Annual Report42 43
Acer’s Winning Formula
Acer Incorporated 2008 Annual Report Acer Incorporated 2008 Annual Report42 43
Summary of Acer’s Workforce (Figures in 2007 excludes 787 employees from Gateway):
-By Manpower, Age and Years of Service
DateCategory
December 2007 December 2008 February 2009
Manpower 5,251 6,727 6,877
Average Age 37.3 37.5 37.6
Average Years of Employment 6.6 7.1 7.1
-By Job Function
DateJob Function
December 2007 December 2008 February 2009
General Management 136 157 157
Sales & Product Marketing 1,423 1,857 1,927
Customer Service 2,287 2,710 2,761
Research & Development 198 510 527
Sales Support 707 872 883
Administrations 500 621 622
Total 5,251 6,727 6,877
- By Education Level
DateEducation Level
December 2007 December 2008 February 2009
Doctor of Philosophy 0.3% 0.2% 0.2%
Master’s Degree 18.5% 19.0% 19.2%
Bachelor’s Degree 42.2% 43.7% 43.7%
Vocational Study 33.2% 31.7% 31.6%
Senior High School Below 5.8% 5.4% 5.3%
Total 100% 100% 100%
5.3.2 RecruitmentThe Company abides to each country’s labor laws and customs. We are committed to providing equal opportunities and prohibit discrimination against candidates in regards to their ethnic origin, gender, age, religion or nationality. Acer seeks high-potential candidates with multi-disciplinary backgrounds in order to build a strong global workforce.
5.3.3 Acer Employee ManagementTo assure business growth on a healthy and comprehensive management system, the mutual rights and obligations between the Company and employees are explicitly specified as follows:
‧ Authority ManagementAccording to the levels of management responsibilities, “The Table of Authority Approval,” “Regulations on Delegated Deputy”, and the “Scheme of Job Categories and Titles” are regulated to assure well-functioning in all layers of directive operations, and furthermore, to provide staff with a sound blueprint for career development paths.
‧ Acer Employee Code of Conduct 1. Emphasize on both customer rights and Company interests, and put pragmatic consideration of economic
factors during policy making.2. Do not argue with customers and attentively work to resolve customer complaints.3. Do not reveal customer or Company secrets.4. Strive to protect the company’s physical and intangible assets.5. Actively work to uphold the Company’s reputation and refrain from deleterious behavior.6. Clearly understand and respect the scope of authority given, and do not autonomously override these
parameters.7. Avoid involvement in any behavior or act that could pose a conflict of interest with your personal affairs and
the Company’s interests; if this occurs then these matters should be disclosed accordingly.8. Do not utilize your professional authority to accept personal bribes or kickbacks.9. Do not utilize the Company’s computer network system to carry out inappropriate acts.10. Do not engage in illegal or inappropriate activities.
‧ Sexual Harassment Prevention MeasuresThe Company is dedicated to ensuring sex equality and human dignity in workplace, securing working environment free from sexual harassment and discrimination. With the promise, the Prevention Measures and Disciplinary Actions on Sexual Harassment were enacted, which specify the reporting channels, dealing procedures, and disciplines.
‧ Declaration of Secrecy and Intellectual Property RightsThe Company places extreme importance on the protection of intellectual properties rights. All staff are required to sign the Declaration on Non-Disclosure Agreement on joining the Company, which declares the obligations to protect confidential information and the restrictions on use of the confidential information during the employment period and employment termination.
5.3.4 Training and DevelopmentAcer has created an employee training system that encourages people development and assists with career planning. People from diversified fields of profession are developed by means of on-the-job training, job rotation and overseas assignments, and comprehensive training modules, with an aim to aligning mindset and strengthening core competencies as well as managerial skills.
1. Managerial Training: Managers are trained to think strategically, to strictly enforce rules, be proficient in problem analysis and solving – creatively and efficiently.
2. Professional Training: The specialized function staff is advanced to have cutting-edged knowledge, with emphasis on branding management, marketing, supply chain management, and process leveraged.
3. General Education: Guided by Acer’s Core Values, the design of training calls attention to the fast, efficient, and innovative actions, and value-creating, customer-centric, caring, and ethical pillars of belief.
5.3.5 WelfareThe Company abides to each country’s labor laws and customs, and aims to provide a comfortable working environment along with competitive fringe benefits to enhance productivity and creativity. Taking Taiwan for example, Acer has established a welfare committee that initiates activities for employees’ well being. Besides conforming to labor regulations, the Company provides group medical insurance and educational grants, in addition to arranging family outings, internal social clubs, domestic and overseas holiday breaks, gift vouchers, and such.
5.3.6 Salary & RetentionAcer provides a competitive salary package to attract and retain high-potential human assets. The Company surveys global IT companies’ salary levels annually, to ensure that our salary packages are adjusted accordingly and reasonably to reflect market conditions. On top of the monthly salary, the Company offers a bonus that

Acer Incorporated 2008 Annual Report Acer Incorporated 2008 Annual Report44 45
Acer’s Winning Formula
Acer Incorporated 2008 Annual Report Acer Incorporated 2008 Annual Report44 45
measures both the division’s and employee’s performances. Taking Taiwan for example, in addition to the fixed monthly salary and festival bonuses, Acer offers incentives that reward new innovations, intellectual property rights, sales achievements, performance bonus and profit sharing.
5.3.7 Pension SchemeThe Company abides to each country’s labor laws and customs. Taking Taiwan for example, Acer conforms to the Labor Standards Act and Labor Pension Act by contributing a portion of employees’ salaries toward a pension scheme. Employees who have served for 15 years and have reached 50 years of age can apply for early retirement. 5.3.8 Employee RelationsAcer respects employees’ opinions and is dedicated to maintaining a harmonious relation between managers and their team members. In the past two years, Acer has not suffered any financial loss from employee conflict.
Taking Taiwan for example, Acer offers multiple channels for interaction in order to improve two-way communication:‧ A hotline for each supporting function has been set up for employees to call, in confidence, to express concerns
or issues. Acer will provide counsel and/or resolve the issue in the most efficient way.‧ Employees can report areas of concern to their immediate supervisor or choose to convey to higher authorities
for resolution. Meanwhile, the Company Chairman meets face-to-face with employee representatives from each division on a quarterly basis, to discuss areas of improvement and respond to issues. The Chairman also assigns the relevant member(s) to aggressively follow up on change or improvement, and to report on progress at the next quarterly meeting. The meeting minutes are published on the Company Intranet for all employees’ attention.
‧ The Company conducts am annual employee opinion poll to understand the perceptions of employees on the Company, management team and working environment. Such feedback provides valuable direction for the management to take improved actions.
5.4 Important Contracts
Nature of Contracts Contracting PartiesBeginning and Ending Dates
of ContractsMajor Content
Restrictive Clauses
Software License Agreement
Microsoft Inc. Aug 1, 2008~Jul 31, 2009Obtain license from Microsoft for using certain software
ConfidentialNon-assignable
Patent License Agreement
IBM Corp.Nov 22, 2006 until the end of related patents period
Cross license arrangements for certain patents
ConfidentialNon-assignable
Lucent Technologies GRL, LLC
Apr 1, 2004~Dec 31, 2010Cross license arrangements for certain patents
ConfidentialNon-assignable
MPEG LA, LLC Jun 1, 1994~Dec 31, 2010Obtain license for MPEG-2 encoding/decoding patents
ConfidentialNon-assignable
Hewlett-Packard Development L.P.
Jun 13, 2008~Jun 12 2014Cross license arrangements for certain patents
ConfidentialNon-assignable
Consultant Service Agreement
ID SoftCapital Inc. Feb 1, 2005~Jan 31, 2010Obtain consulting services from IDS in investment management
ConfidentialNon-assignable
Credit Facility Agreement
Coodinator:Citibank N.A., Taipei Branch
Oct 11, 2007, Oct 10, 2010The syndicated financing in the amount of up to NT$19,800 million
ConfidentialNon-assignable

Acer Incorporated 2008 Annual Report46 Acer Incorporated 2008 Annual Report 47
6.Corporate Social Responsibility

Acer Incorporated 2008 Annual Report Acer Incorporated 2008 Annual Report48 49
Corporate Social Responsibility
Acer Incorporated 2008 Annual Report Acer Incorporated 2008 Annual Report48 49
As one of the world’s leading PC vendors, Acer is committed to sustainable business operations; fulfilling our corporate social responsibilities is the key to achieving this goal. Our policy to be a socially responsible corporation is built around three principles: stable business operations, financial transparency, and care for the environment – while seeking winning partnerships for the Company and its stakeholders. In addition to looking after customers, employees and shareholders, ensuring the rights and welfare of the general public is our foremost concern.
The OECD (Organization for Economic Cooperation and Development) Guidelines on Multinational Enterprises state that enterprises should ensure timely and accurate disclosure of their activities, structure, financial situation and performance. Enterprises are also encouraged to apply high quality standards for non-financial information including environmental, social and shareholder reporting where they exist. Acer shares the same ideas and practices beginning with the transparency of financial disclosure.
Under proper guidance and administration, uniformed accounting standards throughout its global operations and order transparency of the supply chain lay a solid foundation of mutual trust between Acer and its suppliers, which not only upgrades the level of technology but enhances the overall corporate competitiveness.
Regarding the disclosure of non-financial information, Acer established environmental communication channels in 2005, which include an email ([email protected]), environmental homepage, and corporate environmental reports. These channels enable the Company to disclose information on its environmental management and performance, such as efforts to comply with international environmental regulations, management of green supply chain, products that meet eco-design requirements, and green office practices. Furthermore, Acer actively communicates with international environmentalist organizations to better sensitize itself with related issues as well as expectations of other sectors.
Acer maintains the spirit of “Innovative Caring.” The Company is dedicated to enhancing corporate performance, ensuring benefits for employees and shareholders, and providing consumers with state-of-the-art technology. Moreover, it pays attention to important issues such as the environment, human rights, supplier management, community communications, and philanthropy. 2005 was Acer’s year of environmental management, and 2006 Acer’s year of sustainability. Responding to challenges from the organizational level, Acer set up a Corporate Sustainability Office (CSO). We spent almost one year to complete an integrated strategy and set the 2008-2010 CSR action plans for a sustainable Acer. In spring 2008, our board of directors highlighted the milestones for embedding CSR within Acer, and designated Acer Inc. CEO & Corporate President Gianfranco Lanci to be the corporate sustainability officer of the CSO. Acer’s CSR agenda in 2008 focused on the following five areas: energy and climate, green product, recycling, supply chain management, and reporting. Acer will continue to fulfill its mission to breaking the barriers between people and technology, with a strong commitment on CSR. We believe that Acer will be a leading solution provider for our sustainable future.
6.1 Environmental, Safety and Health Management
Environmental Protection
Energy and Climate ChangeIn response to global warming and climate change, Acer’s Integrated Strategy on Energy and Climate Change was formulated in 2008. The Company aspires to lead its supply-chain members to take part in the fight against global warming, and began conducting a comprehensive examination of all potential methods to conserve energy and reduce carbon dioxide emissions. In 2008, the following actions were taken:
1. Improve energy consumption in products: Acer became a sponsoring member of the Climate Saver Computing Initiative (CSCI), and pledged to adopt CSCI’s objectives of producing and purchasing products of lower power consumption. Meanwhile, Acer focused on designing power-saving products and compliance with Energy Star standards to help protect our planet.
2. Carbon disclosure: Acer began a corporate-wide green house gas (GHG) emission inventory in April 2008 with the GHG Protocol as the central guiding principles. We responded and publicly disclosed the questionnaire published by Carbon Disclosure Project (CDP) – an organization established by major investment bodies around the world. Acer is well aware of the significance of topics such as climate changes, GHG and their vital relation to supply chains, this is why Acer is participating in the Supply Chain Leadership Collaboration (SCLC) project initiated by the CDP and calling for our suppliers to start GHG inventory. In the future, we will engage more suppliers and request more comprehensive information on GHG emission. We will also start collecting transportation data relating to GHG emissions from our product logistics and after-sales services.
3. Energy efficiency improvement in office buildings: Besides reducing power from air-conditioning at Acer’s headquarters, we also took several power-saving measures such as turning off lights during lunch times, and installing low power consumption lighting such as using LED emergency signage.
4. GHG reduction initiatives: Acer collaborated with other companies to host the Taiwan Corporate Sustainability Forum in 2008, which presented a platform for the effective discussion and knowledge exchange on GHG reduction for Taiwan.
Green Product DesignMinimizing the impact on our environment is one of Acer’s focal concerns from the early stage of our product design. Less packaging materials are used to save resources, and a guidance of restricted chemical substances was established to manage banned substances, and restricted substances of the present and the future in our products. We will continue to research and find PVC, BFR and phthalates substitutes for hazardous substance-free designs. Staying abreast with international environmental trends, Acer complies with related international and domestic regulations and makes every effort to design environmentally friendly products by being responsible for product recycling, disclosing product environmental information and providing guidance and management on environmental aspects for green suppliers.
Safety and Health Management
Working Environment Safety Management PlanAt the Acer headquarters in Taiwan, employees and guests must use an access card to enter the general office areas in normal office hours. During holidays and evenings, entry into the office area requires an additional personal identity number. In the interest of safety for female employees, entry into women’s restrooms also requires card access; inside these restrooms emergency alarms and telephones have been installed to provide a double measure of protection.
Occupational Health and Safety Management SystemAcer introduced the OHSAS 18001 (Occupational Health and Safety Assessment Series 18001) and TOSHMS (Taiwan Occupational Safety and Health Management System) in the Taipei headquarters in fall 2008. We believe these two systems will help us further manage occupational health and safety risks and reduce accidents. The two systems will go into effect commencing 2009 and provide Acer a more systematic management method of measure.
In addition to these jobsite safety and fire protection measures, Acer conducts – annually – two CO2 level inspections and one electromagnetic wave inspection of the office area. These checks go to ensure a healthy and safe office environment, and to provide employees with a peace-of-mind.
Acer has formed its own firefighting operating procedure for the initial line of self-defense in an emergency. Acer’s firefighting team consists of an escape assistance squad, fire-extinguishing squad, reporting squad, first-aid squad, transport squad, and safety and prevention squad. The team’s primary mission is to carry out the initial fire extinguishing efforts and evacuate employees in the case of a fire emergency, thus reducing the impact of

Acer Incorporated 2008 Annual Report Acer Incorporated 2008 Annual Report50 51
Corporate Social Responsibility
Acer Incorporated 2008 Annual Report Acer Incorporated 2008 Annual Report50 51
disaster. Acer coordinates with the Building Management Committee to conduct biannual fire safety drills. Random, unscheduled drills are made to ensure employees remain prepared at the Acer headquarters, while also cooperating with the Fire Department to update on firefighting training.
Employees are the most valuable asset to Acer. An employee leisure zone has been set up along with a basketball court at the rooftop of the Acer headquarters. A series of lectures on health management is held to promote healthy living among employees, with topics ranging from allergies, nutrition to stress management and more. We established the Acer Sports Team to encourage employee participation in sports activities such as running and swimming. Employees are encouraged to get together outside of work and organize group activities where they can share interests and build friendships. Since 2008, Acer has organized a massage service for employees to help relief pressure. These various activities help Acer’s employees to better balance their professional and personal lives and to be more productive in their work.
6.2 Stakeholders Communication and Management
Supply Chain Management
Green Supply Chain ManagementWith increasing global environmental awareness, supply chain management is now adding environmental elements to the conventional production management-centered paradigm. In other words, environmental protection principles have been included in supply-chain management mechanisms. Acer and its suppliers are interdependent and therefore should work together towards the establishment of a green supply chain management system. The system includes three main parts: 1. Environmental Management System: Acer demands that its first-tier suppliers establish an environmental management system. Currently all suppliers to Acer are ISO14001 certified; 2. Eco Product Requirement: All suppliers should meet the Eco Product Requirement put forward by Acer; 3. Restricted Chemical Materials Management: Acer requires suppliers to follow Acer’s Guidance of Restricted Substances in Products. This management framework guarantees product quality and ensures the restricted use or elimination of hazardous chemical substances.
Electronic Industry Citizenship CoalitionAcer applied to the Electronic Industry Citizenship Coalition (EICC) in May 2008. We implemented the EICC Code of Conduct with the cooperation of its members and support from our supply chain. We believe the EICC Code of Conduct can reduce suppliers’ duplicate work, build suppliers’ capacity of human rights, health, safety, environment, ethics, and social responsibility in our supply chain.
We announced in our 2008 supplier conference that all Acer’s ODM and key components suppliers had to answer the EICC Self-Assessment Questionnaire (SAQ) to understand how they perform in social and environmental responsibility. We then evaluated their EICC SAQ result and conducted on-site audits of selected suppliers to confirm their actual situation in December 2008.
The first Acer CSR Forum with the theme of Global Challenges to a Sustainable Development was held at the end of 2008 to increase awareness among Acer’s suppliers and Taiwan’s ICT industry on CSR and sustainable development. Acer invited international and domestic CSR stakeholders to share experiences with the Taiwan ICT industry; groups invited included CDP, CSCI, EICC, Greenpeace, Centre for Research on Multinational Corporations (SOMO), Workers’ Assistance Center (WAC), Association in Sustainable & Responsible Investment in Asia (ASrIA) and Taiwan Environmental Action Network (TEAN). The forum also invoved enterprises with outstanding CSR performance, including Sony, Delta Electronics, AUO and Foxconn.
Acer understands that to fully practice CSR requires cooperation among all stakeholders. The forum enabled Acer to collect stakeholders’ opinions and recommendations to help draw up Acer’s future CSR strategies, build relations
with stakeholders based on mutual understanding and respect, and express Acer’s standpoint and stance on CSR. Acer is committed to ongoing communications with its stakeholders and to influencing suppliers to enhance overall competitiveness.
Client RelationsAcer strives to meet customer demands by understanding exactly what our customers need, and using our knowledge and skills to exceed their expectations through cutting-edge technology. Ultimately, we hope that customers are proud of their Acer products. Acer is ISO 9001 certified, which is primarily concerned with quality management and fulfillment of customer demands for quality. The quality policy of Acer is to “deliver zero-defect, competitive products and services on time.” Product repair reports are reviewed every week with improvements immediately incorporated into the production lines. Customers can rest assured knowing that they have a safe product and that Acer will continue to provide comprehensive customer service.
6.3 Social Welfare
Acer FoundationFounded in July 1996, the Acer Foundation was established through donations from various departments throughout the Company. Acer Foundation upholds the concept that “embracing technology allows us to widen our horizons” and believes the key to working together toward an international alliance of wisdom requires a long period of cultivation. Acer Foundation’s mission is threefold: research and develop technology and management; cultivate talents; and reward and promote service.
In mid 2008, Acer CEO J.T. Wang was elected as the CEO of Acer Foundation and took the foundation to a new phase by becoming involved in the Company’s resolution to promote CSR. Acer Foundation will serve as a platform for international and domestic CSR stakeholders to communicate and help the ICT industry in Taiwan to become more sustainable.
Acer VolunteersThe Acer Volunteer Team was established in October 2004 for the purpose of giving colleagues a channel to contribute their spare time and energy to public welfare services. Apart from providing opportunities for interaction and friendship between colleagues from different departments and backgrounds, Acer volunteers bring new life experiences and personal growth through their activities.
In the initial stage, volunteer activities mainly revolved around Acer’s core business and involved setting up Internet service, computer repair, software design, and providing assistance to disadvantaged minority groups. Since 2007, the Acer Volunteer Team gradually expanded its scope of charity to cover various kinds of activities, including money donation, blood donation, and second-hand goods donation. Acer volunteers also funded after-class projects for less privileged children in Taiwan’s Hsichih county every year. To raise environmental awareness among our employees, Acer volunteers initiated on Earth Day, April 22, 2008, the practice of switching off office lights during lunch breaks. In the future, Acer volunteers will keep giving back to society and manifest corporate responsibility.

Acer Incorporated 2008 Annual Report52 Acer Incorporated 2008 Annual Report 53
7.Financial Standing

Acer Incorporated 2008 Annual Report Acer Incorporated 2008 Annual Report54 55
Financial Standing
Acer Incorporated 2008 Annual Report Acer Incorporated 2008 Annual Report54 55
7.1 Five-Year Consolidated Financial Information
7.1.1 Five-Year Balance SheetAs of March 31, 2009
Unit: NT$ Thousand
Period
Item
Most Recent 5-Year Financial Information Current Yearas of Mar.31,
20092004 2005 2006 2007 2008
Current Assets 85,029,907 139,242,560 161,267,661 191,626,201 186,390,592 201,740,858
Fund and Long-term Equity Investments
20,644,599 17,605,973 13,835,538 11,202,652 6,773,547 7,445,583
Net Property, Plant and Equipment 13,446,980 9,468,157 6,190,501 8,636,441 9,336,221 9,262,067
Intangible Assets 784,296 501,878 396,682 25,926,493 34,746,765 37,656,421
Other Assets 4,555,507 4,763,374 6,809,916 5,891,555 6,195,100 6,373,407
Total Assets 124,461,289 171,581,942 188,500,298 243,283,342 243,442,225 262,478,335
Current Before Distribution 59,898,759 102,158,601 109,970,460 142,842,574 149,315,158 164,687,935
Liabilities After Distribution 64,857,922 109,390,340 119,487,678 152,163,698 Un-
appropriatedUn-
appropriated
Long-term Liabilities 257,007 146,623 168,627 16,790,876 4,134,920 4,116,219
Other Liabilities 2,087,804 2,027,268 2,805,428 6,240,899 7,114,532 7,432,099
Total Before Distribution 62,243,570 104,332,491 112,944,515 165,874,348 160,564,610 176,236,253
Liabilities After Distribution 67,202,733 111,564,230 122,461,733 175,195,472 Un-
appropriatedUn-
appropriated
Common stock 20,933,677 22,545,187 23,370,637 24,054,904 26,428,560 26,428,560
Capital surplus 30,541,969 30,552,132 29,947,020 29,898,982 37,129,952 37,203,104
Retained Before Distribution 13,211,567 16,123,212 18,284,265 21,041,713 22,771,901 24,797,631
Earnings After Distribution 8,252,404 8,891,473 8,767,047 11,720,589 Un-
appropriatedUn-
appropriated
Unrealized Gain (loss) on Financial Assets
(731,426) 65,608 4,361,608 2,524,500 (1,729,631) (1,085,579)
Translation Adjustments 132,516 (226,806) 1,335,500 2,733,899 1,241,058 1,844,113
Minimum Pension Liability Adjustment
(0) (0) 0 (173,364) (283) (283)
Treasury Stock (3,411,280) (3,270,920) (3,270,920) (3,270,920) (3,522,598) (3,522,598)
Minority Interest 1,540,696 1,461,038 1,527,674 599,280 558,656 577,134
Stockholders’ Equity
Before Distribution 62,217,719 67,249,451 75,555,783 77,408,994 82,877,615 86,242,082
After Distribution 57,258,556 60,017,712 66,038,565 68,087,869 Un-
appropriatedUn-
appropriated
7.1.2 Five-Year Consolidated Income StatementUnit: NT$ Thousand
Period
Item
Most Recent 5-Year Financial Information Current Yearas of Mar.31,
20092004 2005 2006 2007 2008
Operating Revenue 225,014,007 318,087,679 350,816,353 462,066,080 546,274,115 119,086,448
Gross Profit 27,219,303 34,121,461 38,171,313 47,418,310 57,285,660 11,918,367
Operating (loss) Income 3,806,657 7,648,961 7,462,446 10,185,123 14,072,302 2,570,574
Non-operating Income and Gain 6,742,733 7,176,374 9,266,120 6,699,671 5,353,038 467,666
Non-operating Expense and Loss 1,908,790 4,172,803 3,180,259 1,776,157 4,618,613 282,903
Continuing Operating Income before Tax
8,640,600 10,652,532 13,548,307 15,108,637 14,806,727 2,755,337
Income(Loss) from Discontinued Segment
0 0 0 517,866 99,843 0
Extraordinary Items 0 0 0 0 0 0
Cumulative Effect of changes in Accounting Principle
0 0 0 0 0 0
Income after Income Taxes 7,011,661 8,477,502 10,218,242 12,958,933 11,742,135 2,025,730
EPS 2.86 3.48 4.20 5.33 4.72 0.78
7.1.3 CPAs and Auditor’s Opinions:
Year Name of CPA(s) Auditor’s Opinion
2004 Sonia Chang, Winston Yu Unreserved
2005 Sonia Chang, Winston Yu Modified Unreserved
2006 Winston Yu, Albert Lou Modified unreserved
2007 Sonia Chang, Winston Yu Unreserved
2008 Sonia Chang, Agnes Yang Modified unreserved

Acer Incorporated 2008 Annual Report Acer Incorporated 2008 Annual Report56 57
Financial Standing
Acer Incorporated 2008 Annual Report Acer Incorporated 2008 Annual Report56 57
7.2 Five-Year Financial Analysis
Period
Item
Most Recent 5-Year Financial Information Current Yearas of Mar.31,
20092004 2005 2006 2007 2008
Financial Ratio(%)
Total liabilities to Total Assets 50.01 60.81 59.92 68.18 65.96 67.14
Long-term Debts to Fixed Assets 480.13 733.23 1,268.55 1,162.99 1,008.19 1,055.82
Ability toPayoff Debt
Current Ratio (%) 141.96 136.30 146.65 134.15 124.83 122.50
Quick Ratio (%) 117.11 106.20 121.20 106.32 95.47 99.30
Interest Protection 15 29 33 21 12 14
Ability to Operate
A/R Turnover (times) 7.28 6.05 5.26 5.34 5.18 4.61
A/R Turnover days 50 60 69 68 70 79
Inventory Turnover (times) 17.52 13.39 12.01 13.88 13.24 11.64
Inventory Turnover days 21 27 30 26 28 31
A/P Turnover (times) 7.80 5.67 4.72 5.63 6.39 5.62
Fixed Assets Turnover (times) 16.73 33.60 56.67 53.50 58.51 51.43
Total Assets Turnover (times) 1.81 1.85 1.86 1.90 2.24 1.81
Earning Ability
Return on Assets (%) 6.17 5.92 5.85 6.27 5.23 3.45
Return on Equity (%) 11.07 13.10 14.31 16.94 14.65 9.58
To Pay-inCapital %
Operating Income 18.18 33.93 31.93 42.34 53.25 38.91
PBT 41.28 47.25 57.97 62.81 56.03 41.70
Net Income Ratio (%) 3.12 2.67 2.91 2.80 2.15 1.70
EPS (NTD) 2.86 3.48 4.20 5.33 4.72 0.78
Cash flow(%)
Cash Flow Ratio 3.40 6.97 12.03 (4.59) (3.46) 19.08
Cash Flow Adequacy Ratio 19.96 46.41 61.02 26.47 17.55 45.37
Cash Reinvestment Ratio (4.24) 3.11 7.89 (19.89) (21.40) 48.05
LeverageOperating Leverage 4.90 2.93 3.45 2.99 3.14 3.83
Financial Leverage 1.19 1.05 1.06 1.08 1.10 1.09
1. Financial Ratio(1) Total liabilities to total assets = Total liabilities / Total assets(2) Long-term funds to fixed assets = (Net equity + Long term debts) / Net fixed assets
2. Ability to Pay off debt(1) Current ratio = Current Assets / Current liability(2) Quick ratio = (Current assets ‒ Inventory ‒ Prepaid expenses) / Current liability(3) Interest protection = Net income before income tax and interest expense / Interest expense
3. Ability to Operate(1) Account receivable (including account receivable and notes receivable from operation) turnover = Net sales /
the average of account receivable (including account receivable and notes receivable from operation) balance(2) A/R turnover day = 365 / account receivable turnover(3) Inventory turnover = Cost of goods sold / the average of inventory(4) Account payable (including account payable and notes payable from operation)turnover = Cost of goods sold /
the average of account payable (including account payable and notes payable from operation) balance(5) Inventory turnover day = 365 / Inventory turnover(6) Fixed assets turnover = Net sales / Net Fixed Assets(7) Total assets turnover = Net sales / Total assets
4. Earning Ability(1) Return on assets = [PAT + Interest expense×(1 ‒ interest rate)] / the average of total assets(2) Return on equity = PAT / the average of net equity(3) Net income ratio = PAT - Net sales(4) EPS = (PAT - Dividend from prefer stock) / weighted average outstanding shares
5. Cash Flow(1) Cash flow ratio = Cash flow from operating activities / Current liability(2) Cash flow adequacy ratio = Most recent 5-year Cash flow from operating activities / Most recent 5-year (Capital
expenditure + the increase of inventory + cash dividend)(3) Cash reinvestment ratio = (Cash flow from operating activities ‒ cash dividend) / (Gross fixed assets + long-
term investment + other assets + working capital)
6. Leverage(1) Operating leverage = (Net revenue ‒ variable cost of goods sold and operating expense) / operating income(2) Financial leverage = Operating income / (Operating income ‒ interest expenses)

Acer Incorporated 2008 Annual Report Acer Incorporated 2008 Annual Report58 59
Financial Standing
Acer Incorporated 2008 Annual Report Acer Incorporated 2008 Annual Report58 59
7.3 Supervisor’s Audit Report
To: The 2009 General Shareholders Meeting
The Board of Directors of the Company has prepared the 2008 financial report, including balance sheet, statement of income, statements of changes in stockholders’ equity, and statement of cash flows. Sonia Chang and Agnes Yang at KPMG have been retained by the Board of Directors of the Company to issue an audit report. The undersigned supervisors have reviewed the audit report and the aforesaid documents, which made by The Board of Directors in compliance with Article 228 of the Company Law, and did not find any incompliance. In accordance with Article 219 of the Company Law, it is hereby submitted for your review and perusal.
Supervisor: George Huang
Supervisor: Carolyn Yeh
Dated: April 24, 2009
ACER INCORPORATED AND SUBSIDIARIES
Consolidated Financial Statements
December 31, 2007 and 2008(With Independent Auditors’ Report Thereon)

Acer Incorporated 2008 Annual Report Acer Incorporated 2008 Annual Report60 61
Financial Standing
Acer Incorporated 2008 Annual Report Acer Incorporated 2008 Annual Report60 61
Independent Auditors’ Report
The Board of DirectorsAcer Incorporated:
We have audited the consolidated balance sheets of Acer Incorporated (the “Company”) and subsidiaries as of December 31, 2007 and 2008, and the related consolidated statements of income, changes in stockholders’ equity, and cash flows for the years then ended. These financial statements are the responsibility of the Company’s management. Our responsibility is to express an opinion on these financial statements based on our audits.
We conducted our audits in accordance with auditing standards generally accepted in the Republic of China and with the “Regulations Governing Auditing and Certification of Financial Statements by Certified Public Accountants”. Those standards and regulations require that we plan and perform the audit to obtain reasonable assurance about whether the financial statements are free of material misstatement. An audit includes examining, on a test basis, evidence supporting the amounts and disclosures in the financial statements. An audit also includes assessing the accounting principles used and significant estimates made by management, as well as evaluating the overall financial statement presentation. We believe that our audits provide a reasonable basis for our opinion.
In our opinion, the consolidated financial statements referred to in the first paragraph present fairly, in all material respects, the financial position of Acer Incorporated and subsidiaries as of December 31, 2007 and 2008, and the results of their operations and their cash flows for the years then ended, in conformity with accounting principles generally accepted in the Republic of China.
As stated in note 3 to the consolidated financial statements, effective on January 1, 2008, the Company and its subsidiaries recognized, measured and disclosed share-based payment transactions, employee bonuses, and directors’ and supervisors’ emoluments according to Republic of China Statement of Financial Accounting Standards (SFAS) No. 39 “Accounting for Share-based Payment” and Interpretation (96) 052 issued by the Accounting Research and Development Foundation. The changes in accounting principle decreased the consolidated net income and basic earnings per share for the year ended December 31, 2008, by NT$1,483,776 thousand and NT$0.60, respectively.
The consolidated financial statements as of and for the year ended December 31, 2008, have been translated into United States dollars solely for the convenience of the readers. We have audited the translation, and in our opinion, the consolidated financial statements expressed in New Taiwan dollars have been translated into United States dollars on the basis set forth in note 2(26) to the consolidated financial statements.
Taipei, Taiwan (the Republic of China)March 27, 2009
Note to ReadersThe accompanying consolidated financial statements are intended only to present the financial position, results of operations and cash flows in accordance with accounting principles and practices generally accepted in the Republic of China and not those of any other jurisdictions. The standards, procedures and practices to audit such consolidated financial statements are those generally accepted and applied in the Republic of China.
ACER INCORPORATED AND SUBSIDIARIESConsolidated Balance SheetsDecember 31, 2007 and 2008
(Expressed in thousands of New Taiwan dollars and US dollars)
Assets 2007 2008NT$ NT$ US$
Current assets:Cash and cash equivalents (note 4(1)) 37,945,339 22,141,725 674,682Notes and accounts receivable, net of allowance for doubtful accounts of NT$2,356,672
and NT$898,972 as of December 31, 2008 and 2007, respectively (notes 4(2) and 6)
101,898,281
107,826,311
3,285,584Notes and accounts receivable from related parties (note 5) 448,481 841,465 25,640Other receivable from related parties (note 5) 59,403 45,173 1,376Other receivables (note 4(3)) 7,375,569 8,807,454 268,373Financial assets at fair value through profit or loss ‒ current (notes 4(5) and 4(25)) 19,982 354,751 10,810Available-for-sale financial assets ‒ current (notes 4(4) and 4(25)) 2,852,061 591,444 18,022Hedging-purpose derivative financial assets ‒ current (notes 4(6) and 4(25)) 235,198 1,022,782 31,165Inventories (notes 4(7) and 6) 33,815,697 40,028,195 1,219,702
Prepayments and other current assets (note 4(8)) 2,828,601 1,525,555 46,485
Deferred income tax assets ‒ current (note 4(19)) 1,914,006 2,282,943 69,564Restricted assets (note 6) 2,233,583 922,794 28,119
Total current assets 191,626,201 186,390,592 5,679,522
Funds and investments:Long-term equity investments under equity method (note 4(10)) 4,689,684 2,928,790 89,243Available-for-sale financial assets ‒ noncurrent (notes 4(11) and 4(25)) 3,370,847 1,160,487 35,361Financial assets carried at cost ‒ noncurrent (notes 4(9) and 4(25)) 3,142,121 2,684,270 81,793
Total funds and investments 11,202,652 6,773,547 206,397
Property, plant and equipment (notes 4(12) and 6):Land 1,560,568 2,678,408 81,614Buildings and improvements 3,627,214 5,294,056 161,316Computer equipment and machinery 4,367,924 3,348,086 102,020Transportation equipment 114,923 120,069 3,659Office equipment 985,679 1,128,167 34,376Leasehold improvements 487,647 816,904 24,892Other equipment 723,029 1,136,428 34,628Construction in progress and advance payments for purchases
of property and equipment 490,749 30,692 93512,357,733 14,552,810 443,440
Less: accumulated depreciation (3,446,629) (4,922,662) (149,999)accumulated impairment (274,663) (293,927) (8,956)Net property, plant and equipment 8,636,441 9,336,221 284,485
Intangible assets (note 4(14)) 25,926,493 34,746,765 1,058,772Property not in use (note 4(13)) 3,806,103 2,996,721 91,313Other financial assets (notes 4(15), 4(25) and 6) 961,393 868,760 26,472Deferred charges and other assets (notes 4(18) and 4(19)) 1,124,059 2,329,619 70,986
Total assets 243,283,342 243,442,225 7,417,947

Acer Incorporated 2008 Annual Report Acer Incorporated 2008 Annual Report62 63
Financial Standing
Acer Incorporated 2008 Annual Report Acer Incorporated 2008 Annual Report62 63
ACER INCORPORATED AND SUBSIDIARIESConsolidated Balance SheetsDecember 31, 2007 and 2008
(Expressed in thousands of New Taiwan dollars and US dollars)
Liabilities and Stockholders’ Equity 2007 2008NT$ NT$ US$
Current liabilities:Short-term borrowings (notes 4(16) and 6) 5,372,109 1,086, 851 33,117Current installments of long-term debt (notes 4(17) and 6) 17,366 8,250,000 251,386Notes and accounts payable 76,259,412 64,365,616 1,961,290Notes and accounts payable to related parties (note 5) 4,583,615 7,750,220 236,158Financial liabilities at fair value through profit or loss (notes 4(5) and 4(25)) 1,395,142 1,011,739 30,829Other payables to related parties (note 5) 609,717 189,964 5,788Hedging-purpose derivative financial liabilities ‒ current (notes 4(6) and 4(25)) 66,786 872,038 26,572Royalties payable 11,670,600 13,228,769 403,095Accrued expenses and other current liabilities (note 4(19)) 42,867,827 52,559,961 1,601,559
Total current liabilities 142,842,574 149,315,158 4,549,794
Long-term liabilities:Long-term debt, excluding current installments (notes 4(17), 4(25) and 6) 16,790,876 4,134,920 125,995Other liabilities (note 4(18)) 1,121,524 840,433 25,609Deferred income tax liabilities ‒ noncurrent (note 4(19)) 5,119,374 6,274,099 191,178
Total long-term liabilities 23,031,774 11,249,452 342,782Total liabilities 165,874,348 160,564,610 4,892,576
Stockholders’ equity and minority interest (notes 3, 4(10), 4(20) and 4(21)):Common stock 24,054,904 26,428,560 805,307Capital surplus 29,898,983 37,129,952 1,131,390Retained earnings
Legal reserve 7,490,689 8,786,583 267,737Unappropriated earnings 13,551,024 13,985,318 426,148
Other stockholders’ equity componentsForeign currency translation adjustment 2,733,899 1,241,058 37,816Minimum pension liability adjustment (173,364) (283) (9)Unrealized gain (loss) on available-for-sale financial assets 2,508,663 (1,456,066) (44,368)Hedging reserve 15,836 (273,565) (8,336)Treasury stock (3,270,920) (3,522,598) (107,337)
Total stockholders’ equity 76,809,714 82,318,959 2,508,348
Minority interest 599,280 558,656 17,023Total stockholders’ equity and minority interest 77,408,994 82,877,615 2,525,371
Commitments and contingencies (note 7)
Total liabilities and stockholders’ equity 243,283,342 243,442,225 7,417,947
ACER INCORPORATED AND SUBSIDIARIESConsolidated Statements of Income
Years ended December 31, 2007 and 2008(Expressed in thousands of New Taiwan dollars and US dollars, except for per share data)
2007 2008NT$ NT$ US$
Revenues (note 5) 462,066,080 546,274,115 16,645,564Cost of revenues (note 5) (414,647,770) (488,988,455) (14,900,008)
Gross profit 47,418,310 57,285,660 1,745,556Operating expenses (notes 4(14), 4(18), 4(21), 5, and 10)
Selling (32,727,126) (35,764,261) (1,089,776)Administrative (4,156,402) (6,899,059) (210,222)Research and development (349,659) (550,038) (16,760)
Total operating expenses (37,233,187) (43,213,358) (1,316,758)Operating income 10,185,123 14,072,302 428,798
Non-operating income and gains:Interest income 1,343,523 1,207,826 36,804Investment gain recognized by equity method (note 4(10)) 695,660 404,184 12,316Gain on disposal of property and equipment (note 4(12)) 121,418 515,272 15,701Gain on disposal of investments, net (notes 4(4), 4(9), 4(10)
and 4(11))4,045,981 2,709,524 82,562
Other income 493,089 516,232 15,730 6,699,671 5,353,038 163,113
Non-operating expenses and loss:Interest expense (759,907) (1,305,746) (39,787)Other investment loss (notes 4(9) and 4(10)) - (416,404) (12,688)Restructuring cost (note 4(22)) - (1,582,408) (48,218)Foreign currency exchange loss and loss on evaluation of
financial instruments, net (notes 4(5) and 4(6)) (455,385) (866,315) (26,398)Asset impairment loss (note 4(13)) - (221,931) (6,762)Other loss (560,865) (225,809) (6,881)
(1,776,157) (4,618,613) (140,734)Income from continuing operations before income taxes 15,108,637 14,806,727 451,177Income tax expense (note 4(19)) (2,665,578) (3,169,446) (96,576)Income from continuing operations 12,443,059 11,637,281 354,601Income from discontinued operations (net of income taxes of NT$0 and
NT$23,120 in 2008 and 2007, respectively) (note 4(23)) 517,866 99,843 3,042
Consolidated net income 12,960,925 11,737,124 357,643Net income attributable to:
Shareholders of parent company 12,958,933 11,742,135 357,796 Minority shareholders 1,992 (5,011) (153)
12,960,925 11,737,124 357,643
Earnings per common share (in dollars) (note 4(24)):
Basic earnings per common share ‒ retroactively adjusted 5.33 4.72 0.14Diluted earnings per common share 4.65 0.14

Acer Incorporated 2008 Annual Report Acer Incorporated 2008 Annual Report64 65
Financial Standing
Acer Incorporated 2008 Annual Report Acer Incorporated 2008 Annual Report64 65
ACER INCORPORATED AND SUBSIDIARIESConsolidated Statements of Changes in Stockholders’ Equity
Years ended December 31, 2007 and 2008(Expressed in thousands of New Taiwan dollars and US dollars)
Retained earning
Commonstock
Capitalsurplus
Legalreserve
Specialreserve
Unappropriatedearnings
Foreigncurrency
translationadjustment
Minimum pension liability
adjustment
Unrealized gain (loss) on available-
for-sale financialassets
Hedgingreserve
Treasurystock
Minorityinterest
Totalstockholders’
equityNT$ NT$ NT$ NT$ NT$ NT$ NT$ NT$ NT$ NT$ NT$ NT$
Balance at January 1, 2007 23,370,637 29,947,020 6,468,865 283,921 11,531,479 1,335,500 - 4,374,388 (12,780) (3,270,920) 1,527,673 75,555,7832007 net income - - - - 12,958,933 - - - - - 1,992 12,960,925Foreign currency translation adjustment - - - - - 1,398,399 - - - - - 1,398,399Unrealized gain (loss) on qualifying cash flow hedge - - - - - - - - 28,616 - - 28,616Appropriation approved by the stockholders (note 4(20)):
Legal reserve - - 1,021,824 - (1,021,824) - - - - - - -Stock dividends and employee bonuses in stock 684,267 - - - (684,267) - - - - - - -Special reserve - - - (283,921) 283,921 - - - - - - -Cash dividends - - - - (8,997,695) - - - - - - (8,997,695)Directors’ and supervisors’ remuneration - - - - (94,804) - - - - - - (94,804)Employee bonuses in cash - - - - (424,719) - - - - - - (424,719)
Decrease in capital surplus resulting from long-term equity investments accounted for by the equity method (note 4(10)) - -(169,810) - - - - - - - - - (169,810)
Cash dividends distributed to subsidiaries - 121,773 - - - - - - - - - 121,773Unrealized loss on available-for sale financial assets - - - - - - - (1,865,725) - - - (1,865,725)Minimum pension liability adjustment - - - - - - (173,364) - - - - (173,364)Change in minority interest - - - - - - - - - - (930,385) (930,385)Balance at December 31, 2007 24,054,904 29,898,983 7,490,689 - 13,551,024 2,733,899 (173,364) 2,508,663 15,836 (3,270,920) 599,280 77,408,9942008 net income - - - - 11,742,135 - - - - - (5,011) 11,737,124Foreign currency translation adjustment - - - - - (1,492,841) - - - - - (1,492,841)Unrealized gain (loss) on qualifying cash flow hedge - - - - - - - - (289,401) - - (289,401)Appropriation approved by the stockholders (note 4(20)):
Legal reserve - - 1,295,894 - (1,295,894) - - - - - - -Stock dividends and employees’ bonuses in stock 690,823 - - - (690,823) - - - - - - -Cash dividends - - - - (8,659,766) - - - - - - (8,659,766)Directors’ and supervisors’ remuneration - - - - (116,630) - - - - - - (116,630)Employees’ bonuses - - - - (544,728) - - - - - - (544,728)
Cash dividends distributed to subsidiaries - 114,832 - - - - - - - - - 114,832Decrease in capital surplus resulting from long-term equity investments accounted for by the equity method (note 4(10)) - -(78,255) - - - - - - - - - (78,255)
Unrealized loss on available-for sale financial assets - - - - - - - (3,964,729) - - - (3,964,729)Minimum pension liability adjustment - - - - - - 173,081 - - - - 173,081Issuance of shares for acquisitions (note 4(20)) 1,681,589 7,155,678 - - - - - - - - - 8,837,267Issuance of shares for the exercise of stock options (note 4(20)) 1,244 858 - - - - - - - - - 2,102Share-based payment transactions (note 4(21)) - 37,856 - - - - - - - - - 37,856Treasury stock held by subsidiaries - - - - - - - - - (251,678) - (251,678)Change in minority interest - - - - - - - - - - (35,613) (35,613)Balance at December 31, 2008 26,428,560 37,129,952 8,786,583 - 13,985,318 1,241,058 (283) (1,456,066) (273,565) (3,522,598) 558,656 82,877,615Balance at December 31, 2008 (in US$) 805,307 1,131,390 267,737 - 426,148 37,816 (9) (44,368) (8,336) (107,337) 17,023 2,525,371

Acer Incorporated 2008 Annual Report Acer Incorporated 2008 Annual Report66 67
Financial Standing
Acer Incorporated 2008 Annual Report Acer Incorporated 2008 Annual Report66 67
ACER INCORPORATED AND SUBSIDIARIESConsolidated Statements of Cash Flows
Years ended December 31, 2007 and 2008(Expressed in thousands of New Taiwan dollars and US dollars)
2007 2008NT$ NT$ US$
Cash flows from operating activities:Consolidated net income 12,960,925 11,737,124 357,643Adjustments to reconcile net income to cash provided by operating activities:
Depreciation 591,189 955,880 29,127Amortization 551,280 1,245,561 37,954Gain on disposal of property and equipment, net (121,418) (515,272) (15,701)Other expenses reclassified from property and equipment 4,369 - -Gain on disposal of investments, net (4,476,991) (2,709,524) (82,562)Net investment gain on long-term equity investments accounted for by equity
method, net of cash dividends received(875,415) (146,392) (4,461)
Other investment loss - 416,404 12,688Asset impairment loss - 221,931 6,762Restructuring cost - 1,582,408 48,218Stock-based compensation cost - 37,856 1,153Deferred income tax expense (benefit) (61,297) 786,086 23,953Changes in operating assets and liabilities:
Notes and accounts receivable (20,253,180) 452,252 13,781Receivables from related parties (335,002) (327,579) (9,981)Inventories (6,921,700) (4,882,424) (148,773)Other financial assets, prepayments and other current assets (1,055,734) (2,070,311) (63,084)Noncurrent receivable 224,925 186,604 5,686Notes and accounts payable (1,826,219) (16,097,164) (490,498)Payables to related parties 3,409,436 2,447,835 74,588Royalties payable, accrued expenses and other current liabilities 12,015,179 1,831,291 55,801Other liabilities (391,122) (319,014) (9,721)
Cash used in operating activities (6,560,775) (5,166,448) (157,427)Cash flow from investing activities:
Change in available-for-sale financial assets ‒ current, net 12,332,596 2,891,868 88,118Proceeds from sale of long-term equity investments and available for-sale financial assets 7,018,429 3,449,388 105,107Proceeds from sale of discontinued operations 868,222 - -Increase in long-term investments (217,140) (171,717) (5,232)Return of capital from investees 495,253 462,551 14,094Proceeds from disposal of property and equipment and property not used in operations 1,220,389 2,068,099 63,017Additions to property and equipment (534,626) (597,526) (18,207)Increase in intangible assets and other assets (1,427,547) (435,746) (13,278)Decrease (increase) in advances to related parties 14,771 (14,230) (434)Decrease (increase) in restricted assets (1,958,585) 1,813,448 55,258Acquisition of business, net of cash acquired (15,070,542) (719,026) (21,909)
Cash provided by investing activities 2,741,220 8,747,109 266,534Cash flows from financing activities:
Decrease in short-term borrowings (968,414) (4,285,258) (130,576)Increase in long-term debt 16,500,000 - -Payment of long-term debt (9,739,562) (4,423,321) (134,783)Payment of cash dividends, employee bonuses, and directors’ and supervisors’ remuneration (9,395,445) (9,206,292) (280,526)Exercise of employee stock options - 2,101 64Change in minority interests (296,018) (42,353) (1,291)
Cash used in financing activities (3,899,439) (17,955,123) (547,112)Net decrease in cash and cash equivalents (7,718,994) (14,374,462) (438,005)Effects of exchange rate changes 979,122 (1,429,152) (43,548)Cash and cash equivalents at beginning of year 44,685,211 37,945,339 1,156,235Cash and cash equivalents at end of year 37,945,339 22,141,725 674,682
Supplemental disclosures of cash flow informationInterest paid 1,052,609 1,275,330 38,861Income taxes paid 1,395,005 1,977,802 60,266
Cash acquired from acquisition of subsidiaries: Gateway Inc. Parkard Bell BV Parkard Bell BVCash consideration 23,507,016 3,172,080 96,657Non-cash assets acquired (35,589,573) (10,560,058) (321,776)Liabilities assumed 37,173,295 10,704,787 326,186Goodwill (16,654,264) (1,774,172) (54,061)Cash acquired from acquisition 8,436,474 1,542,637 47,006
E-Ten Information
Systems Co., Ltd.
E-Ten Information
Systems Co., Ltd. Issuance of shares for acquisition 8,837,267 269,281Non-cash assets acquired (7,288,921) (222,101)Liabilities assumed 1,263,892 38,512Goodwill (1,901,821) (57,951)Cash acquired from acquisition 910,417 27,741
ACER INCORPORATED AND SUBSIDIARIESNotes to Consolidated Financial Statements
As of and for the years endedDecember 31, 2007 and 2008
(amounts expressed in thousands of New Taiwan dollars and US dollars,except for earnings per share information and unless otherwise noted)
1. Reporting Entities of the Consolidated Financial Statements and Their Business Scopes
Acer Sertek Inc. (the “Company”) was incorporated on August 1, 1976, as a company limited by shares under the laws of the Republic of China (“ROC”). The Company merged with Acer Incorporated (“AI”) on March 27, 2002, with the Company as the surviving entity from the merger but renaming itself Acer Incorporated. After the merger, the principal activities of the Company focus on globally marketing its brand-name IT products, and promoting E-commerce solutions to clients.
The reporting entities of the consolidated financial statements include the Company and its subsidiaries (hereinafter referred to collectively as the “Consolidated Companies”). On December 31, 2007 and 2008, the number of employees of the Consolidated Companies was 6,271 and 6,727, respectively. The Consolidated Companies are summarized below according to their primary business activity.
(1) Sale of “Acer”, “Gateway”, “eMachine”, and “Packard Bell” brand-name information technology products:
Percentage ofOwnership by the Company
Investor at December 31,
2007 2008
(a) Acer Incorporated
(b) Acer Greater China (B.V.I.) Corp. (“AGC”, British Virgin Islands) and its subsidiaries The Company 100.00 100.00
‧Acer Market Services Limited (“AMS”, Hong Kong) AGC 100.00 100.00
‧Acer Computer (Far East) Limited (“AFE”, Hong Kong) AGC 100.00 100.00
‧Acer Information (Zhong Shan) Co., Ltd. (“AIZS”, China) AMS 100.00 100.00
‧Beijing Acer Information Co., Ltd. (“BJAI”, China) AMS 100.00 100.00
‧Acer Computer (Shanghai) Ltd. (“ACCN”, China) AMS 100.00 100.00
(c) Acer European Holding N.V. (“AEH”, Netherlands Antilles ) and its subsidiaries The Company 100.00 100.00
‧Acer Europe B.V. (“AHN”, the Netherlands) AEH 100.00 100.00
‧Acer Computer B.V. (“ACH”, the Netherlands) AEH 100.00 100.00
‧Acer Computer France S.A.R.L. (“ACF”, France) AHN 100.00 100.00
‧Acer U.K. Limited (“AUK”, the United Kingdom) AHN 100.00 100.00
‧Acer Italy S.R.L. (“AIT”, Italy) AHN 100.00 100.00
‧Acer Computer GmbH (“ACG”, Germany) AHN 100.00 100.00
‧Acer Austria GmbH (“ACV”, Austria) AHN 100.00 100.00
‧Acer Europe Services S.R.L. (“AES”, Italy) AHN 100.00 100.00
‧Acer Europe AG (“AEG”, Switzerland) AHN 100.00 100.00

Acer Incorporated 2008 Annual Report Acer Incorporated 2008 Annual Report68 69
Financial Standing
Acer Incorporated 2008 Annual Report Acer Incorporated 2008 Annual Report68 69
Percentage ofOwnership by the Company
Investor at December 31,
2007 2008
‧Acer Czech Republic S.R.O. (“ACZ”, Czech Republic) AHN 100.00 100.00
‧ESPLEX Limited (“AEX”, the United Kingdom) AHN 100.00 100.00
‧Acer Computer Iberica, S.A. (“AIB”, Spain) AHN 100.00 100.00
‧Acer Computer (Switzerland) AG (“ASZ”, Switzerland) AHN 100.00 100.00
‧Acer Slovakia s.r.o. (“ASK”, Slovakia) AHN 100.00 100.00
‧Acer International Services GmbH (“AIS”, Switzerland) AHN 100.00 100.00
‧Acer Computer Norway AS (“ACN”, Norway) ACH 100.00 100.00
‧Acer Computer Finland Oy (“AFN”, Finland) ACH 100.00 100.00
‧Acer Computer Sweden AB (“ACW”, Sweden) ACH 100.00 100.00
‧Acer Denmark A/S (“ACD”, Denmark) ACH 100.00 100.00
‧Acer CIS Incorporated (“ACR”, British Virgin Islands) AEH 100.00 100.00
‧Acer BSEC Inc. (“AUA”, British Virgin Islands) AEH - 100.00
‧Acer Computer (M.E.) Limited (“AME”, British Virgin Islands) AEH 100.00 100.00
‧Acer Africa (Proprietary) Limited (“AAF”, South Africa) AEH 100.00 100.00
‧AGP Technology AG (“AGP”, Switzerland) AHN - 100.00
‧PB Holding Company S.A.R.L. (“PBLU”, Luxembourg) AHN - 100.00
‧Packard Bell B.V (“PBHO”, the Netherlands) PBLU - 100.00
‧Packard Bell Finance B.V (“PBFN”, the Netherlands) PBHO - 100.00
‧Packard Bell Netherland B.V (“PBNL”, the Netherlands) PBHO - 100.00
‧Packard Bell Services s.a.r.l (“PBSV”, France) PBHO - 100.00
‧Packard Bell Angers s.a.r.l (“PBAN”, France) PBHO - 100.00
‧Packard Bell France s.a.s (“PBFR”, France) PBHO - 100.00
‧Packard Bell (UK) Ltd.(“PBUK”, the United Kingdom) PBHO - 100.00
‧Packard Bell Scotland Ltd. (“PBSC”, the United Kingdom) PBHO - 100.00
‧Packard Bell Iberica s.l (“PBES”, Spain) PBHO - 100.00
‧Packard Bell Italia s.r.l (“PBIT”, Italy) PBHO - 100.00
‧Packard Bell Deutschland GmbH (“PBDE”, Germany) PBHO - 100.00
‧Packard Bell Belgium BVBA (“PBBE”, Belgium) PBHO - 100.00
‧Packard Bell Sverige AB (“PBSE”, Sweden) PBHO - 100.00
‧Packard Bell Norden AS (“PBNO”, Norway) PBHO - 100.00
‧Packard Bell Schweiz GmbH (“PBCH”, Switzerland) PBHO - 100.00
‧ZDS Europe s.a.r.l (“PBFE”, France) PBHO - 100.00
‧NEC Computers South Africa (Pty) Ltd. (“PBZA”, South Africa) PBHO - 100.00
‧Packard Bell Electronic Technical Services (Shanghai) Co., Ltd. (“PBCN”, China) PBHO - 100.00
(d) Boardwalk Capital Holding Limited (“Boardwalk”, British Virgin Islands) and its subsidiaries The Company 100.00 100.00
‧Acer Service Corporation (“ASC”, U.S.A.) Boardwalk 100.00 100.00
‧Acer Computer Mexico, S.A. de C.V. (“AMEX”, Mexico) Boardwalk 99.89 99.92
‧Acer Latin America, Inc. (“ALA”, U.S.A.) Boardwalk 99.89 99.92
‧Acer American Holding Corp. (“AAH”, USA) Boardwalk 100.00 100.00
Percentage ofOwnership by the Company
Investor at December 31,
2007 2008
‧Aurion Technologie, S.A. de C.V. (“Aurion”, Mexico) AMEX 100.00 100.00
‧Gateway, Inc. (“GWI”, U.S.A.) AAH 100.00 100.00
‧Acer America Corporation. (“AAC”, U.S.A.) GWI 100.00 100.00
‧Gateway US Retail, Inc. (“GRA”, U.S.A.) GWI 100.00 100.00
‧Gateway Direct, Inc. (“GDA”, U.S.A.) GWI 100.00 100.00
‧Gateway Manufacturing LLC (“GMA”, U.S.A.) GWI 100.00 100.00
‧Gateway KK (“GJP”, Japan) GRA 100.00 100.00
‧Gateway de Mexico S. de R.L. de C.V. (“GMX”, Mexico) GWI 100.00 100.00
‧Gateway Ltd. (“GUK”, the United Kingdom) GRA 100.00 100.00
‧Gateway France SAS (“GFR”, France) GRA 100.00 100.00
‧Gateway International Holdings, Inc. (“GIH”, U.SA.) GWI 100.00 100.00
‧Gateway International Computers Limited (“GIC”, the United Kingdom) GIH 100.00 100.00
‧Gateway Canada Corporation (“GCA”, Canada) GIC 100.00 100.00
‧eMachines Internet Group (“EMA”, U.S.A.) GRA 100.00 100.00
‧Servicio Profesionales de Aceso S. de C.V. (“GSMX”, Mexico) EMA 100.00 100.00
‧Gateway Europe B.V. (“GEBV”, U.S.A.) GRA 100.00 100.00
‧Gateway Computers Ireland Ltd. (“GCI”, the) GRA 100.00 100.00
‧Gateway Hong Kong Ltd. (“GHK”, Hong Kong) GWI 100.00 100.00
‧Gateway Bermuda LP (“GBM”, Bermuda) GWI 100.00 100.00
‧Gateway Asia, inc. (“GAI”, U.S.A.) GWI 100.00 100.00
(e) Acer Holding International, Incorporated (“AHI”, British Virgin Islands) and its subsidiaries The Company 100.00 100.00
‧Acer Computer Co., Ltd. (“ATH”, Thailand) AHI 100.00 100.00
‧Acer Japan Corp. (“AJC”, Japan) AHI 100.00 100.00
‧Acer Computer Australia Pty. Limited (“ACA”, Australia) AHI 100.00 100.00
‧Acer Sales and Service Sdn. Bhd. (“ASSB”, Malaysia) AHI 100.00 100.00
‧Acer Computer (Singapore) Pte. Ltd. (“ACS”, Singapore) AHI 100.00 100.00
‧Acer Computer New Zealand Ltd. (“ACNZ”, New Zealand) AHI 100.00 100.00
‧PT Acer Indonesia (“AIN”, Indonesia) AHI 100.00 100.00
‧Acer India Private Limited (“AIL”, India) AHI 100.00 100.00
‧Acer Vietnam Co., Ltd. (“AVN”, Vietnam) AHI 100.00 100.00
‧Acer Philippines, Inc. (“APHI”, Philippines) AHI 100.00 100.00
‧Acer Asia Pacific Sdn Bhd (“AAPH, Malaysia”) AHI 100.00 100.00
‧Acer Finance Australia Pty. Ltd. (“AFA”, Australia) ACA 100.00 100.00
‧Highpoint Australia Pty. Ltd. (“HPA”, Australia) ACA 100.00 100.00
‧Highpoint Service Network Sdn. Bhd. (“HSN”, Malaysia) ASSB 100.00 100.00
‧Logistron Service Pte Ltd. (LGS, Singapore) and its subsidiaries ACS 100.00 100.00
(f) Acer Computer International Ltd. (“ACI”, Singapore) The Company 100.00 100.00
(g) Acer Sales & Distribution Ltd. (“ASD”, Hong Kong) The Company 100.00 100.00

Acer Incorporated 2008 Annual Report Acer Incorporated 2008 Annual Report70 71
Financial Standing
Acer Incorporated 2008 Annual Report Acer Incorporated 2008 Annual Report70 71
(2) Sale and distribution of computer products and electronic communication products:
Percentage ofOwnership by the Company
Investor at December 31,
2007 2008
(a) Weblink International Inc. (“WII”, Taiwan) The Company 99.79 99.79
(b) Weblink (H.K.) International Ltd. (“WHI”, Hong Kong) WII 99.79 99.79
(c) Weblink Shanghai International Limited (“WSHI”, China) WII 99.79 99.79
(d) Servex (Malaysia) Sdn Bhd (“SMA”, Malaysia) and its subsidiaries ASSB 100.00 100.00
(e) Servex International (Thailand) Co., Ltd. (“STH”, Thailand) ATH 100.00 100.00
(f) Megabuy Sdn. Bhd. (“MGB”, Malaysia) ASSB 100.00 100.00
(3) Investing and holding companies:
Percentage ofOwnership by the Company
Investor at December 31,
2007 2008
(a) Multiventure Investment Inc. (“MVI”, Taiwan) The Company 100.00 100.00
(b) Acer Digital Service Co. (“ADSC”, Taiwan) The Company 100.00 100.00
(c) Acer Worldwide Incorporated (“AWI”, British Virgin Islands) The Company 100.00 100.00
(d) Cross Century Investment Limited (“CCI”, Taiwan) The Company 100.00 100.00
(e) Acer SoftCapital Incorporated (“ASCBVI”, British Virgin Islands) The Company 100.00 100.00
(f) Acer Venture Associates (“AVA”, Cayman Islands) ASCBVI 100.00 -
(g) Acer Capital Limited (“ACBVI”, British Virgin Islands) ASCBVI 100.00 100.00
(h) ASC Cayman, Limited (“ASCCAM”, Cayman Islands) ASCBVI 100.00 100.00
(i) Acer Capital Corporation (“ACT”, Taiwan) The Company 100.00 100.00
(j) Aspire Incubation Venture Capital (“AIVC”, Taiwan) The Company 100.00 100.00
(k) Acer Digital Services (B.V.I.) Holding Corp. (“ADSBH”, British Virgin Islands) The Company 100.00 100.00
(l) Acer Digital Services (Cayman Islands) Corp. (“ADSCC”, Cayman Islands) ADSBH 100.00 100.00
(m) Nicholas Insurance Company Ltd. (“NIC”, Bermuda) GWI 100.00 100.00
(n) Acer Capital Australia Oty Ltd. (“ACAP”, Australia) ACBVI 100.00 100.00
(o) Acer Technology Venture Asia Pacific Ltd. (“ATVAP”, British Virgin Islands) ASCBVI 100.00 100.00
(p) Eten Investment Co., Ltd. (“ETO”, Taiwan) ETEN - 100.00
(q) Protek Investment Co., Ltd.(“PTO”, Taiwan) ETEN - 100.00
(r) Toptek Investment Co., Ltd. (“DTO”, Taiwan) ETEN - 100.00
(s) Eten International Holdings Ltd. (“EIH”, British Virgin Islands) DTO - 100.00
(4) Research, design, and sale of smart handheld products:
Percentage ofOwnership by the Company
Investor at December 31,
2007 2008
(a) E-ten Information System Co., Ltd. (“ETEN”, Taiwan) The Company - 100.00
(b) Eten China Information System Co., Ltd. (“CETEN”, China) EIH - 100.00
(5) Property development:
Percentage ofOwnership by the Company
Investor at December 31,
2007 2008
(a) Acer Property Development Inc. (“APDI”, Taiwan) ADSC 100.00 100.00
(b) Aspire Service & Development Inc. (“ASDI”, Taiwan) ADSC 100.00 100.00
(6) E-commerce, electronic data supply or processing service, data storage and processing:
Percentage ofOwnership by the Company
Investor at December 31,
2007 2008
(a) EB Easy Business Services Limited (“AGES”, Hong Kong) ADSCC 85.00 85.00
(b) EB Easy (TWN) Corp. (“AGEST”, Taiwan) AGES 85.00 Note 4(10)
(c) Acer Cyber Center Services Ltd. (“ACCSI”, Taiwan) The Company 100.00 100.00
(d) Lottery Technology Service Corp. (“LTS”, Taiwan) The Company 100.00 100.00
(e) Minly Corp. (“MINLY”, Taiwan) The Company 100.00 100.00
(7) Software research, development, design, trading and consultation:
Percentage ofOwnership by the Company
Investor at December 31,
2007 2008
(a) TWP Corporation (“TWP”, Taiwan) The Company 100.00 -
(b) Acer TWP Innovation Information Co. Ltd. (ATIM, Taiwan) TWP 100.00 -
(c) TWP International Inc. (“TWP BVI”, British Virgin Islands) ACCSI 100.00 100.00
(d) Acer Third Wave Software (Beijing) Co., Ltd. (“TWPBJ”, China) TWPBVI 100.00 100.00

Acer Incorporated 2008 Annual Report Acer Incorporated 2008 Annual Report72 73
Financial Standing
Acer Incorporated 2008 Annual Report Acer Incorporated 2008 Annual Report72 73
The Company completed the acquisition of 100% of the shares of Gateway, Inc. on October 15, 2007 (refer to note 4(14)). Gateway, Inc. and its subsidiaries are included in the consolidated financial statements from the date of the acquisition.
In July and September 2007, the Company sold all its ownership interest in Sertek Incorporated (“SNX”) and Digital Computer System Co. (“DCS”), respectively. As a result, SNX and DCS are excluded from the consolidated financial statements from the dates of sale.
In October 2007, the Company reduced its investment in AMT to an ownership interest of less than 50% and no longer held a controlling interest in AMT. AMT is excluded from the consolidated financial statements from the date of sale.
In March and June of 2008, the Company completed its acquisition of 100% of the shares of PB Holding Company S.A.R.L and its subsidiaries. In September 2008, the Company also completed its acquisition of 100% of the shares of E-ten Information System Co., Ltd. and its subsidiaries. The Company has included the results of operations of the acquired business in the consolidated financial statements as of the date of each acquisition. Additionally, the Company established new subsidiaries AGP and AAPH. In November 2008, ACCSI merged with TWP and its subsidiaries.
2. Summary of Significant Accounting Policies
(1) Accounting principles and consolidation policy
The consolidated financial statements are prepared in accordance with accounting principles generally accepted in the Republic of China. These consolidated financial statements are not intended to present the financial position and the related results of operations and cash flows of the Consolidated Companies based on accounting principles and practices generally accepted in countries and jurisdictions other than the ROC.
The consolidated financial statements include the accounts of the Company and subsidiaries in which the Company is able to exercise control over the subsidiary’s operations and financial policies. The operating activity of the subsidiary is included in the consolidated statements of income from the date that control commences until the date that control ceases. All significant inter-company balances and transactions are eliminated in consolidation.
(2) Use of estimates
The preparation of the accompanying consolidated financial statements requires management to make estimates and assumptions that affect the reported amounts of assets and liabilities and disclosures of contingent assets and liabilities at the date of the consolidated financial statements and reported amounts of revenues and expenses during the reporting periods. Economic conditions and events could cause actual results to differ significantly from such estimates.
(3) Foreign currency transactions and translations
The Company’s reporting currency is the New Taiwan dollar. The Consolidated Companies record transactions in their respective functional currencies, which generally are the local currency of the primary economic environment in which these entities operate. Non-derivative foreign currency transactions are recorded at the exchange rates prevailing at the transaction date. At the balance sheet date, monetary assets
and liabilities denominated in foreign currencies are translated into New Taiwan dollars using the exchange rates on that date. The resulting unrealized exchange gains or losses from such translations are reflected in the accompanying statements of income. Non-monetary assets and liabilities denominated in foreign currency that are measured in terms of historical cost are translated using the exchange rate at the date of the transaction. Non-monetary assets and liabilities denominated in foreign currency that are measured at fair value are reported at the rate that was in effect when the fair values were determined. Subsequent adjustments to carrying values of such non-monetary assets and liabilities, including the effects of changes in exchange rates, are reported in profit or loss for the period, except that if movement in fair value of a non-monetary item is recognized directly in equity, any foreign exchange component of that adjustment is also recognized directly in equity.
In preparation of the consolidated financial statements, a remeasurement of the foreign subsidiaries’ financial statements into the functional currency is performed first, and the remeasuring differences are accounted for as exchange gains or losses in the accompanying statements of income. Translation adjustments resulting from the translation of foreign currency financial statements into the Company’s reporting currency and a monetary item that forms part of the Company’s net investment in a foreign operation are accounted for as translation adjustment, a separate component of stockholders’ equity.
(4) Classification of current and non-current assets and liabilities
Cash or cash equivalents, and assets that will be held primarily for the purpose of being traded or are expected to be realized within 12 months after the balance sheet date are classified as current assets; all other assets shall be classified as non-current.Liabilities that will be held primarily for the purpose of being traded or are expected to be settled within 12 months after the balance sheet date are classified as current liabilities; all other liabilities shall be classified as non-current.
(5) Cash and cash equivalents
Cash and cash equivalents consist of cash on hand, cash in banks, miscellaneous petty cash, and other highly liquid investments which do not have a significant level of market or credit risk from potential interest rate changes.
(6) Allowance for doubtful accounts
Allowance for doubtful accounts is provided based on the collectibility, aging and quality analysis of notes and accounts receivable.
(7) Inventories
Inventories for the Acer brand information technology business group are stated at the lower of cost or market value. Market value represents net realizable value. Costs of inventory are determined using the weighted-average method. For channel business, costs of inventory are determined using the first-in, first-out method.
(8) Financial instruments
The Consolidated Companies adopted transaction-date accounting for financial instrument transactions. Upon initial recognition, financial instruments are evaluated at fair value plus, in the case of a financial instrument not at fair value through profit or loss, transaction costs that are directly attributable to the acquisition or issue of the financial instrument. Subsequent to initial recognition, financial instruments are classified into the following categories in accordance with the purpose of holding or issuing of such financial instruments:

Acer Incorporated 2008 Annual Report Acer Incorporated 2008 Annual Report74 75
Financial Standing
Acer Incorporated 2008 Annual Report Acer Incorporated 2008 Annual Report74 75
(a) Financial assets/liabilities at fair value through profit or loss
An instrument is classified as at fair value through profit or loss if it is held for trading or is designated as such upon initial recognition. Derivatives that do not meet the criteria for hedge accounting are classified as financial assets or liabilities at fair value through profit or loss. Financial instruments at fair value through profit or loss are measured at fair value, and changes therein are recognized in profit or loss.
(b) Hedging derivative financial assets / liabilities
Hedging derivative financial assets / liabilities represent derivatives that are to hedge the risk of changes in exchange rates resulting from operating activities denominated in foreign currency and meet the criteria for hedge accounting.
(c) Hedging derivative financial assets / liabilities
Hedging derivative financial assets / liabilities represent derivatives that are to hedge the risk of changes in exchange rates resulting from operating activities denominated in foreign currency and meet the criteria for hedge accounting.
(d) Available-for-sale financial assets
Available-for-sale financial assets are measured at fair value and changes therein, other than impairment losses and foreign exchange gains and losses on available-for-sale monetary items, are recognized in a separate line item in stockholders’ equity. When an investment is derecognized, the cumulative unrealized gain or loss recognized in equity is transferred to profit or loss. If there is objective evidence which indicates that a financial asset is impaired, a loss is recognized in profit or loss. If, in a subsequent period, events or changes in circumstances indicate that the amount of impairment loss decreases, reversal of a previously recognized impairment loss for equity securities is charged to equity; while for debt securities, the reversal is allowed through profit or loss provided that the decrease is clearly attributable to an event which occurred after the impairment loss was recognized.
(e) Financial assets carried at cost
Equity investments whose fair value cannot be reliably measured are carried at original cost. If there is objective evidence which indicates that an equity investment is impaired, a loss is recognized. A subsequent reversal of such impairment loss is not allowed.
(9) Derivative financial instruments and hedging activities
Hedge accounting recognizes the offsetting effects on profit or loss of changes in the fair values of the hedging instrument and the hedged item. If the designated hedging instruments meet the criteria for hedge accounting, they are accounted for as follows:
(a) Fair value hedges
Changes in the fair value of a hedging instrument designated as a fair value hedge are recognized in profit or loss. The hedged item is also stated at fair value in respect of the risk being hedged, with any gain or loss being recognized in profit or loss.
(b) Cash flow hedges
Changes in the fair value of a hedging instrument designated as a cash flow hedge are recognized directly
in equity. If a hedge of a forecasted transaction subsequently results in the recognition of an asset or a liability, then the amount recognized in equity is reclassified into profit or loss in the same period or periods during which the asset acquired or liability assumed affects profit or loss.
(10) Noncurrent assets held for sale and discontinued operation
Noncurrent assets and groups of assets and liabilities which comprise disposal groups are classified as “held for sale” when all of the following criteria are met: a decision has been made to sell, the assets are available for immediate sale in their present condition subject only to terms that are usual and customary for sales of such assets (or disposal groups), and their sale within one year is highly probable. Noncurrent assets or disposal groups classified as “held for sale” are measured at the lower of their book value or fair value less costs to sell. Noncurrent assets or disposal groups classified as held for sale are not depreciated, amortized or depleted. Total assets and total liabilities are each shown separately and excluded from the individual line items of the consolidated balance sheets. Interest and other expenses attributable to the liabilities of a disposal group classified as held for sale shall continue to be recognized.
An impairment loss is recognized for any initial or subsequent write-down of the assets (or disposal groups) to fair value less costs to sell in the consolidated statements of income. A gain from any subsequent increase in fair value less costs to sell of an asset (or a disposal group) shall be recognized, but not in excess of the cumulative impairment loss that has been recognized.
A discontinued operation is a component of an entity that either has been disposed of or is classified as held for sale. A component of an entity comprises operations and cash flows that can be distinguished clearly, both operationally and for financial reporting purposes, from the rest of the entity. A component that previously was held for use will have been one or more cash-generating units.
(11) Equity method investments
Long-term equity investments in which the Consolidated Companies, directly or indirectly, own 20% or more of the investee’s voting shares, or less than 20% of the investee’s voting shares but are able to exercise significant influence over the investee’s operating and financial policies, are accounted for using the equity method. Prior to January 1, 2006, differences between the acquisition cost and net equity of the investee that could not be attributed to any reason were amortized over five years as investment income or losses.
The Consolidated Companies adopted amended SFAS No. 5 “Long-term Investments under Equity Method” commencing from January 1, 2006. The investment cost in excess of fair values of identifiable net assets is recorded as investor-level goodwill. Investor-level goodwill is no longer amortized but tested for impairment. Differences between investment cost and net equity of the investee in the previous investments that cannot be attributed to any reason and were originally amortized over five years are no longer amortized starting from January 1, 2006.
When an equity-method investment is disposed of, the difference between the selling price and the book value of the equity-method investment is recognized as disposal gain or loss in the accompanying consolidated statements of income. If there are capital surplus and separate components of shareholders’ equity resulting from such equity investments, they are charged as a reduction to disposal gain/loss based on the disposal ratio of investments.
If an investee company issues new shares and the Company does not acquire new shares in proportion to its original ownership percentage, the Company’s equity in the investee’s net assets will be changed. The change in the equity interest shall be used to adjust the capital surplus and long-term investment accounts. If the Company’s capital surplus is insufficient to offset the adjustment to long-term investment, the difference is charged as a reduction of retained earnings.

Acer Incorporated 2008 Annual Report Acer Incorporated 2008 Annual Report76 77
Financial Standing
Acer Incorporated 2008 Annual Report Acer Incorporated 2008 Annual Report76 77
Unrealized gains and losses resulting from transactions between the Consolidated Companies and investees accounted for under the equity method are deferred to the extent of the Company’s ownership. The gains and losses resulting from depreciable or amortizable assets are recognized over the estimated useful lives of such assets. Gains and losses from other assets are recognized when realized.
(12) Capital leases
For capital leases, where the Consolidated Companies act as the lessor, the Consolidated Companies account for all periodic rental payments plus bargain purchase price or estimated residual value as lease payment receivables. The present value of all lease payment receivables, discounted at the implicit interest rate, is recorded as revenue. The difference between the lease payment receivables and the revenue is the unearned interest revenue, recognized over the lease term using the effective interest method.
(13) Property, plant and equipment, property leased to others, and property not in use
Property, plant and equipment are stated at acquisition cost. Interest expense related to the purchase and construction of property, plant and equipment is capitalized and included in the cost of the related asset. Significant renewals, improvements and replacements are capitalized. Maintenance and repair costs are charged to expense as incurred. Gains and losses on the disposal of property, plant and equipment are recorded in the non-operating section in the accompanying consolidated statements of income.
Commencing from November 20, 2008, the Company capitalized retirement or recovery obligation for newly acquired property and equipment in accordance with Interpretation (97) 340 issued by the Accounting Research and Development Foundation. A component which is significant in relation to the total cost of the property and equipment and for which a different depreciation method or rate is appropriate should be depreciated separately. The Company evaluates the estimated useful lives, depreciation method and residual value at the end of each year. Changes in the estimated useful lives, depreciation method and residual value are accounted for as changes in accounting estimates.
Depreciation is provided for property, plant and equipment, property leased to others, and property not in use over the estimated useful life using the straight-line method. The estimated useful lives of the respective classes of assets are as follows:
1. Buildings and improvements: 20~50 years2. Computer equipment and machinery: 3~5 years3. Transportation equipment: 3~5 years4. Office and other equipment: 3~10 years5. Leasehold improvement: 1~10 years
Property leased to others and property not in use are classified to other assets and continue to be depreciated and tested for impairment.
(14) Intangible assets
Goodwill arising from a business combination was previously amortized using the straight-line method over five years. In accordance with the amended SFAS No. 25 “Business Combinations”, goodwill is no longer amortized but is tested for impairment annually.
Other intangible assets, including patents, trademarks and trade names, customer relationships, developed technology and purchased software, are stated at cost. Intangible assets with finite useful lives are amortized using the straight-line method over the expected useful lives. The estimated useful lives are as follows:
1. Patents: 10~16 years2. Purchased software: 3~7 years3. Customer relationships: 7~10 years4. Developed technology: 10 years5. Trademarks and trade names: 20 years
The Gateway, Packard Bell and Eten trademarks and trade names are intangible assets with indefinite useful lives. They are not amortized, but are assessed for impairment on a yearly basis. The useful life of an intangible asset not subject to amortization shall be reviewed each period to determine whether events and circumstances continue to support an indefinite useful life assessment for that asset. Any change in the useful life assessment from indefinite to finite shall be accounted for as a change in accounting estimate.
Effective January 1, 2007, the Consolidated Companies adopted SFAS No. 37 “Intangible Assets”. At initial adoption, the Consolidated Companies reassessed the useful lives and amortization methods of the recognized intangible assets. No change has been made.
(15) Non-financial asset impairment
The Consolidated Companies assess at each balance sheet date whether there is any indication that long-lived assets and certain identifiable intangible assets may have been impaired. If any such indication exists, the Consolidated Companies estimate the recoverable amount of the assets. The Consolidated Companies recognize impairment loss for an asset whose carrying value is higher than the recoverable amount. An impairment loss recognized in prior periods is reversed if there is any indication that the impairment loss recognized no longer exists or has decreased. The carrying value after the reversal should not exceed the recoverable amount or the depreciated or amortized balance of the assets assuming no impairment loss was recognized in prior periods.
Goodwill and assets that have an indefinite useful life or are not yet available for use are not subject to amortization and are tested annually for impairment. An impairment loss is recognized for the amount by which the asset’s carrying amount exceeds its recoverable amount.
(16) Deferred charges
Deferred charges are stated at cost and primarily consist of additions and improvements to office buildings and other deferred charges. These costs are amortized using the straight-line method over their estimated useful lives.
(17) Treasury stock
Common stock repurchased by the Company is accounted for at acquisition cost. Upon disposal of the treasury stock, the sale proceeds in excess of cost are accounted for as capital surplus ‒ treasury stock. If the sale proceeds are less than cost, the deficiency is accounted for as a reduction of the remaining balance of capital surplus ‒ treasury stock. If the remaining balance of capital surplus ‒ treasury stock is insufficient to cover the deficiency, the remainder is recorded as a reduction of retained earnings. The cost of treasury stock is computed using the weighted-average method.
If treasury stock is retired, the weighted-average cost of the retired treasury stock is written off to offset the par value and the capital surplus premium, if any, of the stock retired. If the weighted-average cost written off exceeds the sum of both the par value and the capital surplus premium, the difference is accounted for as a reduction of capital surplus ‒ treasury stock, or a reduction of retained earnings for any deficiency where capital surplus ‒ treasury stock is insufficient to cover the difference. If the weighted-average cost written
Acer Incorporated 2008 Annual Report Acer Incorporated 2008 Annual Report78 79
Financial Standing
Acer Incorporated 2008 Annual Report Acer Incorporated 2008 Annual Report78 79
off is less than the sum of both the par value and capital surplus premium, if any, of the stock retired, the difference is accounted for as an increase in capital surplus ‒ treasury stock.
The Company’s common stock held by its subsidiaries is accounted for as treasury stock. Cash dividends paid by the Company to its consolidated subsidiaries that hold the treasury stock are accounted for as capital surplus ‒ treasury stock.
(18) Revenue recognition
Revenue from sales of products is recognized at the time products are delivered and the significant risks and rewards of ownership are transferred to customers. Revenue generated from service is recognized when the service is provided and the amount becomes billable.
(19) Employee bonuses and directors’ and supervisors’ remuneration
Employee bonuses and directors’ and supervisors’ remuneration appropriated after January 1, 2008, are accounted for according to Interpretation (96) 052 issued by the Accounting Research and Development Foundation. The Company estimates the amount of employee bonuses and directors’ and supervisors’ remuneration according to the Interpretation and recognizes it as operating expense. Differences between the amount approved in the shareholders’ meeting and recognized in the financial statements, if any, are accounted for as changes in accounting estimates and recognized in profit or loss.
(20) Share-based payment transactions
Effective January 1, 2008, the Company adopted SFAS No. 39 “Accounting for Share-based Payment” for its share-based payments granted on or after January 1, 2008.
Equity-settled share-based payments are measured at fair value at the date of grant. The fair value determined at the grant date of the equity-settled share-based payments is expensed over the vesting period, and the corresponding increase in equity is recognized. The vesting period is the period during which all the specified vesting conditions of the share-based payment arrangement are to be satisfied. The vesting conditions include service conditions and performance conditions (including market conditions). When estimating the fair value of the transactions, vesting conditions, other than market conditions, shall not be taken into account.
For cash-settled share-based payments, a liability equal to the portion of the services received is recognized at its current fair value determined at each balance sheet date and at the date of settlement, with any changes in the fair value recognized in profit or loss of the period.
Fair value is measured by the use of the Black-Scholes or the binomial option pricing model, based on management’s best estimate of the exercise price, expected term, underlying share price, expected volatility, expected dividends, risk-free interest rate, and any other inputs to the model.
(21) Administrative expenses
The Company’s administrative expenses include direct expenses incurred for the business unit within the Company and expenses incurred for managing the investee companies. To reflect the operating income of the Consolidated Companies, administrative expenses are divided into two parts. The first part, representing the direct expenses incurred for the Consolidated Companies, is included as administrative expenses in the accompanying consolidated statements of income. The second part, representing expenses incurred for managing the investee companies, is presented as a reduction of net investment income (loss) in the consolidated statements of income.
(22) Retirement plan
(a) Defined benefit retirement plans
The Company and its domestic subsidiaries established individual noncontributory defined benefit retirement plans (the “Plans”) and retirement fund administration committees. The Plans provide for lump-sum retirement benefits to retiring employees based on length of service, age, and certain other factors. In accordance with the requirements of the ROC Labor Standards Law, the funding of retirement plans by the Company and its domestic subsidiaries is based on a percentage of employees’ total salaries. The funds are deposited with Bank of Taiwan or other banks.
Under the defined benefit retirement plan, the Consolidated Companies recognize a minimum pension liability equal to the amount by which the actuarial present value of the accumulated benefit obligation exceeds the fair value of the retirement plan’s assets. The Consolidated Companies also recognize the net periodic pension cost based on an actuarial calculation.
(b) Defined contribution retirement plans
Starting from July 1, 2005, pursuant to the ROC Labor Pension Act (the “New System”), employees who elected to participate in the New System or commenced working after July 1, 2005, are subject to a defined contribution plan under the New System. For the defined contribution plan, the Company and its domestic subsidiaries contribute monthly an amount equal to 6% of each employee’s monthly salary to an individual labor pension fund account.
Most of the Company’s foreign subsidiaries adopt defined contribution retirement plans. These plans are funded in accordance with the regulations of their respective countries. Contributions made for the defined contribution retirement plans are expensed as incurred.
(23) Income taxes
Income taxes are accounted for under the asset and liability method. Deferred income tax is determined based on differences between the financial statements and tax basis of assets and liabilities using enacted tax rates in effect during the years in which the differences are expected to reverse. The income tax effects resulting from taxable temporary differences are recognized as deferred income tax liabilities. The income tax effects resulting from deductible temporary differences, net operating loss carryforwards, and income tax credits are recognized as deferred income tax assets. The realization of the deferred income tax assets is evaluated, and if it is considered more likely than not that the asset will not realized, a valuation allowance is recognized accordingly.
Classification of the deferred income tax assets or liabilities as current or noncurrent is based on the classification of the related asset or liability. If the deferred income tax asset or liability is not directly related to a specific asset or liability, then the classification is based on the asset’s or liability’s expected realization date.
The investment tax credits granted for purchases of equipment, research and development expenses, and training expenses are recognized in the current period.
According to the ROC Income Tax Act, undistributed earnings, if any, earned after December 31, 1997, are subject to an additional 10% retained earnings tax. The surtax is accounted for as income tax expense in the following year when the stockholders decide not to distribute the earnings.
Acer Incorporated 2008 Annual Report Acer Incorporated 2008 Annual Report80 81
Financial Standing
Acer Incorporated 2008 Annual Report Acer Incorporated 2008 Annual Report80 81
(24) Earnings per common share
Basic earnings per common share are based on net income divided by the weighted-average number of outstanding common shares. The increase in the number of outstanding shares through non-compensated distribution of shares (distribution of stock dividends from retained earnings or capital surplus or employee bonus) is included in the outstanding shares retroactively.
Additionally, as the Company can choose to distribute employee bonuses by issuing stock shares, the computation of diluted earnings per share is based on the assumption that all employee bonuses are distributed in stock shares as of the balance sheet date.
(25) Business combination
Business combinations are accounted for in accordance with SFAS No. 25 “Business Combinations”. Acquisition costs represent the amount of cash or cash equivalents paid and the fair value of the other purchase consideration given, plus any costs directly attributable to the acquisition. The excess of acquisition cost over the fair value of the net identifiable tangible and intangible assets is recognized as goodwill.
(26) Convenience translation into U.S. dollars
The consolidated financial statements are stated in New Taiwan dollars. Translation of the 2008 New Taiwan dollar amounts into U.S. dollar amounts, using the spot rate on December 31, 2008, of NT$32.818 to US$1, is included solely for the convenience of the readers. The convenience translations should not be construed as representations that the New Taiwan dollar amounts have been, could have been, or could in the future be, converted into U.S. dollars at this or any other rate of exchange.
3. Accounting Changes
Effective on January 1, 2008, the Consolidated Company recognized and measured share-based payment transactions, employee bonuses, and directors’ and supervisors’ remuneration according to Statement of Financial Accounting Standards (SFAS) No. 39 “Accounting for Share-based Payment” and Interpretation (96) 052 issued by the Accounting Research and Development Foundation. As a result, the Consolidated Company recognized employee bonus and directors’ and supervisors’ remuneration expenses of NT$1,586,563. The aforementioned changes in accounting principle resulted in the decrease in consolidated net income after tax and basic earnings per share for the year ended December 31, 2008, of NT$1,483,776 thousand and NT$0.60, respectively. Additionally, in accordance with Interpretation (97) 169 issued by the Accounting Research and Development Foundation, if the stock dividends to employees as bonuses are potentially dilutive, they should be accounted for in diluted earnings per common share.
4. Significant Account Disclosures
(1) Cash and cash equivalents
December 31, 2007 December 31, 2008
NT$ NT$ US$
Cash on hand 55,207 878,683 26,774
Bank deposits 14,908,552 13,690,489 417,164
Time deposits 22,981,580 7,572,553 230,744
37,945,339 22,141,725 674,682
(2) Notes and accounts receivable
The Consolidated Companies entered into factoring contracts with several banks to sell certain of their accounts receivable without recourse. As of December 31, 2007 and 2008, details of the contracts were as follows:
December 31, 2007
Buyer
Factored amount
Factoring
credit limit
Advance amount (Derecognized
amount)
Interest rate
Collateral
ABN AMRO Bank $ 72,068 72,068 72,068 -
La Caixa Bank 4,415,967 6,577,855 4,415,967 -
Ifitalia Factor S.P.A. 4,598,145 12,183,229 - -
Standard Chartered Bank 596,346 1,777,960 596,346 -
China Trust Bank 254,498 1,800,000 254,498 note 7(4)
Taipei Fubon Bank 823,824 1,000,000 823,824 note 7(4)
$ 10,760,848 23,411,112 6,162,703 1.62%~6.00%
December 31, 2008
Buyer
Factored amount
Factoring
credit limit
Advance amount (Derecognized
amount)
Interest rate
Collateral
IFITALIA $ 10,018,176 11,226,373 2,866,914 -
ABN AMRO Bank 4,208,716 7,314,804 2,292,296 -
Standard Chartered Bank 2,213,795 6,563,600 2,213,795 -
Emirates Bank International 415,867 1,082,994 415,867 -
China Trust Bank 281,695 1,965,000 190,972 note 7(4)
Taipei Fubon Bank 514,716 1,000,000 514,716 note 7(4)
$ 17,652,965 29,152,771 8,494,560 1.51%~5.9%

Acer Incorporated 2008 Annual Report Acer Incorporated 2008 Annual Report82 83
Financial Standing
Acer Incorporated 2008 Annual Report Acer Incorporated 2008 Annual Report82 83
(3) Other receivable
December 31, 2007
December 31,2008
NT$ NT$ US$
Refundable income tax and VAT receivable 2,780,212 2,001,212 60,979
Other receivable 4,595,357 6,806,242 207,394
7,375,569 8,807,454 268,373
(4) Available-for-sale financial assets ‒ current
December 31,2007
December 31,2008
NT$ NT$ US$
Mutual funds 662,096 - -
Publicly traded equity securities 2,112,196 145,147 4,423
Others 77,769 446,297 13,599
2,852,061 591,444 18,022
In 2007 and 2008, the Consolidated Companies disposed of portions of these investments and recognized gains on disposal thereof of NT$2,057,447 and NT$1,187,156, respectively. The gains were recorded as “gain on disposal of investments” in the accompanying consolidated statements of income.
(5) Financial assets and liabilities at fair value through profit or loss
December 31, 2007
December 31,2008
NT$ NT$ US$
Financial assets at fair value through profit or loss ‒ current:
Foreign currency forward contracts 14,999 339,817 10,355
Foreign currency options 4,983 - -
Cross currency swaps - 7,821 238
Foreign exchange swaps - 7,113 217
19,982 354,751 10,810
December 31, 2007
December 31,2008
NT$ NT$ US$
Financial liability at fair value through profit or loss ‒ current:
Foreign currency forward contracts (1,394,549) (1,011,739) (30,829)
Foreign currency options (593) - -
(1,395,142) (1,011,739) (30,829)
As of December 31, 2007 and 2008, unrealized loss resulting from the changes in fair value of these derivative contracts amounted to NT$(272,939) and NT$718,172, respectively.
As of December 31, 2007 and 2008, the Consolidated Companies entered into foreign currency forward contracts and foreign currency options to hedge their exposure to the foreign currency exchange rate risk generated by operating activities. The derivative financial instruments that did not meet the criteria for hedge accounting (classified as financial assets and liabilities at fair value through profit or loss) were as follows:
(a) Foreign currency options:(i) Long options:
December 31, 2007
Notional amount(in thousands)
Maturity date
EUR CALL/GBP PUT EUR 3,487 2008/02/27
(ii) Short options
December 31, 2007
Notional amount Maturity date
(in thousands)
GBP CALL/EUR PUT EUR 3,835 2008/02/27
(b) Foreign currency forward contracts:
December 31, 2007
Notional amount(in thousands)
Settlement date
Buy Sell
USD / ZAR USD 24,222 2008/01/02~2008/02/29
USD / SGD USD 15,000 2008/01/16~2008/03/31
USD / EUR EUR 663,000 2008/01/16~2008/02/29
USD / INR USD 50,536 2008/01/16~2008/05/30
USD / JPY USD 16,500 2008/01/15~2008/05/16
USD / RMB USD 15,000 2008/01/30~2008/03/31
USD / THB USD 18,000 2008/01/15~2008/02/15
USD / MYR USD 21,865 2008/01/15~2008/03/17
USD / NTD USD 24,000 2008/01/09~2008/01/31
Acer Incorporated 2008 Annual Report Acer Incorporated 2008 Annual Report84 85
Financial Standing
Acer Incorporated 2008 Annual Report Acer Incorporated 2008 Annual Report84 85
December 31,2008
Notional amount(in thousand)
Settlement date
Buy Sell
USD / SGD USD 7,000 2009/01/14~2009/02/26
USD / CAD USD 47,806 2009/01/28~2009/02/26
EUR / CHF EUR 19,000 2008/01/05~2009/03/30
USD / EUR EUR 720,000 2009/01/15~2009/02/21
USD / INR USD 61,600 2009/01/06~2009/05/29
USD / MYR USD 19,138 2009/01/14~2009/02/17
USD / PHP USD 500 2009/01/15
USD / THB USD 28,700 2009/01/14~2009/05/29
USD / RMB USD 70,000 2009/02/02~2009/03/30
USD / JPY USD 5,000 2009/01/14
USD / NTD USD 5,000 2009/01/09~2009/01/22
(c) Cross currency swaps:
December 31, 2008
Notional amount (in thousands)
Settlement Date
Interest Interest due date
Swap-in SGD35,000/ 2009/01/23 Pay USD fixed rate: 0.66% Principal and interest
Swap-out USD 24,221 Collect SGD fixed rate: 1.00% paid in full when due
(d) Foreign exchange swaps:
December 31, 2008
Notional amount (in thousands) Settlement date
Swap-in USD / Swap-out NTD USD 160,000 / NTD 5,243,200 2009/01/15
(6) Hedging derivative financial assets and liabilities
The fair values of derivative financial instruments were accounted for under the following accounts:
December 31, 2007 December 31, 2008
NT$ NT$ US$
Hedging derivative financial assets – current:
Foreign currency forward contracts 235,198 962,268 29,321
Foreign currency options - 60,514 1,844
235,198 1,022,782 31,165
Hedging derivative financial liabilities – current
Foreign currency forward contracts (66,786) (848,740) (25,862)
Foreign currency options - (23,298) (710)
(66,786) (872,038) (26,572)
The Consolidated Companies entered into foreign currency forward contracts and foreign currency options to hedge their exposure to changes in cash flows associated with foreign currency exchange risk resulting from anticipated transactions denominated in foreign currencies.
As of December 31, 2007 and 2008, hedged items designated as fair value hedges and their respective hedging derivative financial instruments were as follows:
Fair value of hedging instruments
Hedged Items Hedging instruments December 31, 2007 December 31, 2008
Accounts receivable/ payable Foreign currency forward
denominated in foreign contracts and foreign 152,576 424,309
currencies currency options
On December 31, 2007 and 2008, the Consolidated Company recognized the realized remeasurement gain from the derivative financial assets and liabilities designated as fair value hedges in the amount of NTD394,271 thousand and NTD271,733 thousand, respectively.
As of December 31, 2007 and 2008, hedged items designated as cash flow hedges and their respective hedging derivative financial instruments were as follows:
December 31, 2007
Hedged items Hedging instrumentsFair value of hedging
instruments
Expected period of cash flow
Expected period of recognition in
earnings
Accounts payable denominated Foreign currency forward
in foreign currencies contracts 15,836 2008/01~04 2008/01~04
December 31, 2008
Hedged items Hedging instrumentsFair value of hedging
instruments
Expected period of cash flow
Expected period of recognition in
earnings
Accounts payable denominated Foreign currency forward
in foreign currencies contracts and foreign (273,565) 2009/01~05 2009/01~05
currency options

Acer Incorporated 2008 Annual Report Acer Incorporated 2008 Annual Report86 87
Financial Standing
Acer Incorporated 2008 Annual Report Acer Incorporated 2008 Annual Report86 87
As of December 31, 2007 and 2008, details of financial instruments described above that were outstanding were as follows:
(a) Foreign currency options
(i) Long position
December 31, 2008
Notional amount (in thousands) Maturity date
USD CALL/AUD PUT USD 6,445 2009/01/28~2009/02/25
EUR CALL/GBP PUT EUR 43,257 2009/01/30~2009/03/31
USD CALL/EUR PUT USD 6,000 2009/01/30
NZD CALL/USD PUT USD 1,000 2009/01/28~2009/02/25
EUR CALL/NOK PUT EUR 4,200 2009/01/15
EUR CALL/SEK PUT EUR 3,900 2009/01/15
(ii) Short position
December 31, 2008
Notional amount (in thousands) Maturity date
AUD CALL/USD PUT USD 6,445 2009/01/28~2009/02/25
GBP CALL/EUR PUT EUR 55,984 2009/01/30~2009/03/31
EUR CALL/USD PUT USD 6,000 2009/01/30
USD CALL/NZD PUT USD 1,000 2009/01/28~2009/02/25
NOK CALL/EUR PUT EUR 4,200 2009/01/15
SEK CALL/EUR PUT EUR 5,850 2009/01/15
(b) Foreign currency forward contracts
December 31, 2007
Notional amount (in thousands)
Settlement date
Buy Sell
EUR / NOK EUR 9,000 2008/01/15
EUR / SEK EUR 8,500 2008/01/15
EUR / GBP EUR 170,577 2008/01/31~2008/04/16
USD / EUR USD 77,666 2008/01/01~2008/03/31
USD / AUD USD 50,268 2008/01/11~2008/02/28
USD / NZD USD 5,940 2008/01/31~2008/03/31
AUD / NZD AUD 3,531 2008/01/07~2008/02/05
USD / CAD USD 4,094 2008/02/19~2008/02/28
December 31, 2008
Notional amount (in thousands) Settlement date
Buy Sell
USD / AUD USD 68,190 2009/01/30~2009/05/29
AUD / USD USD 11,867 2009/01/30~2009/04/30
USD / CAD USD 39,095 2009/02/26~2009/04/30
EUR / DKK EUR 94 2009/01/15
USD / EUR EUR 252,798 2009/01/30~2009/03/16
EUR / GBP EUR 165,369 2009/01/15~2009/02/27
EUR / NOK EUR 14,311 2009/01/13~2009/02/27
USD / NZD USD 4,500 2009/01/30~2009/05/29
EUR / SEK EUR 19,612 2009/01/13~2009/02/27
USD / JPY USD 70,000 2009/01/15~2009/05/29
USD / ZAR USD 17,300 2009/01/15~2009/03/31
USD / MXN USD 90,000 2009/01/09~2009/04/17
(c) Foreign exchange swap
December 31, 2008
Notional amount (in thousands) Settlement date
Swap-in SEK/Swap-out EUR SEK 17,000 / EUR 1,554 2009/01/15
(7) Inventories
December 31, 2007
December 31, 2008
NT$ NT$ US$
Raw materials 12,452,588 14,528,727 442,706
Work in process 27,322 49,437 1,506
Finished goods 13,809,255 16,907,906 515,202
Spare parts 3,982,372 4,544,547 138,477
Inventories in transit 7,630,204 9,233,802 281,364
Less: provision for inventory obsolescence and net realizable value (4,086,044) (5,236,224) (159,553)
33,815,697 40,028,195 1,219,702
(8) Noncurrent assets held for sale
In December 2007, the Company’s subsidiary ACI planned to sell its office building located in Singapore. As a result, the office building, recorded at NT$764,718, was reclassified to noncurrent asset held for sale under “prepayments and other current assets” in the accompanying consolidated balance sheet as of December 31, 2007. In March 2008, the sale of the office building was completed.

Acer Incorporated 2008 Annual Report Acer Incorporated 2008 Annual Report88 89
Financial Standing
Acer Incorporated 2008 Annual Report Acer Incorporated 2008 Annual Report88 89
(9) Financial assets carried at cost ‒ noncurrent
December 31, 2007 December 31, 2008
NT$ NT$ US$
Privately held stock:
National Securities Corp. 12,188 - -
Prosperity Venture Capital Corp. 28,000 21,000 640
Sheng-Hua Venture Capital Corp. 30,000 20,000 609
Legend Technology 27,205 15,235 464
W.I. Harper International Corp. 20,650 15,050 459
Megic Corp. 647 - -
InCOMM Technologies Co., Ltd. 2,360 2,360 72
IP Fund II 32,400 32,400 987
Dragon Investment Co. Ltd. 323,000 217,000 6,612
World Venture, Inc. 300,000 262,000 7,983
iD Reengineering Inc. 199,900 174,900 5,329
HiTRUST. COM Inc. 90,818 - -
DYNA Fund II 23,459 23,736 723
IP Fund III 195,161 131,862 4,018
iD5 Fund LTP 73,879 74,751 2,278
IP Cathay One, L.P. 194,610 295,362 9,000
IP Fund One L.P. 1,274,713 907,431 27,650
MPC Corporation 231,100 - -
New Century Infocomm Tech Co., Ltd. - 341,663 10,411
Apacer Technology Inc. - 45,340 1,382
Other 82,031 104,180 3,176
3,142,121 2,684,270 81,793
In 2007 and 2008, the Consolidated Companies increased their investments in IP Cathay L.P. and other investees in the amount of NT$217,140 and NT$97,876, respectively. The Consolidated Companies also increased their investments in New Century Infocomm Tech and other investees in the amount of NT$359,759 through the acquisition of E-Ten Information System Co., Ltd. in 2008. Additionally, in 2007, the Consolidated Companies sold portions of their investments in TFNC, InCOMM Technologies and other investees, resulting in an aggregate gain on disposal of investment of NT$44,593. In 2008, the Consolidated Companies sold portions of their investments in Apacer Technology Inc. and other investees, realizing an aggregate disposal gain of NT$80,462.
The Consolidated Companies recognized impairment losses on Dragon Investment Co. Ltd., iD Reengineering Inc., MPC Corp. and other financial assets carried at cost. The impaired amount of NT$409,141 for the year ended December 31, 2008, was recorded as “other investment losses” in the accompanying consolidated statements of income.
(10) Equity-method investments
December 31, 2007 2007
Percentage ofownership Book value
Investment income (loss)
% NT$ NT$
Wistron Corporation (“Wistron”) 9.13 2,987,685 668,653
e-Life Mall Corp. 21.82 682,475 116,160
The Eslite Bookstore 18.62 395,411 34,465
Apacer Technology Inc. 34.40 313,410 (141,642)
Aegis Semiconductor Technology Inc. (“Apacer”) 44.03 165,235 -
ECOM Software Inc. 33.93 50,830 10,798
Bluechip Infotech Pty Ltd. 33.41 77,811 11,698
HiTRUST.COM Inc. (“HiTRUST.COM”) - - 122,012
Other 24,843 (22,892)
Deferred credits (8,016) 27,009
4,689,684 826,261
Less: Allocation of corporate expense (130,601)
695,660
December 31, 2008 2008
Percentage ofownership Book value
Investment income (loss)
% NT$ NT$
Wistron Corporation 4.92 1,814,166 471,792
E-Life Mall Corp. 14.27 442,291 70,763
The Eslite Bookstore 18.62 304,361 (72,508)
Apacer Technology Inc. - - (18,962)
Aegis Semiconductor Technology Inc. 44.03 165,235 -
ECOM Software Inc. 33.93 36,771 4,565
Bluechip Infotech Pty Ltd. 33.41 57,361 1,125
FuHu, Inc. 9.00 72,518 (987)
Other - 36,087 1,994
Deferred credits - 12,896
2,928,790 470,678
Less: Allocation of corporate expense (66,494)
404,184
Deferred credits of long-term equity investments represent the unamortized balance of deferred gains and losses derived from the sale of equity investment among the affiliated companies.
In 2008, the Consolidated Companies acquired investment in FuHu, Inc. in the amount of NT$73,841.

Acer Incorporated 2008 Annual Report Acer Incorporated 2008 Annual Report90 91
Financial Standing
Acer Incorporated 2008 Annual Report Acer Incorporated 2008 Annual Report90 91
In October 2007, the Company reduced its investment in Apacer to an ownership interest of less than 50% and no longer held a controlling interest in Apacer. Consequently, Apacer was excluded from the consolidated financial statements, and the investments in Apacer were accounted for using the equity method. The Consolidated Companies continuously decreased their ownership in Apacer in 2008, and thus had no significant influence over Apacer’s operating and financial policies. Commencing on August 1, 2008, the investments in Apacer were reclassified as “financial assets carried at cost ‒ noncurrent”.
Commencing from December 31, 2007, the Consolidated Companies decreased their ownership interest in HiTRUST.COM and thus had no significant influence over HiTRUST.COM’s operating and financial policies. Consequently, the equity investments in HiTRUST.COM were reclassified as “financial assets carried at cost ‒ noncurrent”.
In 2007, the Consolidated Companies sold portions of their investments in Wistron, Apacer, HiTRUST. COM, and other investees, and an aggregate gain of NT$1,834,450 was recognized from these sales. In 2008, the Company sold portions of their investment in Wistron, and recognized a disposal gain of NT$1,441,906.
In 2008, the Consolidated Companies recognized liquidation loss of NT$7,262 on EB EASY (TWN) Corp. The loss was recorded under “other investment loss” in the accompanying consolidated income statements.
The Company’s capital surplus was reduced by NT$169,810 and NT$78,255 in 2007 and 2008, respectively, as a result of recognizing changes in investees’ equity accounts or disposal of equity-method investments.
(11) Available-for-sale financial assets ‒ noncurrent
December 31, 2007 December 31, 2008
NT$ NT$ US$
Qisda Corporation (“Qisda”) 2,655,514 520,718 15,867
Silicon Storage Technology Inc. (“Silicon”) 10,571 8,192 249
Yosun Industrial Corp. 704,762 386,660 11,782
RoyalTek Co., Ltd. - 93,390 2,846
Quanta Computer Inc. - 151,527 4,617
3,370,847 1,160,487 35,361
The Company sold all its ownership interest in a subsidiary, Sertek Inc., on July 1, 2007. The price included cash consideration and stock consideration amounting to 27,000,000 shares of Yosun Industrial Corp. Through the acquisition of E-Ten Information System Co., Ltd. in September 2008, the Consolidated Companies increased their investment in RoyalTek Co., Ltd. and Quanta Computer Inc.
In 2007, the Consolidated Companies sold portions of their investments in Qisda, Silicon and other investees, and an aggregate gain of NT$109,491 was recognized from these sales. In 2008, no disposal activities occurred.
(12) Property, plant and equipment
The Company’s subsidiary ACI sold the office building located in Singapore in March 2008, with a disposal gain of NT$788,944. Additionally, the Company’s subsidiary Gateway disposed of computer equipment and machinery in 2008 with a loss of NT$269,057. The gain and loss were netted and recorded under “gain on disposal of property and equipment, net” in the accompanying consolidated income statements.
(13) Property not in use
December 31, 2007 December 31, 2008
NT$ NT$ US$
Leased assets ‒ land 818,630 807,538 24,607
Leased assets ‒ buildings 2,855,547 2,827,810 86,166
Damaged office premises 457,558 457,558 13,942
Property held for sale and development 1,761,173 1,391,260 42,393
Others - 29,019 884
Less: Accumulated depreciation (543,805) (570,088) (17,371)
Accumulated asset impairment (1,543,000) (1,946,376) (59,308)
3,806,103 2,996,721 91,313
Damaged office premises are office premises that suffered fire damage. As of December 31, 2008 the Consolidated Companies concluded that the possibility for the damaged office premises to be fully repaired was remote; hence, the repair cost accrual of NT$161,308, recorded in “other current liabilities” in the accompanying consolidated balance sheet as of December 31, 2007, was reclassified as accumulated asset impairment, and an additional impairment loss of NT$221,931 was recognized.
For certain land acquired, the registered ownership has not been transferred to the land acquirer, APDI, a subsidiary of the Company. To protect APDI’s interests, APDI has obtained signed contracts from the titleholders assigning all rights and obligations related to the land to APDI. Additionally, the land title certificates are held by APDI, and APDI has registered its liens thereon.
(14) Intangible assets
Goodwill Patents Trademarks Customer Relationships Others Total
NT$ NT$ NT$ NT$ NT$ NT$
Balance at January 1, 2007 244,328 171 - - 152,183 396,682
Additions - 415,701 - - 78,168 493,869
Acquisitions 16,654,264 1,116,481 5,504,220 1,551,042 570,729 25,396,736
Disposal - (120) - - (3,410) (3,530)
Translation adjustment (7,876) 553 73 494 3,356 (3,400)
Amortization - (59,074) (6,054) (40,457) (248,279) (353,864)
Balance at December 31, 2007 16,890,716 1,473,712 5,498,239 1,511,079 552,747 25,926,493
Additions - 89,177 - - 80,147 169,324
Acquisitions 5,520,031 - 2,634,244 151,100 1,871,300 10,176,675
Disposal (32,532) - - - (4,339) (36,871)
Reclassification - (727,381) - - (453,200) (1,180,581)
Translation adjustment 195,825 (20,326) (32,122) 11,722 (14,327) 140,772
Amortization - (122,344) (32,805) (156,552) (137,346) (449,047)
Balance at December 31, 2008 22,574,040 692,838 8,067,556 1,517,349 1,894,982 34,746,765

Acer Incorporated 2008 Annual Report Acer Incorporated 2008 Annual Report92 93
Financial Standing
Acer Incorporated 2008 Annual Report Acer Incorporated 2008 Annual Report92 93
(a) Acquisitions
(i) Gateway, Inc.
On October 15, 2007, the Company completed the acquisition of 100% ownership of Gateway, Inc., a personal computer company in the U.S., through its indirectly wholly owned subsidiary Acer American Holding, at a price of US$1.90 (dollars) per share. The total purchase price amounted to US$711,420 thousand, which was inclusive of direct transaction costs. Gateway Inc. then became the Company’s indirectly wholly owned subsidiary.
The acquisition was accounted for in accordance with ROC SFAS No. 25 “Business Combinations”. The Consolidated Companies recognized goodwill, which represents the excess of the purchase price and direct transaction costs over the fair value of the net identifiable tangible and intangible assets.
The following represents the allocation of the purchase price to the assets acquired, liabilities assumed, and goodwill at the date of acquisition:
NT$ NT$
Purchase Price: 23,507,016
The identifiable assets acquired and liabilities assumed:
Current assets 32,139,646
Investments carried at cost 277,057
Property, plant, and equipment 2,808,517
Intangible assets ‒ trademarks and trade names 5,504,220
Intangible assets ‒ customer relationships 1,551,042
Intangible assets ‒ others 1,687,210
Other assets 58,355
Current liabilities (24,576,616)
Long-term liabilities (9,673,377)
Other liabilities (2,923,302) 6,852,752
Goodwill 16,654,264
As of December 31, 2008, the Company identified adjustments which subsequently met the recognition criteria after the initial recognition and during the purchase price allocation period. The adjustments included a decrease in property, plant and equipment of NT$77,564 or an increase in current liabilities of NT$1,766,474, resulting in an increase in goodwill of NT$1,844,038.
The Gateway trademark and trade name have an indefinite life and, accordingly, are not subject to amortization. The eMachine trademark and trade name are being amortized using the straight-line method over 20 years, the estimated period in which the economic benefits will be consumed. Customer relationships are being amortized using the straight-line method over the estimated useful life of 10 years.
(ii) Packard Bell B.V.
In March and June of 2008, the Company completed the acquisition of 100% ownership of Packard Bell B.V., a personal computer company in Europe, through its indirectly wholly owned subsidiary Acer Europe B.V., at a total purchase price of Euro 66,117 thousand, which was inclusive of direct transaction costs.
The acquisition was accounted for in accordance with ROC SFAS No. 25 “Business Combinations”. The Consolidated Companies recognized goodwill, which represents the excess of the purchase price and direct transaction costs over the fair value of the net identifiable tangible and intangible assets.
The following represents the allocation of the purchase price to the assets acquired, liabilities assumed, and goodwill at the date of acquisition:
NT$ NT$
Purchase Price: 3,172,080The identifiable assets acquired and liabilities assumed:
Current assets 9,587,790Property, plant, and equipment 351,162Intangible assets – Packard Bell trademark 2,163,744Current liabilities (10,665,179)Other liabilities (39,608) 1,397,908
Goodwill 1,774,172
The Packard Bell trademark has an indefinite life and, accordingly, is not subject to amortization.
(iii) E-Ten Information Systems Co., Ltd
As of September 1, 2008, the Company completed acquisition of 100% ownership of E-Ten Information Systems Co., Ltd (E-TEN), a handheld device company in Taiwan. The Company offered to exchange one share of its stock for every 1.07 shares of outstanding E-Ten stock, and issued a total of 168,158,878 common shares. E-Ten has become the Company’s directly wholly owned subsidiary.
The acquisition was accounted for in accordance with ROC SFAS No. 25 “Business Combinations”. The Consolidated Companies recognized goodwill, which represents the excess of the purchase price and direct transaction costs over the fair value of the net identifiable tangible and intangible assets.
The following represents the allocation of the purchase price to the assets acquired, liabilities assumed, and goodwill at the date of acquisition:
NT$ NT$
Purchase Price: 8,837,267Fair value of common shares issued 8,700,751Fair value of outstanding employee stock options assumed 136,516
The identifiable assets acquired and liabilities assumed:Current assets 2,574,588Equity method investment 789,753Property, plant, and equipment 1,856,836Intangible assets – ETEN trademark 450,900Intangible assets – customer relationship 151,100Intangible assets – developed technology 1,802,500Intangible assets – others 88,400Other assets 485,261Current liabilities (1,263,892) 6,935,446
Goodwill 1,901,821

Acer Incorporated 2008 Annual Report Acer Incorporated 2008 Annual Report94 95
Financial Standing
Acer Incorporated 2008 Annual Report Acer Incorporated 2008 Annual Report94 95
The ETEN trademark for the stock trading PDA product has an indefinite life and, accordingly, is not subject to amortization. The customer relationship is subject to amortization using the straight-line method over 7 years. The developed technology is subject to amortization using the straight-line method over 10 years, the estimated period in which the economic benefits will be consumed.
(b) Pro forma information
The following unaudited pro forma financial information presents the combined results of operations as if the acquisitions of Gateway Inc., Packard Bell B.V., and E-Ten Information Systems Co., Ltd. had occurred as of the beginning of each of the fiscal years presented:
2007 2008
NT$ NT$ US$
Revenue 574,749,174 550,172,239 16,764,344
Net income from continuing operations before income tax 17,498,019 14,676,395 447,206
Net income from continuing operations after income tax 14,343,978 11,521,166 351,062
Basic earnings per common share (in dollars) 5.72 4.44 0.14
(c) Impairment test
For the purpose of impairment testing, goodwill and trademarks and trade names with indefinite useful lives are allocated to the Consolidated Companies’ cash-generating units (CGUs). The carrying amounts of significant goodwill and trademarks and trade names with indefinite useful lives as of December 31, 2007 and 2008, are presented as follows:
December 31, 2007
Acer Pan-America business group
Packard Bell brand business group
E-Ten Information System group
Goodwill $ 16,654,264 - 166,604
Trademarks
& trade names 4,930,120 - -
December 31, 2008
Acer Pan-America business group
Packard Bell brand business group
E-Ten Information System group
Goodwill $ 18,768,929 1,699,593 1,901,821
Trademarks
& trade names 4,988,336 2,067,836 450,900
Each CGU to which the goodwill is allocated represents the lowest level within the Consolidated Companies at which the goodwill is monitored for internal management purposes. Based on the results of impairment tests conducted by the Company’s management, there was no evidence of impairment of goodwill and trademarks and trade names as of December 31, 2007 and 2008. The recoverable amount of a CGU is determined based on the value in use, and the related key assumptions are as follows:
Acer Pan-America business group
(i) dgets approved by management covering a 5-year period, and a stable growth rate of 3% for the future earnings potential of the CGU beyond five years. This expected growth rate is determined by the assumptions concerning the overall economic environment and introduction of new products.
(ii) Future cash flows are discounted at the rate of 13.7 percent.
Packard Bell brand business group
(i) The assessment used cash flow projections based on historical operating performance, future financial budgets approved by management covering a 5-year period, and a stable growth rate of 2% for the future earnings potential of the CGU beyond five years. This expected growth rate is determined by the assumptions concerning the overall economic environment and introduction of new products.
(ii) Future cash flows are discounted at the rate of 11.8 percent.
E-Ten Information System group
(i) The assessment used cash flow projections based on historical operating performance, future financial budgets approved by management covering a 5-year period, and a stable growth rate of 3% for the future earnings potential of the CGU beyond five years. This expected growth rate is determined by the assumptions concerning overall the economic environment and introduction of new products.
(ii) Future cash flows are discounted at the rate of 18.7 percent.
(15) Other financial assets ‒ noncurrent
December 31, 2007 December 31, 2008
NT$ NT$ US$
Refundable deposits 687,109 781,080 23,800
Noncurrent receivables 274,284 87,680 2,672
961,393 868,760 26,472
(16) Short-term borrowings
December 31, 2007 December 31, 2008
NT$ NT$ US$
Bank loans 5,372,109 1,086,851 33,117
The Consolidated Companies provided some assets as collateral according to the bank loan contracts. Refer to note 6 for a description of pledged assets related to these borrowings.

Acer Incorporated 2008 Annual Report Acer Incorporated 2008 Annual Report96 97
Financial Standing
Acer Incorporated 2008 Annual Report Acer Incorporated 2008 Annual Report96 97
(17) Long-term debt
December 31, 2007 December 31, 2008
NT$ NT$ US$
Citibank syndicated loan 16,500,000 12,200,000 371,747
Other bank loans 308,242 184,920 5,634
Less: current installments (17,366) (8,250,000) (251,386)
16,790,876 4,134,920 125,995
The Company entered into a syndicated loan agreement with Citibank, the managing bank of the syndicated loan, on October 11, 2007, and the terms were as follows:
December 31, 2007
December 31, 2008
Type of Loan Creditor Credit Line Term NT$ NT$
Unsecured loan
Citibank and other banks
(1) Term tranche of NT$16.5 billion; three-year limit during which revolving credits disallowed
(1) Repayable in 4 semi-annual installments starting from April 2009. An advance repayment of $4,300,000 was made in the first quarter of 2008.
16,500,000 12,200,000
(2) Revolving tranche of NT$3.3 billion; three-year limit
(2) One-time repayment in full in October 2010.
- -
Less: current installment - (8,250,000)
16,500,000 3,950,000
The interest rate of the above-mentioned syndicated loan was 3.02% in 2007 and 3.06% in 2008. According to the loan agreement, the Company is required to maintain certain financial ratios based on annual and semi-annual audited financial statements. If the Company fails to meet any of the financial ratios, the managing bank will request in writing that the Company take action to improve within 30 days. No assertion of breach of contract will be tenable if the financial ratios are met within 30 days. Based on the 2008 financial statements, the Company has complied with the aforementioned debt covenants.
(18) Retirement plans
The following table sets forth the benefit obligation and accrued pension liabilities related to the Consolidated Companies’ defined benefit retirement plans:
2007
Plan assets in excessof accumulated benefit
obligation
Accumulated benefitobligation in excess
of plan assets
NT$ NT$
Benefit obligation:
Vested benefit obligation - (108,087)
Nonvested benefit obligation - (491,318)
Accumulated benefit obligation - (599,405)
Projected compensation increases - (559,351)
Projected benefit obligation - (1,158,756)
Plan assets at fair value - 507,358
Funded status - (651,398)
Unrecognized pension loss - 730,346
Unrecognized prior service cost - 558
Unrecognized transition (assets) obligation - 1,829
Minimum pension liability adjustment - (172,784)
Accrued pension liabilities - (91,449)
2008
Plan assets in excessof accumulated
benefit obligation
Accumulated benefitobligation in excess
of plan assets
NT$ US$ NT$ US$
Benefit obligation:
Vested benefit obligation (124,967) (3,808) (33,041) (1,007)
Nonvested benefit obligation (469,607) (14,309) (100,237) (3,054)
Accumulated benefit obligation (594,574) (18,117) (133,278) (4,061)
Projected compensation increases (335,873) (10,235) (52,666) (1,605)
Projected benefit obligation (930,447) (28,351) (185,944) (5,666)
Plan assets at fair value 643,793 19,617 59,610 1,816
Funded status (286,654) (8,734) (126,334) (3,850)
Unrecognized pension loss 459,393 13,998 39,982 1,218
Unrecognized prior service cost - - 6,596 201
Unrecognized transition (assets) obligation (2,187) (67) 25,426 775
Minimum pension liability adjustment - - 659 21
Prepaid pension cost (Accrued pension liabilities) 170,552 5,197 (53,671) (1,635)

Acer Incorporated 2008 Annual Report Acer Incorporated 2008 Annual Report98 99
Financial Standing
Acer Incorporated 2008 Annual Report Acer Incorporated 2008 Annual Report98 99
Accrued pension liabilities are included in “other liabilities” in the accompanying consolidated balance sheets. Prepaid pension cost is included in “other assets” in the accompanying consolidated balance sheets.
The components of the net periodic pension cost for 2007 and 2008 were as follows:
2007 2008
NT$ NT$ US$
Service cost 32,894 49,808 1,518
Interest cost 20,671 34,453 1,050
Actual return on plan assets (12,147) (18,586) (566)
Amortization and deferral 17,133 31,937 973
Net periodic pension cost 58,551 97,612 2,975
Significant actuarial assumptions used in the above calculations were as follows:
2007 2008
Discount rate 2.75% 2.50%
Rate of increase in future compensation 3.00%-3.50% 3.00%
Expected rate of return on plan assets 2.75% 2.50%
In 2007 and 2008, pension cost under the defined contribution retirement plans amounted to NT$202,278 and NT$367,627, respectively.
(19) Income taxes
(a) Each consolidated entity should file its own separate income tax return.
(b) The components of income tax expense from continuing operations for the years ended December 31, 2007 and 2008, were as follows:
2007 2008
NT$ NT$ US$
Current income tax expense 2,726,875 2,383,360 72,623
Deferred income tax (benefit) expense (61,297) 786,086 23,953
2,665,578 3,169,446 96,576
(c) The income tax calculated on the pre-tax income from continuing operations at the Company’s statutory income tax rate (25%) was reconciled with the income tax expense of continuing operations reported in the accompanying consolidated statements of income as follows:
2007 2008
NT$ NT$ US$
Expected income tax expense 3,777,159 3,701,682 112,794
Effect of different tax rates applied to the Company’s subsidiaries 1,786,743 720,278 21,948
Tax-exempt investment income from domestic investees (592,587) (154,526) (4,709)
Prior-year adjustments (53,756) (458,487) (13,971)
Gain on disposal of marketable securities not subject to income tax
(1,226,553)
(697,934)
(21,267)
Investment tax credits 30,696 295,939 9,018
Change in valuation allowance (699,088) 225,493 6,871
Tax-exempt investment income resulting from operational headquarters
(1,132,967) (1,386,033) (42,234)
Surtax on unappropniated retained earrings - 165,109 5,031
Gain on disposal of land not subject to income tax (29,476) - -
Alternative minimum tax 404,858 44,430 1,354
Others 400,549 713,495 21,741
Income tax expense 2,665,578 3,169,446 96,576
(d) The components of deferred income tax assets (liabilities) as of December 31, 2007 and 2008, were as follows:
December 31, 2007 December 31, 2008
NT$ NT$ US$
Deferred income tax assets – current:
Accrued purchase discounts 631,360 1,093,887 33,332
Inventory provisions 394,505 620,737 18,915
Loss on valuation of financial instruments 338,995 156,932 4,782
Accrued advertising expense 293,552 181,323 5,525
Warranty provision 267,102 894,085 27,244
Allowance for doubtful accounts 169,001 397,292 12,106
Accrued restructuring cost 149,637 - -
Accrued non-recurring engineering cost 102,485 111,826 3,407
Deferred revenue 40,742 34,904 1,064
Accrued royalty 707,937 82,975 2,528
Unrealized exchange gains (201,717) (386,944) (11,791)
Net operating loss carryforwards - 77,977 2,376
Others 571,195 553,783 16,874
3,464,794 3,818,777 116,362
Valuation allowance (1,550,788) (1,535,834) (46,798)
1,914,006 2,282,943 69,564
Acer Incorporated 2008 Annual Report Acer Incorporated 2008 Annual Report100 101
Financial Standing
Acer Incorporated 2008 Annual Report Acer Incorporated 2008 Annual Report100 101
December 31, 2007 December 31, 2008
NT$ NT$ US$
Deferred income tax liabilities – current:
Inventory provisions (88,624) (125,802) (3,833)
Allowance for doubtful accounts (473,449) (462,980) (14,108)
Others (147,624) (67,828) (2,067)
(709,697) (656,610) (20,008)
December 31, 2007 December 31, 2008
NT$ NT$ US$
Deferred income tax assets – non-current:
Difference in depreciation for tax and financial purposes 12,042 20,638 629
Net operating loss carryforwards 624,286 773,919 23,582
Provision for asset impairment loss 293,190 - -
Investment tax credits 686,658 - -
Other 64,944 161,884 4,933
1,681,120 956,441 29,144
Valuation allowance (1,615,282) (826,526) (25,185)
65,838 129,915 3,959
December 31, 2007 December 31, 2008
NT$ NT$ US$
Deferred income tax liabilities – non-current:
Difference in intangible assets for tax and financial purposes (3,101,316) (2,705,258) (82,432)
Investment income recognized by the equity method (2,697,304) (3,804,043) (115,913)
Net operating loss carryforwards 14,028,055 14,326,766 436,552
Difference in depreciation for tax and financial purposes 939,410 1,026,013 31,263
Provision for asset impairment loss 293,190 313,148 9,542
Investment tax credits - 418,227 12,744
Software development cost - 731,804 22,299
Unrealized investment loss 241,569 244,421 7,448
Other 147,919 463,409 14,121
9,851,523 11,014,487 335,624
Valuation allowance (14,970,897) (17,288,586) (526,802)
(5,119,374) (6,274,099) (191,178)
(e) The domestic Consolidated Companies were granted investment tax credits for investment in certain high-tech industries, for the purchase of automatic machinery and equipment, for research and development expenditures, and for employee training expenditures. These credits may be applied over a period of five years. The amount of the credit that may be applied in any year is limited to 50% of the income tax payable for that year, but there is no limitation on the amount of investment tax credit that may be applied in the final year.
As of December 31, 2008, unused investment tax credits available to the Consolidated Companies were as follows:
Expiration date NT$ US$
December 31, 2009 291,975 8,897
December 31, 2010 4,834 147
December 31, 2011 64,660 1,970
December 31, 2012 56,758 1,730
418,227 12,744
(f) The tax effects of net operating loss carryforwards available to the Consolidated Companies as of December 31, 2008, were as follows:
Expiration date NT$ US$
December 31, 2009 144,655 4,408
December 31, 2010 10,737 327
December 31, 2011 992,846 30,253
December 31, 2012 1,088,663 33,173
Thereafter 12,941,761 394,349
15,178,662 462,510
(g) Information about the integrated income tax system
Beginning in 1998, an integrated income tax system was implemented in the Republic of China. Under the new tax system, the income tax paid at the corporate level can be used to offset Republic of China resident stockholders’ individual income tax. The Company is required to establish an imputation credit account (ICA) to maintain a record of the corporate income taxes paid and imputation credit that can be allocated to each stockholder. The credit available to Republic of China resident stockholders is calculated by multiplying the dividend by the creditable ratio. The creditable ratio is calculated as the balance of the ICA divided by earnings retained by the Company since January 1, 1998.
Information related to the ICA is summarized below:
December 31, 2007 December 31, 2008
NT$ NT$ US$
Unappropriated earnings:
Earned before January 1, 1998 6,776 6,776 207
Earned after January 1, 1998 13,544,248 13,978,542 425,941
13,551,024 13,985,318 426,148
Balance of ICA 165,036 198,401 6,045
The Company’s estimated creditable ratio for the 2008 earnings distribution to ROC resident stockholders is approximately 4.84%; and the actual creditable ratio for the 2007 earnings distribution to ROC resident stockholders was 4.01%.
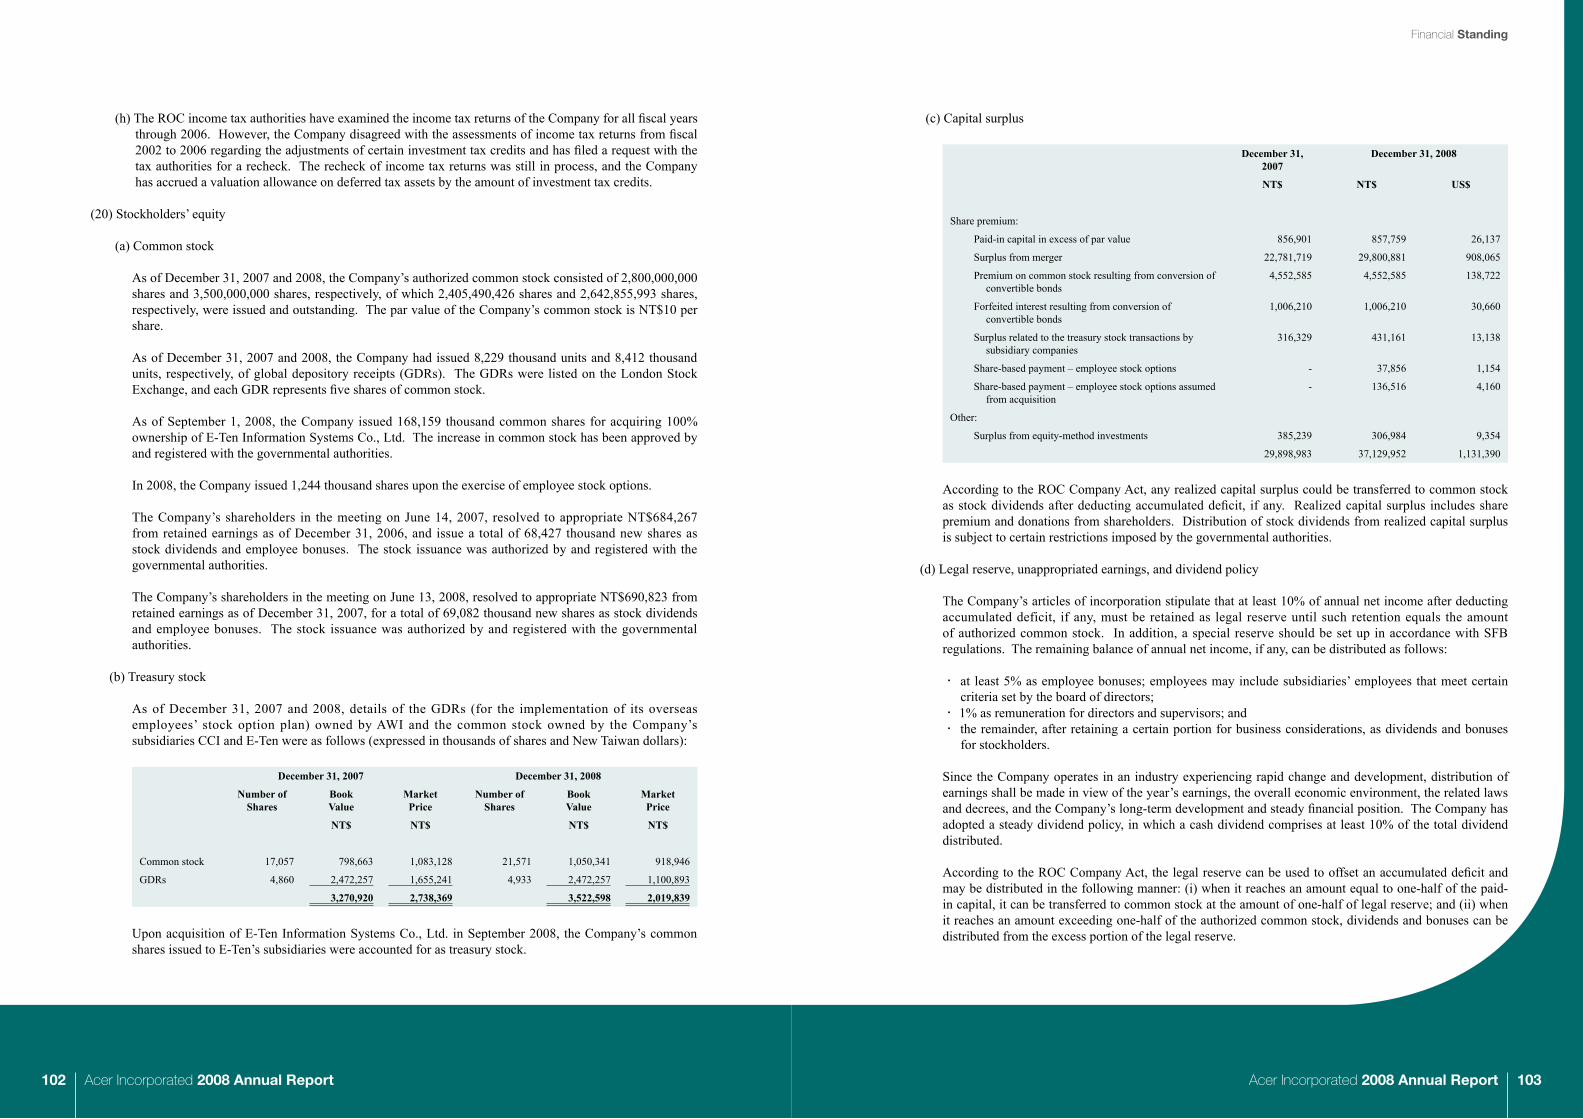
Acer Incorporated 2008 Annual Report Acer Incorporated 2008 Annual Report102 103
Financial Standing
Acer Incorporated 2008 Annual Report Acer Incorporated 2008 Annual Report102 103
(h) The ROC income tax authorities have examined the income tax returns of the Company for all fiscal years through 2006. However, the Company disagreed with the assessments of income tax returns from fiscal 2002 to 2006 regarding the adjustments of certain investment tax credits and has filed a request with the tax authorities for a recheck. The recheck of income tax returns was still in process, and the Company has accrued a valuation allowance on deferred tax assets by the amount of investment tax credits.
(20) Stockholders’ equity
(a) Common stock
As of December 31, 2007 and 2008, the Company’s authorized common stock consisted of 2,800,000,000 shares and 3,500,000,000 shares, respectively, of which 2,405,490,426 shares and 2,642,855,993 shares, respectively, were issued and outstanding. The par value of the Company’s common stock is NT$10 per share.
As of December 31, 2007 and 2008, the Company had issued 8,229 thousand units and 8,412 thousand units, respectively, of global depository receipts (GDRs). The GDRs were listed on the London Stock Exchange, and each GDR represents five shares of common stock.
As of September 1, 2008, the Company issued 168,159 thousand common shares for acquiring 100% ownership of E-Ten Information Systems Co., Ltd. The increase in common stock has been approved by and registered with the governmental authorities.
In 2008, the Company issued 1,244 thousand shares upon the exercise of employee stock options.
The Company’s shareholders in the meeting on June 14, 2007, resolved to appropriate NT$684,267 from retained earnings as of December 31, 2006, and issue a total of 68,427 thousand new shares as stock dividends and employee bonuses. The stock issuance was authorized by and registered with the governmental authorities.
The Company’s shareholders in the meeting on June 13, 2008, resolved to appropriate NT$690,823 from retained earnings as of December 31, 2007, for a total of 69,082 thousand new shares as stock dividends and employee bonuses. The stock issuance was authorized by and registered with the governmental authorities.
(b) Treasury stock
As of December 31, 2007 and 2008, details of the GDRs (for the implementation of its overseas employees’ stock option plan) owned by AWI and the common stock owned by the Company’s subsidiaries CCI and E-Ten were as follows (expressed in thousands of shares and New Taiwan dollars):
December 31, 2007 December 31, 2008
Number of Shares
Book Value
Market Price
Number of Shares
Book Value
Market Price
NT$ NT$ NT$ NT$
Common stock 17,057 798,663 1,083,128 21,571 1,050,341 918,946
GDRs 4,860 2,472,257 1,655,241 4,933 2,472,257 1,100,893
3,270,920 2,738,369 3,522,598 2,019,839
Upon acquisition of E-Ten Information Systems Co., Ltd. in September 2008, the Company’s common shares issued to E-Ten’s subsidiaries were accounted for as treasury stock.
(c) Capital surplus
December 31, 2007
December 31, 2008
NT$ NT$ US$
Share premium:
Paid-in capital in excess of par value 856,901 857,759 26,137
Surplus from merger 22,781,719 29,800,881 908,065
Premium on common stock resulting from conversion of convertible bonds
4,552,585 4,552,585 138,722
Forfeited interest resulting from conversion of convertible bonds
1,006,210 1,006,210 30,660
Surplus related to the treasury stock transactions by subsidiary companies
316,329 431,161 13,138
Share-based payment ‒ employee stock options - 37,856 1,154
Share-based payment ‒ employee stock options assumed from acquisition
- 136,516 4,160
Other:
Surplus from equity-method investments 385,239 306,984 9,354
29,898,983 37,129,952 1,131,390
According to the ROC Company Act, any realized capital surplus could be transferred to common stock as stock dividends after deducting accumulated deficit, if any. Realized capital surplus includes share premium and donations from shareholders. Distribution of stock dividends from realized capital surplus is subject to certain restrictions imposed by the governmental authorities.
(d) Legal reserve, unappropriated earnings, and dividend policy
The Company’s articles of incorporation stipulate that at least 10% of annual net income after deducting accumulated deficit, if any, must be retained as legal reserve until such retention equals the amount of authorized common stock. In addition, a special reserve should be set up in accordance with SFB regulations. The remaining balance of annual net income, if any, can be distributed as follows:
‧ at least 5% as employee bonuses; employees may include subsidiaries’ employees that meet certain criteria set by the board of directors;
‧ 1% as remuneration for directors and supervisors; and ‧ the remainder, after retaining a certain portion for business considerations, as dividends and bonuses
for stockholders.
Since the Company operates in an industry experiencing rapid change and development, distribution of earnings shall be made in view of the year’s earnings, the overall economic environment, the related laws and decrees, and the Company’s long-term development and steady financial position. The Company has adopted a steady dividend policy, in which a cash dividend comprises at least 10% of the total dividend distributed.
According to the ROC Company Act, the legal reserve can be used to offset an accumulated deficit and may be distributed in the following manner: (i) when it reaches an amount equal to one-half of the paid-in capital, it can be transferred to common stock at the amount of one-half of legal reserve; and (ii) when it reaches an amount exceeding one-half of the authorized common stock, dividends and bonuses can be distributed from the excess portion of the legal reserve.

Acer Incorporated 2008 Annual Report Acer Incorporated 2008 Annual Report104 105
Financial Standing
Acer Incorporated 2008 Annual Report Acer Incorporated 2008 Annual Report104 105
Pursuant to SFB regulations, an amount equal to the total amount of any deduction items of shareholders’ equity shall be provided from the net income of the current year as a special reserve that cannot be distributed as dividend or bonus. Accordingly, such special reserve shall be adjusted to reflect the changes in the deduction items. Any reversal of the special reserve can be added back to unappropriated earnings for distribution of dividends or bonus.
In 2008, the Company estimated it would distribute NT$1,500,000 of employee bonuses and NT$85,763 of directors’ and supervisors’ remuneration. The computation for the employee bonuses distributed in stock shares was based on the closing price of the day prior to the stockholders’ meeting, considering the ex-rights and ex-dividend effect. If the actual distribution amount approved by the shareholders differs from the estimated amount, the discrepancy shall be accounted for as a change in accounting estimates and adjusted in the year 2009. Additionally, the Company’s subsidiary Weblink International Inc. estimated it would distribute employee bonuses and directors’ and supervisors’ remuneration in the amount of NT$800.
The appropriation of 2006 and 2007 earnings was approved by the shareholders at meetings on June 14, 2007, and June 13, 2008, respectively, as follows:
2006 2007
NT$ NT$
Employee bonus - stock (in par value) 333,708 330,000
Employee bonus - cash 424,719 544,728
Directors’ and supervisors’ remuneration 94,803 116,630
853,230 991,358
The appropriation of earnings did not differ from the resolutions approved by the Company’s directors.
Distribution of 2008 earnings has not been proposed by the board of directors and is still subject to approval by the stockholders. After the resolutions, related information can be obtained from the public information website.
(21) Employee stock option plan
As of December 31, 2008, the Consolidated Companies had the employee stock option plans (“ESOP”) described below:
Stock Options
Employee stock option plan 1
Employee stock option plan 2
Employee stock option plan 3
Grant date 2008/11/31 2008/09/01 (note 1) 2008/09/01 (note 1)
Granted shares (in thousands) 14,000 8,717 1,067
Fair value of options granted ($) 25.124 25.47 ~ 26.11 42.20 ~ 42.58
Contractual life 3 years 4.97 years 2 years
Vesting period 2 years of service subsequent to grant date
1~3 years of service subsequent to grant date
2 years of service subsequent to grant date
Actual exit rates 0 0 0
Expected exit rates 0 0 0
Note 1: The Company assumed the employee stock option plans 2 and 3 through the acquisition of E-Ten Information Systems Co., Ltd. as of September 1, 2008.
The Consolidated Company utilized the Black-Scholes or the binomial option pricing model to value the stock options granted, and the main inputs to the valuation models are described below.
2008
Employee stock option plan 1
Employee stock option plan 2
Employee stock option plan 3
Exercise price ($) 25.28 44.50 16.90
Expected remaining contractual life (in years) 3 4.26 0.56
Fair market value for underlying securities – Acer shares (NT$) 45.95 59.10 59.10
Expected volatility (%) 45.01% 34.98% 37.35%
Expected dividend yield (%) note 2 note 2 note 2
Risk-free interest rate (%) 2.50% 2.40% 1.84%
Note 2: According to the employee stock option plan, the option prices are adjusted to take into account dividends paid on the underlying security. As a result, the expected dividend yield is excluded from the calculation of Black-Scholes or Binominal option pricing models.
Movements in number of stock options outstanding:
Employee stock optionplan 1
Employee stock option plan 2
Employee stock option plan 3
Number of options (in thousands)
Weighted-average exercise
price (NT$)
Number of options (in thousands)
Weighted-average exercise
price(NT$)
Number of options (in thousands)
Weighted-average exercise
price(NT$)
Outstanding at January 1, 2008
- - - - - -
Granted 14,000 25.28 8,717 44.50 1,067 16.90
Forfeited - - (480) - (36) -
Exercised - - - - (173) 16.90
Expired - - - - - -
Outstanding at December 31, 2008
14,000 25.28 8,237 44.50 858 16.90
Exercisable at December 31, 2008
- - - - 406 16.90
In 2008, the Consolidated Companies recognized the compensation expense related to the employee stock option plans in the amount of NT$37,856 under “salary expense” of operating expenses in the accompanying statement of income.
(22) Restructuring charges
In 2008, due to the acquisition of Gateway Inc. and Packard Bell B.V., the Consolidated Companies recognized a total of NT$15,800,000 of restructuring charges under “restructuring cost” of non-operating expenses and loss in the accompanying statements of income. The restructuring charges were associated with severance payments to employees and integration of the information technology system.

Acer Incorporated 2008 Annual Report Acer Incorporated 2008 Annual Report106 107
Financial Standing
Acer Incorporated 2008 Annual Report Acer Incorporated 2008 Annual Report106 107
(23) Net income from discontinued operations
On July 1, 2007, the Company disposed of all its ownership interest in a subsidiary, Sertek Inc. The operations of Sertek Inc. are classified as discontinued operations. The relevant income (loss) and cash flows of the discontinued operations were as follows:
2007NT$
Net revenues 9,398,700Cost of revenues and operating expenses (9,224,222)Non-operating income and expenses (64,502)Income before income taxes 109,976Income tax expense (23,120)Net income from discontinued operations 86,856Gain from disposal of discontinued operations 431,010Total net income from discontinued operations 517,866Discontinued operations’ cash flows:Cash provided by (used in) operating activities (69,408)Cash used in investing activities (645)Cash used in financing activities (118,307)
According to the sales agreement, if Sertek Inc. was able to achieve the stipulated profit in 2007, the Company would be entitled to a contingent consideration. Accordingly, the Company obtained the contingent consideration in cash amounting to NT$99,843 in 2008.
(24) Earnings per common share (“EPS”)
2007
Amount
Weighted-average number of outstanding
shares of common stock (in thousands)
EPS(in dollars)
NT$ NT$
Basic EPS – after retroactive adjustments:Net income attributable to shareholders of
parent company 12,958,933 2,432,594 5.33
2008
Amount
Weighted-average number of outstanding
shares of common stock (in thousands)
EPS(in dollars)
NT$ US$ NT$ US$Basic EPS – after retroactive adjustments:
Net income attributable to shareholders of parent company 11,742,135 357,796 2,487,238 4.72 0.14
Diluted EPS:Effect of dilutive potential common shares:Employee bonus - - 39,042Employee stock option plan - - 1,286Net income attributable to shareholders of
parent company 11,742,135 357,796 2,527,566 4.65 0.14
(25) Disclosure of financial instruments
(a) Fair values of financial instruments
The book value of short-term financial instruments is considered to be the fair value because of the short-term maturity of these instruments. Such method is applicable to cash and cash equivalents, notes and accounts receivable (including receivables from related parties), other receivables (including receivables from related parties), notes and accounts payables (including payables to related parties), short-term borrowings, current installments of long-term debt and royalties payable.
The estimated fair values and carrying amounts of all other financial assets and liabilities as of December 31, 2007 and 2008, were as follows:
2007 2008
Fair value Fair value
Carryingamount
Public quoted price
Valuation amount
Carryingamount
Public quoted price
Valuation amount
NT$ NT$ NT$ NT$ NT$ NT$
Non-derivative financial instruments
Financial assets:
Available-for-sale financial assets – current
2,852,061 2,852,061 - 591,444 591,444 1
Financial assets carried at cost 3,142,121 - see below (b) 2,684,270 - see below (b)
Available-for-sale financial assets – noncurrent
3,370,847 3,370,847 1,160,487 1,160,487 -
Refundable deposits (classified as “other financial assets”)
687,109 - 687,109 781,080 - 781,080
Noncurrent receivables (classified as “other financial assets”)
274,284 - 274,284 87,680 - 87,680
Financial liabilities:
Long-term debt 16,790,876 - 16,790,876 4,134,920 - 4,134,920
Derivative financial instruments
Financial assets:
Foreign currency forward contracts 250,197 - 250,197 1,302,085 - 1,302,085
Foreign currency options 4,983 - 4,983 60,514 - 60,514
Cross currency swap - - - 7,821 - 7,821
Foreign exchange swap - - - 7,113 - 7,113
Financial liabilities:
Foreign currency forward contracts 1,461,335 - 1,461,335 1,860,479 - 1,860,479
Foreign currency options 593 - 593 23,298 - 23,298

Acer Incorporated 2008 Annual Report Acer Incorporated 2008 Annual Report108 109
Financial Standing
Acer Incorporated 2008 Annual Report Acer Incorporated 2008 Annual Report108 109
(b) The following methods and assumptions were used to estimate the fair value of each class of financial instruments:
(i) Available-for-sale financial assets – current and noncurrent
The fair value of publicly traded stocks is the closing quotation price at the balance sheet date. The fair value of open-end mutual funds is based on the net asset value of the mutual funds at balance sheet date.
(ii) Financial assets carried at cost
Financial assets carried at cost were privately held stock. The fair value of privately held stock was unable to be determined because it was not traded in the public market.
(iii) Refundable deposits
The fair values are the book values as the date of expiry was unable to be determined.
(iv) Noncurrent receivables
The fair values are their present value discounted at the market interest rate.
(v) Long-term debt
Long-term debt is obtained at floating interest rates which are calculated based on the prevailing market rate adjusted by the Company’s credit spread. The carrying value of long-term debt approximates the market value.
(vi) Derivative financial instruments
The fair values of the Consolidated Companies’ derivative financial instruments are estimated using a valuation method. The assumptions used should be the same as those used by financial market traders when quoting their prices, which are readily available to the Consolidated Companies.
(c) For the years ended December 31, 2007 and 2008, remeasurement loss on financial assets and liabilities using an assessment method amounted to NT$121,332 and NT$989,905, respectively.
(d) Disclosure of financial risks
(i) Market risk
Mutual funds and publicly traded stocks were recorded by the Consolidated Companies as “available-for-sale financial assets” and were evaluated by fair value. Therefore, the Consolidated Companies were exposed to the risk of price fluctuation in the securities market.
The Consolidated Companies engaged in purchase and sale transactions with the functional currency of US dollars and Euros, respectively. Hence, the Consolidated Companies entered into foreign currency forward contracts and foreign currency options to hedge exchange risk resulting from assets and liabilities denominated in foreign currency and cash flows resulting from anticipated transactions in foreign currency. The lengths and amounts of the foreign exchange forward contracts and foreign currency options were in line with the settlement date and anticipated cash outflows of the Consolidated Companies’ foreign currency assets and liabilities. The gain or loss from exchange rate
fluctuation of hedging derivatives was offset by that from the hedged assets or liabilities. Therefore, the market risk related to the changes in exchange rates was not considered significant.
(ii) Credit risk
The Consolidated Companies’ credit risk is mainly from potential breach of contract by the counter-party associated with cash, equity investment, and derivative transactions. In order to control its exposure to the credit risk of each financial institution, the Consolidated Companies usually deposit cash with various financial institutions and hold equity investments in the form of mutual funds and stocks issued by companies with high credit quality. As a result, the concentration of credit risks related to cash and equity investments is not considered significant. Furthermore, the banks undertaking the derivative transactions are reputable financial institutions; therefore, the exposure related to the potential default by those counter-parties is not considered significant.
The Consolidated Companies primarily sell and market the Acer-branded IT products to a large number of customers in different geographic areas. As a result, the Consolidated Companies have no significant concentrations of credit risk, and in order to lower the credit risk, the Consolidated Companies continuously evaluate the credit quality of their customers.
(iii) Liquidity risk
The Consolidated Companies’ capital and operating funds are sufficient to reimburse all obligations. Therefore, the Consolidated Companies do not expect to have liquidity risk.
The available-for-sale financial assets held by the Consolidated Companies are equity securities and mutual funds, which are publicly traded and can be liquidated quickly at a price close to the fair market value. In contrast, the financial assets carried at cost are not publicly traded and are exposed to liquidity risk.
The purpose of the Consolidated Companies’ derivative financial instruments is to hedge the exchange rate risk resulting from assets and liabilities denominated in foreign currency and cash flows resulting from anticipated transactions in foreign currency. The lengths of the contracts are in line with the payment date and the anticipated cash outflows of the Consolidated Companies’ assets and liabilities denominated in foreign currency. As a result, the Consolidated Companies settle their foreign currency assets and liabilities with contract obligations or rights at the maturity date and do not expect to have significant liquidity risk.
(iv) Cash flow risk related to the fluctuation of interest rates
The Consolidated Companies’ short-term borrowings and long-term debt carried floating interest rates. As a result, the effective rate changes along with the fluctuation of the market interest rates and thereby influences the Consolidated Companies’ future cash flow. If the market interest rate increases by 1%, cash outflows in respect of these interest payments would increase by approximately NT$134,718 per annum.

Acer Incorporated 2008 Annual Report Acer Incorporated 2008 Annual Report110 111
Financial Standing
Acer Incorporated 2008 Annual Report Acer Incorporated 2008 Annual Report110 111
5. Transactions with Related Parties
(1) Names of related parties and their relationship with the Company
Name Relationship with the Company
Wistron Corporation (“Wistron”) Investee of the Company accounted for by equity method
Cowin Worldwide Corporation (“COWIN”) Subsidiary of Wistron
Wistron InfoComm (Kunshan) Co., Ltd. (“WKS”) Subsidiary of Wistron
Wistron InfoComm Technology (Kunshan) Co., Ltd. (“WIKS”) Subsidiary of Wistron
Bluechip Infotech Pty Ltd. (“SAL”) Investee of the Company accounted for by equity method
e-Life Mall Corp. (“eLIFE”) Investee of the Company accounted for by equity method
iD Softcapital Inc. Its chairman is one of the Company’s supervisors
All directors, supervisors, chief executive officers and executive vice presidents The Consolidated Companies’ main management
(2) Significant transactions with related parties as of and for the years ended December 31, 2007 and 2008, are summarized below:
(a) Net sales, and related notes and accounts receivable
(i) Net sales to:
2007 2008
NT$ NT$ US$
SAL 1,088,886 758,797 23,121
eLIFE 992,647 885,662 26,987
COWIN 153,920 462,430 14,091
WKS 358,247 - -
WIKS 185,804 - -
Other (individually less than 5%) 266,334 114,486 3,489
3,045,838 2,221,375 67,688
Trading terms with related parties are not significantly different from the terms with third-party customers.
(ii) Notes and accounts receivable from:
December 31, 2007 December 31, 2008
NT$ NT$ US$
eLIFE 190,277 159,182 4,850
COWIN 86,676 329,848 10,051
Wistron - 248,930 7,585
SAL 82,230 64,529 1,966
Others (individually less than 5%) 89,298 38,976 1,188
448,481 841,465 25,640
(b) Purchases and related notes and accounts payable
(i) Purchases from:
2007 2008
NT$ NT$ US$
Wistron 14,788,985 25,228,683 768,745
Others 296,079 270 8
15,085,064 25,228,953 768,753
The trading terms with related parties are not comparable to the trading terms with third parties as the specifications of products are different.
In 2007 and 2008, the Consolidated Companies sold raw material to Wistron and purchased back the finished goods after manufacture. To avoid overstating the revenues, sales of raw material to Wistron amounting to NT$58,666,096 and NT$88,579,887 for the years ended December 31, 2007 and 2008, respectively, were excluded from the consolidated revenues. Having legally enforceable rights, the Consolidated Companies offset the outstanding receivables and payables resulting from the above-mentioned transactions. The offset resulted in a payable balance.
(ii) Notes and accounts payable to:
December 31, 2007 December 31, 2008
NT$ NT$ US$
Wistron 4,510,376 7,681,059 234,050
Others 73,239 69,161 2,108
4,583,615 7,750,220 236,158
(c) Spin-off of assets
On February 28, 2002, AI spun off its design, manufacturing and services business from its Acer-brand business and transferred the related operating assets and liabilities to Wistron. The Company agreed with Wistron that Wistron is obligated to pay for the deferred income tax assets being transferred only when they are actually utilized. In 2006, the ROC income tax authorities examined and rejected Wistron’s claim of investment credits transferred from the spin-off in the income tax returns for 2002, 2003, and 2004. Wistron disagreed with the assessment and filed a request with the tax authorities for a recheck of its 2002, 2003 and 2004 income tax returns. To be conservative, the Company recognized income tax expense of NT$875,802 based on total tax impact estimated in 2006 and provided a valuation allowance of NT$385,043 against the receivables from Wistron as of December 31, 2007 and 2008. The remaining balance of $490,759 was recorded as income tax expense and other payables to related parties.
In 2008, as a result of the recheck on the 2002 income tax returns filed by Wistron, the tax authorities decided that the deferred tax assets resulting from the spin-off could be utilized. As a result, the Company revaluated the recoverability of the deferred tax assets and accordingly reversed the valuation allowance and other payables to related parties amounting to NT$511,425, and recognized a reduction of current income tax expense by the same amount.

Acer Incorporated 2008 Annual Report Acer Incorporated 2008 Annual Report112 113
Financial Standing
Acer Incorporated 2008 Annual Report Acer Incorporated 2008 Annual Report112 113
(d) Other expenses
In 2007 and 2008, the Consolidated Companies paid iD Soft Capital Inc. management service fees amounting to NT$69,333 and NT$61,633, respectively.
(e) Advances to/from related parties
The Consolidated Companies paid certain expenses on behalf of related parties. Additionally, related parties paid certain expenses and accounts payable on behalf of the Consolidated Companies. As of December 31, 2007 and 2008, the Consolidated Companies had aggregate receivables from related parties of NT$59,403 and NT$45,173, respectively, and payables to related parties of NT$609,717 and NT$189,964, respectively, resulting from these transactions.
(3) Main management compensation
As of December 31, 2007 and 2008, the gross compensation of the Consolidated Companies’ main management was as follows:
2007 2008
Amount Amount
NT$ NT$ US$
Salaries 178,334 249,243 7,595
Cash awards and special allowances 69,669 134,574 4,101
Business expense 6,520 1,989 60
Employee bonus 482,825 360,581 10,987
737,348 746,387 22,743
The estimated employee bonus and directors’ and supervisors’ remuneration discussed in note 4(20) includes the above amounts.
6. Pledged Assets
Assets pledged for various purposes were as follows:
Book value of pledged assets
at December 31,
Pledged assets Pledged to secure 2007 2008
NT$ NT$ US$
Cash in bank and time deposits Contract bidding and project fulfillment
398,459 109,586 3,339
Property, plant and equipment, and property not in use
Credit lines of bank loans 1,692,140 4,902 149
2,090,599 114,488 3,488
As of December 31, 2007 and 2008, the above pledged cash in bank and time deposits were classified as “other financial assets” and “restricted assets ‒ current” in the accompanying consolidated balance sheets.
In 2007, the Consolidated Companies intended to acquire Packard Bell B.V., a company in Europe, with cash. As of December 31, 2007, the Consolidated Companies had deposited NT$1,958,585 to an escrow account for the purpose of business acquisition. The escrow deposit was recorded in “restricted assets – current” in the accompanying consolidated balance sheets. The business combination was completed on March 14, 2008.
7. Commitments and Contingencies
(1) Royalties
(a) The Company has entered into a patent cross license agreement with IBM. The agreement mainly states that both parties have the right to make use of either party’s global technological patents to manufacture and sell personal computer products. The Company agrees to make fixed payments periodically to IBM, and the Company will not have any additional obligation for the use of IBM patents other than the fixed amounts of payments agreed upon.
(b) The Company and Lucent Technologies Inc. entered into a Patent Cross License agreement. The license agreement in essence authorizes both parties to use each other’s worldwide computer-related patents for manufacturing and selling personal computer products. The Company agrees to make fixed payments periodically to Lucent, and the Company will not have any additional obligation for the use of Lucent patents other than the fixed amounts of payments agreed upon.
(c) On June 6, 2008, the Company entered into a Patent Cross License agreement with Hewlett Packard Development Company (HP). The previous patent infringement was settled out of court, and the Company agreed to make fixed payments periodically to HP. The Company will not have any additional obligation for the use of HP patents other than the fixed amounts of payments agreed upon.
(2) Others
As of December 31, 2007 and 2008, the Company had provided outstanding stand-by letters of credit totaling NT$133,085 and NT$133,304, respectively, for bidding on sales contracts and for customs duty contract implementation.
(3) The Consolidated Companies have entered into several operating lease agreements for warehouses, land and office buildings. Future minimum lease payments were as follows:
Year NT$ US$
2009 528,674 16,109
2010 305,084 9,296
2011 126,589 3,857
2012 72,843 2,220
2012 and thereafter 114,930 3,502
1,148,120 34,984

Acer Incorporated 2008 Annual Report Acer Incorporated 2008 Annual Report114 115
Financial Standing
Acer Incorporated 2008 Annual Report Acer Incorporated 2008 Annual Report114 115
(4) As of December 31, 2007 and 2008, the Company had provided promissory notes amounting to NT$23,429,875 and NT$29,150,262, respectively, as collateral for factored accounts receivable and for obtaining credit facilities from financial institutions.
8. Significant Loss from Casualty: None
9. Subsequent Events: None
10. Other
Total personnel, depreciation and amortization expenses incurred for the years ended December 31, 2007 and 2008, were as follows:
2007 2008
Operating
expense
Cost of revenues
Total
Operating
expense
Cost of revenues
Total
NT$ NT$ NT$ NT$ NT$ NT$
Personnel:
Salaries 7,456,623 1,471,263 8,927,886 11,184,723 1,549,798 12,734,521
Labor and health insurance
314,286 20,431 334,717 376,773 23,377 400,150
Pension 260,829 56,592 317,421 448,196 17,042 465,238
Other 540,262 1,951 542,213 147,214 1,235 148,449
Depreciation 557,376 33,813 591,189 917,394 38,486 955,880
Amortization 549,545 1,735 551,280 791,510 454,051 1,245,561
11. Segment Information
(1) Industry segment
The main business of the Consolidated Companies is to sell “Acer” brand-name desktop PCs, notebook PCs, and other related IT products, which represents a single industry.
(2) Geographic information
Information by geographic area as of and the years ended December 31, 2007 and 2008, was as follows:
2007
TaiwanNorth
America Europe Asia Eliminations Consolidated
NT$ NT$ NT$ NT$ NT$ NT$
Area income:
Customers 60,651,079 106,413,405 236,237,471 61,256,183 - 464,558,138
Inter-company 264,931,647 4,101 7,242,154 11,096 (272,188,998) -
325,582,726 106,417,506 243,479,625 61,267,279 (272,188,998) 464,558,138
Area profit (loss) before income taxes 264,812,614 926,347 15,381,028 2,194,840 (272,187,926) 11,126,903
Net investment income 695,660
Gain on disposal of investments, net
4,045,981
Interest expense (759,907)
Consolidated income before income taxes 15,108,637
Area identifiable assets 100,327,411 58,022,952 88,086,758 28,618,423 (53,352,602) 221,702,942
Equity method investments 4,689,684
Goodwill 16,890,716
Total assets 243,283,342
2007
TaiwanNorth
America Europe Asia Eliminations Consolidated
NT$ NT$ NT$ NT$ NT$ NT$
Depreciation and amortization 1,088,239 32,112 11,239 10,879 - 1,142,469
Capital expenditures 665,555 59,128 140,593 185,338 - 1,050,664

Acer Incorporated 2008 Annual Report Acer Incorporated 2008 Annual Report116 117
Financial Standing
Acer Incorporated 2008 Annual Report Acer Incorporated 2008 Annual Report116 117
2008
TaiwanNorth
America Europe Asia Eliminations Consolidated
NT$ NT$ NT$ NT$ NT$ NT$
Area income:
Customers 25,879,015 152,469,649 279,790,219 90,925,741 - 549,064,624
Inter-company 341,107,152 3,203 6,057,224 13,642 (347,181,221) -
366,986,167 152,472,852 285,847,443 90,939,383 (347,181,221) 549,064,624
Area profit (loss) before income taxes 342,361,748 (1,044,322) 15,501,048 3,361,512 (347,181,221) 12,998,765
Net investment income 404,184
Gain on disposal of investments, net 2,709,524
Interest expense (1,305,746)
Consolidated income before income taxes 14,806,727
Area identifiable assets 111,929,202 47,044,049 95,789,881 25,518,735 (62,342,472) 217,939,395
Equity method investments 2,928,790
Goodwill 22,574,040
Total assets 243,442,225
Depreciation and amortization
685,120 1,090,051 290,210 136,060 - 2,201,441
Capital expenditures 171,677 220,011 154,207 205,397 - 751,292
(3) Export sales
Export sales of the Company and its domestic subsidiaries do not exceed 10% of the consolidated revenues, hence no disclosure is required.
(4) Major customers:
No individual customers accounted for more than 10% of the consolidated revenues in 2007 and 2008.
7.5 Disclosure of the Impact on Company’s Financial Status Due to
Financial Difficulties Not applicable.
7.6 Financial Prediction and Achievements
7.6.1 Financial Forecast of Year 2007: Not applicable.

Acer Incorporated 2008 Annual Report118 Acer Incorporated 2008 Annual Report 119
8.Risk Management

Acer Incorporated 2008 Annual Report Acer Incorporated 2008 Annual Report120 121
Risk Management
Acer Incorporated 2008 Annual Report Acer Incorporated 2008 Annual Report120 121
Board of DirectorsChairman & Acer Group CEO
CEO & Corporate President
Auditors
Global Finance
Treasury
Finance
Legal Other Units
Risk Management
Accounting
8.1 Annual Investment Policy: Reasons of Gain or Loss and Improvement Plan
DescriptionItem
Amount (Note)
Business TypeYear 2008
P&LMain reason of Gain or Loss
The Plan for Improvement
Investment Plan for
Next Year
Acer Digital Service Co.
1,504,342Investing and holding company
429,672 Recognized Investment gain and Disposal gain for stock
Notapplicable
Notapplicable
Acer European Holdings N.V.
30,687,579
Sales and maintenance of "Acer" brand-name information technology products
7,593,643 Growth Stably in Europe
Acer Holdings International, Incorporated
6,012,549
Sales and maintenance of "Acer" brand-name information technology products
1,825,499 Growth Stably in Asia Pacific
Boardwalk Capital Holding Limited
22,281,994
Sales and maintenance of "Acer" brand-name information technology products
(1,578,360)Recognized the restructuring provision for Gateway
Acer Worldwide Incorporated
2,909,273Investing and holding company
(649,954)Recognized Debt forgiveness loss for ADSBH
E-TEN INFORMATION SYSTEMS CO., LTD.
7,458,457PDA manufacturing and sale
(220,193) Operating expenses
Cross Century Investment Limited
2,275,616Investing and holding company
414,855 Recognized Disposal Stock Gain
Acer CyberCenter Services Ltd.
1,788,607Data storage and processing company
72,464 Gain on operating activity
Wistron Corporation
1,665,372
Investing on industry of manufacturing computer and information technology products
434,187 Gain on operating activity
(Note) Disclose the amount excess the 5% of Acer Inc. Capital
8.2 Important Notices for Risk Management and EvaluationRisk Management Organization
‧ Board of directors – review and approve the risk management policy and the authority for decision‧ The head and top management of Business Units – oversee risk management activities with periodic monitoring
and evaluation‧ Auditors – provide annual auditing plan; review the Company’s internal execution and control of risk management‧ Legal – review legal contracts and agreements; manage lawsuit and litigation affairs‧ Treasury – manage financial hedging and deals‧ Accounting – oversee monetary transactions, ensure consistency with booking keeping and accuracy of financial
reporting

Acer Incorporated 2008 Annual Report Acer Incorporated 2008 Annual Report122 123
Risk Management
Acer Incorporated 2008 Annual Report Acer Incorporated 2008 Annual Report122 123
8.2.1 Impact of Interest Rate, Exchange Rate and Inflation on Company’s P&L and Future Strategy
Interest Rate Fluctuation
The current economic recession is not expected to end in the short term. The U.S. Federal Reserve Board will keep the federal fund rate between zero and 0.25% throughout 2009, along with quantitative easing (QE) measures to effectively stimulate economic growth.
Given the overall money-loosing situation and low risk of inflation, the Central Bank of the R.O.C. is expected to maintain the current benchmark policy rate of 1.25% till year end, supporting the Taiwan government efforts on boosting sagging domestic demand.
Low interest rates will reduce the cost of our loans. Acer is making short-term deposits in New Taiwan Dollar (NTD) or other foreign currencies to accrue yield and reduce risks.
Exchange Rate
At the Federal Open Market Committee (FOMC) on March 18, 2009, the Federal Reserve Board’s announcement of a move to an aggressive QE policy has driven the U.S. dollar substantially lower. In the short-term, the currencies of the QE countries, including the U.S., United Kingdom, and Japan, tend to weaken against the currencies of non-QE countries. For the long-run, however, even if QE economies recover, it does not necessarily follow that their currencies will. Acer will keep to a consistent strategy and aggressively hedge to reduce the impact on profit and loss resulting from currency fluctuation.
Inflation
Inflation risk is substantially reduced due to falling prices of crude oil and raw materials worldwide. Should the material price lead to an increase in cost, Acer shall act accordingly to avoid loss.
8.2.2 How Change Corporate Image Affects Company’s Risk Management Mechanism
The Company split off its manufacturing division at the end of year 2000 in order to focus on the design and marketing of IT products and services. The potential crises within manufacturing and marketing companies are very different, and the Company’s crisis management now focuses on our global supply-chain and logistics. By outsourcing our manufacturing sector to multiple vendors and suppliers, the Company gained greater flexibility in inventory control and lowered risks compared to a single-vendor policy. With the ever-changing global economy, it is essential to be prepared for risks and challenges at all times. The Company’s risk management team has a clear sense of crisis management and has taken the precautions where necessary. We have set up a crisis mechanism that will minimize potential damages to ensure the Company’s sustainable management.
8.2.3 Predicted Benefits and Potential Risk to Company with Factory/Office Expansion
Not applicable.
8.2.4 Potential Risks to Company from Procurement and Sales
None
8.2.5 Affect on Company from Shares Transfers by Directors, Supervisors or Shareholders Holding More Than 10% Shares
Not applicable.
8.2.6 Impact and Potential Risks to Company Management Team Change
Not applicable.
8.2.7 The major litigious, non-litigious or administrative disputes that: (1) involve Acer and/or any Acer director, any Acer supervisor, the general manager, any person with actual responsibility for the firm, any major shareholder holding a stake of greater than 10 percent, and/or any company or companies controlled by Acer; and (2) have been concluded by means of a final and unappealable judgment, or are still under litigation. Where such a dispute could materially affect shareholders’ equity or the prices of the company’s securities, the facts of the dispute, amount of money at stake in the dispute, the date of litigation commencement, the main parties to the dispute, and the status of the dispute as of the date of printing of this annual report shall be disclosed as follows:
1. Similar to other IT companies, Acer receives notices from third parties asserting that Acer has infringed certain patents or demands Acer obtain certain patents licenses. Acer takes these matters seriously and may take appropriate counter actions.
2. In year 2008 and as of the date of printing of this annual report, any Acer director, supervisor, the general manager, any person with actual responsibility for the firm, any major shareholder holding a stake of greater than 10% were not involved in any material litigious, non-litigious or administrative disputes.
3. In year 2008 and as of the date of printing of this annual report, any company or companies controlled by Acer were not involved in any material litigious, non-litigious or administrative disputes.
8.2.8 Other Risks:
None

Appendix
1. Name, Title and Contact Details of Company’s Spokespersons:
Principal Howard Chan CFO +886-2-2696-3131 [email protected]
Deputy Thomas Shin Director +886-2-2696-3131 [email protected]
2. Address and Telephone Numbers of Company’s Headquarter and Branches
Office Address TelAcer Inc. 7F, No.137, Sec.2, Chien Kuo N. Road, Taipei, Taiwan, R.O.C. +886-2-2509-2368
Registered Address 7F, No.137, Sec.2, Chien Kuo N. Road, Taipei, Taiwan +886-2-2509-2368
Acer Inc. 3-4F, 139 Min Tsu Road, Hsinchu, Taiwan, R.O.C. +886-3-533-9141
(Hsichih Office) 8F, 88, Sec.1, Hsin Tai Wu Road, Hsichih, Taipei Hsien, Taiwan +886-2-2696-1234
Acer Inc. 4F-2, 38, Shin Guang Road, Kaohsiung, Taiwan, R.O.C. +886-7-338-8386
(Hsinchu Branch) 3-4F, 139 Min Tsu Road, Hsinchu, Taiwan +886-3-533-9141
Acer Inc.(Taichung Branch) 3F, No.371, Sec.1, Wen-Hsin Road, Taichung, Taiwan +886-4-2250-3355
Acer Inc.(Kaohsiung Branch) 4F-2, 38, Shin Guang Road, Kaohsiung, Taiwan +886-7-338-8386
Acer Inc.(Shipping & Warehouse Management Center)
1F, 138, Nan-Gong Road, Lu Chu Tsuan, Lu Chu, Taoyuan Hsiang, Taiwan
+886-3-322-2421
3. Address and Contact Details of Acer Shareholders’ Services
Address: 7F, No.137, Sec.2, Chien Kuo N. Road, Taipei, Taiwan
Tel: +886-2-2509-2368
e-mail: [email protected]
4. Address and Contact Details of Auditing CPAs in the Most Recent Year
Name: Sonia Chang and Agnes Yang at KPMG
Address: 68F, Taipei, 101 Tower, No.7, Sec.5, Xinyi Road, Taipei, 11049, Taiwan
Tel: +886-2-8101-6666
e-mail: www.kpmg.com.tw
5. Listed Market for GDRs: London Stock Exchange MarketFor further information, please refer to Website: www.Londonstockexchange.com
6. Acer’s Website: www.acer-group.com

Acer Group