
ACE Monitoring · The Fastpath function is where the bulk of the low level data handling occurs...
32
Technical Overview © 2011 Cisco Systems, Inc. All rights reserved. This document is Cisco Public Information. Page 1 of 32 ACE Monitoring Architecture The Cisco ACE Module is based on a purpose built multi-network processor architecture. All data received from the 16Gbps single interconnect to the switching fabric hits a Field Programmable Field Array (FPGA), which is known as the Classification and Distribution Engine (CDE). The CDE uses hashing algorithms to ensure a single connection traverses the same Network Processor (NP) for the duration of the connection. The NP’s used in the Cisco ACE Module are Four Intel Octeons (CN5860), each Octeon has 16 Cores and runs at 600 Mhz. The 4 NP’s make up the data plane (DP) and are responsible for handling all of the connection processing within the Cisco ACE Module. The control plane (CP) is maintained separately using a dedicated Sibyte processor. The control plane is responsible for managing the ACE configuration, health monitoring (aka probes), supporting management sessions (TELNET, SSH, SNMP, SYSLOG), and other control functions and control traffic. For additional details regarding the Cisco ACE Module architecture or connection processing, please ask your Cisco sales representative for a copy of the “Connection Handling Within The Cisco Ace Module Hardware Architecture” document. The following diagram illustrates the main components of the Cisco ACE Module: The handling of data traffic is done by each NP with 15 cores, each running a set of data plane software processes, the 16 th core is used for management and runs periodic processes (timers). The data plane processes are grouped in the functional sets as follows: ● Receive (RX) The Receive function is a dedicated process function used that takes traffic from the CDE
-
Upload
trankhuong -
Category
Documents
-
view
215 -
download
2
Transcript of ACE Monitoring · The Fastpath function is where the bulk of the low level data handling occurs...

Technical Overview
© 2011 Cisco Systems, Inc. All rights reserved. This document is Cisco Public Information. Page 1 of 32
ACE Monitoring Architecture The Cisco ACE Module is based on a purpose built multi-network processor architecture. All data received from the 16Gbps single interconnect to the switching fabric hits a Field Programmable Field Array (FPGA), which is known as the Classification and Distribution Engine (CDE). The CDE uses hashing algorithms to ensure a single connection traverses the same Network Processor (NP) for the duration of the connection. The NP’s used in the Cisco ACE Module are Four Intel Octeons (CN5860), each Octeon has 16 Cores and runs at 600 Mhz. The 4 NP’s make up the data plane (DP) and are responsible for handling all of the connection processing within the Cisco ACE Module. The control plane (CP) is maintained separately using a dedicated Sibyte processor. The control plane is responsible for managing the ACE configuration, health monitoring (aka probes), supporting management sessions (TELNET, SSH, SNMP, SYSLOG), and other control functions and control traffic. For additional details regarding the Cisco ACE Module architecture or connection processing, please ask your Cisco sales representative for a copy of the “Connection Handling Within The Cisco Ace Module Hardware Architecture” document.
The following diagram illustrates the main components of the Cisco ACE Module:
The handling of data traffic is done by each NP with 15 cores, each running a set of data plane software processes, the 16th core is used for management and runs periodic processes (timers). The data plane processes are grouped in the functional sets as follows:
● Receive (RX) The Receive function is a dedicated process function used that takes traffic from the CDE

Technical Overview
© 2011 Cisco Systems, Inc. All rights reserved. This document is Cisco Public Information. Page 2 of 3
and buffers it within the NP to be used by the other NP processes. RX also provides support for HTTP Normalization, Conformance to RFC 2616, MIME type validation, Length and Encoding checks, Port Misuse, Tunneling prevention, and so forth.
● Fastpath The Fastpath function is where the bulk of the low level data handling occurs such as MAC rewrite, NAT, TCP normalization, and so forth. Fastpath also performs NAT on the packet: depending on the configuration this includes MAC’s, IPs, L4 ports, TCP SEQ and ACK numbers.
● TCP
Sending/Receiving TCP data from other NP functions when processing data at Layer 7 while the connection is fully proxied.
● HTTP/L7/Fixup
This function provides support for HTTP and other Layer 7 application processing (fixups) such as: Header Matching, Rewriting, Cookie processing, persistent & pipelined connection support. For application fixups, it replaces IP addresses embedded within the application protocol data with the appropriate virtual IP address, server IP address, or client IP address and binds control and application channels together to ensure proper processing by the NP’s and real servers.
● SSL
Performs SSL Record Layer processing inline with a hardware co-processor.
● CCM (Connection Close Manager) Removes the internal connection objects for an established connection upon receiving a TCP FIN sequence, receiving a TCP RST, or the connection timing out.
● LB (Load Balancing) Facilitates microengine to general processor communication and messaging. Allows for microengine functions to access general processor functions such as: load balancing, ssl state machine, FTP and RTSP fixups, HA heartbeats, and so forth.
● Reassembly Manages reassembly of fragmented packets and TCP/IP timer control during connection handling.
● Inbound Connection Manager (ICM)
This processor is responsible for the creation of new connections. If the connection is to be load balance at Layer 3 or Layer 4 the ICM will facilitate the communication with the Xscale to select a real server for the connection destination. If the connection is Layer 7 then it will be passed on to the TCP NPU functions. Many counters on this processor are relevant to identify which kind of traffic is flowing through the system and how many connections are created, destroyed, timed-out, etc…
● Outbound Connection Manager (OCM) Establishes the connection to the destination for the client connections. The OCM is also used in TCP Re-use, the creation of syslogs for established connections, and NAT pool source address and source port selection.
● The timers process runs on a dedicated core (core #0) on each NP and handles all NP specific timers.

Technical Overview
© 2011 Cisco Systems, Inc. All rights reserved. This document is Cisco Public Information. Page 3 of 3
Monitoring NP’s A good indication of the load of the network processor cores in terms of packets and connections processing is provided with the following command:
ACE/Admin# show np 1 me-stats -up 0 proxies open. ME % Utilization Statistics -------------- Core 0: 3 Core 1: 0 Core 2: 0 Core 3: 0 Core 4: 0 Core 5: 0 Core 6: 0 Core 7: 0 Core 8: 0 Core 9: 0 Core 10: 0 Core 11: 0 Core 12: 0 Core 13: 0 Core 14: 0 Core 15: 0 ACE/Admin# show np 2 me-stats -up 0 proxies open. ME % Utilization Statistics -------------- Core 0: 0 Core 1: 0 Core 2: 0 Core 3: 0 Core 4: 0 Core 5: 0 Core 6: 0 Core 7: 0 Core 8: 0 Core 9: 0 Core 10: 0 Core 11: 0 Core 12: 0 Core 13: 0 Core 14: 0 Core 15: 0 ACE/Admin# show np 3 me-stats -up 0 proxies open. ME % Utilization Statistics -------------- Core 0: 0 Core 1: 0 Core 2: 0 Core 3: 0 Core 4: 0 Core 5: 0 Core 6: 0 Core 7: 0 Core 8: 0 Core 9: 0 Core 10: 0 Core 11: 0 Core 12: 0 Core 13: 0 Core 14: 0 Core 15: 0

Technical Overview
© 2011 Cisco Systems, Inc. All rights reserved. This document is Cisco Public Information. Page 4 of 3
ACE/Admin# show np 4 me-stats -up 0 proxies open. ME % Utilization Statistics -------------- Core 0: 0 Core 1: 0 Core 2: 0 Core 3: 0 Core 4: 0 Core 5: 0 Core 6: 0 Core 7: 0 Core 8: 0 Core 9: 0 Core 10: 0 Core 11: 0 Core 12: 0 Core 13: 0 Core 14: 0 Core 15: 0
Note: All “show np …” commands must be executed for each of the network processors (1, 2, 3, and 4) and combined to obtain the total result.
The Network Processor cores operate safely at any percentage of utilization. NP cores approaching 100% is an indication that the traffic load is stressing its limit. Any core that reaches 100% utilization can cause back-pressure and may lead to dropped packets or in the worse case dropped connections.
Monitoring Backpressure Back-pressure occurs if a bottle neck develops as traffic performance is increased. Back-pressure is the mechanism used to slow the system down if queues start to fill up internally as a result of a micro engine reaching its peak utilization. This can occur when the incoming traffic exceeds the Cisco ACE Module’s capacity. As back-pressure builds, FIFOs for the CDE, IXPs, and Nitrox, and internal queues for each ME can be filled. A sustained period of time where the Cisco ACE Module is running at to above capacity can lead to overflows and dropped packets. Once at capacity new packets are dropped, not necessarily entire connections. However, If the overflows continue, eventually it can lead to connections being dropped by the clients and servers.
● To monitor the CDE queues use the show cde health command and ensure the “Fifo Full drop count “ is not incrementing. ACE/Admin# show cde health | include Fifo Fifo Full drop count 0
● To monitor the Fastpath processor function queues use the show np <1|2|3|4> me-stats “-s fp” command and ensure the “FastQ Transmit Backpressure”, “SlowQ Transmit Backpressure”, “Drop: Transmit Backpressure”, “Drop: Next-Hop queue full” are not incrementing. ACE/Admin# show np 1 me-stats "-s fp" | include Backpressure FastQ Transmit Backpressure: 0 SlowQ Transmit Backpressure: 0 Drop: Transmit Backpressure: 0 ACE/Admin# show np 1 me-stats "-s fp" | include queue Drop: Next-Hop queue full: 0
Note: If no output is seen with the command above, use the command “show np 1 me-stats “-s fp –v”, to include the counters with zero values, as these are not displayed by default.

Technical Overview
© 2011 Cisco Systems, Inc. All rights reserved. This document is Cisco Public Information. Page 5 of 3
● To monitor the TCP processor function queues use the show np <1|2|3|4> me-stats “-s tcp” and ensure the “Drops due to FastTX queue full”, “Drops due to Fastpath queue full”, “Drops due to HTTP queue full”, “Drops due to SSL queue full”, “Drops due to AI queue full “, and “Drops due to Fixup queue full “ are not incrementing. If TCP receives backpressure, it can: drop packets, fail to ACK packets, and fail to propely track the next packet in the TCP connection. ACE/Admin# show np 1 me-stats "-s tcp" | include queue Drop reproxy msg queue full: 0 Drops due to FastTX queue full: 0 Drops due to Fastpath queue full: 0 Drops due to HTTP queue full: 0 Drops due to SSL queue full: 0 Drops due to AI queue full: 0 Drops due to Fixup queue full: 0
Note: “Drop reproxy msg queue full “ will increment based on the incoming connections when the reproxy msg queue is full. Ideally, it shouldn’t increment. When it increments, clients will receive connection reset.
Monitor the control plane The control processor processes all control traffic (ARP, HSRP, ICMP to VIP’s, Routing, SYSLOGS, SNMP, Probes, and so forth), and handles configuration management to parse the CLI for syntactical error and enforce configuration dependencies/requirements before pushing the configuration to the data plane.
A 3 way moving average of the Control Plane processor utilization can be obtained using the show command:
ACE/Admin# show processes cpu | inc util CPU utilization for five seconds: 81%; one minute: 15%; five minutes: 10% 0001-sfdi-ace-a/Admin# sho processes cpu | inc utiliz CPU utilization for five seconds: 23%; one minute: 24%; five minutes: 24%
The update interval for the CP CPU utilization is fixed at five seconds. Thus there is no benefit in tracking the interval time itself with SNMP, however the OID is provided below for completeness. The other intervals are displays averaged over their duration. Since the updates occur at five second intervals it there is little advantage of polling these OIDs more frequently. An increase in CPU utilization, over time can be clearly tracked using the average over a five minute interval. This provides general trending and mitigates short lived CP CPU spikes.
[root@mgmt mibs]# snmpget -v 2c -M . -m ALL -c cisco 172.25.91.20 .1.3.6.1.4.1.9.9.109.1.1.1.1.9.1 2> /dev/null CISCO-PROCESS-MIB::cpmCPUMonInterval.1 = Gauge32: 5 seconds [root@mgmt mibs]# snmpget -v 2c -M . -m ALL -c cisco 172.25.91.20 .1.3.6.1.4.1.9.9.109.1.1.1.1.10.1 2> /dev/null CISCO-PROCESS-MIB::cpmCPUTotalMonIntervalValue.1 = Gauge32: 81 percent [root@mgmt mibs]# snmpget -v 2c -M . -m ALL -c cisco 172.25.91.20 .1.3.6.1.4.1.9.9.109.1.1.1.1.7.1 2> /dev/null CISCO-PROCESS-MIB::cpmCPUTotal1minRev.1 = Gauge32:15 percent [root@mgmt mibs]# snmpget -v 2c -M . -m ALL -c cisco 172.25.91.20 .1.3.6.1.4.1.9.9.109.1.1.1.1.8.1 2> /dev/null CISCO-PROCESS-MIB::cpmCPUTotal5minRev.1 = Gauge32:10 percent ACE/Admin# show version | inc free total: 956492 kB, free: 288268 kB

Technical Overview
© 2011 Cisco Systems, Inc. All rights reserved. This document is Cisco Public Information. Page 6 of 3
Relevant Metrics Different traffic patterns and configurations can stress different portions of the system, and require different resources in the NPUs within the module. For this reason, there is no single metric or CPU utilization that can indicate the overall load on the system, but there are critical metrics that can be monitored to see if the current traffic pattern is approaching some bottlenecks.
The following sections describe the main metrics characterizing the load of the system and show how to check the relevant counters.
● Concurrent Connections – The number of simultaneous connections a device can support is a function of available memory. If the number of concurrent connections reaches the supported limit, no new connections can be established until existing connections are freed.
● Interconnects and Bandwidth – The bandwidth a device supports is based on the devices interconnection links into the network and the amount of time it takes to process application traffic. Exceeding the bandwidth can lead to packet loss at the interlinks or within the device itself.
● Connections per second (CPS) – Measures the number of new client connections to an application within a second. A connection setup can be a simple TCP three-way handshake with an immediate TCP reset, or more involved, such as SSL where TCP is setup, SSL is terminated, and a HTTP Request is processed before properly closing the SSL session and TCP connection. Although supported CPS typically vary between application types, exceeding the limit will result in new connection attempts being rejected
● Resource usage
1. Concurren t Connections (CC)
The Cisco ACE Module has allocated data plane memory to guarantee concurrent connection support for basic Layer 4 connections (such as TCP, UDP, IPSec), Layer 7 connections (proxied flows, typically for application aware load balancing or inspection, and SSL connection when using SSL acceleration. The Cisco ACE Module can support the maximum bi-directional concurrent connection limit regardless of the features enabled.
Table 1. Concurrent connection support
Conne ction Type Cis co ACE Module Limit
Layer 4 ◦ 4 Million
Layer 7 ◦ 512 Thousand
The state for both directions (client-to-VIP/ACE and server-to-ACE) of a TCP connection is maintained via distinct connection objects. The following is an example of the current connection table.
ACE/Admin# show conn total current connections : 6 conn-id np dir proto vlan source destination state ----------+--+---+-----+----+---------------------+---------------------+------+ 6 1 in TCP 110 10.82.217.52:1566 172.25.91.20:23 ESTAB 7 1 out TCP 110 172.25.91.20:23 10.82.217.52:1566 ESTAB

Technical Overview
© 2011 Cisco Systems, Inc. All rights reserved. This document is Cisco Public Information. Page 7 of 3
1 1 in TCP 222 209.165.201.22:2225 172.16.1.100:80 ESTAB 2 1 out TCP 422 192.168.1.20:80 209.165.201.22:2225 ESTAB 9 2 in TCP 222 209.165.201.22:2256 172.16.1.100:80 ESTAB 10 2 out TCP 422 192.168.1.30:80 209.165.201.22:2256 ESTAB
Note: The detail parameter can be added to provide, the connection idle time, the elapsed time of the connection, byte count, and packet count for each connection object.
In this example, a connection has been opened from client 209.165.201.22, which connected to VIP 172.16.1.100 on port 80, see blue highlight. The connection was received from VLAN 222 and sent out to VLAN 422, to server 192.168.1.20, without rewriting the source IP address of the client, see green highlight. The second line of the output (green highlight) indicates source and destination IPs and L4ports of the return
The total number of concurrent connections per context is maintained in the show stats counters and in SNMP OIDs:
traffic (server-to-client). This is why the client IP address now appears under the “destination” column.
ACE/Admin# show stats connection +------------------------------------------+ +------- Connection statistics ------------+ +------------------------------------------+ Total Connections Created : 118 Total Connections Current : 6 Total Connections Destroyed: 96 Total Connections Timed-out: 20 Total Connections Failed : 0 [root@mgmt mibs]# snmpget -v 2c -M . -m ALL -c cisco 172.25.91.20 .1.3.6.1.4.1.9.9.254.1.1.1.1.3.3 2> /dev/null CISCO-SLB-EXT-MIB::cslbxStatsCurrConnections.3 = Gauge32: 6 connections
Note: The “Total Connections Current” counter counts the number of used connection object, not the number of TCP flows. The number of TCP flows can be roughly determined as half the connection object, minus any UDP connections.
Note: To see the total connections in the system use the command “show resource usage summary”.
Note: To see the number of active SSL connections on all 4 NP’s combined, use the command: “show stats crypto server termination | inc active”
The “Connection Current” counter is always up to date and the maximum can be 8,000,000. Due to the Cisco ACE Module’s architecture, with distinct paths for new and established connections, the number of existing concurrent connections does not heavily impact the rate at which new connections can be set up. Nevertheless, a very large amount of concurrent connections will eventually affect the performance of the system in setting up new connections.

Technical Overview
© 2011 Cisco Systems, Inc. All rights reserved. This document is Cisco Public Information. Page 8 of 3
The number of concurrent connections is relevant when load balancing protocols which maintain many low-bandwidth and long-lived connections, such as TELNET, TN3270, and Terminal Services sessions.
TCP connections that are properly terminated via RST or FIN/FIN_ACK/ACK are immediately removed (Destroyed) from the concurrent connection table. If a TCP connection closes without being properly terminated it will be torn down with the TCP idle timers expire.
When deploying VIPs for load balancing application using UDP, adjust the idle timeout, to expedite the removal of UDP connections from the concurrent connections table. The default timeout is 3600 seconds (one hour), which is typically appropriate for TCP connections, but is often longer than is required for UDP flows. Depending on the application requirement the idle timeout for the UDP flows can often be set their minimum value. In addition UDP Fast Ageing and UDP Boost have been added to further increase performance and optimize load balancing in the Cisco ACE Module release 2.0.
The number of connections removed from the connection table can be checked using the connection statistics. Connections removed in the nominal case where they are properly closed due to the TCP fin sequence or forcing a close using a TCP reset are tracked using the “Total Connections Destroyed” counter highlighted in blue. The connections which have been removed due to one of the three types of idle timers (SYN, half open, connection idle) expiring are seen with the “Total connections Timed-out” counter.
ACE/Admin# show stats connection +------------------------------------------+ +------- Connection statistics ------------+ +------------------------------------------+ Total Connections Created : 126 Total Connections Current : 2 Total Connections Destroyed: 96 Total Connections Timed-out: 28 Total Connections Failed : 0
Connections can be timed out because of one of the following reasons:
1. connection idle - one side of the connection (client to server or server to client) has not transmitted traffic for longer than the idle timeout configured for the virtual IP. Adjust using set timeout inactivity within the connection parameter-map
2. connection pending (embryonic) timeout – A TCP SYN has been sent to the selected server, and ACE is awaiting a SYN/ACK from the server so the TCP 3-way handshake can be completed. Adjust using set tcp timeout embryonic within the connection parameter-map
3. half closed – A TCP FIN has been sent to the selected server, and ACE is awaiting a FIN/ACK from the server so the TCP 3-way fin sequence can be completed. Adjust using set tcp timeout half-closed within the connection parameter-map
Note: The UDP protocol only uses the connection idle timer. Since UDP is a stateless protocol it does not have an initiation or closure handshake and thus does not require additional timeout checks.

Technical Overview
© 2011 Cisco Systems, Inc. All rights reserved. This document is Cisco Public Information. Page 9 of 3
When new connections reach the ACE and it has no more room for new connections in the connection table, it will reset the new connection and increment the “Drop [out of connections]:” counter:
ACE/Admin# show np 1 me-stats “–socm –vvv”| inc “of conn” Drop [out of connections]: 0
Note: Even when this counter increases, open connections are not affected.
2. In te rconnec ts and Ban dwid th
The Cisco ACE Module interconnects to the Cisco Catalyst 6500 switching backplane using a single switch fabric interface. The Cisco ACE Module has interconnects to the EOBC (100Mbps), Shared Bus (8Gbps), and Switch Fabric (20Gbps). The EOBC is used to allow the Cisco IOS Software session command access and to allow the Cisco ACE Module to boot from the Supervisor’s storage if needed. The Shared Bus interconnect is only used if communication to classic cards are required. The Cisco ACE Module uses a single interconnect to the switching fabric to provide a 20G connection, to support up to 16Gbps of throughput. In Cisco IOS Software today there are no interfaces of type "16G," so the TenGigabitEthernet type has been used to indicate that it is indeed a single connection, without any need for etherchannel (as in case of the Cisco CSM). Although some of the information on the show interface TenGigabitEthernet X/Y options have no meaning with respect to a services modules, the following command options provide useful information: capabilities, counters, status, switchport, and trunk.
Router# show int TenGigabitEthernet 3/1 status Port Name Status Vlan Duplex Speed Type Te3/1 connected trunk full 10G MultiService Module
Router# show int TenGigabitEthernet 3/1 counters Port InOctets InUcastPkts InMcastPkts InBcastPkts Te3/1 634859790 3554991 2014724 1887878 Port OutOctets OutUcastPkts OutMcastPkts OutBcastPkts Te3/1 56939210 306341 0 310695
Router#show counters interface tenGigabitEthernet 3/1 64 bit counters: 0. rxHCTotalPkts = 7457593 1. txHCTotalPkts = 617036 2. rxHCUnicastPkts = 3554991 3. txHCUnicastPkts = 306341 4. rxHCMulticastPkts = 2014724 5. txHCMulticastPkts = 0 6. rxHCBroadcastPkts = 1887878 7. txHCBroadcastPkts = 310695 8. rxHCOctets = 634859790 9. txHCOctets = 56939210 10. rxTxHCPkts64Octets = 0 11. rxTxHCPkts65to127Octets = 0 12. rxTxHCPkts128to255Octets = 0 13. rxTxHCPkts256to511Octets = 0 14. rxTxHCpkts512to1023Octets = 0 15. rxTxHCpkts1024to1518Octets = 0 16. txHCTrunkFrames = 0 17. rxHCTrunkFrames = 0 18. rxHCDropEvents = 0

Technical Overview
© 2011 Cisco Systems, Inc. All rights reserved. This document is Cisco Public Information. Page 10 of 3
32 bit counters: 0. rxCRCAlignErrors = 0 1. rxUndersizedPkts = 0 2. rxOversizedPkts = 0 3. rxFragmentPkts = 0 4. rxJabbers = 0 5. txCollisions = 0 6. ifInErrors = 0 7. ifOutErrors = 0 8. ifInDiscards = 0 9. ifInUnknownProtos = 0 10. ifOutDiscards = 0 11. txDelayExceededDiscards = 0 12. txCRC = 0 13. linkChange = 0 14. wrongEncapFrames = 0 All Port Counters 1. InPackets = 7457593 2. InOctets = 634859790 3. InUcastPkts = 3554991 4. InMcastPkts = 2014724 5. InBcastPkts = 1887878 6. OutPackets = 617036 7. OutOctets = 56939210 8. OutUcastPkts = 306341 9. OutMcastPkts = 0 10. OutBcastPkts = 310695 11. AlignErr = 0 12. FCSErr = 0 13. XmitErr = 0 14. RcvErr = 0 15. UnderSize = 0 16. SingleCol = 0 17. MultiCol = 0 18. LateCol = 0 19. ExcessiveCol = 0
The connection to the backplane is indeed 16G full-duplex, however consider that most traffic will traverse this connection twice. When estimating how much traffic can be sent across Cisco ACE, consider the following important factors:
1. While the connectivity between Cisco ACE and the backplane is FULL-DUPLEX, most packets have to traverse that connection TWICE (once from the input interface TO Cisco ACE, and once FROM Cisco ACE to the output interface). This means that a packet sent from a client to a server (or from a server to a client), which traverses Cisco ACE, will travel twice over that connection. For this reason, the absolute maximum 16Gbps bandwidth through Cisco ACE should account for both client-to-server traffic AND server-to-client traffic: their SUM cannot exceed 16Gbps. As an example, if there were a lab environment designed where server-to-client traffic represents 90%, and client-to-server represents 10%, the absolute maximum for client-to-server will be 1.6Gbps, while the max for server-to-client will be 14.4Gbps. If the lab environment is modified to observe and ideal case of completely symmetric case, the maximum would be 8Gbps in each direction.
Note: A more exact calculation should also consider traffic consumed or generated by Cisco ACE itself (keepalives, for example), but that traffic is typically a very small percentage, compared to client-to-server and server-to-client traffic.
2. The bandwidth can be limited at 4Gbps or 8Gbps (rather than 16Gbps), depending on the licenses installed in Cisco ACE

Technical Overview
© 2011 Cisco Systems, Inc. All rights reserved. This document is Cisco Public Information. Page 11 of 3
3. Exact bandwidth depends on type of traffic, in particular average size of packets. Check the other Cisco ACE scaling documents for more details on how 4 Cisco ACE Modules in the same chassis can scale to over 60Gbps
4.
Due to the PPS limitation, you might not always be able to send 16Gbps through the module. The amount which can be sent depends on the average packet size of the traffic. Lab performance tests indicate that an average packet size of 512bytes is enough to reach line-rate.
You can check how much traffic is currently being sent to and received from the Cisco ACE Module by showing the
Router#show int Po260 Port-channel260 is up, line protocol is up (connected) Hardware is EtherChannel, address is 0002.fce1.65cb (bia 0002.fce1.65cd) MTU 9216 bytes, BW 4000000 Kbit, DLY 10 usec, reliability 255/255, txload 1/255, rxload 1/255 Encapsulation ARPA, loopback not set Unknown duplex, Unknown Speed, link type is auto, media type is Gbic not connected output flow-control is unsupported, input flow-control is unsupported Members in this channel: Gi4/1 Gi4/2 Gi4/3 Gi4/4 ARP type: ARPA, ARP Timeout 04:00:00 Last input never, output never, output hang never Last clearing of "show interface" counters 1d01h Input queue: 0/2000/0/0 (size/max/drops/flushes); Total output drops: 0 Queueing strategy: fifo Output queue: 0/40 (size/max) 5 minute input rate 39000 bits/sec, 35 packets/sec 5 minute output rate 44000 bits/sec, 45 packets/sec 60775 packets input, 5904256 bytes, 0 no buffer Received 13499 broadcasts (0 multicast) 0 runts, 0 giants, 0 throttles 0 input errors, 0 CRC, 0 frame, 0 overrun, 0 ignored 0 watchdog, 0 multicast, 0 pause input 0 input packets with dribble condition detected 692465 packets output, 52851308 bytes, 0 underruns 0 output errors, 0 collisions, 0 interface resets 0 babbles, 0 late collision, 0 deferred 0 lost carrier, 0 no carrier, 0 PAUSE output 0 output buffer failures, 0 output buffers swapped out
The counters refers to the Catalyst 6500 perspective, so the input counters refer to traffic received from the ACE, while the output counters refer to traffic sent to the ACE
3. Connections per s econ d (CPS)
.
Connections per second is one of the hardest metrics to measure, since there is no hard limit. CPS performance heavily depends on configured features and traffic patterns.
The main factor that influences CPS performance is L4 vs. L7 processing. L4 performance is higher than L7 performance, since L4 balancing decisions are based on the first packet of each connection, while L7 balancing requires TCP termination, multi-packet buffering and parsing in order to make the balancing decision and set up a new connection.
You can check how many L4 and L7 connections have been set up by your Cisco ACE Module with the following command:
ACE/Admin# show stats loadbalance +------------------------------------------+ +------- Loadbalance statistics -----------+ +------------------------------------------+

Technical Overview
© 2011 Cisco Systems, Inc. All rights reserved. This document is Cisco Public Information. Page 12 of 3
Total version mismatch : 0 Total Layer4 decisions : 2714 Total Layer4 rejections : 476 Total Layer7 decisions : 1388667 Total Layer7 rejections : 2164 Total Layer4 LB policy misses : 0 Total Layer7 LB policy misses : 0 Total times rserver was unavailable : 22 Total ACL denied : 0
Note: In a steady state system, when no configurations are taking place, if some of these counters are incrementing continuously it should raise flag.
Device Monitoring
Device Availability The state of the module can be monitored with the following MIB.
MIB: ciscoEntityFRUControlMIB
Object: cefcModuleOperStatus OID: 1.3.6.1.4.1.9.9.117.1.2.1.1.2
Possible Return Values: 1:unknown 2:ok 3:disabled 14:outOfServiceEnvTemp 15:poweredDown
Fault Tolerance
The command show ft group detail provides information on the state of each module.
My State: Displays the state of the local ACE.
Peer State: Displays the state of the remote ACE.
A state of FSM_FT_STATE_ACTIVE lets you know the ACE module is the Active ACE.
A state of FSM_FT_STANDBY_HOT lets you know the ACE module is the Standby ACE, and that the configs are in sync.

Technical Overview
© 2011 Cisco Systems, Inc. All rights reserved. This document is Cisco Public Information. Page 13 of 3
Fault tolerance information can be monitored via the following MIB
MIB: CISCO-L4L7MODULE-REDUNDANCY-MIB
Object: ciscoL4L7moduleRedundancyMIB OID: 1.3.6.1.4.1.9.9.650
Description: This MIB provides details about the fault tolerant statistics available in the show ft peer, show ft group detail and show ft stats command output.
XML: Config Backup The running-configuration can be monitored via the XML agent
xml_cmd=<request_raw>show running-config</request_raw>
<response_xml>
<exec_command>
<command>
show running-config
</command>
<status code="100" text="XML_CMD_SUCCESS"/>
<xml_show_result>
Output removed for brevity
</xml_show_result>
</exec_command>
</response_xml>
Services Monitoring
Rserver When monitoring rserver indivdidually, the following MIBs will be used.
MIB: ciscoEnhancedSlbMIB Object: ciscoEnhancedSlbMIBNotifs
Technical Overview
© 2011 Cisco Systems, Inc. All rights reserved. This document is Cisco Public Information. Page 14 of 3
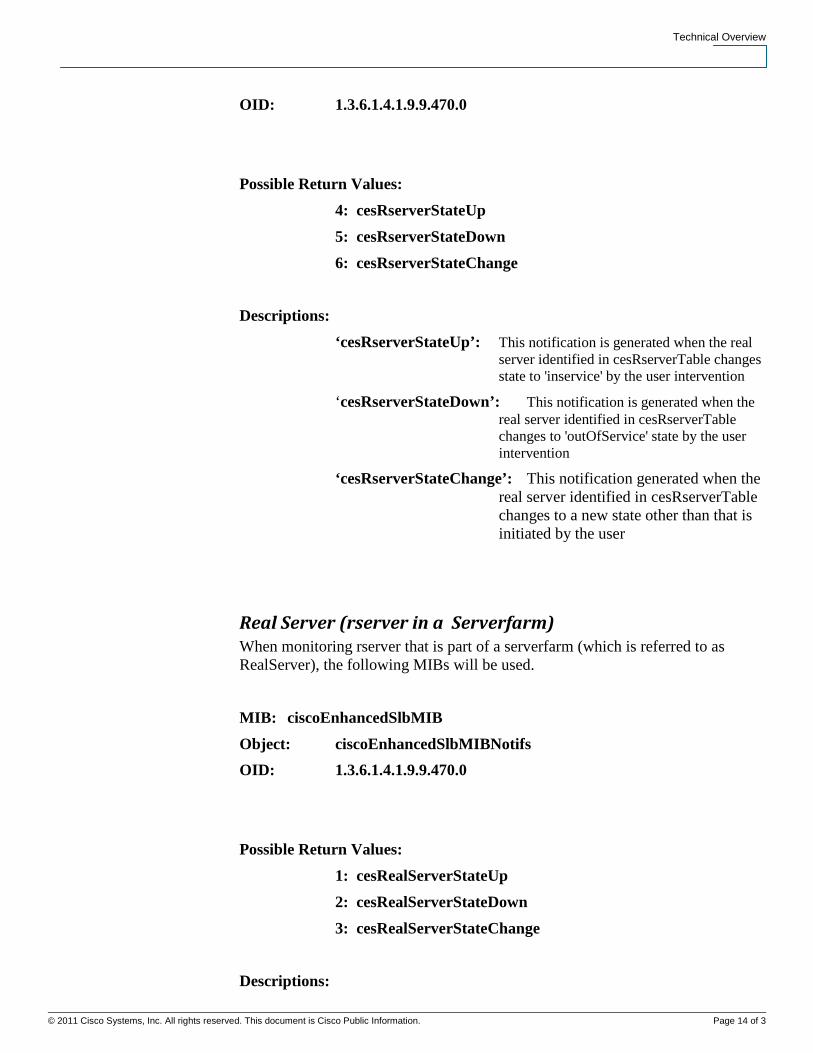
OID: 1.3.6.1.4.1.9.9.470.0
Possible Return Values: 4: cesRserverStateUp 5: cesRserverStateDown 6: cesRserverStateChange
Descriptions:
‘cesRserverStateUp’: This notification is generated when the real server identified in cesRserverTable changes state to 'inservice' by the user intervention
‘cesRserverStateDown’: This notification is generated when the real server identified in cesRserverTable changes to 'outOfService' state by the user intervention
‘cesRserverStateChange’: This notification generated when the real server identified in cesRserverTable changes to a new state other than that is initiated by the user
Real Server (rserver in a Serverfarm) When monitoring rserver that is part of a serverfarm (which is referred to as RealServer), the following MIBs will be used.
MIB: ciscoEnhancedSlbMIB Object: ciscoEnhancedSlbMIBNotifs OID: 1.3.6.1.4.1.9.9.470.0
Possible Return Values: 1: cesRealServerStateUp 2: cesRealServerStateDown 3: cesRealServerStateChange
Descriptions:

Technical Overview
© 2011 Cisco Systems, Inc. All rights reserved. This document is Cisco Public Information. Page 15 of 3
‘cesRealServerStateUp’: This notification is generated when a real server changes to 'inservice' state by the user intervention
‘cesRealServerStateDown’: This notification is generated when a real server changes to 'outOfService' state by the user intervention
‘cesRealServerStateChange’: This notification generated when a real server changes to a new state other than that is initiated by the user
Virtual Server
MIB: ciscoSlbMIB
Object: ciscoSlbMIBNotifications OID: 1.3.6.1.4.1.9.9.161.2.0
Possible Return Values: 5: ciscoSlbVServerStateChange 6: ciscoSlbVServerVIPStateChange
Descriptions:
‘ciscoSlbVServerStateChange’: This notification is sent when a virtual IP address (VIP) is removed from a class map. This notification is sent with the following var-binds:
•slbVServerState •slbVServerStateChangeDescr •slbVServerClassMap •slbVServerPolicyMap The ciscoSlbVServerStateChange is specified in the CISCO-SLB-MIB.

Technical Overview
© 2011 Cisco Systems, Inc. All rights reserved. This document is Cisco Public Information. Page 16 of 3
‘ciscoSlbVServerVIPStateChange’: The state of Vserver changes. This notification is sent with the following var-binds:
•slbVServerState •slbVServerStateChangeDescr •slbVServerClassMap •slbVServerPolicyMap •slbVServerIpAddressType •slbVServerIpAddress •slbVServerProtocol The change in the Vserver state could be due to a number of different reasons, such as binding to the interface, removing an active serverfarm from the policy, and associating the virtual IP address (VIP) with a class map. The ciscoSlbVServerVIPStateChange is specified in the CISCO-SLB-MIB.
XML: Show Serverfarm Serverfarms can be monitored via the XML agent. The output of this command can be parsed for glean useful information.
xml_cmd=<request_raw>show serverfarm SERVERFARM1</request_raw>
<response_xml>
<exec_command>
<command>
show serverfarm SERVERFARM1
</command>
<status code="100" text="XML_CMD_SUCCESS"/>
<xml_show_result>
serverfarm : SERVERFARM1, type: HOST
total rservers : 1
---------------------------------
----------connections-----------

Technical Overview
© 2011 Cisco Systems, Inc. All rights reserved. This document is Cisco Public Information. Page 17 of 3
real weight state current total failures
---+---------------------+------+------------+----------+----------+---------
rserver: SERVERFARM1
161.44.52.238:5060 8 OPERATIONAL 0 0 0
</xml_show_result>
</exec_command>
</response_xml>
xml_cmd=<request_raw>show serverfarm SERVERFARM1 detail</request_raw>
<response_xml>
<exec_command>
<command>
show serverfarm SERVERFARM1 detail
</command>
<status code="100" text="XML_CMD_SUCCESS"/>
<xml_show_result>
serverfarm : SERVERFARM1, type: HOST
total rservers : 1
active rservers: 1
description : -
state : ACTIVE
predictor : ROUNDROBIN
failaction : -
back-inservice : 0
partial-threshold : 0
num times failover : 0
num times back inservice : 0
total conn-dropcount : 0
---------------------------------
----------connections-----------
real weight state current total failures
---+---------------------+------+------------+----------+----------+---------
rserver: SERVERFARM1
161.44.52.238:5060 8 OPERATIONAL 0 0 0
max-conns : - , out-of-rotation count : -
min-conns : -
conn-rate-limit : - , out-of-rotation count : -
bandwidth-rate-limit : - , out-of-rotation count : -
retcode out-of-rotation count : -
</xml_show_result>
</exec_command>
</response_xml>
Technical Overview
© 2011 Cisco Systems, Inc. All rights reserved. This document is Cisco Public Information. Page 18 of 3
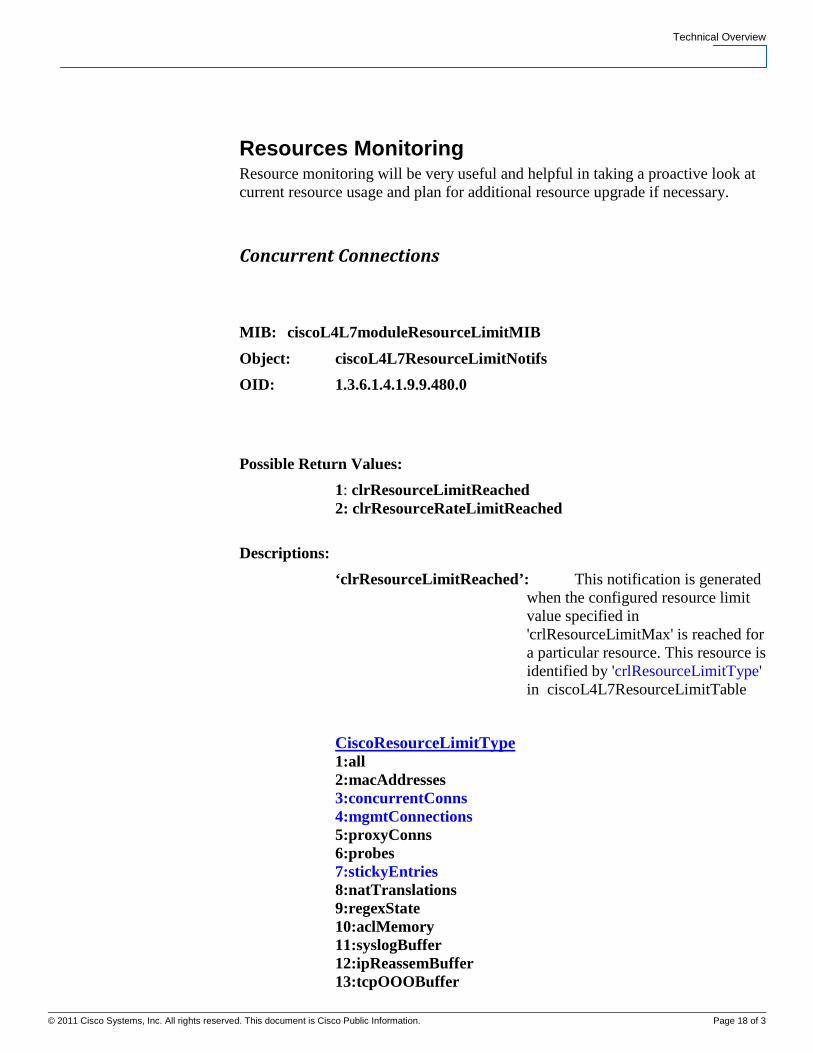
Resources Monitoring Resource monitoring will be very useful and helpful in taking a proactive look at current resource usage and plan for additional resource upgrade if necessary.
Concurrent Connections
MIB: ciscoL4L7moduleResourceLimitMIB Object: ciscoL4L7ResourceLimitNotifs OID: 1.3.6.1.4.1.9.9.480.0
Possible Return Values: 1: clrResourceLimitReached 2: clrResourceRateLimitReached
Descriptions: ‘clrResourceLimitReached’: This notification is generated
when the configured resource limit value specified in 'crlResourceLimitMax' is reached for a particular resource. This resource is identified by 'crlResourceLimitType' in ciscoL4L7ResourceLimitTable
CiscoResourceLimitType 1:all 2:macAddresses 3:concurrentConns 4:mgmtConnections 5:proxyConns 6:probes 7:stickyEntries 8:natTranslations 9:regexState 10:aclMemory 11:syslogBuffer 12:ipReassemBuffer 13:tcpOOOBuffer

Technical Overview
© 2011 Cisco Systems, Inc. All rights reserved. This document is Cisco Public Information. Page 19 of 3
14:sslConnections 15:hosts 16:ipsecSessions 17:asdmSessions 18:sshSessions 19:telnetSessions
Concurrent Connections non-SLB MIB: CISCO-SLB-EXT-MIB
The following MIB objects for the ACE include non-SLB related connections as well:
• cslbxStatsCurrConnections
• cslbxStatsTimedOutConnections
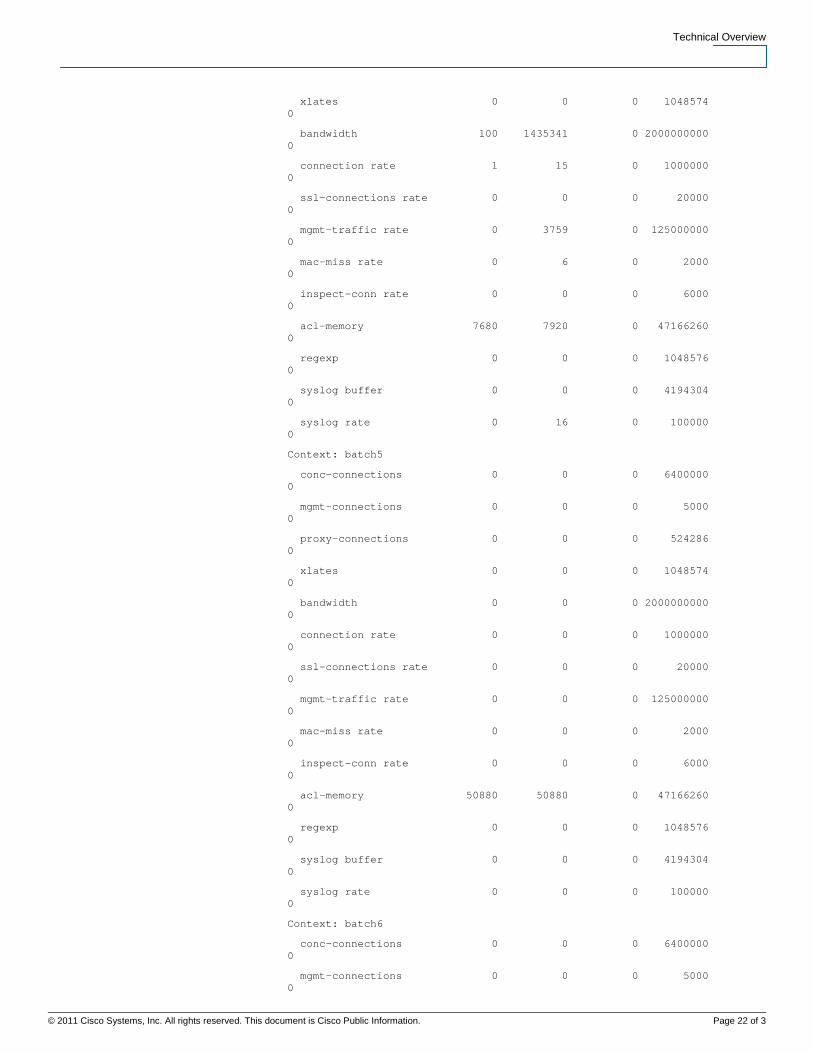
XML : Resource Usage Resource usage can be monitored via the XML agent. The output of this command can be parsed for glean useful information.
xml_cmd=<request_raw>show resource usage</request_raw>
<response_xml>
<exec_command>
<command>
show resource usage
</command>
<status code="100" text="XML_CMD_SUCCESS"/>
<xml_show_result>
Allocation
Resource Current Peak Min Max Denied
-----------------------------------------------------------------------------
Context: Admin
conc-connections 9 9 0 6400000 0
mgmt-connections 10 26 0 5000 0
proxy-connections 0 0 0 524286 0
xlates 0 0 0 1048574 0
bandwidth 636 79201 0 2000000000 410

Technical Overview
© 2011 Cisco Systems, Inc. All rights reserved. This document is Cisco Public Information. Page 20 of 3
connection rate 2 10 0 1000000 0
ssl-connections rate 0 0 0 20000 0
mgmt-traffic rate 198 32393 0 125000000 0
mac-miss rate 0 0 0 2000 0
inspect-conn rate 0 0 0 6000 0
acl-memory 14848 17504 0 47166260 0
regexp 0 0 0 1048576 0
syslog buffer 11264 11264 0 4194304 0
syslog rate 0 8 0 100000 0
Context: ACS-AMEX
conc-connections 0 0 0 6400000 0
mgmt-connections 0 0 0 5000 0
proxy-connections 0 0 0 524286 0
xlates 0 0 0 1048574 0
bandwidth 0 0 0 2000000000 0
connection rate 0 0 0 1000000 0
ssl-connections rate 0 0 0 20000 0
mgmt-traffic rate 0 0 0 125000000 0
mac-miss rate 0 0 0 2000 0
inspect-conn rate 0 0 0 6000 0
acl-memory 0 0 0 47166260 0
regexp 0 0 0 1048576 0
syslog buffer 0 0 0 4194304 0
syslog rate 0 0 0 100000 0
Context: ACS-TBO
conc-connections 0 0 0 6400000 0
mgmt-connections 0 0 0 5000 0
proxy-connections 0 0 0 524286 0
xlates 0 0 0 1048574 0

Technical Overview
© 2011 Cisco Systems, Inc. All rights reserved. This document is Cisco Public Information. Page 21 of 3
bandwidth 0 1104 0 2000000000 0
connection rate 0 12 0 1000000 0
ssl-connections rate 0 0 0 20000 0
mgmt-traffic rate 0 0 0 125000000 0
mac-miss rate 0 0 0 2000 0
inspect-conn rate 0 0 0 6000 0
acl-memory 2552 2616 0 47166260 0
regexp 0 0 0 1048576 0
syslog buffer 0 0 0 4194304 0
syslog rate 0 0 0 100000 0
Context: BAIKAL
conc-connections 0 10 0 6400000 0
mgmt-connections 0 12 0 5000 0
proxy-connections 0 8 0 524286 0
xlates 0 0 0 1048574 0
bandwidth 80 3044 0 2000000000 0
connection rate 1 13 0 1000000 0
ssl-connections rate 0 0 0 20000 0
mgmt-traffic rate 0 1142 0 125000000 0
mac-miss rate 0 7 0 2000 0
inspect-conn rate 0 0 0 6000 0
acl-memory 8240 8240 0 47166260 0
regexp 0 0 0 1048576 0
syslog buffer 0 0 0 4194304 0
syslog rate 0 0 0 100000 0
Context: Paul
conc-connections 0 28 0 6400000 0
mgmt-connections 2 10 0 5000 0
proxy-connections 0 5 0 524286 0
Technical Overview
© 2011 Cisco Systems, Inc. All rights reserved. This document is Cisco Public Information. Page 22 of 3
xlates 0 0 0 1048574 0
bandwidth 100 1435341 0 2000000000 0
connection rate 1 15 0 1000000 0
ssl-connections rate 0 0 0 20000 0
mgmt-traffic rate 0 3759 0 125000000 0
mac-miss rate 0 6 0 2000 0
inspect-conn rate 0 0 0 6000 0
acl-memory 7680 7920 0 47166260 0
regexp 0 0 0 1048576 0
syslog buffer 0 0 0 4194304 0
syslog rate 0 16 0 100000 0
Context: batch5
conc-connections 0 0 0 6400000 0
mgmt-connections 0 0 0 5000 0
proxy-connections 0 0 0 524286 0
xlates 0 0 0 1048574 0
bandwidth 0 0 0 2000000000 0
connection rate 0 0 0 1000000 0
ssl-connections rate 0 0 0 20000 0
mgmt-traffic rate 0 0 0 125000000 0
mac-miss rate 0 0 0 2000 0
inspect-conn rate 0 0 0 6000 0
acl-memory 50880 50880 0 47166260 0
regexp 0 0 0 1048576 0
syslog buffer 0 0 0 4194304 0
syslog rate 0 0 0 100000 0
Context: batch6
conc-connections 0 0 0 6400000 0
mgmt-connections 0 0 0 5000 0

Technical Overview
© 2011 Cisco Systems, Inc. All rights reserved. This document is Cisco Public Information. Page 23 of 3
proxy-connections 0 0 0 524286 0
xlates 0 0 0 1048574 0
bandwidth 0 0 0 2000000000 0
connection rate 0 0 0 1000000 0
ssl-connections rate 0 0 0 20000 0
mgmt-traffic rate 0 0 0 125000000 0
mac-miss rate 0 0 0 2000 0
inspect-conn rate 0 0 0 6000 0
acl-memory 134144 134144 0 47166260 0
regexp 0 0 0 1048576 0
syslog buffer 0 0 0 4194304 0
syslog rate 0 0 0 100000 0
Context: dcnteam
conc-connections 0 0 1600000 6400000 0
mgmt-connections 0 0 0 5000 0
proxy-connections 0 0 0 524286 0
xlates 0 0 0 1048574 0
bandwidth 0 0 0 2000000000 0
connection rate 0 0 0 1000000 0
ssl-connections rate 0 0 0 20000 0
mgmt-traffic rate 0 0 0 125000000 0
mac-miss rate 0 0 0 2000 0
inspect-conn rate 0 0 0 6000 0
acl-memory 1008 1008 31444174 0 0
regexp 0 0 0 1048576 0
syslog buffer 0 0 0 4194304 0
syslog rate 0 0 0 100000 0
Context: skinny
conc-connections 0 0 0 6400000 0

Technical Overview
© 2011 Cisco Systems, Inc. All rights reserved. This document is Cisco Public Information. Page 24 of 3
mgmt-connections 0 0 0 5000 0
proxy-connections 0 0 0 524286 0
xlates 0 0 0 1048574 0
bandwidth 0 0 0 2000000000 0
connection rate 0 0 0 1000000 0
ssl-connections rate 0 0 0 20000 0
mgmt-traffic rate 0 0 0 125000000 0
mac-miss rate 0 0 0 2000 0
inspect-conn rate 0 0 0 6000 0
acl-memory 0 0 0 47166260 0
regexp 0 0 0 1048576 0
syslog buffer 0 0 0 4194304 0
syslog rate 0 0 0 100000 0
Context: C2
conc-connections 0 4 0 6400000 0
mgmt-connections 0 0 0 5000 0
proxy-connections 0 4 0 524286 0
xlates 0 0 0 1048574 0
bandwidth 0 596 0 2000000000 0
connection rate 0 4 0 1000000 0
ssl-connections rate 0 2 0 20000 0
mgmt-traffic rate 0 0 0 125000000 0
mac-miss rate 0 0 0 2000 0
inspect-conn rate 0 0 0 6000 0
acl-memory 4528 4528 0 47166260 0
regexp 24 24 0 1048576 0
syslog buffer 0 0 0 4194304 0
syslog rate 0 0 0 100000 0
</xml_show_result>

Technical Overview
© 2011 Cisco Systems, Inc. All rights reserved. This document is Cisco Public Information. Page 25 of 3
</exec_command>
</response_xml>
TCL Script Examples: The following is an example TCL script that will connect to the ACE Admin context via the management interface, get a list of all contexts, and get running-configuration for each context and write that output to a file called <context>.cfg. This script uses HTTP. If you need secure transfer, you can use HTTPS instead. You will need to create a user with a role of Network-monitor to use for logging in via the XML interface.
Keep in mind that the management policy must allow either HTTP or HTTPS protocols:
class-map type management match-any remote-access
match protocol http any
match protocol https any
The Resource and SSL XML scripts do not actually do anything if an error condition occurs other than printing a message. You might want to add some code to fire off an email.
I. XML Script Example (show conn count) #!/usr/bin/tclsh
# Global login credentials
set user "username"
set pass "password"
# Global mgmt IP address of Admin context
set mgmt_ip "xx.xx.xx.xx"
# this procedure will execute a curl command to send the XML
# command to ACE. If the command fails to execute properly,
# the script will exit with and error.
# If the command executes with no problem, then the output
# of the XML command is returned
proc issue_command { cmd } {
global user pass mgmt_ip

Technical Overview
© 2011 Cisco Systems, Inc. All rights reserved. This document is Cisco Public Information. Page 26 of 3
if { [catch {set output [exec -- curl -s\
http://${user}:${pass}@${mgmt_ip}/bin/xml_agent\
-d "xml_cmd=<request_raw>${cmd}</request_raw>"] } error] } {
puts "Problem with exec: $error"
exit 0
}
return $output
}
# Get a list of contexts from Admin context
set contexts [split [issue_command "show context | inc Name"] \n]
foreach line $contexts {
if { [regexp {Name: (.*) ,} $line - context] } {
puts "Getting config for $context"
set out [issue_command "changeto $context\nshow conn count"]
if { [regexp {<xml_show_result>(.*)</xml_show_result>} $out - running_config]} {
set fp [open "${context}.cfg" w+]
puts $fp $running_config
close $fp
}
}
}
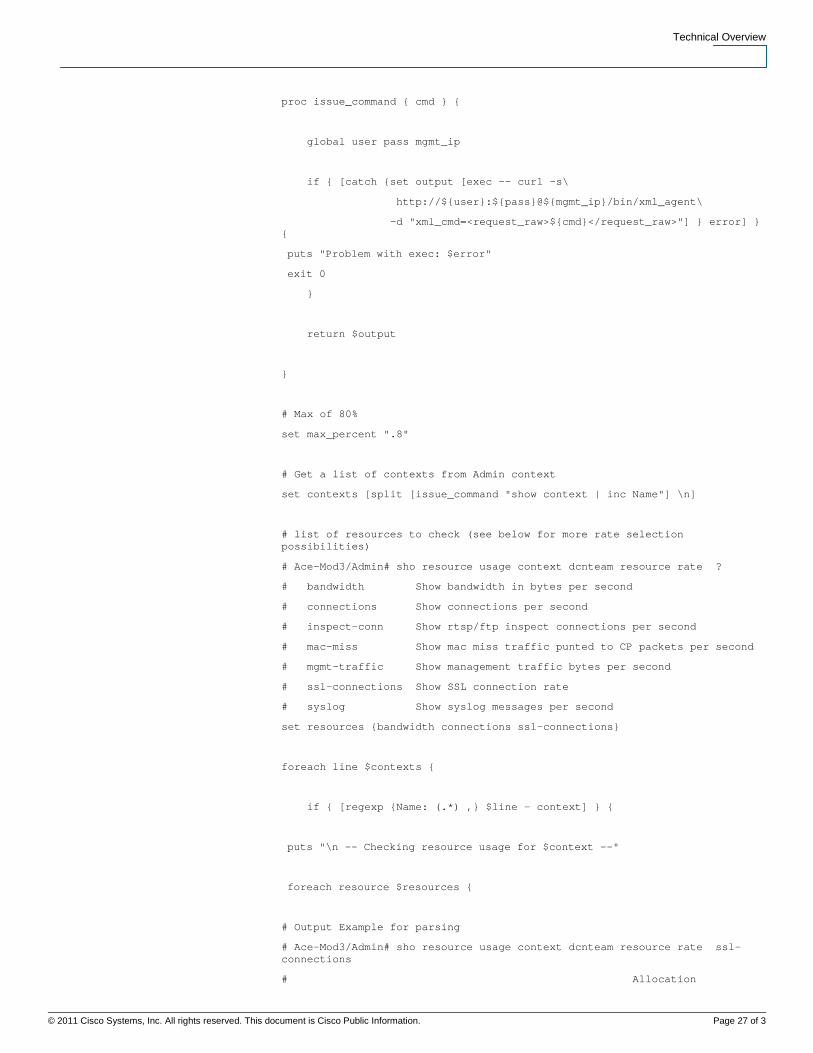
II. XML Script Example (resource usage) #!/usr/bin/tclsh
# Global login credentials
set user "username"
set pass "password"
# Global mgmt IP address of Admin context
set mgmt_ip "xx.xx.xx.xx"
# this procedure will execute a curl command to send the XML
# command to ACE. If the command fails to execute properly,
# the script will exit with and error.
# If the command executes with no problem, then the output
# of the XML command is returned
Technical Overview
© 2011 Cisco Systems, Inc. All rights reserved. This document is Cisco Public Information. Page 27 of 3
proc issue_command { cmd } {
global user pass mgmt_ip
if { [catch {set output [exec -- curl -s\
http://${user}:${pass}@${mgmt_ip}/bin/xml_agent\
-d "xml_cmd=<request_raw>${cmd}</request_raw>"] } error] } {
puts "Problem with exec: $error"
exit 0
}
return $output
}
# Max of 80%
set max_percent ".8"
# Get a list of contexts from Admin context
set contexts [split [issue_command "show context | inc Name"] \n]
# list of resources to check (see below for more rate selection possibilities)
# Ace-Mod3/Admin# sho resource usage context dcnteam resource rate ?
# bandwidth Show bandwidth in bytes per second
# connections Show connections per second
# inspect-conn Show rtsp/ftp inspect connections per second
# mac-miss Show mac miss traffic punted to CP packets per second
# mgmt-traffic Show management traffic bytes per second
# ssl-connections Show SSL connection rate
# syslog Show syslog messages per second
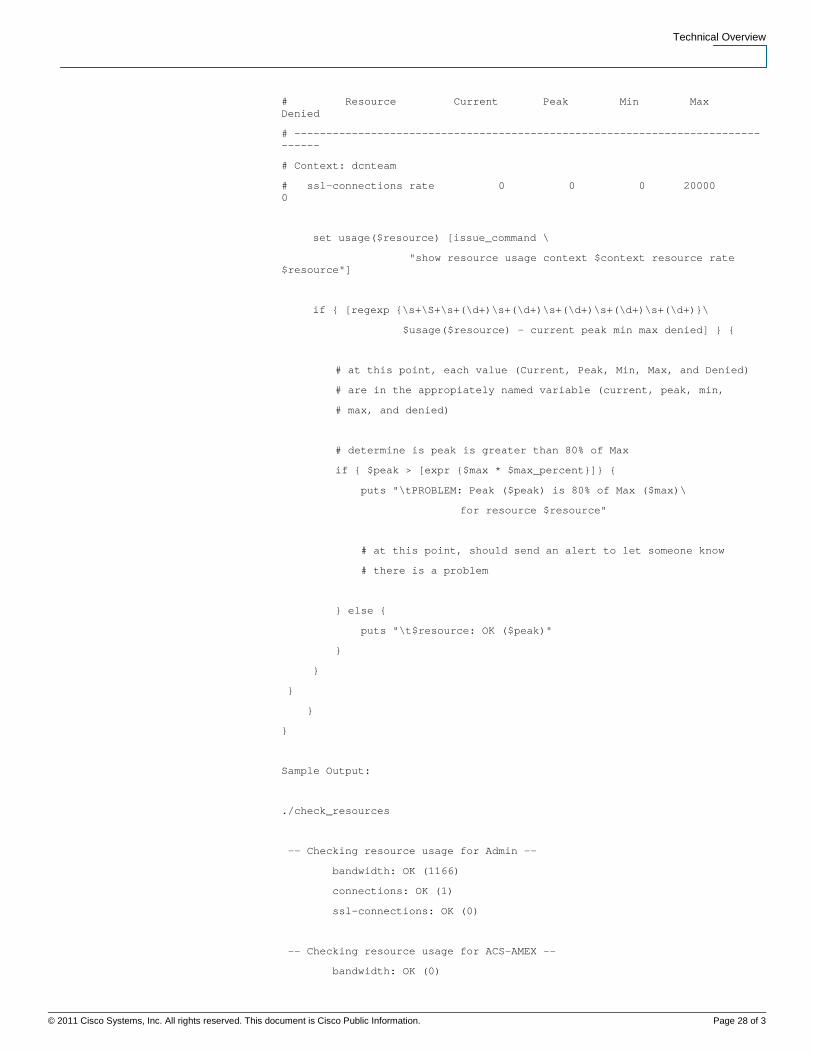
set resources {bandwidth connections ssl-connections}
foreach line $contexts {
if { [regexp {Name: (.*) ,} $line - context] } {
puts "\n -- Checking resource usage for $context --"
foreach resource $resources {
# Output Example for parsing
# Ace-Mod3/Admin# sho resource usage context dcnteam resource rate ssl-connections
# Allocation
Technical Overview
© 2011 Cisco Systems, Inc. All rights reserved. This document is Cisco Public Information. Page 28 of 3
# Resource Current Peak Min Max Denied
# -------------------------------------------------------------------------------
# Context: dcnteam
# ssl-connections rate 0 0 0 20000 0
set usage($resource) [issue_command \
"show resource usage context $context resource rate $resource"]
if { [regexp {\s+\S+\s+(\d+)\s+(\d+)\s+(\d+)\s+(\d+)\s+(\d+)}\
$usage($resource) - current peak min max denied] } {
# at this point, each value (Current, Peak, Min, Max, and Denied)
# are in the appropiately named variable (current, peak, min,
# max, and denied)
# determine is peak is greater than 80% of Max
if { $peak > [expr {$max * $max_percent}]} {
puts "\tPROBLEM: Peak ($peak) is 80% of Max ($max)\
for resource $resource"
# at this point, should send an alert to let someone know
# there is a problem
} else {
puts "\t$resource: OK ($peak)"
}
}
}
}
}
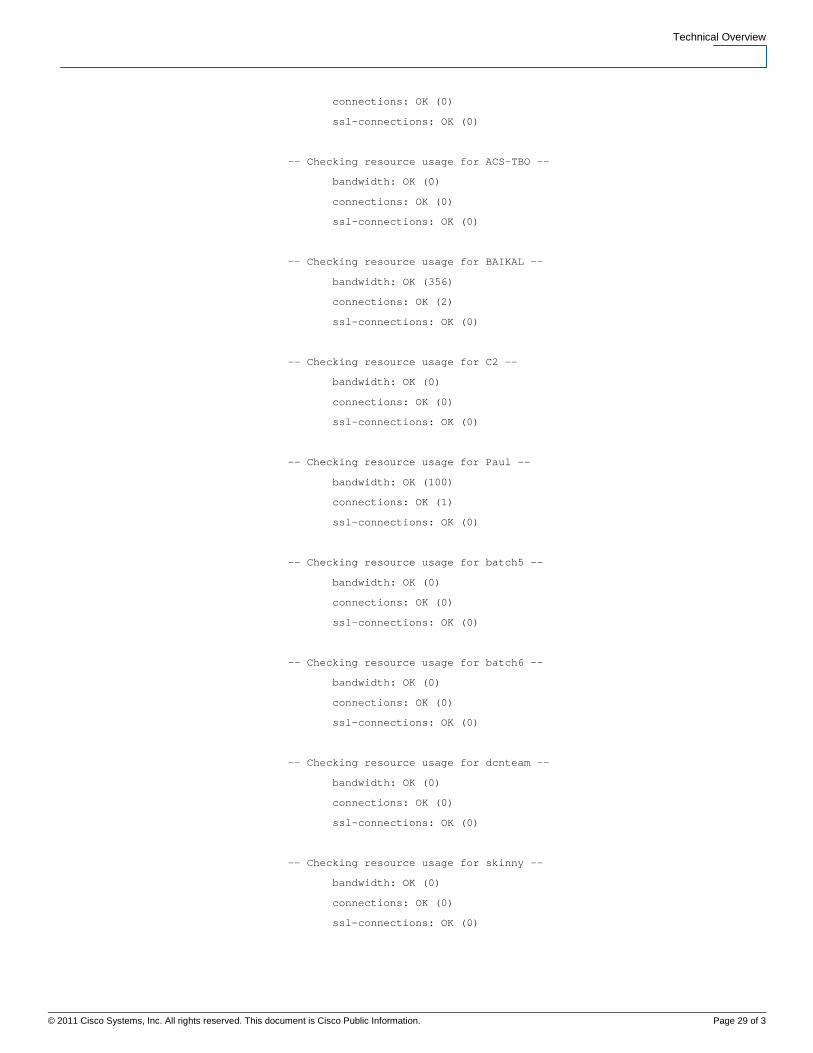
Sample Output:
./check_resources
-- Checking resource usage for Admin --
bandwidth: OK (1166)
connections: OK (1)
ssl-connections: OK (0)
-- Checking resource usage for ACS-AMEX --
bandwidth: OK (0)
Technical Overview
© 2011 Cisco Systems, Inc. All rights reserved. This document is Cisco Public Information. Page 29 of 3
connections: OK (0)
ssl-connections: OK (0)
-- Checking resource usage for ACS-TBO --
bandwidth: OK (0)
connections: OK (0)
ssl-connections: OK (0)
-- Checking resource usage for BAIKAL --
bandwidth: OK (356)
connections: OK (2)
ssl-connections: OK (0)
-- Checking resource usage for C2 --
bandwidth: OK (0)
connections: OK (0)
ssl-connections: OK (0)
-- Checking resource usage for Paul --
bandwidth: OK (100)
connections: OK (1)
ssl-connections: OK (0)
-- Checking resource usage for batch5 --
bandwidth: OK (0)
connections: OK (0)
ssl-connections: OK (0)
-- Checking resource usage for batch6 --
bandwidth: OK (0)
connections: OK (0)
ssl-connections: OK (0)
-- Checking resource usage for dcnteam --
bandwidth: OK (0)
connections: OK (0)
ssl-connections: OK (0)
-- Checking resource usage for skinny --
bandwidth: OK (0)
connections: OK (0)
ssl-connections: OK (0)

Technical Overview
© 2011 Cisco Systems, Inc. All rights reserved. This document is Cisco Public Information. Page 30 of 3
III. XML Script Example (SSL Certificate expiration) #!/usr/bin/tclsh
# Global login credentials
set user "username"
set pass "password"
# Global mgmt IP address of Admin context
set mgmt_ip "xx.xx.xx.xx"
#
# this procedure will execute a curl command to send the XML
# command to ACE. If the command fails to execute properly,
# the script will exit with and error.
# If the command executes with no problem, then the output
# of the XML command is returned
proc issue_command { cmd } {
global user pass mgmt_ip
if { [catch {set output [exec -- curl -s\
http://${user}:${pass}@${mgmt_ip}/bin/xml_agent\
-d "xml_cmd=<request_raw>${cmd}</request_raw>"] } error] } {
puts "Problem with exec: $error"
exit 0
}
return $output
}
set current_date [clock seconds]
# Get a list of contexts from Admin context
set contexts [split [issue_command "show context | inc Name"] \n]
foreach line $contexts {
if { [regexp {Name: (.*) ,} $line - context] } {
# output example
# Ace-Mod3/Paul# sho crypto files | inc CERT
# test-cert.pem 787 PEM Yes CERT
set crypto_out [issue_command\

Technical Overview
© 2011 Cisco Systems, Inc. All rights reserved. This document is Cisco Public Information. Page 31 of 3
"changeto ${context}\nshow crypto files | inc CERT"]
foreach elem [split $crypto_out \n] {
if { [regexp {(\S+)\s+\d+\s+\S+\s+\S+\s+CERT} $elem - cert] } {
set cert_out [issue_command\
"changeto ${context}\nshow crypto certificate ${cert} | inc After"]
if { [regexp {Not After :\s+(.* GMT)} $cert_out - cert_date] } {
# check if certificate After date is less than today's date
if { [clock scan $cert_date] < $current_date} {
puts "Context: $context - $cert is expired ($cert_date)"
# should send an alert!!
} else {
puts "Context: $context - $cert is NOT expired ($cert_date)"
# get certificate After date minus 90 days
set cert_90_date [clock scan "-90 day" -base\
[clock scan $cert_date]]
# check if certificate After date expires within next 90 days
if { $cert_90_date < $current_date} {
puts "Content: $context - $cert will expire within 90 days\
($cert_date)"
# should send an alert!!
}
}
}
}
}
}
}
Sample Output:
./check_certificates
Context: Admin - testcer.pem is expired (May 24 23:59:59 2007 GMT)
Context: Paul - test-cert.pem is NOT expired (May 28 22:18:36 2008 GMT)

Technical Overview
© 2011 Cisco Systems, Inc. All rights reserved. This document is Cisco Public Information. Page 32 of 3
Content: Paul - test-cert.pem will NOT expire within 90 days (May 28 22:18:36 2008 GMT)
Printed in USA January 2011


![Untitled-1 [housewares.blob.core.windows.net] · Joint Bucket With & Without Cover PC Bucket With & Without Cover ... Bottle Opener v Wine Bottle Opener Bar Tray Bottle O ener Bottle](https://static.fdocuments.net/doc/165x107/5f23f7ea2c1cae654f25efdf/untitled-1-joint-bucket-with-without-cover-pc-bucket-with-without.jpg)